Article

Performance of Micropollutant Removal during Wet-Weather Conditions in Advanced Treatment Stages on a Full-Scale WWTP

by
Johanna Neef
1,2,*,
Dominik Leverenz
2 and
Marie Alexandra Launay
1,2
1
Micropollutants Competence Centre Baden-Württemberg, Bandtäle 2, 70569 Stuttgart, Germany
2
Institute for Sanitary Engineering, Water Quality and Solid Waste Management (ISWA), University of Stuttgart, Bandtäle 2, 70569 Stuttgart, Germany
*
Author to whom correspondence should be addressed.
Water 2022, 14(20), 3281; https://doi.org/10.3390/w14203281
Submission received: 16 September 2022 / Revised: 4 October 2022 / Accepted: 11 October 2022 / Published: 18 October 2022
(This article belongs to the Special Issue Research on Micropollutants in Urban Water)

Abstract

:
The reduction of organic micropollutants (OMP) in rivers, lakes and groundwater is an essential legal obligation of the European Water Framework Directive. Since OMP treatment in full-scale wastewater treatment plants (WWTPs) is not state of the art yet, there is little knowledge regarding removal performances, in particular during wet weather. We aimed to contribute to filling this knowledge gap by providing insights from a German case study. On-site measurements were conducted to investigate the impact of rain events on OMP removal with activated carbon processes using powdered activated carbon (PAC) and granular activated carbon (GAC). The study focused on 26 OMPs with different entry paths in the combined sewer system (CSS) and various physico-chemical properties. The monitored OMPs showed higher mass loads during wet weather at all sampling points: effluent of the secondary clarifier, effluent of the PAC treatment stage, and effluent of the GAC filter. As a result of shortened hydraulic retention time (HRT) due to rain events, the overall OMP removal was significantly lower (42% PAC and 46% GAC) than during dry weather (68% PAC and 62% GAC). In order to achieve constant removal rates during all weather conditions, the critical process control parameters are currently being investigated in ongoing studies.

1. Introduction

1.1. Background and Political Relevance

In urban areas, wastewater treatment plant (WWTP) discharges are one of the main emission sources of specific organic micropollutants (OMPs) into surface water bodies [1,2,3]. The targeted removal of OMPs from wastewater with full-scale treatment is not yet a common implemented feature.
The sustainable and environmentally compatible use of water is the content of both the European Water Framework Directive (WFD) and the Sustainable Development Goals 6 and 14 (SDG) of the United Nations (UN) [4,5]. The WFD aims to raise all water bodies of the EU states to a good chemical and good ecological status. Currently, none of the 16 federal states in Germany have achieved the objectives of the Water Framework Directive [6]. One important requirement to reach these targets is, for example, the equipment and operation of WWTPs with the best available technology (BAT). For instance, technical upgrades of WWTPs with advanced treatment stages for micropollutant removal can significantly improve water quality, and thus, reduce the release of micropollutants into water bodies [2,7]. In Germany, about 35 out of 10,000 wastewater treatment plants have so far been upgraded with an additional treatment stage for the removal of micropollutants. Most of the WWTPs (26 out of 35) with advanced treatment stages are located in the Federal State of Baden-Württemberg [8,9]. About 65% of these WWTPs use a powdered activated carbon (PAC) process, 23% use granulated activated carbon (GAC) filters, and about 12% use ozonation to remove OMP [9]. The process shall be operated in such a way that WWTPs have an average OMP removal performance of at least 80% for selected substances. This requirement only applies to WWTPs with advanced treatment stages in the federal state of Baden-Württemberg (BW), Germany, and is comparable to the standards in Switzerland. In BW, OMP removal of at least 80% must be fulfilled by the mean elimination rates of the last six samplings. The OMP removal of each sampling is calculated as the average of the elimination rates of the following individual substances: carbamazepine, diclofenac, hydrochlorothiazide, irbesartan, metoprolol, benzotriazole, ∑4- and 5 methylbenzotriazole. The removal rate of the individual substances is determined by considering the influent and final effluent concentration of the WWTP (48 h composite samples) [10]. Aside from the upgraded plants in Germany, 18 WWTPs in Switzerland have already been enhanced with an additional treatment stage, including seven plants with PAC processes, seven plants with ozonation, three plants with GAC filters, and one plant with the combined processes of ozonation and GAC filtration [11]. However, to date, there are no international guidelines for the regulation of the entry of micropollutants from WWTPs to the aquatic environment or specific targets for micropollutant removal in advanced WWTPs. Hence, the target to achieve a removal performance of at least 80% in Switzerland and Baden-Württemberg can currently be considered best practice and provide important insights for the future upgrading of wastewater treatment plants in European member states.

1.2. State of the Art: OMP Removal under Wet-Weather Conditions

Micropollutants can be removed from wastewater with the use of processes such as activated carbon or ozone [12]. Processes using activated carbon have been investigated at various pilot and industrial scale WWTPs, demonstrating the suitability of PAC and GAC for the intended removal of OMPs [13,14,15,16]. Given the monitoring difficulties of carrying out investigations at WWTPs during rain events, most of the studies dealing with activated carbon processes for OMP removal were conducted under dry-weather conditions.
For instance, Mailler et al. (2015 and 2016) performed large-scale investigations with activated carbon in a fluidized bed at the Seine Centre WWTP in France using PAC and µGAC (GAC particle size between 200 and 800 µm) [16,17]. During the investigations with PAC, they carried out five samplings where the WWTP received additional wastewater from another WWTP that was under maintenance. The additional wastewater input caused higher inflow concentrations of organic matter and OMPs, which resulted in a reduction in OMP removal efficiency, except for paracetamol and ibuprofen. Since rain events also increase the WWTP inflow streams, the findings of Mailler et al. (2015) may provide a first indication of the expected behaviour of PAC removal efficiency during wet-weather conditions. However, it must be considered that higher influent concentrations do not necessarily lead to a reduction in OMP removal efficiency [18].
Further investigations on a large-scale activated carbon treatment plant were carried out in 2017 [19]. Guillossou et al. (2019) sampled one rain event that had no impact on the biological treatment but an effect on the OMP removal in the pilot plant; the removal efficiency decreased despite identical hydraulic conditions and activated carbon dosages.
Margot et al. (2013) investigated the OMP removal efficiency of two pilot plants at the municipal WWTP Lausanne in Switzerland [14]. One pilot plant was operated with ozone and the other one with PAC. Having sampled both pilot plants for OMPs several times over one year, they could not detect any impact of rain events at the inflow concentrations compared with the background variability, except for the pesticides isoproturon, carbendazim, and terbutryn.
Another case study from Switzerland with a large-scale ozonation treatment confirmed at least an 80% OMP removal efficiency for all weather conditions with the aid of a suitable control system (BEAR algorithm), an optimized ozone input process (LOD process), and an active load management [20]. However, the OMP removal performance in advanced treatment stages under wet-weather conditions remains almost unknown for PAC processes and GAC filters.

1.3. Impact of Rain Events and Research Gap

The literature showed that rain events might have a significant impact on advanced treatment processes with activated carbon, especially in combined sewer systems (CSS) where urban runoff is collected together with wastewater during rainfall. For instance, OMPs such as mecoprop or polycyclic aromatic hydrocarbons (PAHs) are washed off by the rain from roofs or streets, resulting in higher inflow volumes and higher concentrations of stormwater-related micropollutants entering the WWTP [21,22]. Dittmer et al. (2020) showed with measurement campaigns and simulations that urban runoffs affect the water quality of urban streams. The concentrations and loads of the OMPs depend on the substance properties and the source [23]. Consequently, several effects of rain events on the wastewater treatment can be expected, for example:
(i)
Hydraulic retention times (HRT) in the different treatment stages are shortened due to a higher inflow, which can cause a decrease in biological degradation and lower contact time in additional treatment steps as well, affecting sorption processes.
(ii)
Wet-weather conditions may change the concentration of OMPs at the inflow of advanced treatment stages, which has an impact on sorption capacity.
(iii)
The wastewater matrix changes, for example, due to fluctuations in DOC concentration or the occurrence of rainwater-related high OMP concentrations.
(iv)
The boundary conditions for sorption processes change, including variation in temperature, electrical conductivity, and buffer capacity.
Considering these possible impacts, rain events might have some direct consequences on the performance and efficiency of micropollutant removal in WWTPs. The removal efficiency of OMPs is expected to decrease during both conventional without activated carbon and advanced treatment stages with activated carbon.
However, previous studies on the removal of micropollutants with activated carbon were conducted mainly during dry-weather conditions, while the literature rarely addressed influences during wet-weather conditions. Hence, there is a significant knowledge and research gap regarding the removal of micropollutants in advanced treatment stages during wet-weather conditions.

1.4. Objectives and Hypotheses

We aim to contribute to filling the described knowledge gap by presenting insights from a first case study that investigates the impact of rain events on the OMP removal performance. The specific objectives of our investigation are to:
(1)
Describe the temporal variations of OMP concentrations and loads at the inflow and outflow of advanced treatment stages with PAC and GAC during wet weather.
(2)
Determine the daily OMP release into the receiving water body during wet-weather conditions compared with dry-weather conditions.
(3)
Assess variations in OMP removal performance by advanced treatment with PAC and GAC due to wet-weather flows.
(4)
Improve the understanding of wet-weather flow dynamics on OMP removal by activated carbon processes.
With our study, we also seek to provide information that can be used to ensure constant OMP removal efficiencies during all weather conditions, for example, through improved process control by adding the required quantities of PAC or prolonging the contact time in the GAC filter.

2. Materials and Methods

2.1. Framework and Study Design

Our case study was conducted at the WWTP in Mannheim, which has a full-scale additional treatment stage with PAC in partial flow operation and a GAC filter for further investigation on OMP removal (see Figure 1). Within the scope of our investigations, both treatment stages were sampled once during dry-weather (DW) and twice during wet-weather (WW) conditions. We analysed a total of 26 OMPs with different physico-chemical properties that enter the CSS via different pathways.
The WWTP Mannheim is located in southwest Germany. It has a size of 725,000 population equivalents and an inflow volume of around 78,000 m3 per day. Approximately 50% of the wastewater volume is from industries such as the chemical industry, metal processing industry, and food industry [24]. The combined sewer system (CSS) in Mannheim has a network length of 832 km and drains a catchment of 7,100,000 m2.
During the investigations, two processes were implemented for OMP removal in full-scale. Both processes for OMP removal at the Mannheim WWTP remove OMPs by activated carbon adsorption. Although the same raw material is used, both processes function very differently. In addition to the mechanical treatment stage, the biological activated sludge treatment, and the sand filtration, the WWTP Mannheim has a treatment stage for the removal of micropollutants using PAC and GAC filters in a partial flow operation.
In the process with PAC, an amount of 7 mg/L PAC was dosed continuously in the contact reactor under volume conditions proportional to the treatment stage inflow. The PAC used was pharmA-Clean from Carbon Service Consulting GmbH Co. KG. In 2019, 90% of the annual wastewater volume was treated with PAC. PAC is continuously stirred into the biologically treated wastewater and settled in a sedimentation tank with the help of polymers and flocculants. The partially loaded PAC is recirculated back from the sedimentation tank to the contact reactor and enriches there. Part of the recirculated PAC is removed and fed into the biological treatment stage, where it is removed with the excess sludge. The OMP removal takes place not only through the dosing of the fresh PAC, but also through the partially loaded PAC sludge in the contact reactor. The HRT of the wastewater is between 130 min and 320 min, depending on the influent volume. In order to achieve a higher removal of OMPs, the PAC dosing can be increased. A detailed setup of the treatment stage is reported by Rößler and Metzger [24]. Flow volumes during dry and wet weather are shown in Figure 1.
The GAC is used as a filter medium in a fixed-bed filter. The filter is flowed through from top to bottom and must be backwashed at regular intervals due to clogging. The empty bed contact time (EBCT) corresponds to the theoretical contact time of the wastewater flowing through the empty filter volume. It ranges from 11 to 24 min. To achieve the sufficient removal of OMP, an EBCT of about 20 min is recommended [25]. An increase in OMP removal is possible with an increase in EBCT. This can be achieved by reducing the inflow volume or adding more filter cells if they are available. The results shown are from a filter cell that had lower contact times in some cases during the investigations.
In contrast to GAC filters, the PAC process allows a flexible OMP removal by dosing fresh PAC. On the other hand, GAC filters require less constructional efforts and are easy to operate.
Figure 1 shows a flow scheme of the Mannheim WWTP with the three sampling points of our study, namely S1 (effluent secondary clarifier), S2 (effluent PAC), and S3 (effluent GAC filter).

2.2. Monitoring and Sampling Procedure

Since the removal of OMPs in full-scale WWTPs is not state of the art, there are also no binding technical guidelines or legal frameworks for the corresponding monitoring and sampling procedures. In the absence of European and international standards, we designed our sampling procedure according to German guidelines for the operational monitoring and controlling of OMP removal performance in advanced treatment stages, published by the Micropollutants Competence Centre Baden-Württemberg [26]. It should be noted that these guidelines are non-binding regulations for the Federal State of Baden-Württemberg (Germany) but represent the best guidance currently available in the literature. A critical factor for sample taking was the number of rainy days in Mannheim. For the definitional framework of this paper, we use the terminus “rainy day” with reference to the flow rate of wastewater that exceeds the average flow rates for the region of Mannheim in dry weather (<1000 L/s). In 2019, there were a total of 32 rainy days that resulted in wastewater flow rates of more than 1000 L/s.
In addition, the conduction of experiments was related to substantial temporal expenditures of each sample (24 h samples), analytical costs, and personnel efforts, which resulted in a considerable financial expenditure within our case study. To keep the financial effort for conducting the experiments within feasible boundaries, we decided to compare three samplings during dry and wet weather.
The samples for dry-weather and the first wet-weather monitoring were taken volume-proportional using permanently installed automatic 24 h composite samplers at the WWTP (MAXX Mess und Probenahmetechnik GmbH, Maxx SP5 S) at the three sampling points S1, S2, and S3.
Dry-weather sampling (DW) was conducted from 00:00 on 5 September 2019 to 23:59 on 6 September 2019 (48 h). The average flow rate at S1 was 827 L/s. The first wet-weather sampling (WW1) was carried out from 00:00 to 23:59 on 11 June 2019 (24 h) with an average flow rate of 2999 L/s at the effluent of the secondary clarifier S1.
The procedure for the second wet-weather sampling (WW2) included 1 h composite samples for 24 h. After the rain event, the samples were mixed in the laboratory to generate 4 h composite samples. The sampling took place from 20:00 on 7 September 2019 to 19:59 on 8 September 2019 and the average flow rate at S1 was 3549 L/s. The average flow rates of the two wet-weather samples are between three and four times higher compared to average dry-weather flows in Mannheim, representing the typical effects of rainy days in Mannheim. However, due to the small sample size, the wet-weather samples cannot be considered representative for all rainy days in 2019. The hydraulic retention time was not considered during sampling because of its variation during the rainfall event and the difficulty of correctly allocating the corresponding samples.
The samples were stored at 4 °C for a maximum of 24 h until they were analysed in the laboratory. All non-filtered samples were homogenized prior to chemical analytics. Additionally, the first wet-weather sample (WW1) at S1 was filtered with a pore size of 0.45 µm and analysed to obtain a phase distribution of selected OMPs in the effluent of the secondary clarifier.
The selection of investigated OMPs followed criteria such as different origins and entry paths in the CSS and different physico-chemical properties (log D at pH = 7.4 between −1.31 and 6.19). Log D is pH-dependent octanol/water partition and indicates the partition or distribution of a substance between the solid and aqueous phase, therefore, giving information about the hydrophobicity of a compound [27]. We selected 26 substances for the chemical analysis (compare Table A1): twelve pharmaceuticals, two corrosion inhibitors, four industrial chemicals, three flame retardants, two herbicides, two insect repellents, and caffeine.

2.3. Analytical Methods

We followed the methods of the German Institute for Standardization (DIN) to analyse the standard wastewater quality parameters. In the wet-weather samples, the parameters pH (DIN 38404); electrical conductivity (DIN EN 27888); turbidity (DIN EN ISO 7027-1); and spectral absorption coefficient at 254 nm (SAC254, DIN 38404-3) were measured in the laboratory of our institute at the University of Stuttgart. DOC (DIN EN 1484) was analysed on-site at the laboratory of the WWTP Mannheim. To determine the impact of rain events, we compared the sum parameters, namely SAC254 and DOC, with the dry-weather samples.
After the addition of the isotope-labelled standards, the non-filtered samples were enriched by solid-phase extraction (TELOS ENV, 200 mg). For the determination of the substances, two settings were available in our lab: gas chromatography coupled to mass spectroscopy GC/MS (Agilent Technologies GC 7890B, MSD 5977B) and high-performance liquid chromatography coupled to a tandem mass spectroscopy HPLC/MSMS (Waters HPLC 2695, TQ MS). The isotope dilution method was used for substance quantification. The limits of quantification were below 5 ng/L for all of the examined substances.

2.4. Calculations of Phase Distribution, Mass Load, and Removal

The phase distribution of the first wet-weather sampling (WW1) was calculated with the concentration of the homogenised c h and membrane-filtered c mf sample. The particulate phase was calculated by the difference in the individual substance concentration of the homogenised sample c h and the corresponding concentration of the membrane-filtered sample c mf divided by the concentration of the homogenised sample c h .
particulate   phase = c h c mf c h · 100 %
The dissolved phase is calculated by subtracting the particulate phase from 100%.
dissolved   phase = 100 % particulate   phase
For the interpretation of the results, the mass load was used, because it considers the substance concentration and the corresponding water quantity and is more suitable for comparing a dry- and wet-weather sample. The mass loads of the micropollutants are calculated from the individual substance concentrations c i , t and the corresponding water quantity V i , t at a time t .
mass   load i , t = V i , t · c i , t
The removal of the additional treatment step is the difference between the concentration at the inflow c in and the concentration at the outflow c out referred to the concentration at the inflow.
removal   in % = c in c out   c in · 100 %

3. Results

3.1. Flow and Treatment Conditions

Figure 2 displays the flow and treatment conditions during the three sampling periods.
Figure 2a shows the ratio of the flow rate Q to the design parameter, the maximum flow rate of the biological treatment Qmax = 4000 L/s over time, and the effluent of the secondary clarifier. Q/Qmax is an indicator for the dilution of wastewater. During dry-weather (DW) conditions the diurnal cycle is visible, and the factor is low and varies between 0.15 and 0.25. When the inflow increases, the factor reaches values close to 1, which indicates that the capacity of the treatment plant has been reached.
Figure 2b shows the hydraulic capacity of the two additional treatment stages with the ratio of the minimum HRT (HRTmin) and the HRT. Both treatment stages operate during DW at a ratio of around 0.4. The diurnal cycle is more pronounced for the treatment with PAC. During wet weather (WW), the HRT is at its minimum, which results in a factor of 1 for both treatment stages. At this point, both treatment stages are at their maximum hydraulic capacity. Flushing the GAC filter for approximately one hour causes a decrease in the filter ratio.
The removal of SAC254 (c/c0) is shown in Figure 2c for both treatment stages. The removal decreases during WW samplings due to shorter HRTs and the dilution of effluent. The sudden increase during DW sampling is caused by a correction of the calibration of the SAC probe at the effluent of the secondary clarifier. The turbidity at the effluent of PAC and GAC in Figure 2d is doubled during WW. The turbidity in the PAC treatment is higher because of the process. For the particle retention of this process a sand filter is installed downstream (see Figure 1).
Figure 2e displays the dry matter content of the PAC treatment. During DW, approximately 6–7 g/L of activated carbon sludge was in the contact reactors and an additional 7 mg/L was continuously dosed. Hence, there was sufficient activated carbon in the system. During WW, the activated carbon sludge is diluted and decreases to 4.0–4.5 g/L, resulting in a lower adsorption capacity for OMP removal.
The impact of higher inflow during WW is visible in all parameters presented.
The results of the standard wastewater parameters pH, electrical conductivity, turbidity, DOC, and SAC254 of the samples can be found in Table 1. With the high-resolution sampling during WW2, the impact of wet-weather conditions can be investigated for the standard wastewater parameters. It can be observed that pH and turbidity are not affected by the rain event. The increase in turbidity at the effluent of the GAC filter in the second sample of WW2 (WW2_2) is related to filter blockage. During WW2, the electrical conductivity decreases over time due to the dilution of wastewater in rainwater. The electrical conductivity of rainwater is lower. DOC and SAC254 are organic sum parameters that are also affected by wastewater dilution. There is an increase in the SAC254 in the laboratory values during WW2 that corresponds with the results of the online measurement. The online and the laboratory data implicate that there is an effect on the two additional treatment stages during wet weather. Since the HRT is shortened and the SAC254 shows variations during WW, there could be an impact on OMP inflow concentration and the removal efficiency.

3.2. Phase Distribution at the Effluent of the Secondary Clarifier

The aim of the first sampling WW1 was to obtain a phase distribution at the effluent of the secondary clarifier during wet weather. The results in Figure 3 illustrate that the majority of organic micropollutants are present in the dissolved phase.
All OMPs have over 60% of the concentration in the dissolved phase. The largest particulate fractions were found for MTBT, CST, and TDCPP with 21–35%. MTBT has a high logD value (3.7) that confirms the lipophilicity of this compound and the tendency of sorption on particles. The substances with particulate fractions >10% (TBY, TMDD, LCN, VLX, TDCPP) have logD values > 1.43, except CST (0.9). CST has the highest molecular weight of the investigated OMPs, which negatively affects its solubility in water. This can partly explain the higher partition in the particulate phase compared to the other pharmaceuticals.
MCP, SMX, and HYC are completely dissolved. Their logD values are all negative, which indicates their hydrophobicity.
The lower percentage in the particulate phase at the effluent of the secondary clarifier (S1) is also a result of the two sedimentation steps before the treatment process (primary and secondary clarifier). Most of the particles are already separated from the wastewater at this sampling point, which shows a TSS of 6.2 mg/L.

3.3. Concentrations of Micropollutants

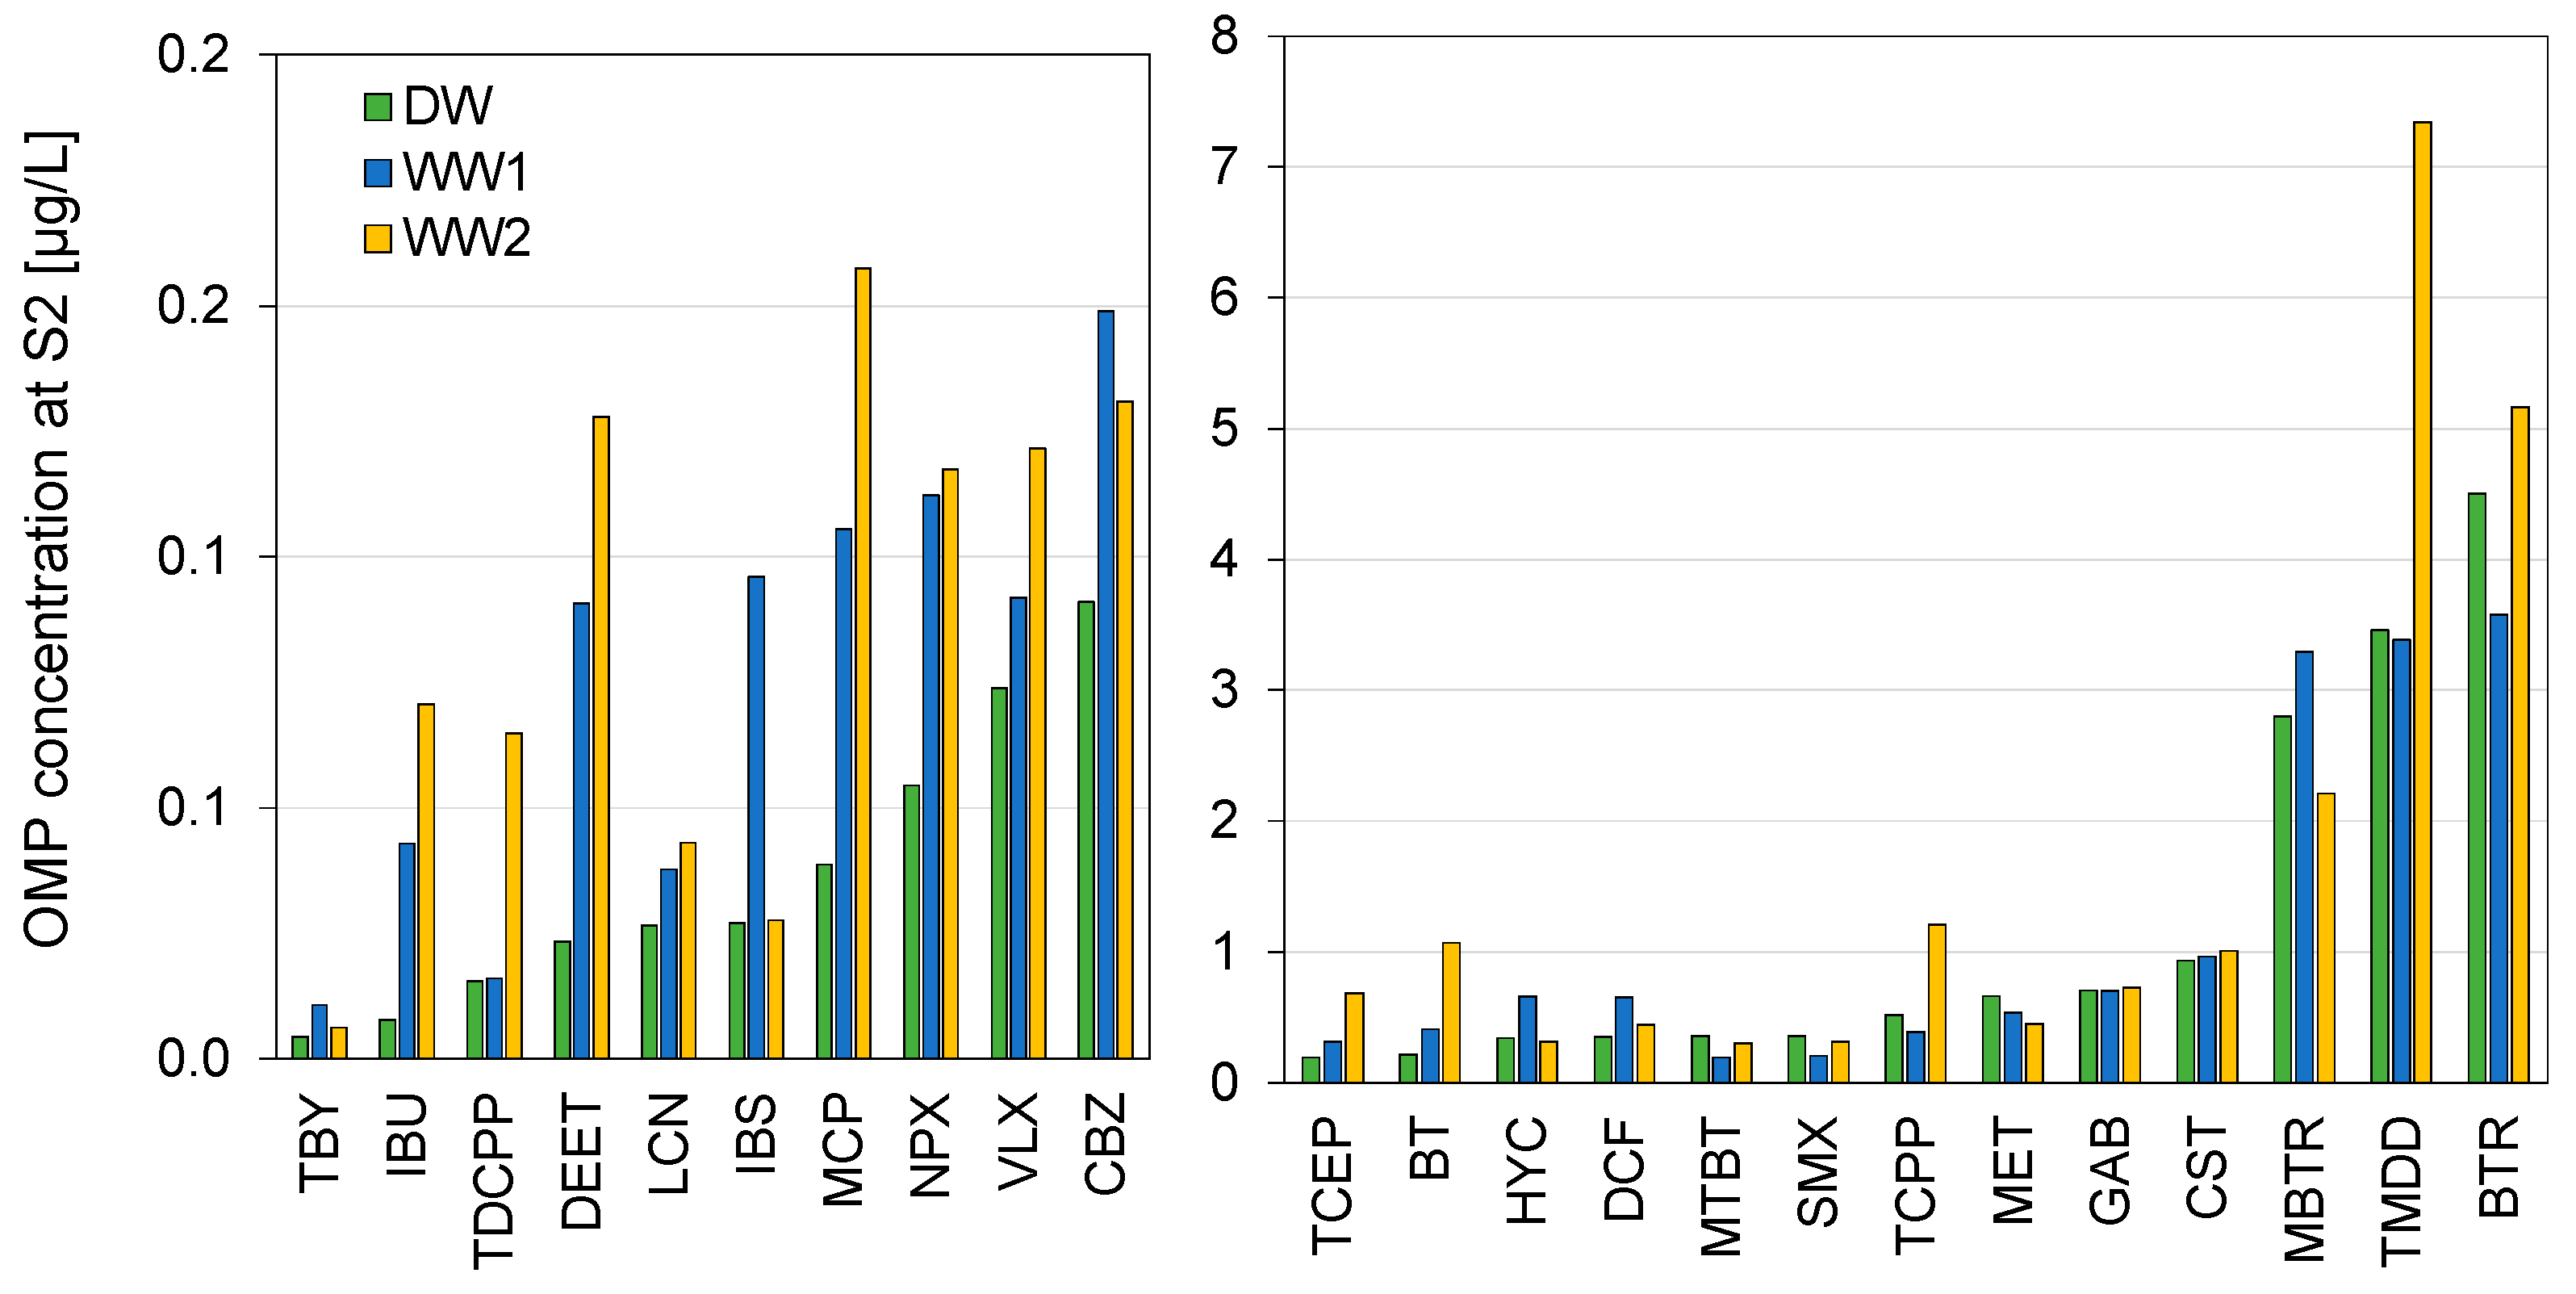
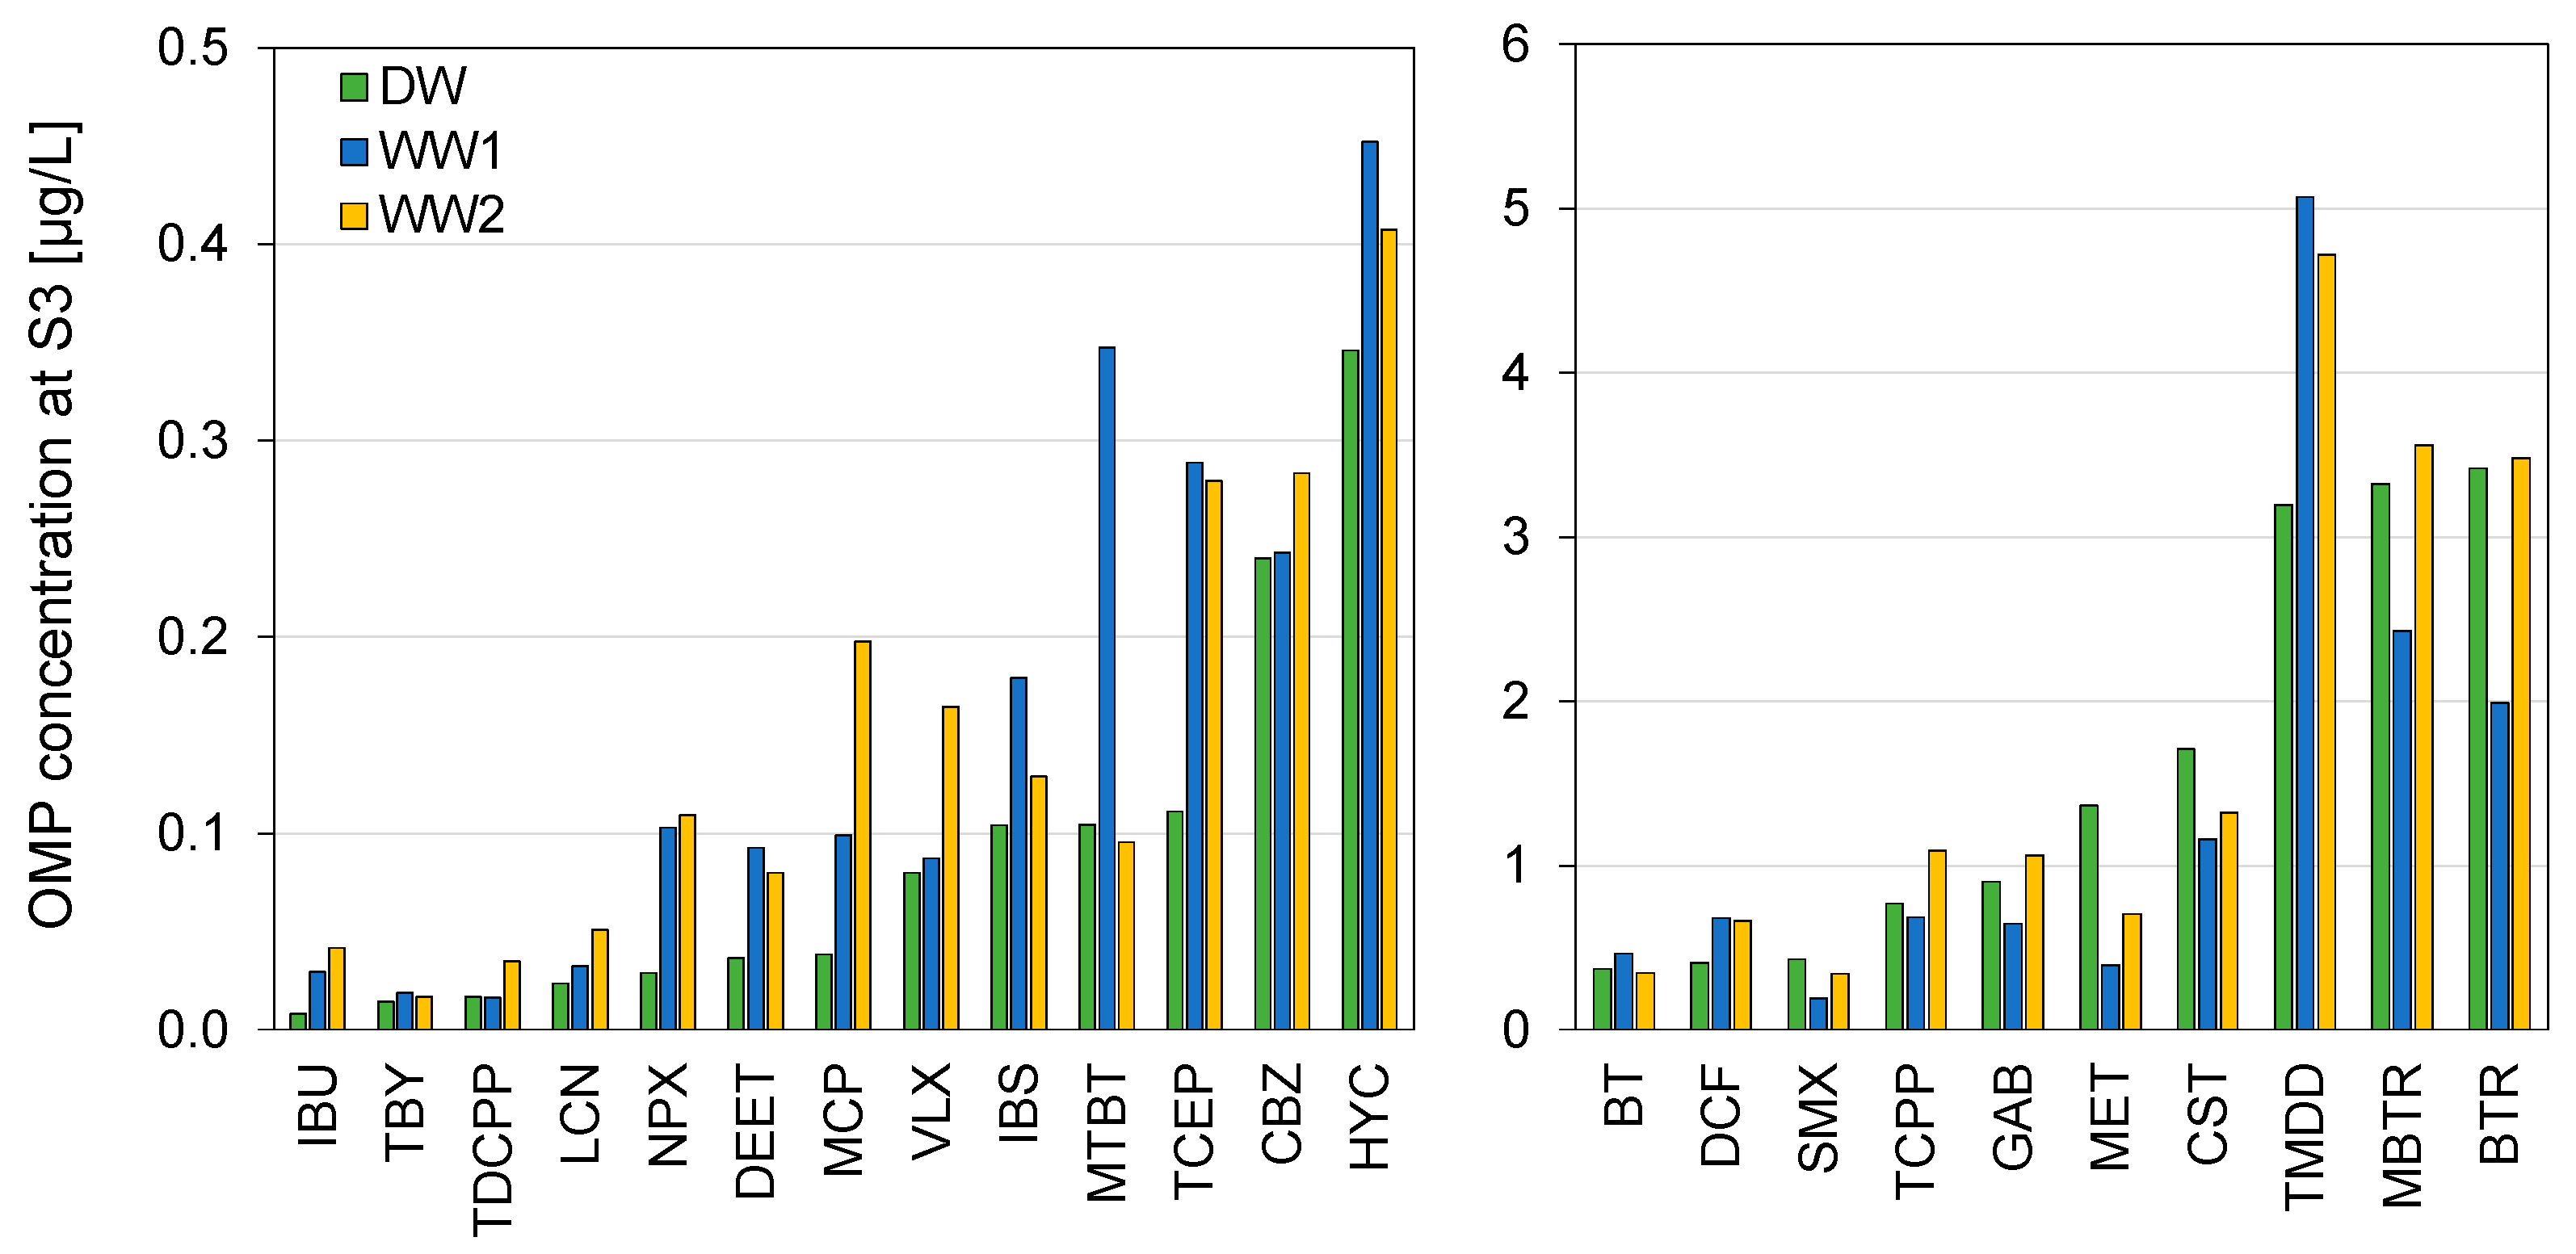
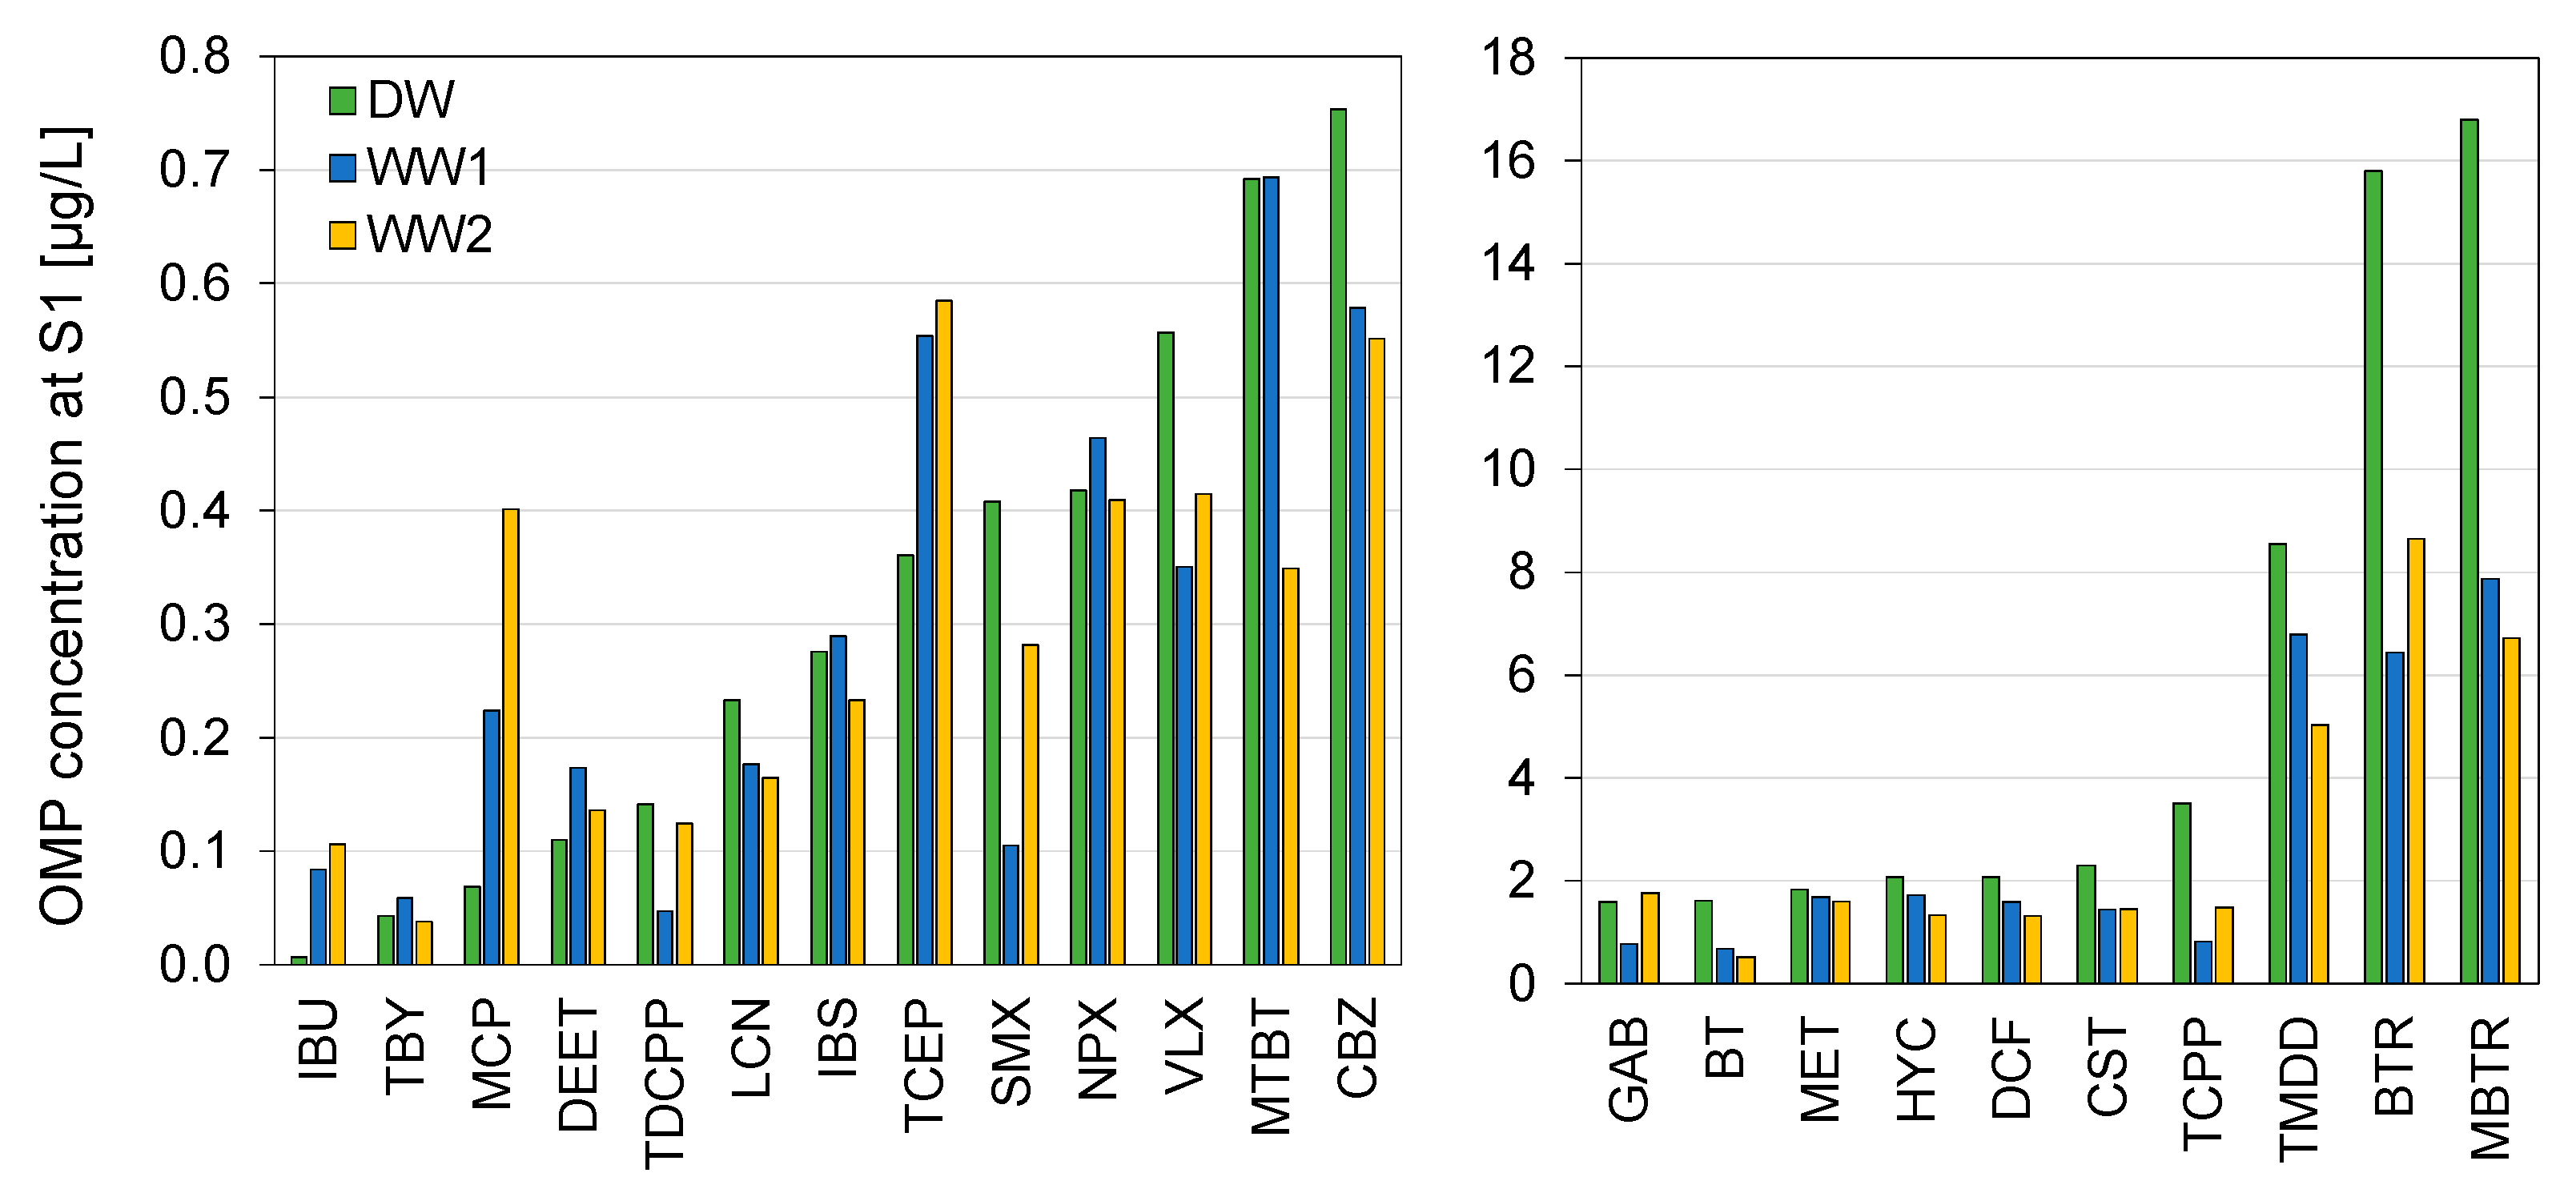
Figure 4 shows the concentrations of the 23 selected OMPs of both dry- and wet-weather samplings at the effluent of the secondary clarifier in 2019. The concentrations of the same compounds for the other two sampling points (S2 and S3) are displayed in Figure A1 and Figure A2 in Appendix A. The highest concentrations for dry and wet weather have corrosion inhibitors (BTR, MBTR). The concentrations during dry weather are 15.8 µg/L and 16.8 µg/L, two times higher than in both wet-weather samples. Compared to micropollutants such as IBU or TBY, the concentrations of BTR and MBTR are up to a hundred times higher.
Several OMPs are mainly introduced from domestic wastewater (e.g., TBY, DEET, IBS, NPX, GAB, MET, HYC, DCF) and show only marginal differences within dry- and wet-weather samples, indicating their independence from wet-weather flow. However, MTBT that is present in industrial wastewater and urban runoff showed a clear difference in WW2. The substances IBU, MCP, and TCEP have significantly higher concentrations in wet-weather samples, indicating a correlation between the higher concentrations and the wet-weather flow. IBU had a very low concentration in the dry-weather sample of 7 ng/L, which increased up to 84 ng/L and 106 ng/L during wet-weather sampling. The concentrations of TCEP and DEET, however, were 1.2 to 1.6 times higher in the wet-weather samples. MCP showed a relatively high increase in concentration during wet weather with 3.5 to 5.8 times higher values, which can be explained by the discharge of these substances in sewer systems due to surface runoff.

3.4. Concentration Dynamics

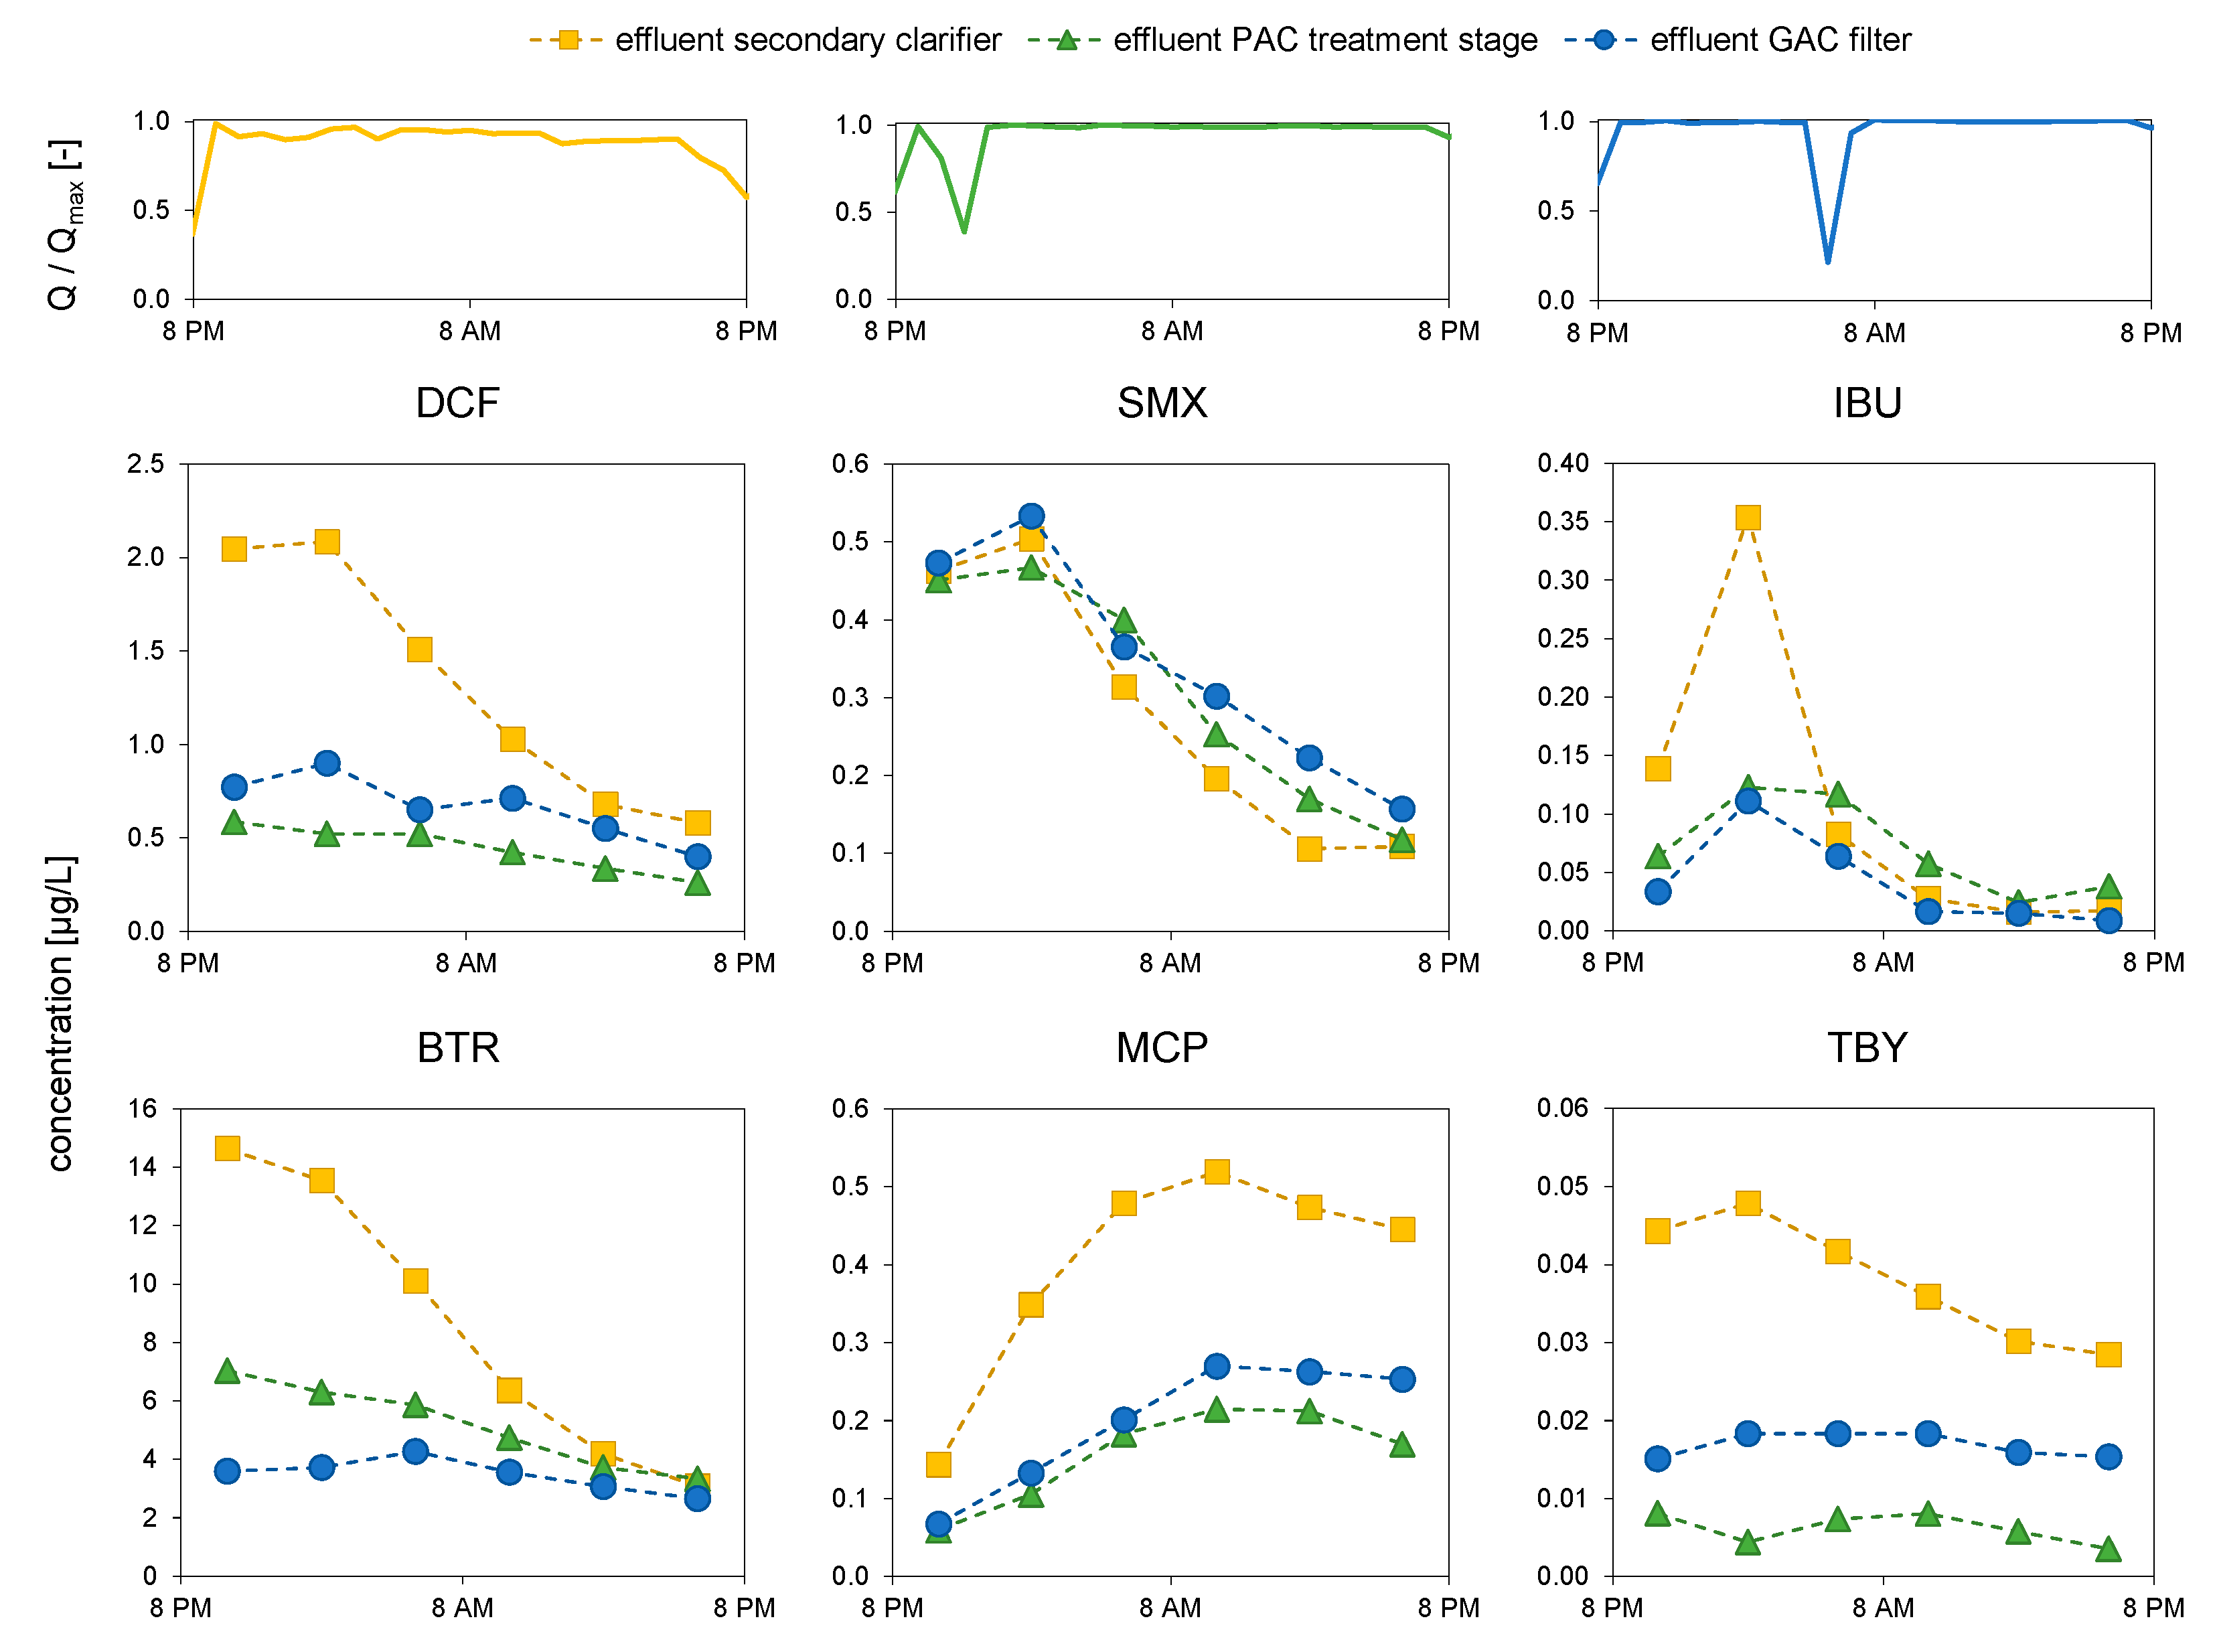
Figure 5 shows the concentration over time for selected micropollutants during the rain event WW2 for the three sampling points with different concentration patterns. After one hour, the inflow reached the maximum value for the biological treatment of 4000 L/s and remained approximately constant during the rest of the sampling period. All micropollutants shown, except MCP, have their maximum concentration in the effluent of the secondary clarifier (S1) between 12 and 4 a.m. (second sample), suggesting the decoupling of the concentration peak from the hydraulic peak. The maximum inflow during the sampling was reached after one hour (see Figure 2), and the concentration peak was 4–8 h later.
DCF, BTR, and TBY have a similar concentration pattern for the three sampling points. After the increase in the concentration in the effluent of the secondary clarifier, the concentration decreases further during the sampling due to dilution effects. In the effluent of the two treatment stages with activated carbon, the concentration follows the same pattern with strong peak flattening. DCF and TBY were more efficiently removed with PAC, and BTR with GAC. The difference in the removal with activated carbon for the same micropollutant can be explained by the different processes and the different activated carbon products [28,29]. IBU concentration shows the steepest increase. As mentioned before, IBU is well biodegradable, and its biological degradation decreases during higher inflows. Whether the reduction in the concentration between 4 and 8 a.m. is due to lower influent loads or an adaptation of the biological treatment stage to the shorter hydraulic retention time cannot be clarified because influent measurements to the biological treatment stage were not carried out. The concentration patterns of IBU after the advanced treatment stages (S2 and S3) follow the course of S1 with a smaller amplitude. After the second sample, the concentration in the effluent of the treatment with PAC (S2) is slightly higher than the concentration at the inflow (S1). The treatment with PAC has a high hydraulic retention time (see Figure 1) and the samples were collected without an offset time, which could explain the higher concentrations at the outflow of the PAC treatment. This effect could not be observed for the GAC filter because of the shorter hydraulic retention time compared to the PAC treatment.
SMX shows a poor reduction in the concentration with activated carbon treatment. SMX adsorbs only poorly on activated carbon during wet weather, which results in almost identical concentrations at all three sampling points.
MCP shows a completely different concentration pattern compared to the other micropollutants. The concentration reaches a maximum between 8 and 12 a.m., which indicates that MCP may enter the WWTP several hours after the beginning of the rain event. The concentration of the other OMPs is lower due to dilution effects caused by the higher inflow, showing that MCP is a rainwater-born micropollutant. The course of the concentration is the same in all three sampling points.

3.5. Mass Loads of Micropollutants

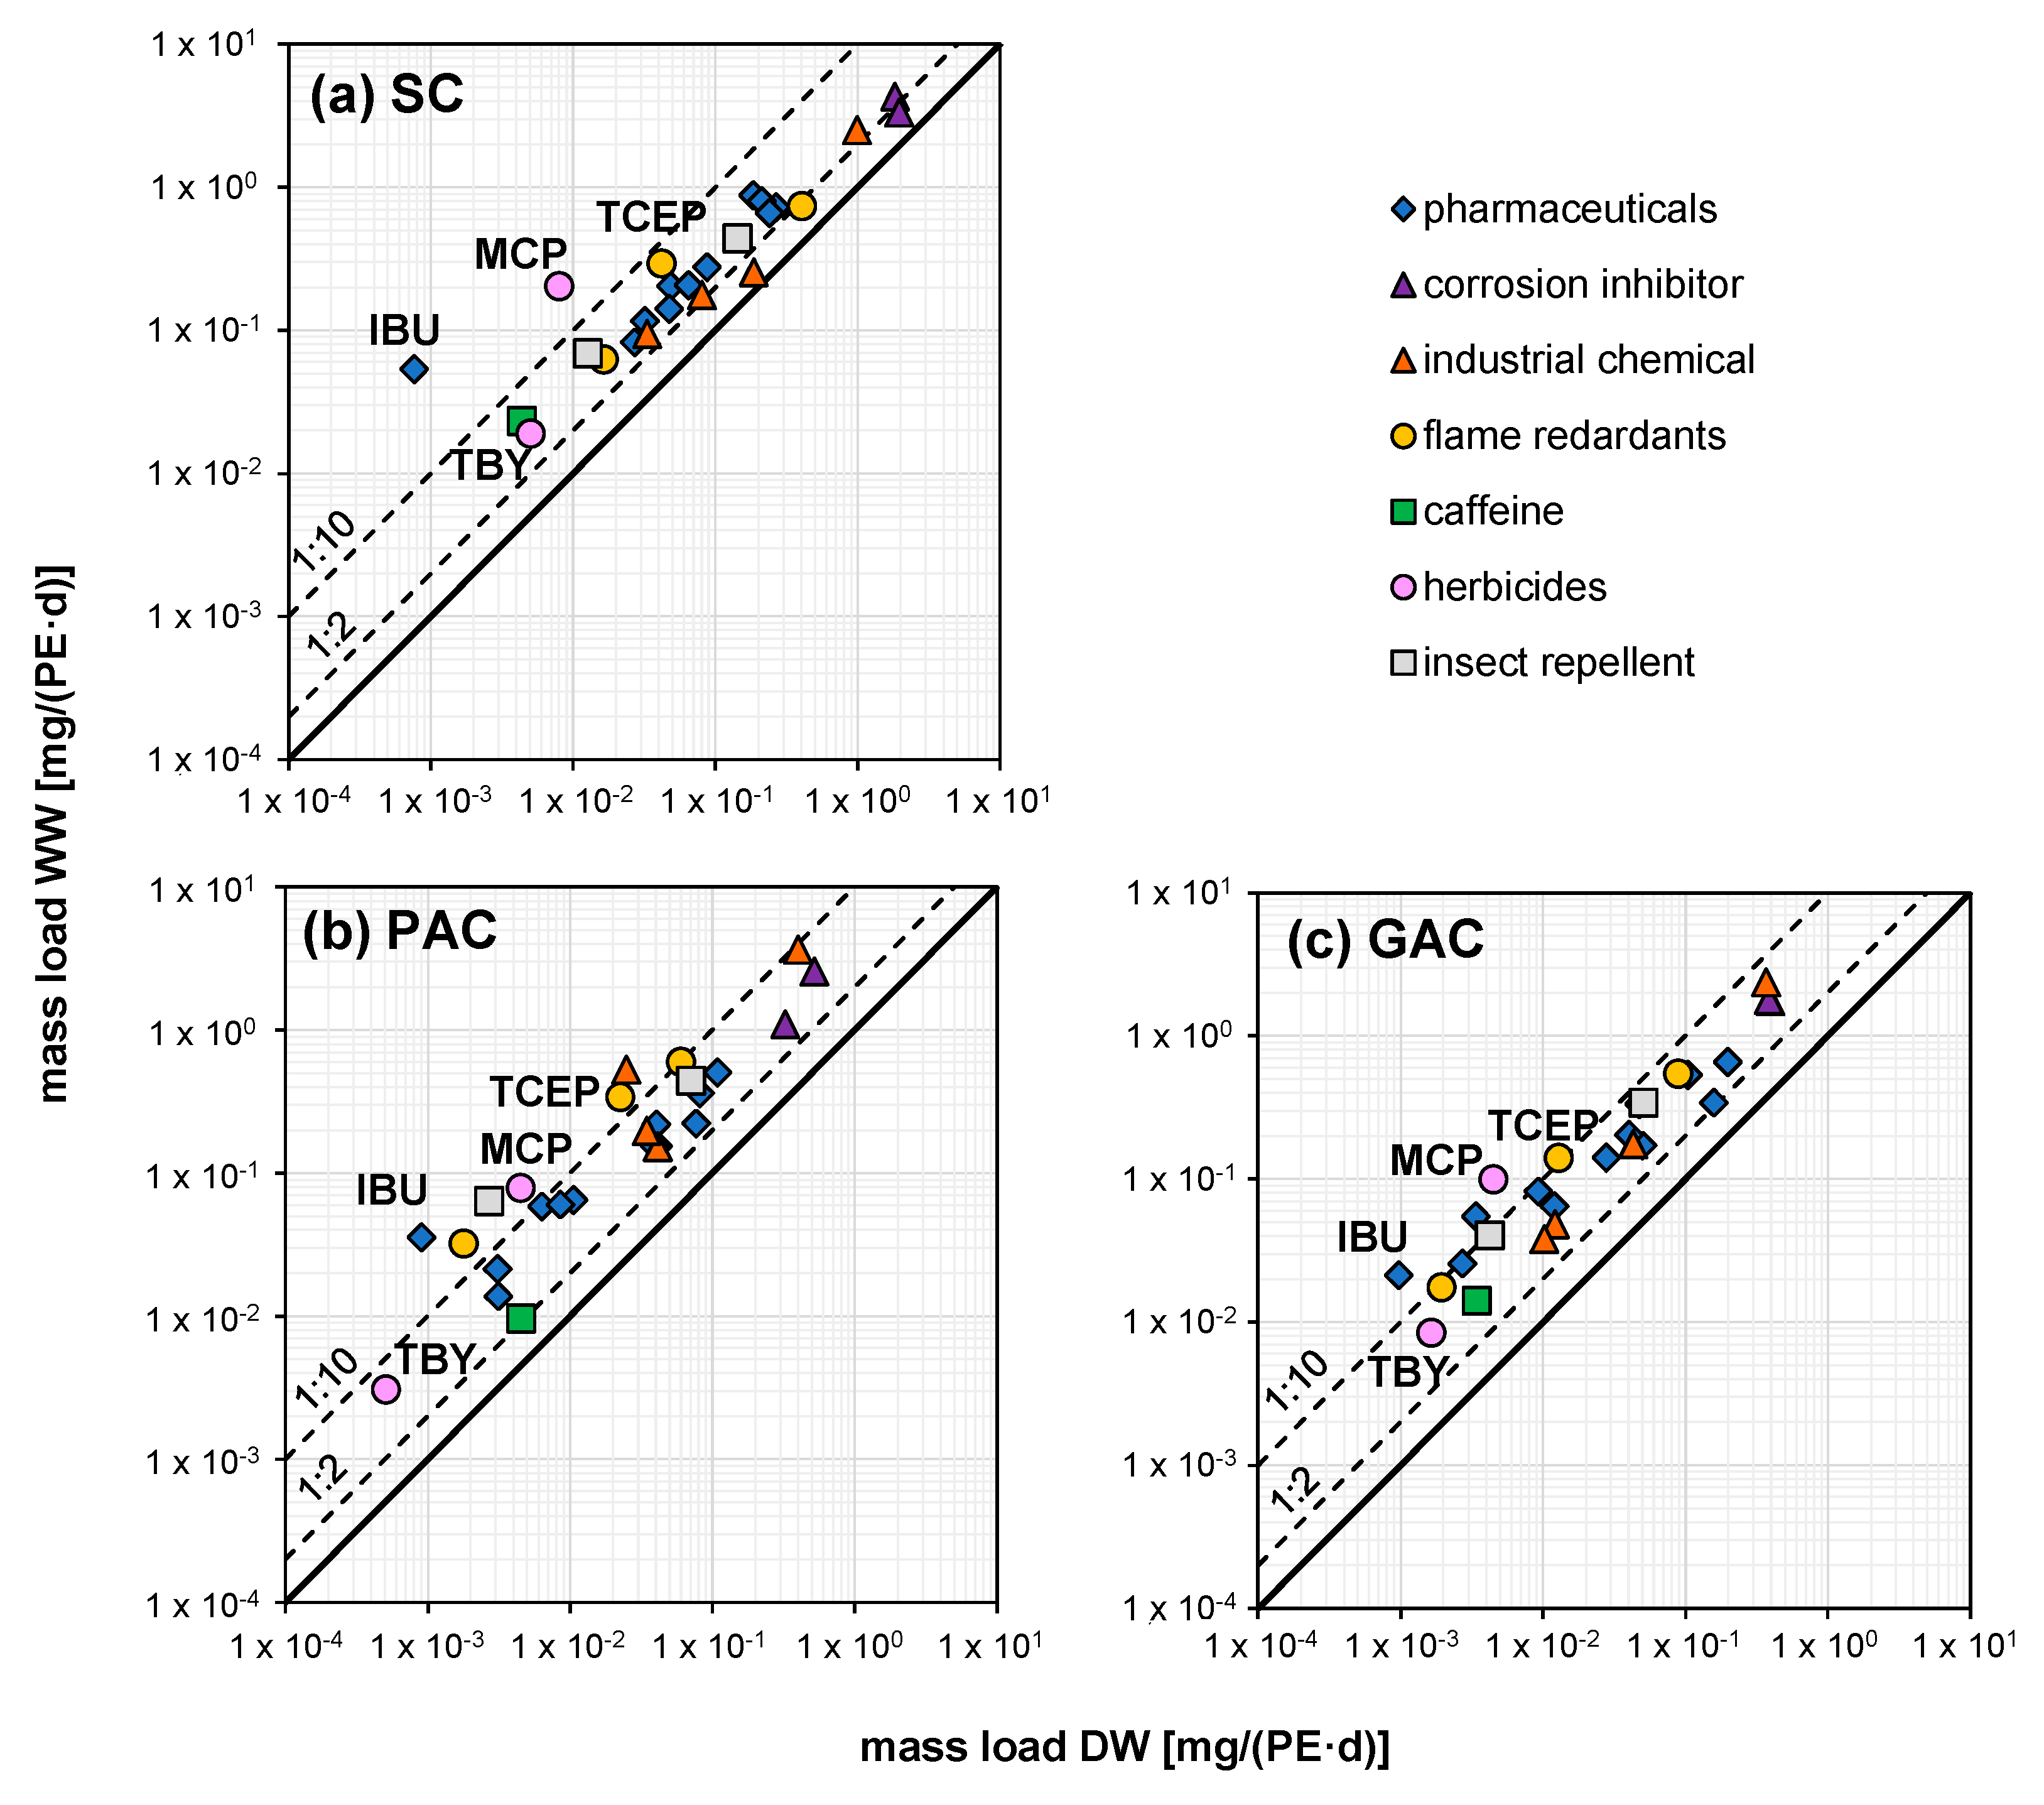
Figure 6 shows the daily mass load on a logarithmic scale during dry weather compared to the mass load during wet weather (WW2) for the three sampling points: effluent of the secondary clarifier, effluent of the PAC treatment stage, and effluent of the GAC filter.
For all selected OMPs, the daily mass load of the WW sampling was higher compared to the DW sampling at all sampling points. The mass loads after additional treatment with activated carbon are reduced to a different degree depending on the process, the inflow loads, the activated carbon product, and the physico-chemical properties of the substances, which leads to a greater scattering of the diagram values.
The ratio between dry- and wet-weather mass loads shift to greater values in the additional treatment stages, which indicates a better removal with activated carbon of OMPs during dry weather.
The mass load of most of the OMPs was in a range of 1.4 to 7 times higher; exceptions were IBUs with 70 times higher mass loads and MCPs with 25 times higher loads at the effluent of the secondary clarifier. Most of the measured OMPs such as pharmaceuticals, corrosion inhibitors, industrial chemicals, and caffeine are largely introduced from wastewater. Accordingly, dry- and wet-weather loads showed 3–5 times higher loads of pharmaceuticals, which are mostly discharged from households. Only IBU had a 70 times higher mass load during wet weather related to its superior biodegradability during dry weather. The same effect could be seen for CAF, which is also easily biodegradable and had a five times higher mass load in the wet-weather sample.
The mass load of BTR is doubled in the wet-weather sample, which can be explained by a load overlap in the CSS like for the pharmaceuticals. The high mass load results from the widespread use of BTR in households and industry. Fifty percent of the wastewater volume at the WWTP Mannheim is from industry, which is, as domestic wastewater, independent of the weather conditions. The mass loads of the other industrial chemicals follow a similar trend.
The two herbicides TBY and MCP show different ratios. The mass load of TBY is four times higher during wet weather compared to dry weather, and the mass load of MCP is 25 times higher. Organophosphorus compounds such as TCEP, TCPP, and TDCPP demonstrated wet-dry-weather ratios between 2 and 7. The mass loads of the insect repellents ICN and DEET are 3 to 5 times higher during wet weather.

3.6. Removal of Micropollutants

The OMP removal performance is listed for PAC and GAC during DW and WW in Table 2. The OMPs are sorted by the DW inflow concentration in ascending order. OMP removal during DW is generally higher than in the WW samples, except for IBU, MET, and MCP. These micropollutants showed a higher inflow concentration during wet weather, which resulted in a better or similar removal performance compared to dry weather. During wet weather, the HRTs in the two treatment stages are reduced due to the higher inflow. HRTs reduced in the PAC treatment from 320 min to 130 min, and in the GAC filter from 24 min to 11–12 min. However, higher OMP concentrations at the effluent of the advanced treatment stages compared to OMP concentrations at the inflow resulted in negative OMP removals for IBU, SMX, and BT. Negative OMP removals of the two treatment stages occurred more frequently during WW conditions.
Taking all measured substances into account, the results during DW showed on average a higher removal (68% PAC and 62% GAC) than during WW (42% PAC and 46% GAC). The OMP removal of industrial chemicals, flame retardants, and DEET significantly decreased during WW in the PAC treatment. The corrosion inhibitors showed a decline of 26 percentage points. The OMP removal of the pharmaceuticals and the herbicides stayed nearly constant.
To better classify each removal performance and make a statement about the uncertainty of the measurements, the mean value and standard deviation of the OMP removal from the regular micropollutant analyses of the WWTP (48 h composite sample, DW, mf) from 2018 to 2020 are plotted in Figure 7 for some pharmaceuticals and the corrosion inhibitors. IBU was detected above the limit of quantification only three (GAC) and five times (PAC), respectively, in the effluent of the secondary clarifier. The comparison with the previous measurements illustrates that the removal in both treatment stages fluctuates during dry weather. The removal of the treatment stage with the PAC and GAC of the DW sampling performed is within the scatter range around the mean value. The exceptions are MET and IBU, which show a significantly lower removal in both additional treatment stages. IBS and CBZ show slightly higher removal when treated with PAC. Compared to the DW sampling, the removal of the WW sampling is worse for almost all shown substances in both purification stages. Nevertheless, in the PAC treatment the removals of four substances (IBU, BTR, MBTR, IBS) are within the scatter around the mean value during WW and for GAC with six substances (IBU, CST, BTR, MBTR, IBS, CBZ) even more. The removal of these substances is not influenced by the WW.
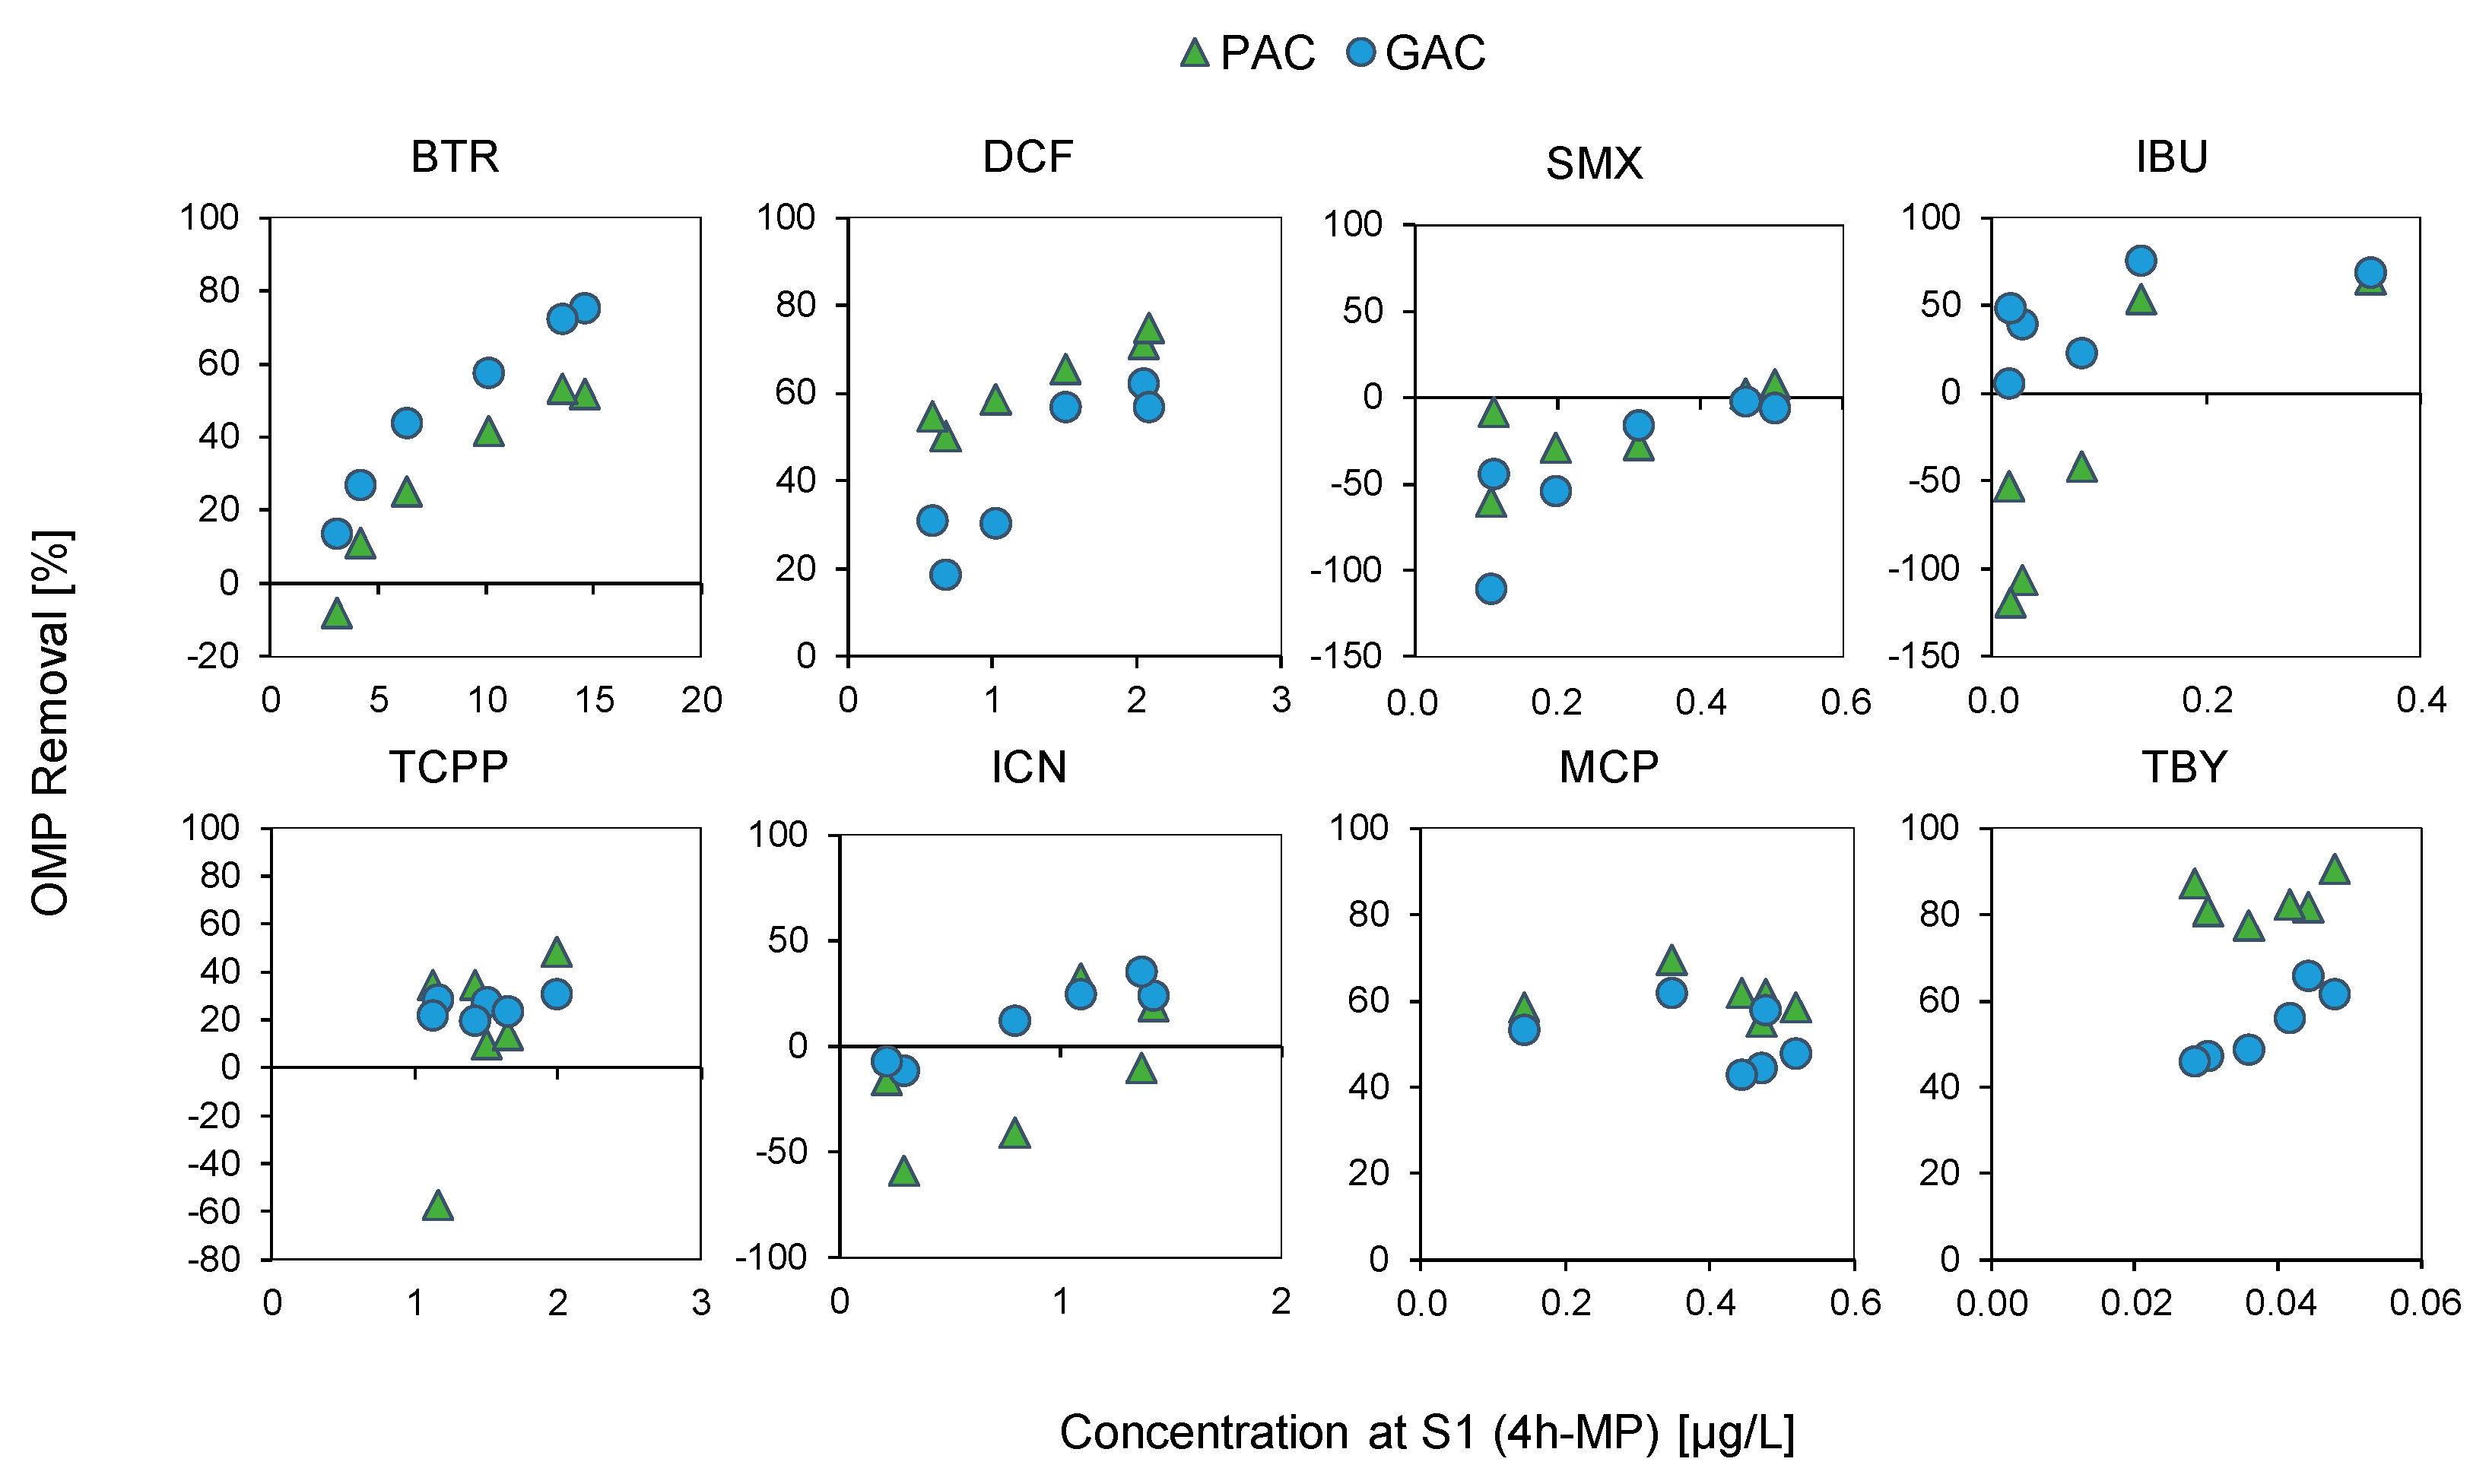
With the high-resolution WW sampling (WW2) we were able to investigate the influence of the inflow concentration on the removal of selected OMPs in both advanced treatment stages. The monitoring results are shown in Figure 8 for selected OMPs. Diagrams for the other OMPs can be found in Figure A3 in Appendix A. Figure 8 shows the dependency of OMP removal on the inflow concentration. Considering the concentrations shown in Figure 5, all OMPs except MCP have the lowest concentration at S1 in the last sample because of dilution effects. The lowest concentration of MCP is in the first sample because of its entry path. MCP is a rainwater-borne OMP that leaches out from surfaces, e.g., from roof felts, causing a delay effect during sampling. Since surface leaching depends on the intensity and duration of the rain, it may take up to several hours until higher amounts of MCP enter the CSS and the WWTP. However, lower inflow concentrations result in lower OMP removal for all shown OMPs, except TCPP, MCP, and TBY. These substances are in their adsorption equilibrium and the removal is not affected by the inflow concentration and is nearly constant.
The OMPs showed different removal behaviour for both processes. BTR, IBU, and ICN showed a better removal with GAC, whereas DCF, MCP, and TBY were better removed with PAC. SMX and TCPP showed similar removal behaviour for GAC and PAC. This behaviour is due to the different properties of the two activated carbon products and the two different processes.

4. Discussion

4.1. Main Findings

4.1.1. OMP Concentrations

The concentrations of 26 OMPs in the effluent of the secondary clarifier of the WWTP Mannheim differed at WW from the wastewater composition at DW. However, OMP concentrations at DW were in a similar range compared to the DW concentrations found in the literature [14,16,19,30]. Concentrations of fifteen micropollutants were higher in the dry-weather sample than in both wet-weather samples. The lower concentrations during wet weather can be explained by the dilution of the wastewater volume caused by higher inflows through the rain. The higher concentration of OMPs in the wet-weather samples are caused by effects such as leaching from surfaces and poorer biodegradation in the biological treatment stage due to shorter hydraulic retention. Interestingly, the ratio of wastewater volume dilution in our samples did not correspond to the ratio of concentration dilution, indicating the decoupling of concentration and hydraulic flow.
The concentrations of BTR and MBTR were up to a hundred times higher compared to micropollutants such as IBU or TBY. This illustrates the immense use of those two corrosion inhibitors, for example, in industry or dishwasher tabs [31]. Our observations regarding the concentration of MTBT are in line with other studies, which already showed that MTBT is present in wastewater from industry and in urban runoff [32,33]. The variation of the concentration depends on the wet-weather flow because it is washed off, for example, from the streets. Consequently, the discharge of MTBT thus depends on the duration and intensity of the rain and the surface area on which the rain falls. Rainwater-born substances such as MCP show up to six times higher concentrations in the WW sample caused by its entry path such as leaching out from surfaces by rain. Other studies already showed that MCP is an indicator of urban runoff, confirming our observations [34]. For TBY, we observed only minor differences in our samples. TBY is used, for example, in wall paints or coatings as a herbicide and leaches out during rain [35]. Since the concentrations between DW and WW did not differ by much, there must also be a source from municipal wastewater.
IBU showed a very low concentration in the dry-weather sample of 7 ng/L, which confirms the good biodegradability of this substance [36,37]. Due to the poorer biodegradation in the biological treatment stage caused by shorter hydraulic retention times on rainy days, concentrations of this substance were up to 12–15 times higher during wet weather.
On the other hand, concentrations of wastewater-born OMPs such as pharmaceutical residues or industrial chemicals were lower in the wet-weather samples caused by dilution effects. The concentrations of the investigated OMPs in the effluent of the secondary clarifier covered a very wide range and were subject to different impacts of rainwater. Furthermore, the high-resolution measurement of OMP concentration in wastewater effluent showed how complex and variable a rain event is. The dynamic of the OMP concentrations depend on the entry path of each OMP, degradation during biological treatment stages, and on the implemented OMP treatment process (PAC, GAC). Hence, our results demonstrated the importance of monitoring OMPs during wet weather from different substance groups, in order to generate relevant information to further improve the OMP removal performance.
The high-resolution sampling during WW showed that OMPs behave differently in advanced treatment stages with activated carbon, which is caused by different physical and chemical properties and by different entry paths at various times. The concentration pattern of some OMPs did not change after the advanced treatment, only the absolute values decreased due to the adsorption processes. Based on the concentration patterns, conclusions can be drawn about the input pathway and similar substance properties of some OMPs.

4.1.2. OMP Mass Loads

During wet-weather conditions, the daily mass load of all OMPs is higher compared to dry weather at the three sampling points. Hence, the approximately four times higher inflow to the WWTP has a bigger impact on the mass load than the lower concentrations during wet weather caused by dilution. For instance, the load of MCP was 25 times higher during wet weather in the effluent of the biological treatment stage than under dry-weather conditions. Since MCP is a herbicide, we also expect that it is mainly introduced into the sewer system during wet-weather conditions. Our observations are in line with a study from Roskilde (Denmark), which could detect MCP only during wet-weather conditions [38]. However, according to Launay et al. (2016), mass loads of wastewater-borne micropollutants are almost the same under dry- and wet-weather conditions at the inflow of a WWTP. Differences are only caused by the specific time of the rain event [21]. Therefore, it can be assumed that the OMPs originate from wastewater if the ratio of wet-weather and dry-weather mass loads in the inflow of the WWTP is about 1, because the wastewater load does not change in response to weather conditions. In the effluent of the WWTP, this ratio shifts to a larger value due to poorer biodegradation performance in the biological treatment and poorer solids retention resulting from the shorter residence time during wet weather [32]. In other words, higher inflow volumes lead to shorter HRT, which results in poorer biodegradation rates during wet-weather flows. Another source for the higher loads during wet weather in our results could be the length of the sewer system. During rain events, the retention times of wastewater-born micropollutants are shortened in the CSS, which can lead to an overlap of loads with the previous dry-weather hours. This results in higher wastewater-borne OMP loads at the WWTP influent during the first hours of a flow rate increase.
Furthermore, we observed different impacts of the rain events on some OMPs within the same group of substances. For example, dry-weather mass loads for the herbicides TBY and MCP were in a similar range, while wet-weather mass loads were four times higher for TBY and even 25 times higher for MCP. Although both herbicides are used in wall paints and leached from facades during WW [35,39], MCP mass loads have been significantly higher. This might be an indicator that leaching from facades during WW is not the main source for TBY, which is similar to results found at WWTP Regensdorf [40].
However, the higher mass load discharge during WW shows that the OMP emission into receiving water is rarely underestimated if only DW sampling is taken into account.

4.1.3. Removal Efficiency

In our case study, the OMP removal performance was generally higher for the DW samples than for the WW samples, except for IBU, MET, and MCP, due to their higher inflow concentration during wet weather. To achieve a constant removal efficiency of at least 80%, process control faces a few challenges related to impact factors, which we would like to briefly discuss in this section.
Thus, it must be considered that the higher inflow during wet weather reduced the HRTs in the two treatment stages from 320 min to 130 min in the PAC treatment and from 24 min to 11 min in the GAC filter. This might influence the adsorption equilibrium and result in poorer removals for some OMPs.
Further to the physio-chemical properties of the OMPs, their removal also depends on the activated carbon product used and the dosed PAC quantity or the already enforced bed volumes of the GAC filter. In the treatment with PAC, a higher OMP concentration in the effluent can occur due to worse particle retention because of the shorter HRT. An increase in the turbidity values in the samples in both the inlet and outlet of the treatment stage with PAC supports this assumption. In addition, the samples were taken without time offset. In our study, the long HRT (130 min) might have led to an offset of the corresponding samples, which means that the inlet and outlet samples do not match exactly. The sampling time was four hours, so the overlap of the inflow and outflow samples was 110 min.
In both process stages (PAC and GAC), the change of the inlet matrix can also lead to shifts in the adsorption equilibrium on the activated carbon, resulting in the desorption of substances that bind weakly to activated carbon. Reif et al. (2020) could show GAC filters in pilot-scale desorption effects due to changes in the inflow concentration [41].
The removal in both treatment stages was higher during DW than WW for almost all OMPs. The high-resolution sampling during WW permitted us to evaluate the impact of inflow concentrations on OMP removal dynamics. For most of the selected pharmaceuticals, corrosion inhibitors, TBY, and ICN, higher inflow concentrations led to higher removal rates in both activated carbon processes. The dilution of the inflow concentration during WW leads to a decrease in the OMP removal.
The investigated OMPs demonstrated different removal performances for both processes (GAC and PAC) related to impact factors such as HRT, feed concentration, pH, temperature, and different properties of the two activated carbon products. Hence, to increase the removal efficiency, different parameters must be considered, for example, the OMP properties, the activated carbon used, the process itself, and the inflow concentration. However, our results provided a first insight into the removal performance of micropollutants during wet-weather conditions in an advanced treatment stage on a full-scale WWTP.

4.2. Limitations and Critical Remarks

The findings of our case study are subject to some limitations concerning the study design (full-scale WWTP) and data quality. We acknowledge that external influences on the sample taking could not be controlled or predicted, such as the number and intensity of rain events. For example, Mannheim had a total of 675 h of rain in 2019, which is the main limiting factor of our study. In addition, our investigation was related to the substantial temporal expenditures of each sample (24 h samples), analytical costs, and personnel efforts, which made it even more challenging to conduct experiments. To keep the effort for examining within a feasible and, in particular, proportionate financial effort with the desired knowledge gain, we decided to compare three samplings during dry and wet weather. Consequently, our results do not provide information regarding seasonal influences and cannot be generalised to all rain events at the investigated wastewater treatment plant in Mannheim. Nevertheless, we met the objectives of our case study by presenting important insights regarding the impact of rain events on the OMP removal performance with activated carbon, which led to possible consequences not only for the monitoring, but also for the process control. Hence, due to reduced OMP removal and higher mass loads, our findings clearly indicate the relevance and need to monitor the micropollutant removal during wet-weather conditions. Guillossou et al. (2019) also sampled one rain event, which showed no impact on the biological treatment, but OMP removal decreased despite identical hydraulic conditions and activated carbon dosages. Schachtler et al. (2020) come to similar conclusions but point out that it must be discussed whether the elimination performance of 80% must always be met in the case of heavy rainfall, which occurs in Switzerland on 3 to 6% of days per year. Although this can be realised by increasing the ozone dose, it must be questioned whether this is always appropriate.
However, since influences on the removal of micropollutants during wet-weather conditions have rarely been studied, it is difficult to verify our findings and data quality for GAC and PAC against other literature. The collected data thus represent a starting point to improve monitoring approaches and removal efficiency in the future.

4.3. Future Research

Considering the described limitations of our study, future research is needed to overcome existing knowledge gaps and weaknesses related to our study design. For instance, we used a relatively small number of samplings to keep the financial expenditures for the conduction of experiments, and in particular, for the analytical costs within feasible limits. Hence, additional measurements are needed to describe seasonal influences and provide evidence regarding the removal behaviour of activated carbon processes during different types of wet weather and rain events.
The operation of a WWTP, and in particular, process control, are confronted with the practical problem of how to achieve a constant removal efficiency of at least 80% under all weather conditions. To address this issue, a precondition is to identify appropriate monitoring approaches to control operational processes. In this regard, monitoring of the removal efficiency should be carried out on a daily basis, e.g., by using robust online detectors or easy-to-operate test systems. Wunderlin et al. (2017) identified several methods with high potential for the daily monitoring of the OMP removal performance of advanced treatment processes [42]. These include UV absorbance at 254 nm for both ozonation and activated carbon systems, as well as COD and DOC removal at an activated carbon stage. However, treatments with PAC and GAC have not been investigated by other literature in this regard. To improve the process control of OMP removal, some measures can be derived from the observations made in our case study. We observed, for example, that the removal efficiency decreases at some point during rain events. Hence, it would be suitable to mitigate this effect by increasing the PAC dose or by prolonging the EBCT from the GAC filter with additional filter cells. However, to ensure a constant removal efficiency it is necessary to control the implemented measures during the process or to identify the setting options for an optimal modus operandi. Considering that the sample taking and OMP analytics might be very expensive for continuous monitoring, the efforts and expenditures might not correlate with the desired result of a significantly improved removal performance. One feasible approach could be the identification of correlations between relevant parameters, e.g., rain intensity, SAC254, and PAC dosage. For instance, future research could investigate the correlation between wastewater inflow rates (rain intensity), the flexible dosage of PAC, and its effects on the removal efficiency. Such an approach could result in recommendations for different modus operandi and the process control of OMP removal without the need for real-time monitoring.
However, on the road to equipping a larger number of WWTPs in Europe with an advanced treatment stage, individual influences and conditions must be considered. Finally, it can be stated that there is still a substantial need for research concerning the behaviour of micropollutants in wastewater streams.

5. Conclusions

The results of our case study have shown that wet-weather conditions might have significant influences on the removal of micropollutants. The monitored OMPs showed higher mass loads during wet weather at all sampling points. As a result of shortened hydraulic retention time (HRT) due to rain events, the mean removal of the investigated OMPs was reduced significantly during wet-weather conditions (42% PAC and 46% GAC) compared to dry-weather conditions (68% PAC and 62% GAC). This illustrates the need to further investigate wet-weather influences, especially concerning process control aimed at achieving constant removal performances during all weather conditions. The findings of our study provide a first depiction of the removal of micropollutants at an advanced stage of a WWTP for GAC and PAC. To gain a better understanding of OMP removal performances and to implement improved process control, we aim to overcome the limitations and small sample sizes in future studies by extending the approach to a higher number of WWTPs. For this purpose, we are currently conducting additional monitoring studies during dry and wet weather.

Author Contributions

Conceptualization, J.N.; Data curation, J.N.; Funding acquisition, J.N. and M.A.L.; Investigation, J.N.; Methodology, J.N.; Project administration, J.N.; Resources, M.A.L.; Supervision, M.A.L.; Validation, D.L. and M.A.L.; Visualization, J.N.; Writing—original draft, J.N.; Writing—review and editing, D.L. and M.A.L. All authors have read and agreed to the published version of the manuscript.

Funding

The research was funded by Eigenbetrieb Stadtentwässerung Mannheim.

Institutional Review Board Statement

Not applicable.

Informed Consent Statement

Not applicable.

Data Availability Statement

Not applicable.

Acknowledgments

These investigations were carried out as part of a project between EBS Mannheim and the Kompetenzzentrum Spurenstoffe Baden-Württemberg. The authors acknowledge the head of the WWTP Alexander Mauritz and the technical and laboratory staff of the WWTP Mannheim for their cooperation during the study. Thanks to Ann-Katrin Fischer for coordinating the monitoring campaigns during her master’s thesis. The authors would also like to thank the laboratory staff of the education and research laboratory of the Institute for Sanitary Engineering, Water Quality and Solid Waste Management (ISWA) at the University of Stuttgart.

Conflicts of Interest

The authors declare no conflict of interest.

Appendix A

Table A1. Analysed substances.
No.GroupSubstanceAbbreviationCAS
1PharmaceuticalCandesartanCST139481-59-7
2CarbamazepineCBZ298-46-4
3DiclofenacDCF15307-86-5
4GabapentinGBN60142-96-3
5HydrochlorothiazideHYC58-93-5
6IbuprofenIBF15687-27-1
7IrbesartanIBS138402-11-6
8LidocaineLCN137-58-6
9MetoprololMET51384-51-1
10NaproxenNPX22204-53-1
11SulfamethoxazoleSMX723-46-6
12VenlafaxineVLX93413-69-5
13FoodCaffeineCAF58-08-2
14Corrosion inhibitor1H-benzotriazoleBTR95-14-7
15TolyltriazoleMBTR29385-43-1
16Industrial chemical4-nonylphenol4NP104-40-5
17BenzothiazoleBT95-16-9
182-MethylthiobenzothiazoleMTBT615-22-5
192,4,7,9-Tetramethyl-5-decyn-4,7-diolTMDD126-86-3
20Flame retardantTris(2-chlorethyl)phosphateTCEP115-96-8
21Tris(2-chlorisopropyl)phosphateTCPP13674-84-5
22Tris(1,3-dichlorisopropyl)phosphateTDCPP13674-87-8
23Insect repellentIcaridinICN119515-38-7
24DiethyltoluamideDEET134-62-3
25HerbicideMecopropMCP93-65-2
26TerbutrynTBY886-50-0
Figure A1. Concentrations of 23 organic micropollutants of dry- (n = 1) and wet-weather sampling (n = 2) at the effluent of PAC (S2).
Water 14 03281 g0a1
Figure A2. Concentrations of 23 organic micropollutants of dry- (n = 1) and wet-weather sampling (n = 2) at the effluent of the GAC filter (S3).
Water 14 03281 g0a2
Figure A3. OMP removal in dependence of the inflow concentration (S1) for the treatment stages with PAC and GAC for WW2, QPAC = 1402−1988 L/s, QGAC = 141−181 L/s.
Water 14 03281 g0a3

References

  1. Brunsch, A.F. Mass flow analysis for anthropogenic micropollutants as performed in the Swist river catchment. Water Pollut. 2014, 182, 87–98. [Google Scholar] [CrossRef] [Green Version]
  2. Eggen, R.I.L.; Hollender, J.; Joss, A.; Schärer, M.; Stamm, C. Reducing the discharge of micropollutants in the aquatic environment: The benefits of upgrading wastewater treatment plants. Environ. Sci. Technol. 2014, 48, 7683–7689. [Google Scholar] [CrossRef] [PubMed]
  3. Luo, Y.; Guo, W.; Ngo, H.H.; Nghiem, L.D.; Hai, F.I.; Zhang, J.; Liang, S.; Wang, X.C. A review on the occurrence of micropollutants in the aquatic environment and their fate and removal during wastewater treatment. Sci. Total Environ. 2014, 473–474, 619–641. [Google Scholar] [CrossRef] [PubMed]
  4. European Union. Directive 2000/60/EC of the European Parliament and of the Council of 23 October 2000 Establishing a Framework for Community Action in the Field of Water Policy. 2000. Available online: https://eur-lex.europa.eu/legal-content/en/ALL/?uri=CELEX%3A32000L0060 (accessed on 3 October 2022).
  5. United Nations. The 2030 Agenda and the Sustainable Development Goals: An opportunity for Latin America and the Caribbean; United Nations ECLAC: Santiago, Chile, 2018; ISBN 978-92-1-058644-3.
  6. Stockhaus, H.; Stein, U.; Meinecke, L.F.; Gerstetter, C.; Bodle, R.; Vidaurre, R.; Holmes, A.; Bueb, B.; Hundegger, S. Potenziale anderer Rechtsbereiche zum Erreichen der Ziele der Wasserrahmenrichtlinie: TEXTE 72/2021. In Ressortforschungsplan des Bundesministerium für Umwelt, Naturschutz und nukleare Sicherheit; Forschungskennzahl 3718242100; FB000404; Umweltbundesamt: Dessau-Roßlau, Germany, 2021. [Google Scholar]
  7. Pistocchi, A.; Alygizakis, N.A.; Brack, W.; Boxall, A.; Cousins, I.T.; Drewes, J.E.; Finckh, S.; Gallé, T.; Launay, M.A.; McLachlan, M.S.; et al. European scale assessment of the potential of ozonation and activated carbon treatment to reduce micropollutant emissions with wastewater. Sci. Total Environ. 2022, 848, 157124. [Google Scholar] [CrossRef] [PubMed]
  8. Barjenbruch, M.; Sens, K.; Schüler, R.; Stapf, M. Entfernung von Spurenstoffen–Handreichung für Betreiber von Kläranlagen. Available online: https://www.dwa-no.de/files/_media/content/PDFs/LV_Nord-Ost/Internationale_Projekte/2020_Entfernung%20von%20Spurenstoffen%20-%20Handreichung%20f%C3%BCr%20KA-Betreiber.pdf (accessed on 3 October 2022).
  9. Kompetenzzentrum Spurenstoffe Baden-Württemberg. Kläranlagenausbau in Baden-Württemberg–Aktueller Stand. Available online: https://koms-bw.de/klaeranlagen/uebersichtskarte/ (accessed on 3 October 2022).
  10. Ministerium für Umwelt, Klima und Energiewirtschaft Baden-Württemberg. Arbeitspapier Spurenstoffelimination auf Arbeitspapier Spurenstoffelimination auf Kommunalen Kläranlagen in Baden-Württemberg. Available online: https://um.baden-wuerttemberg.de/fileadmin/redaktion/m-um/intern/Dateien/Dokumente/3_Umwelt/Wasser/210614-Arbeitspapier-Spurenstoffelimination-kommunale-Klaeranlagen-barrierefrei.pdf (accessed on 3 October 2022).
  11. ARA Ausbau. Platform for Process Engineering of Micropollutants: Status Quo. Available online: https://micropoll.ch/ara-ausbau/ (accessed on 3 October 2022).
  12. Pistocchi, A.; Andersen, H.R.; Bertanza, G.; Brander, A.; Choubert, J.M.; Cimbritz, M.; Drewes, J.E.; Koehler, C.; Krampe, J.; Launay, M.; et al. Treatment of micropollutants in wastewater: Balancing effectiveness, costs and implications. Sci. Total Environ. 2022, 850, 157593. [Google Scholar] [CrossRef] [PubMed]
  13. Fundneider, T.; Acevedo Alonso, V.; Abbt-Braun, G.; Wick, A.; Albrecht, D.; Lackner, S. Empty bed contact time: The key for micropollutant removal in activated carbon filters. Water Res. 2020, 191, 116765. [Google Scholar] [CrossRef] [PubMed]
  14. Margot, J.; Kienle, C.; Magnet, A.; Weil, M.; Rossi, L.; de Alencastro, L.F.; Abegglen, C.; Thonney, D.; Chèvre, N.; Schärer, M.; et al. Treatment of micropollutants in municipal wastewater: Ozone or powdered activated carbon? Sci. Total Environ. 2013, 461–462, 480–498. [Google Scholar] [CrossRef]
  15. Benstoem, F.; Nahrstedt, A.; Boehler, M.; Knopp, G.; Montag, D.; Siegrist, H.; Pinnekamp, J. Performance of granular activated carbon to remove micropollutants from municipal wastewater—A meta-analysis of pilot- and large-scale studies. Chemosphere 2017, 185, 105–118. [Google Scholar] [CrossRef]
  16. Mailler, R.; Gasperi, J.; Coquet, Y.; Deshayes, S.; Zedek, S.; Cren-Olivé, C.; Cartiser, N.; Eudes, V.; Bressy, A.; Caupos, E.; et al. Study of a large scale powdered activated carbon pilot: Removals of a wide range of emerging and priority micropollutants from wastewater treatment plant effluents. Water Res. 2015, 72, 315–330. [Google Scholar] [CrossRef] [Green Version]
  17. Mailler, R.; Gasperi, J.; Coquet, Y.; Buleté, A.; Vulliet, E.; Deshayes, S.; Zedek, S.; Mirande-Bret, C.; Eudes, V.; Bressy, A.; et al. Removal of a wide range of emerging pollutants from wastewater treatment plant discharges by micro-grain activated carbon in fluidized bed as tertiary treatment at large pilot scale. Sci. Total Environ. 2016, 542, 983–996. [Google Scholar] [CrossRef]
  18. Zietzschmann, F.; Stützer, C.; Jekel, M. Granular activated carbon adsorption of organic micro-pollutants in drinking water and treated wastewater—Aligning breakthrough curves and capacities. Water Res. 2016, 92, 180–187. [Google Scholar] [CrossRef] [PubMed]
  19. Guillossou, R.; Le Roux, J.; Mailler, R.; Vulliet, E.; Morlay, C.; Nauleau, F.; Gasperi, J.; Rocher, V. Organic micropollutants in a large wastewater treatment plant: What are the benefits of an advanced treatment by activated carbon adsorption in comparison to conventional treatment? Chemosphere 2019, 218, 1050–1060. [Google Scholar] [CrossRef] [PubMed]
  20. Schachtler, M.; Otto, J.; Thomann, M. Spurenstoffelimination bei Regenwetter: Wie bei Regenwetter eine Konstante Abbauleistung mit Ozon Erreicht Werden Kann. Aqua Gas N°2 2020, 20–25. Available online: https://micropoll.ch/Mediathek/spurenstoffelimination-bei-regenwetter/ (accessed on 3 October 2022).
  21. Launay, M.A.; Dittmer, U.; Steinmetz, H. Organic micropollutants discharged by combined sewer overflows–Characterisation of pollutant sources and stormwater-related processes. Water Res. 2016, 104, 82–92. [Google Scholar] [CrossRef]
  22. Gasperi, J.; Zgheib, S.; Cladière, M.; Rocher, V.; Moilleron, R.; Chebbo, G. Priority pollutants in urban stormwater: Part 2—Case of combined sewers. Water Res. 2012, 46, 6693–6703. [Google Scholar] [CrossRef] [PubMed] [Green Version]
  23. Dittmer, U.; Bachmann-Machnik, A.; Launay, M.A. Impact of Combined Sewer Systems on the Quality of Urban Streams: Frequency and Duration of Elevated Micropollutant Concentrations. Water 2020, 12, 850. [Google Scholar] [CrossRef] [Green Version]
  24. Stadt Mannheim. Präsentation Stadtententwässerung Mannheim. Available online: https://www.mannheim.de/sites/default/files/2017-11/EBS-Pr%C3%A4sentation_3.pdf (accessed on 3 October 2022).
  25. Metzger, S.; Alt, K.; Benstoem, F.; Biebersdorf, N.; Boehler, M.; Bornemann, C.; Fundneider, T.; Hauff, R.; Jedele, K.; Jekel, M.; et al. Spurenstoffentfernung auf Kommunalen Kläranlagen–Teil 2: Einsatz von Aktivkohle–Verfahrensgrundsätze und Bemessung; Deutsche Vereinigung für Wasserwirtschaft, Abwasser und Abfall e.V. (DWA): Hennef, Germany, 2021. [Google Scholar]
  26. Kompetenzzentrum Spurenstoffe Baden-Württemberg. Handlungsempfehlung für die Vergleichskontrolle und den Betrieb von Verfahrenstechniken zur Gezielten Spurenstoffelimination; Kompetenzzentrum Spurenstoffe Baden-Württemberg: Stuttgart, Germany, 2018. [Google Scholar]
  27. de Ridder, D.J.; MCConville, M.; Verliefde, A.R.D.; van der Aa, L.T.J.; Heijman, S.G.J.; Verberk, J.Q.J.C.; Rietveld, L.C.; van Dijk, J.C. Development of a predictive model to determine micropollutant removal using granular activated carbon. Drink. Water Eng. Sci. 2009, 2, 57–62. [Google Scholar] [CrossRef] [Green Version]
  28. Rößler, A.; Metzger, S. Application of SAC254 measurement for the assessment of micropollutant removal in the adsorptive treatment stage of a municipal wastewater treatment plant. Water Pract. Technol. 2016, 11, 503–515. [Google Scholar] [CrossRef] [Green Version]
  29. Guillossou, R.; Le Roux, J.; Mailler, R.; Morlay, C.; Vulliet, E.; Nauleau, F.; Rocher, V.; Gasperi, J. Influence of the properties of 7 micro-grain activated carbons on organic micropollutants removal from wastewater effluent. Chemosphere 2020, 243, 125306. [Google Scholar] [CrossRef]
  30. Loos, R.; Carvalho, R.; António, D.C.; Comero, S.; Locoro, G.; Tavazzi, S.; Paracchini, B.; Ghiani, M.; Lettieri, T.; Blaha, L.; et al. EU-wide monitoring survey on emerging polar organic contaminants in wastewater treatment plant effluents. Water Res. 2013, 47, 6475–6487. [Google Scholar] [CrossRef]
  31. Vetter, W.; Lorenz, J. Determination of benzotriazoles in dishwasher tabs from Germany and estimation of the discharge into German waters. Environ. Sci. Pollut. Res. Int. 2013, 20, 4435–4440. [Google Scholar] [CrossRef]
  32. Launay, M.A. Organic Micropollutants in Urban Wastewater Systems during Dry and Wet Weather-Occurence, Spatio-Temporal Distribution and Emissions to Surface Waters. Doctoral Thesis, Universität Stuttgart, Stuttgart, Germany, 2017. [Google Scholar]
  33. Jover, E.; Matamoros, V.; Bayona, J.M. Characterization of benzothiazoles, benzotriazoles and benzosulfonamides in aqueous matrixes by solid-phase extraction followed by comprehensive two-dimensional gas chromatography coupled to time-of-flight mass spectrometry. J. Chromatogr. A 2009, 1216, 4013–4019. [Google Scholar] [CrossRef] [PubMed]
  34. Warner, W.; Licha, T.; Nödler, K. Qualitative and quantitative use of micropollutants as source and process indicators. A review. Sci. Total Environ. 2019, 686, 75–89. [Google Scholar] [CrossRef] [PubMed]
  35. Luft, A.; Wagner, M.; Ternes, T.A. Transformation of biocides irgarol and terbutryn in the biological wastewater treatment. Environ. Sci. Technol. 2014, 48, 244–254. [Google Scholar] [CrossRef]
  36. Joss, A.; Zabczynski, S.; Göbel, A.; Hoffmann, B.; Löffler, D.; McArdell, C.S.; Ternes, T.A.; Thomsen, A.; Siegrist, H. Biological degradation of pharmaceuticals in municipal wastewater treatment: Proposing a classification scheme. Water Res. 2006, 40, 1686–1696. [Google Scholar] [CrossRef]
  37. Yu, J.T.; Bouwer, E.J.; Coelhan, M. Occurrence and biodegradability studies of selected pharmaceuticals and personal care products in sewage effluent. Agric. Water Manag. 2006, 86, 72–80. [Google Scholar] [CrossRef]
  38. Bollmann, U.E.; Tang, C.; Eriksson, E.; Jönsson, K.; Vollertsen, J.; Bester, K. Biocides in urban wastewater treatment plant influent at dry and wet weather: Concentrations, mass flows and possible sources. Water Res. 2014, 60, 64–74. [Google Scholar] [CrossRef]
  39. Burkhardt, M.; Kupper, T.; Hean, S.; Haag, R.; Schmid, P.; Kohler, M.; Boller, M. Biocides used in building materials and their leaching behavior to sewer systems. Water Sci. Technol. 2007, 56, 63–67. [Google Scholar] [CrossRef]
  40. Singer, H.; Jaus, S.; Hanke, I.; Lück, A.; Hollender, J.; Alder, A.C. Determination of biocides and pesticides by on-line solid phase extraction coupled with mass spectrometry and their behaviour in wastewater and surface water. Environ. Pollut. 2010, 158, 3054–3064. [Google Scholar] [CrossRef]
  41. Reif, D.; Saracevic, E.; Šabić Runjavec, M.; Haslinger, J.; Schaar, H.; Kreuzinger, N. Desorption of Organic Micropollutants from Loaded Granular Activated Carbon. Water 2020, 12, 2754. [Google Scholar] [CrossRef]
  42. Wunderlin, P.; Rensch, D.; Abegglen, C.; Dominguez, D.; Egli, C.; LeGoaziou, Y.; Schachtler, M.; Pfund, D.; Urfer, D.; Thonney, D.; et al. Konzepte zur Überwachung der Reinigungsleistung von weitergehenden Verfahren zur Spurenstoffelimination. Available online: https://micropoll.ch/wp-content/uploads/2020/06/2017_VSA_F_Konzepte-zur-%C3%9Cberwachung-der-_d.pdf (accessed on 3 October 2022).
Figure 1. Flow chart of WWTP Mannheim and sampling points (S1, S2 and S3).
Water 14 03281 g001
Figure 2. Conditions during WW and DW samplings performed in June and September 2019: (a) Q/Qmax as an indicator for the dilution (Qmax = 4000 L/s); (b) ratio of HRTmin/HRT for both additional treatment stages with activated carbon; (c) removal of SAC254 for PAC and GAC; (d) course of the turbidity for PAC and GAC; and (e) dry matter content in the PAC treatment.
Water 14 03281 g002
Figure 3. Phase distribution of wet-weather sampling WW1 for S1 for 23 OMPs.
Water 14 03281 g003
Figure 4. Concentrations of 23 organic micropollutants of dry- (n = 1) and wet-weather sampling (n = 2) at the effluent of the secondary clarifier (S1).
Water 14 03281 g004
Figure 5. Q/Qmax and concentrations over time for the three sampling points during the rain event WW2 for several OMPs.
Water 14 03281 g005
Figure 6. Comparison of the daily mass load related to the population equivalent (PE) per day of OMPs at dry-weather conditions with the mass load at wet-weather conditions WW2 for (a) effluent of the secondary clarifier, (b) effluent of powdered activated carbon treatment stage and (c) effluent of granular activated carbon filter, calculated with the flow rate at S1.
Water 14 03281 g006
Figure 7. Mean OMP removal and standard deviation of nine regularly measured (n = 26) micropollutants at the WWTP compared to the removal of the measurement campaigns (DW, WW) for PAC treatment (a) and GAC filter (b). (SMX is not plotted in the figure because removal values were mostly negative. Considering the determination limit of 5 ng/L, negative removal values for IBU can be explained by measurement uncertainties. It is likely that measurement sensitivity reaches detection limits in the very low nanogram range.)
Water 14 03281 g007
Figure 8. OMP removal of selected OMPs in dependence of the inflow concentration (S1) for the treatment stages with PAC and GAC for WW2, QPAC = 1402–1988 L/s, QGAC = 141–181 L/s.
Water 14 03281 g008
Table 1. Standard wastewater parameters of the samples during dry weather (DW) and wet weather WW1 and WW2.
Sample NumberUnitDWWW1WW2_1WW2_2WW2_3WW2_4WW2_5WW2_6
date in 2019 5/6 September11 June7 September8 September8 September8 September8 September8 September
time 0:00–23:590:00–23:5920:00–23:590:00–3:594:00–7:598:00–11:5912:00–15:5916:00–19:59
effluent secondary clarifier S1
pH--7.78.07.97.87.77.67.8
el. conductivityµS/cm-115015801440733516518419
turbidityNTU--212223
DOCmg/L8.338.809.138.987.736.165.204.92
SAC2541/m21.918.924.226.523.018.714.813.6
effluent PAC S2
pH--7.98.38.28.18.07.98.1
el. conductivityµS/cm-1220151014901270888645469
turbidityNTU--212221
DOCmg/L6.367.157.437.366.895.804.434.21
SAC2541/m14.514.916.718.017.614.311.29.10
effluent GAC S3
pH--8.18.48.48.38.28.18.0
el. conductivityµS/cm-115015801540-800576437
turbidityNTU--17-1<1<1
DOCmg/L7.176.967.878.185.276.645.324.42
SAC2541/m17.515.819.321.318.317.014.112.4
Table 2. OMP removal in % calculated from concentrations at SC and after activated carbon treatment (PAC and GAC) under DW (n = 1) and WW (n = 2) conditions; WW is the average removal calculated from WW1 and WW2; removal ≤ 30% = orange, 30% < removal ≤ 70% = yellow; removal > 70% = green.
PAC 1,3GAC 2,3
DWWWDWWW
IBU−1840−2844
TBY90836762
MCP44574454
DEET79276744
TDCPP89578869
LCN89779076
IBS90746251
TCEP46136950
SMX13−52−6−52
NPX87749376
VLX87738668
MTBT49438562
CBZ88756854
GAB56344328
BT87−357732
MET64702567
HYC84698372
DCF83568036
CST59322514
TCPP85367821
TMDD5926316
BTR72427865
MBTR83638058
pharmaceuticals (12)65525244
corrosion inhibitors (2)78527961
industrial chemicals (3)6537536
flame retardants (3)73357847
herbicides (2)67705658
insect repellent (1)79276744
Notes: 1 PAC: dose = 0.8–0.9 mg PAC/mg DOC; 2 GAC: CUR = 2.9–3.8 mg GAC/mg DOC; 1 HRTPAC = 130 min (contact reactor + sedimentation tank); 2 EBCT = 11–12 min (GAC filter). 3 The negative removal of IBU results from the low concentrations of 7 ng/L (S1) and 8 ng/L (S2 and S3). The deviation of 1 ng/L leads to a negative removal but is negligible due to measurement uncertainty. SMX adsorbs only poorly on activated carbon which can result in desorption. This can lead to higher outflow concentrations, and thus, to negative removal. The negative removal of BT can be a result of the time offset not being taken into account during the sampling.
Publisher’s Note: MDPI stays neutral with regard to jurisdictional claims in published maps and institutional affiliations.