Article

Reliability of Using Meteorological Data to Estimate Upwelling Events on the Galician Coast

by
Raquel Pérez-Orozco
1,*,
Javier López-Gómez
1,
Pablo Eguía-Oller
1,
Jesús López-Pérez
2,
Rosario de la Huz
2,
Enrique Granada-Álvarez
3 and
Rodrigo Cerviño-Rodríguez
3
1
CINTECX, Universidade de Vigo, Campus Lagoas-Marcosende, s/n, 36310 Vigo, Spain
2
Centro de Investigación Mariña, Universidade de Vigo, EcoCost, 36310 Vigo, Spain
3
Aguas de Rodas, Joaquín Lóriga 22 Entresuelo, 36203 Vigo, Spain
*
Author to whom correspondence should be addressed.
Water 2022, 14(21), 3387; https://doi.org/10.3390/w14213387
Submission received: 22 September 2022 / Revised: 20 October 2022 / Accepted: 22 October 2022 / Published: 26 October 2022
(This article belongs to the Special Issue Advances in Ocean Circulation Studies)

Abstract

:
This work is related to the growing interest in the identification of upwelling periods in the Galician SW coast, since these are linked to the great biodiversity and richness of its waters. This paper aims to assess the feasibility of using meteorological data for the estimation of upwelling events in a robust, reliable, real-time and low-cost way. For this purpose, the quality of meteorological data from eight land stations and five coastal buoys located in the surroundings of the study area has been evaluated. This process was made by confronting the result of the meteorological-derived upwelling index calculation against the values provided by two reference oceanic models. In addition, the availability of historical data series has also been considered to finally select the data source that best describes the upwelling phenomena in the Toralla area. The results show that, of the sources studied, those that best meet the criteria of wide data availability and good estimation of the upwelling index are the Ons and Sálvora land stations; therefore, the former was chosen as the main source and the latter as a support. Coastal buoys were discarded due to the uncertainty regarding the availability and access to meteorological data.

1. Introduction

Upwelling is an ocean-meteorological phenomenon in which the surface layers of the sea in the area closest to the coastline are dragged towards the open sea, due to the drag of the sea wind and the rotation of the planet. During upwelling episodes, water from the deeper layers of the continental shelf moves vertically and horizontally until it dominates or mixes with the coastal waters in the interior of the estuaries. This upwelling water normally occupies depths of between 60 and 450 m [1] and presents a higher salinity, lower temperature, and higher nutrient concentration than surface coastal waters [2]. Therefore, the renewal of the photic layer by providing an additional input of minerals and biomass that would normally tend to sink to the ocean depths is allowed. This extraordinary influx of nutrients is one of the fundamental factors explaining the high bio-productivity associated with upwelling areas. In fact, upwelling regions are usually linked to high levels of primary productivity, demonstrating their relevance as a major economic resource [3]. According to the literature [4,5,6], these areas represent 3% of the ocean area while their primary activity accounts for about 20% of the global fisheries production.
At the local level, the Galician coast stands out, which is located on the northwest littoral of the Iberian Peninsula, coinciding with the northern limit of the Canary Current upwelling ecosystem. Two defining particularities of this area are, on the one hand, a remarkable productivity of its waters, especially in the area of the Rías Baixas [7]. Although the production intensity of this area does not reach levels of other sub-regions of the Canary Current system [8], in the Rías Baixas the production ratio reaches values of up to ca. 3 g C m−2 d−1. This in turn translates into an important fishing activity in the region, especially in terms of shellfish exploitation [7]. On the other hand, the Galician shore is also characterized by a coastal topography based on “rías”, which provide a coastline of 2100 km [9] for land area of approximately 200 km × 200 km. “Rías” are defined as penetrations of seawater into the coast at the mouth of a river due to the subsidence of a part of the coastline. According to Von Richthofen [10], it is a particular coastal topology characterized by a valley occupied by seawater, as is the case of the Galician Rías.
This sharp coastal topology, together with the geographical location of the area, are two of the factors that promote the high fertility that characterizes the waters of the Galician Rías [11]. This enhanced biological capacity is linked with the upwelling periods that typically occur in the spring–summer months when the pumping of water masses from the North Atlantic Central Water (NACW) occurs [12]. According to Prego et al. [13], the effect of wind on the upwelling phenomenon can be intensified on a local scale by the presence of a very pronounced coastline since capes and rías have influence in wind intensity [14,15,16,17].
Upwelling events can be detected from the variations produced in the ecosystem and environment properties. Surface sea temperature (SST), salinity, alkalinity, dissolved oxygen and CO2 or primary production are variables sensitive to the occurrence of upwelling periods that have been partially used as indicatives [18,19,20]. However, an upwelling detection strategy based solely on these variables presents certain drawbacks, such as the requirement for a large infrastructure of highly specialized and expensive sensors embedded in ships and buoys [21]. In addition, according to Aguilera et al. [18] and Goela et al. [22], some of these variables are sensitive to other factors, which can yield misleading results such as false positives. These drawbacks are compounded by the need for an expert oceanographer to properly interpret the data obtained from these sources [23].
Furthermore, upwelling events can be also identified by the evaluation of their causing agents, as wind, which is usually assessed by calculating Ekman transports and the upwelling index (UI) [24,25,26]. Despite it is a simplified method that does not consider aspects such as the bathymetry of the area [27], or the wind drop-off effect [28], it is widely used in the scientific community as it can be used as a preliminary estimator that informs of the occurrence of upwelling phenomena. Therefore, to calculate Ekman transports, wind data sources are usually used, which are either from offshore stations (ships or buoys) placed on the coast [29] or from satellites [30,31]. Quick Scatterometer (QuikSCAT) is one of the most commonly used sources in the literature as the satellite allows the measurement of wind speed and direction near the ocean surface independently of meteorological conditions [32]. Torres et al. [33] and Prego et al. [34] used QuikSCAT wind data to study wind profiles and upwelling patterns for the Galician Western and Northern shore. Sousa et al. [35] compared the performance of QuikSCAT wind data with land meteorological stations, detecting certain bias for the satellite measurements. Their results are in good agreement with other authors studying wind patterns along the Mediterranean Sea [36] and Iberian Peninsula [37].
When using satellite datasets, one of the problems lies in the updating and periodicity of the available data. According to Álvarez Salgado et al. [38] the intense upwelling phenomena in the Rías Baixas region allow the renewal of water in the area in about 3–4 days, however this database only provides a daily measurement of wind speed. This leads to significant estimation errors, and consequently, the risk of masking some upwelling events.
A possible solution to the double problem described above lies in finding data sources that, in addition to being accessible and low-cost, would provide updated and as complete information as possible. In the case of the Galician coast, the network of weather stations from the Regional Weather Forecast Agency (MeteoGalicia), offers information on atmospheric variables with a ten-minute frequency, being uploaded to a totally free and public platform that allows real-time access and downloading. MeteoGalicia stations show great potential to be used with this purpose, providing a compromise among accessible, low-cost and robust data. However, despite the great amount of research done in the field of upwelling events in the Galician Coast, very little literature has used MeteoGalicia stations to estimate UI, as is the case of Gomez-Gesteira et al. [39] or Torres Palenzuela et al. [40], which have successfully calculated Ekman transport along the Galician coast from meteorological information. Hence, the present work aims to assess the reliability of using wind data for the effective identification of upwelling periods in part of the SW Galician shore by comparing their performance for UI estimation with other data sources and numerical models.
The following sections of this research paper are structured as below: first, the materials and methods used will be addressed, including a description of the study area and the characteristics of available data sources and selection criteria, together with a theoretical background on the calculation of the upwelling index. Then, the quality of the data sources will be studied in terms of data availability and reliability for UI estimation, comparing the calculation results with reference numerical models. Finally, the work closes with the selection of those data sources that allow the best estimation of the UI, accompanied by an overall assessment of the suitability of their use for the identification of upwelling events.

2. Materials and Methods

2.1. Available Data Sources

The area of interest is located in the ría of Vigo, SW of the Galician coast. Specifically, the study will focus on estimating the upwelling periods affecting the waters off the north-western side of the island of Toralla, site of the ECIMAT marine research center (see Figure 1).
As mentioned above, for the determination of the upwelling index in the study area, different data sources are available, namely (1) the Toralla-ECIMAT station, (2) coastal buoys and (3) land stations. Their main characteristics are defined below and summarized in Table 1.
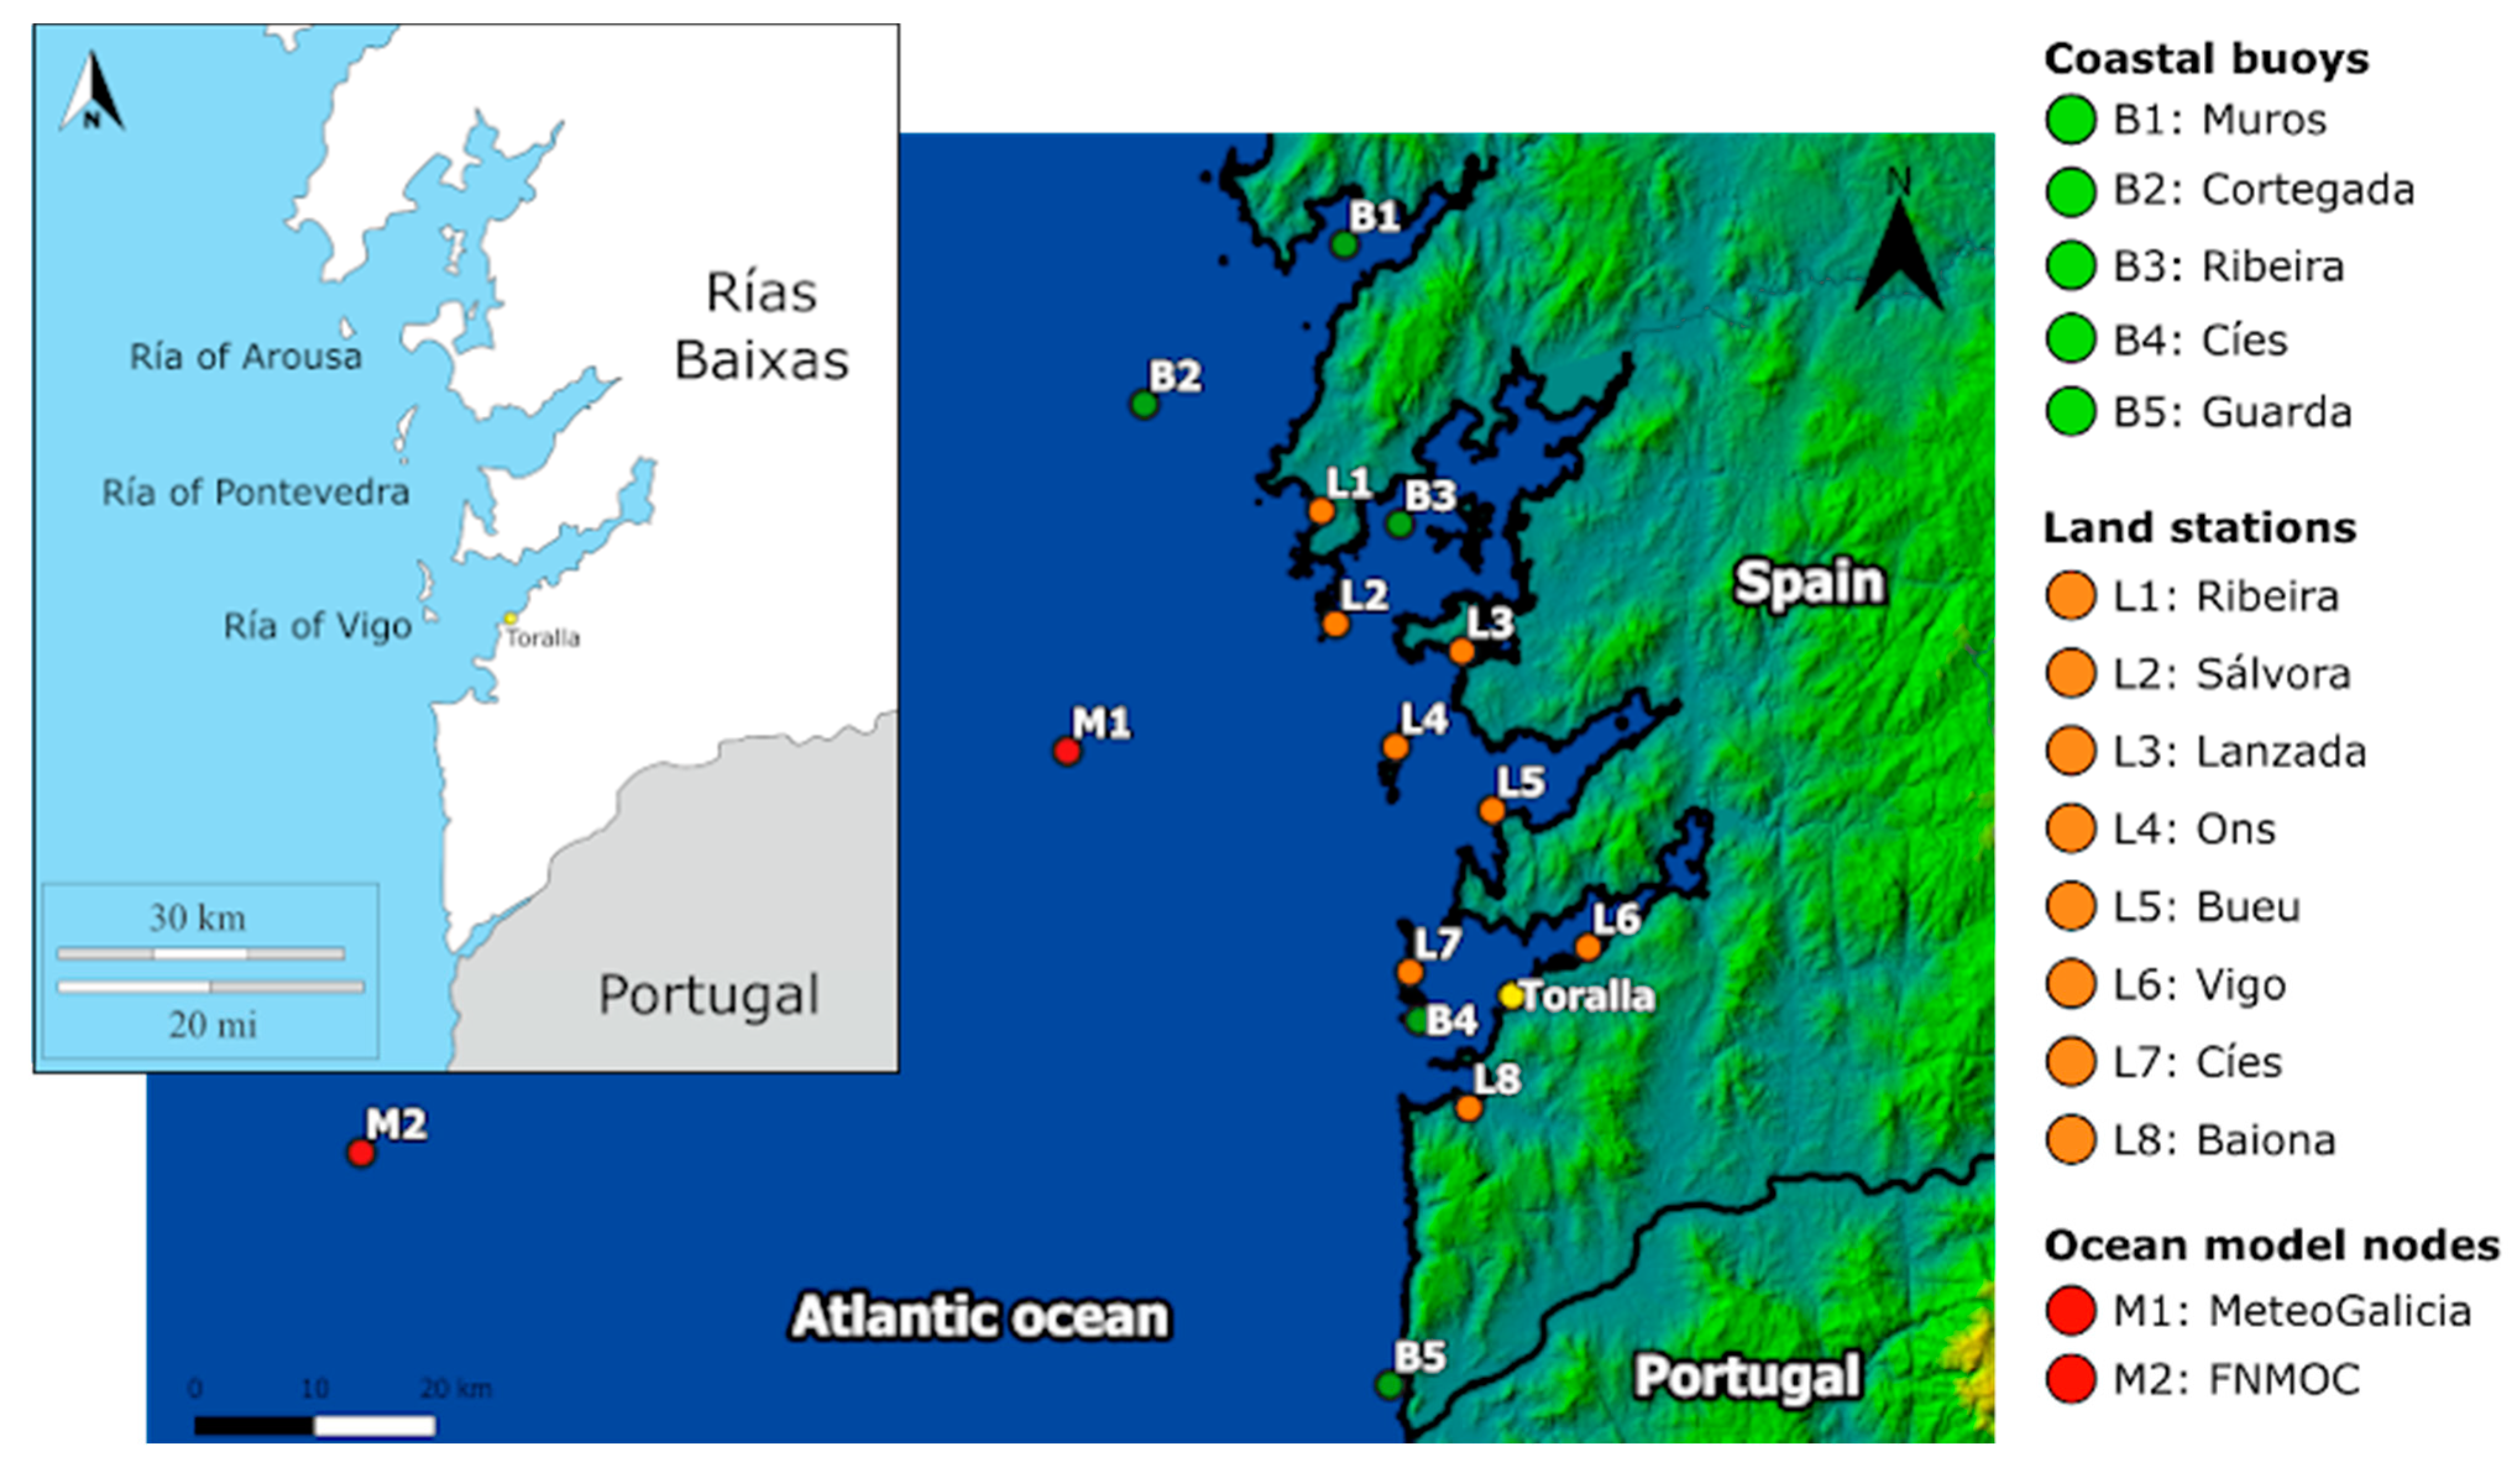
  • Toralla station. The ECIMAT has its own automatic ocean-meteorological observation station, located at the floating end of the mooring pontoon used by the center’s vessels. The sensors were installed in November 2012, with the testing period ending in June 2013. The meteorological monitoring set has an ambient temperature and humidity sensor, anemometer (speed and direction for sustained wind and gusts) and pyranometer (solar irradiance), located 3.1 m above the floating surface of the pontoon. The oceanographic part has sensors for temperature, conductivity, dissolved oxygen concentration and salinity, all recording measurements at a depth of 1 m below the sea surface. All sensors record data at a ten-minute frequency. Access to the station’s measurement history is possible through the repository published in the Pangaea portal [41]. The data are available under Creative Commons license, and can be used, adapted and redistributed free of charge. Uploading new records to the public repository requires prior pre-processing and validation of the data, which results in a low update frequency. At the time of writing, the period of available data spans from June 2013 (August for oceanographic data) to December 2019.
  • Coastal buoys. Offshore ocean-meteorological monitoring stations of the Regional Weather Forecast Agency MeteoGalicia located along the Rías Baixas coastline. Their installation and commissioning dates back between 2007 and 2015. All six buoys and platforms have meteorological sensors for ambient temperature, dew temperature and air humidity, as well as anemometers (with the exception of the Rande buoy) to record sustained and gust wind speed and direction. Most sites also have oceanographic probes for temperature, salinity, conductivity and density anomaly below the sea surface, at a depth of 1.5 m in most cases. Besides, some of the buoys have additional sensors for dissolved oxygen concentration, water column pressure, or north and east components of underwater current velocity. All observations are recorded at a ten-minute frequency.
  • Land stations. MeteoGalicia also has a network of more than 160 automated land-based weather observation stations, making it the densest meteorological network available for the Region of Galicia. Of all the stations currently active, eight are located on the coast of the Rías Baixas, in locations that allow the wind regimes entering the Vigo estuary from the Atlantic to be captured without suffering significant interference from the inland orography (see Figure 1). The start of the operational period of the eight selected stations is between 2000 and 2019. All of these stations have sustained wind speed and direction sensors. Most of them are also capable of measuring ambient temperature and humidity, solar irradiance, precipitation and wind gusts. The measurements are always at a ten-minute frequency, as in the case of coastal buoys.
Access to buoy [42] and land station [43] data history is through the MeteoGalicia web portal. By means of this system, it is possible to consult ten-minute frequency data or hourly, daily and monthly aggregates of all the variables available for each buoy/station since its start-up date. Access and use of the data is free and unlimited, with no restrictions other than the need to cite the source of the data. It should be noted that the MeteoGalicia website for the buoys data access was not conceived for massive, and automated data downloading. Therefore, the data collection must be done with caution, requiring continuous supervision by the final user. This makes obtaining data from the buoys a very time-consuming process, which makes it difficult to work with this type of sources on a large scale.
On the other hand, to validate the reliability of the UI estimates, UI data calculated on the basis of numerical interpolation and meteorological prediction models are used as a reference. In this case, the time series of the UI was provided by the Spanish Institute of Oceanography (www.indicedeafloramiento.ieo.es, accessed on 20 September 2022) by using two different models: (1) the mesoscale numerical model Weather Research and Forecasting (WRF), operated by MeteoGalicia; and (2) Global & Regional Weather Prediction Charts (WXMAP) dataset, operated by the US-based Fleet Numerical Meteorology and Oceanography Center (FNMOC). Access to the data of both models is through a GIS data viewer provided by the Spanish Institute of Oceanography (IEO). Both models provide estimates of atmospheric pressure at sea level at different points in the Atlantic Ocean and the Cantabrian Sea. These pressures are subsequently used to calculate the geostrophic wind components, and from them the UI at these points (following the methodology presented in the next section, methodology. Figure 1 shows the index calculation points (nodes) closest to Toralla-ICEMAT station for both models. The datasets can be downloaded with a six-hour time frequency in both cases. The history for the MeteoGalicia WRF model covers a period from March 2010 to March 2019, while the history for the FNMOC WXMAP model covers a period from November 2011 to February 2021. The frequency of updating these records with new data is unknown, but in both cases the most recent available calculation instants are far behind what would be considered near-real time. Detailed information about each ocean model is collected below:
  • Mesoscale numerical model Weather Research and Forecasting (WRF) operated by MeteoGalicia: This model integrates meteorological observations taken at points scattered across the geography of the study region, as well as numerical estimates generated by other forecasting models of global scope and lower spatial resolution. In the specific case of the MeteoGalicia model, the Global Forecast System (GFS) model of the National Oceanic and Atmospheric Administration (NOAA) is used as input. The integrated input data are processed to solve fluid-dynamic differential equations that model the behavior of the Earth’s atmosphere on a regional scale. This modelling covers a limited part of the atmosphere divided into three-dimensional grids, over a time range also divided into discrete time steps. The result of these calculations is a set of forward estimates for different meteorological variables at the central points of each of the three-dimensional cells into which the region under study is divided, for each of the defined time steps.
  • Global & Regional Weather Prediction Charts (WXMAP) dataset: This forecast ensemble is generated from the Navy Global Environmental Model (NAVGEM), a global-scale numerical weather model operated by the US-based Fleet Numerical Meteorology and Oceanography Center (FNMOC). The operational fundamentals of the NAVGEM model are very similar to those of the GFS model, both differing from the WRF model in that they are global in scope and therefore simulate the behavior of the Earth’s atmosphere for the entire planet.
Note that most of the sources are located at significant distances from the studied location, most of them more than 7 km away from the ECIMAT center, highlighting the distance of the two model nodes. However, while seeking to identify the occurrence of upwelling locally on Toralla Island, it should be considered that the drivers responsible for upwelling do not occur locally. To characterize the wind entrainment that causes deep water upwellings, the focus should be on winds acting in marine areas far enough from the coastline to be able to reach the depths at which deep water is encountered. This makes the locations of both model nodes, located in the open ocean, more suitable as reference values to contrast the estimated UI indexes than the data extracted from the Toralla station, which has been withdrawn as a reference source.

2.2. Methodology

2.2.1. Ekman Transport and Upwelling Index

The driving force behind the upwelling phenomena is the friction on the sea surface generated by the wind, which tends to drag the surface marine layer in the same direction. These three-dimensional water flows are known as Ekman transport [44] and are modelled as flows per linear distance from the coast in the two main Cartesian directions (North–South and West–East), as follows:
Q x = ρ a C d u u 2 + v 2 1 / 2 / ρ w f               Q y = ρ a C d v u 2 + v 2 1 / 2 / ρ w f
where the Ekman transport components, Q x and Q v depend on: the eastwards (positive when moving from west towards east) and northwards (positive when moving from south towards north) components of wind speed, u and v , in m/s; the air density ( ρ a = 1.2 kg·m−3); the dimensionless empirical drag coefficient ( C d = 1.4 × 10⁻³); the sea water density ( ρ w = 1025 kg·m−3) and the Coriolis parameter f = 2 Ω sin π θ / 180 , which describes the Coriolis force on the drag path calculated from the angular velocity of the planet Ω (7.3 × 10⁻⁵ s−1) and the geographical latitude θ of the study point, expressed in sexagesimal degrees.
Once all the variables involved have been defined, the upwelling index UI (measured in m3 s−1 km−1) is defined as the vector of water transport by Ekman effect that induces the upwelling/stacking of water on the studied coast. In the case of the Rías Baixas, this vector corresponds to the longitudinal component, in the opposite direction, meaning that a northwards wind (positive v) would cause a negative upwelling index value, while a southwards wind (negative v) would cause a positive UI value:
  U I = ρ a C d v u 2 + v 2 1 2 103 / ρ w 2 Ω sin θ
Increasing positive values indicate a greater magnitude of upwelling depth water flow, which are related with strong winds blowing in a north–south direction for the Rias Baixas case [8,45].

2.2.2. Data Processing. Evaluation Metrics

Upwelling index values are calculated from the wind information available in each of the data sources (buoys and land stations). In order to provide homogeneity to the results for the subsequent comparison against reference models, six-hour averages are computed from the original ten-minute wind data. Later, results are categorized, whereby the UI values obtained are translated into a binary code: 1 to denote periods of positive UI and 0 for negative values and N/A for null cases.
Moreover, comparison of averaged and digitized UI index for each of the land stations/buoys against the corresponding index from both models have been performed for each six-hour instant at which both data sets have known UI values. The index comparison results for each instant are then grouped into five categories, which have been summarized in Table 2: (1) positive index (PI), when both the buoy/land station and the numerical model return a positive UI value; (2) negative index (NI), when both sources indicate a negative upwelling index value (corresponding to stacking periods); (3) false positive (FP), when the station indicates a positive index even though the model returns a negative value; (4) false negative (FN), when the index is negative for the station but positive for the model; and (5) no data, which groups instants in which the station or the model does not provide UI data.
The goodness of the UI estimation provided by each source will depend on the number of successful calculations, i.e., the number of estimates for which the calculation result is in agreement with the reference. Therefore, the concordance ratio (CR) for each source is defined as the proportion of UI measurements coincident between the evaluated and the reference sources, with respect to the complete set of available data (Equation (3)).
C R = P I + N I / P I + N I + F P + F N

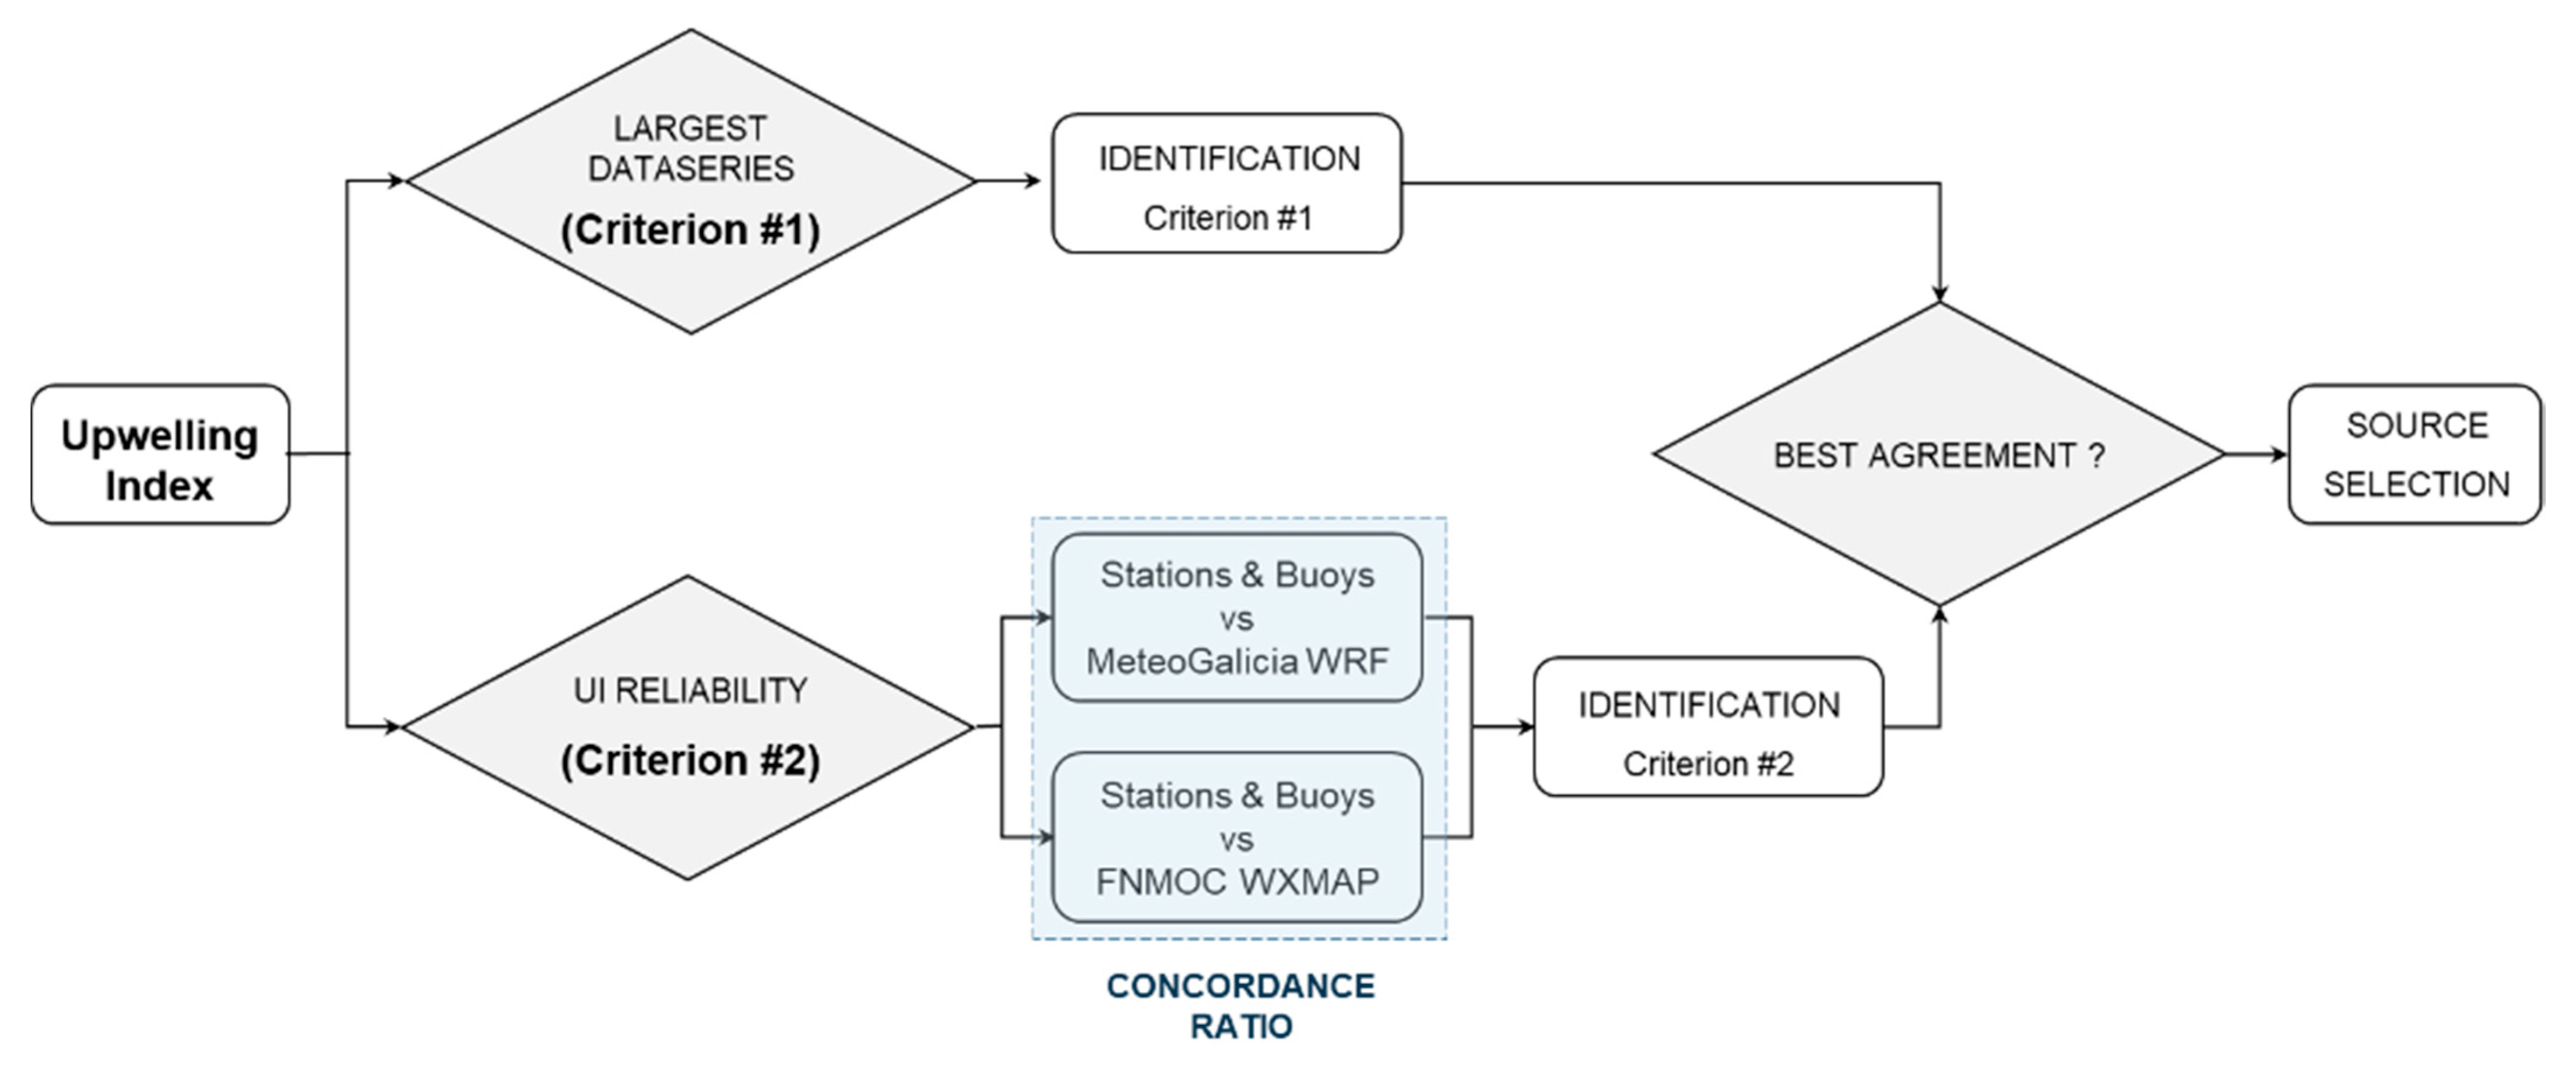
2.2.3. Data Source Selection

The main objective of this work seeks to choose a source or a set of sources that provide reliable and robust upwelling index values, in those areas where the relevant phenomena for the arrival of deep water at Toralla-ECIMAT center occur, and with an update frequency as close as possible to real time.
In this way, two selection criteria are defined that the data sources must meet to be selected as valid: (1) availability of updated records at the maximum possible frequency and (2) data reliability. The first criterion allows to evaluate which have a greater temporal range of accessible information, while the second criterion lets to determine which sources are inferring the least error in the UI estimation with respect to the two reference models.
The sequence followed to perform the source analysis and selection is summarized in Figure 2.

3. Results and Discussion

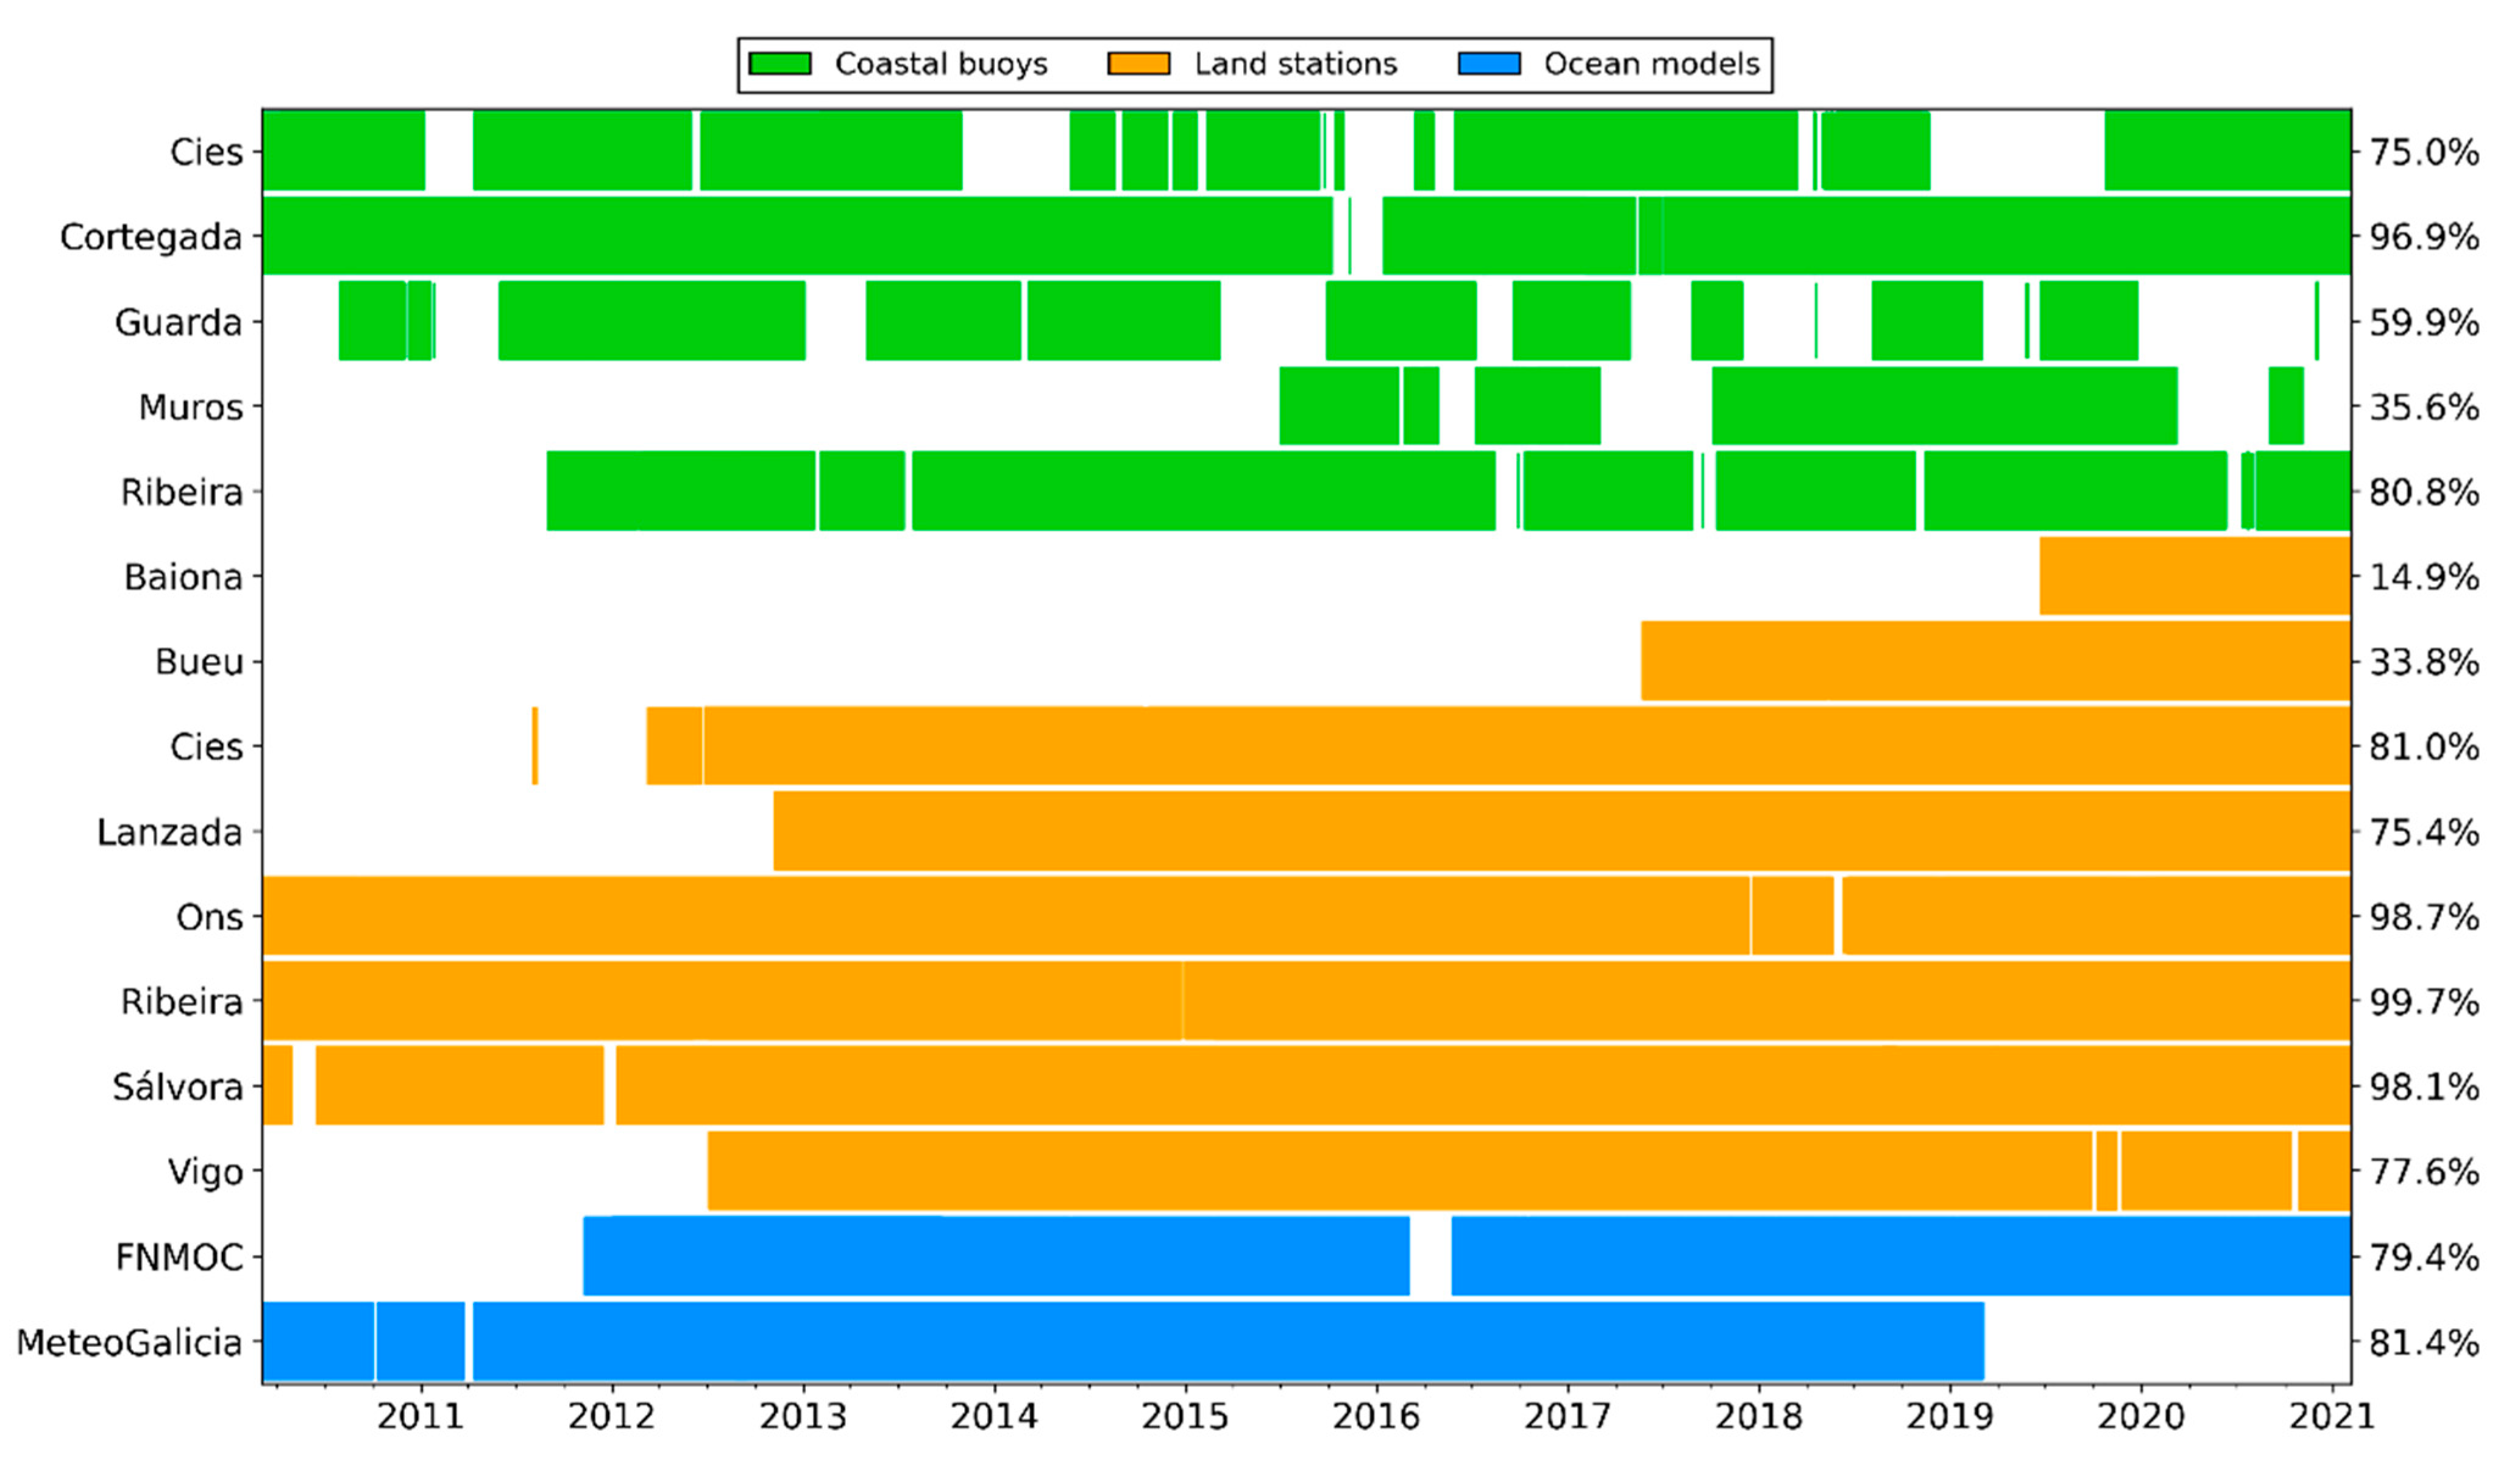
3.1. Complience with Criterion 1

Prior to the comparison of buoys and stations with models, it must be verified that the implementation of the UI algorithm is correct. For this purpose, UI values from the north and east wind component data included in the model history were determined. Each of the index values calculated by the algorithm is compared against the corresponding index value provided by the models. It is found that the maximum relative difference between calculated and actual value is zero with a tolerance of 1%. This indicates that the maximum error made by the calculation algorithm is less than 1%, which validates its accuracy and precision.
Figure 3 depicts the periods of known UI contained in the historical records of each data source to be compared, averaged every 6 h, since 2010 to 2021. Right axis includes the ratio of available data for the complete temporal series (2010–2021), in %. For each station/buoy or model, the six-hour periods with UI information are marked as colored stripes, while the periods with no data available are marked as blank holes. Although the historical records available in the MeteoGalicia web portal for the Ribeira, Sálvora and Ons stations cover dates prior to 2010, they have not been taken into account since none of the models cover periods preceding that year.
As can be observed, coastal buoys exhibit the lower temporal range with available data (<70% on average) in comparison with land stations (72.5%) and numerical models (80.4%). This, joined to the difficulty to directly access to historical data through the MeteoGalicia web portal makes coastal buoys a less robust data source in case of failures and crashes. In addition, due to their nature and location, these sensor platforms are more prone to experience problems in data collection, which decreases the percentage of valid data available. Therefore, the use of MeteoGalicia coastal buoys is expected to be ruled out.
Furthermore, it was found that the records for the Ribeira (99.7%), Ons (98.7%) and Sálvora (98.1%) land stations overlap all the periods for which data are available from both numerical models. The time series for the Vigo, A Lanzada and Cíes stations cover the same range as the FNMOC model, except for the first months of the model. Finally, the Bueu and Baiona stations were too recently installed to have a sufficient volume of data. In particular, the historical series of the Baiona station does not overlap at any time with the records of the MeteoGalicia numerical model, so the comparison between these two is impossible.
In this sense, Ribeira, Ons and Sálvora land stations have been identified as the sources that best meet criterion #1.

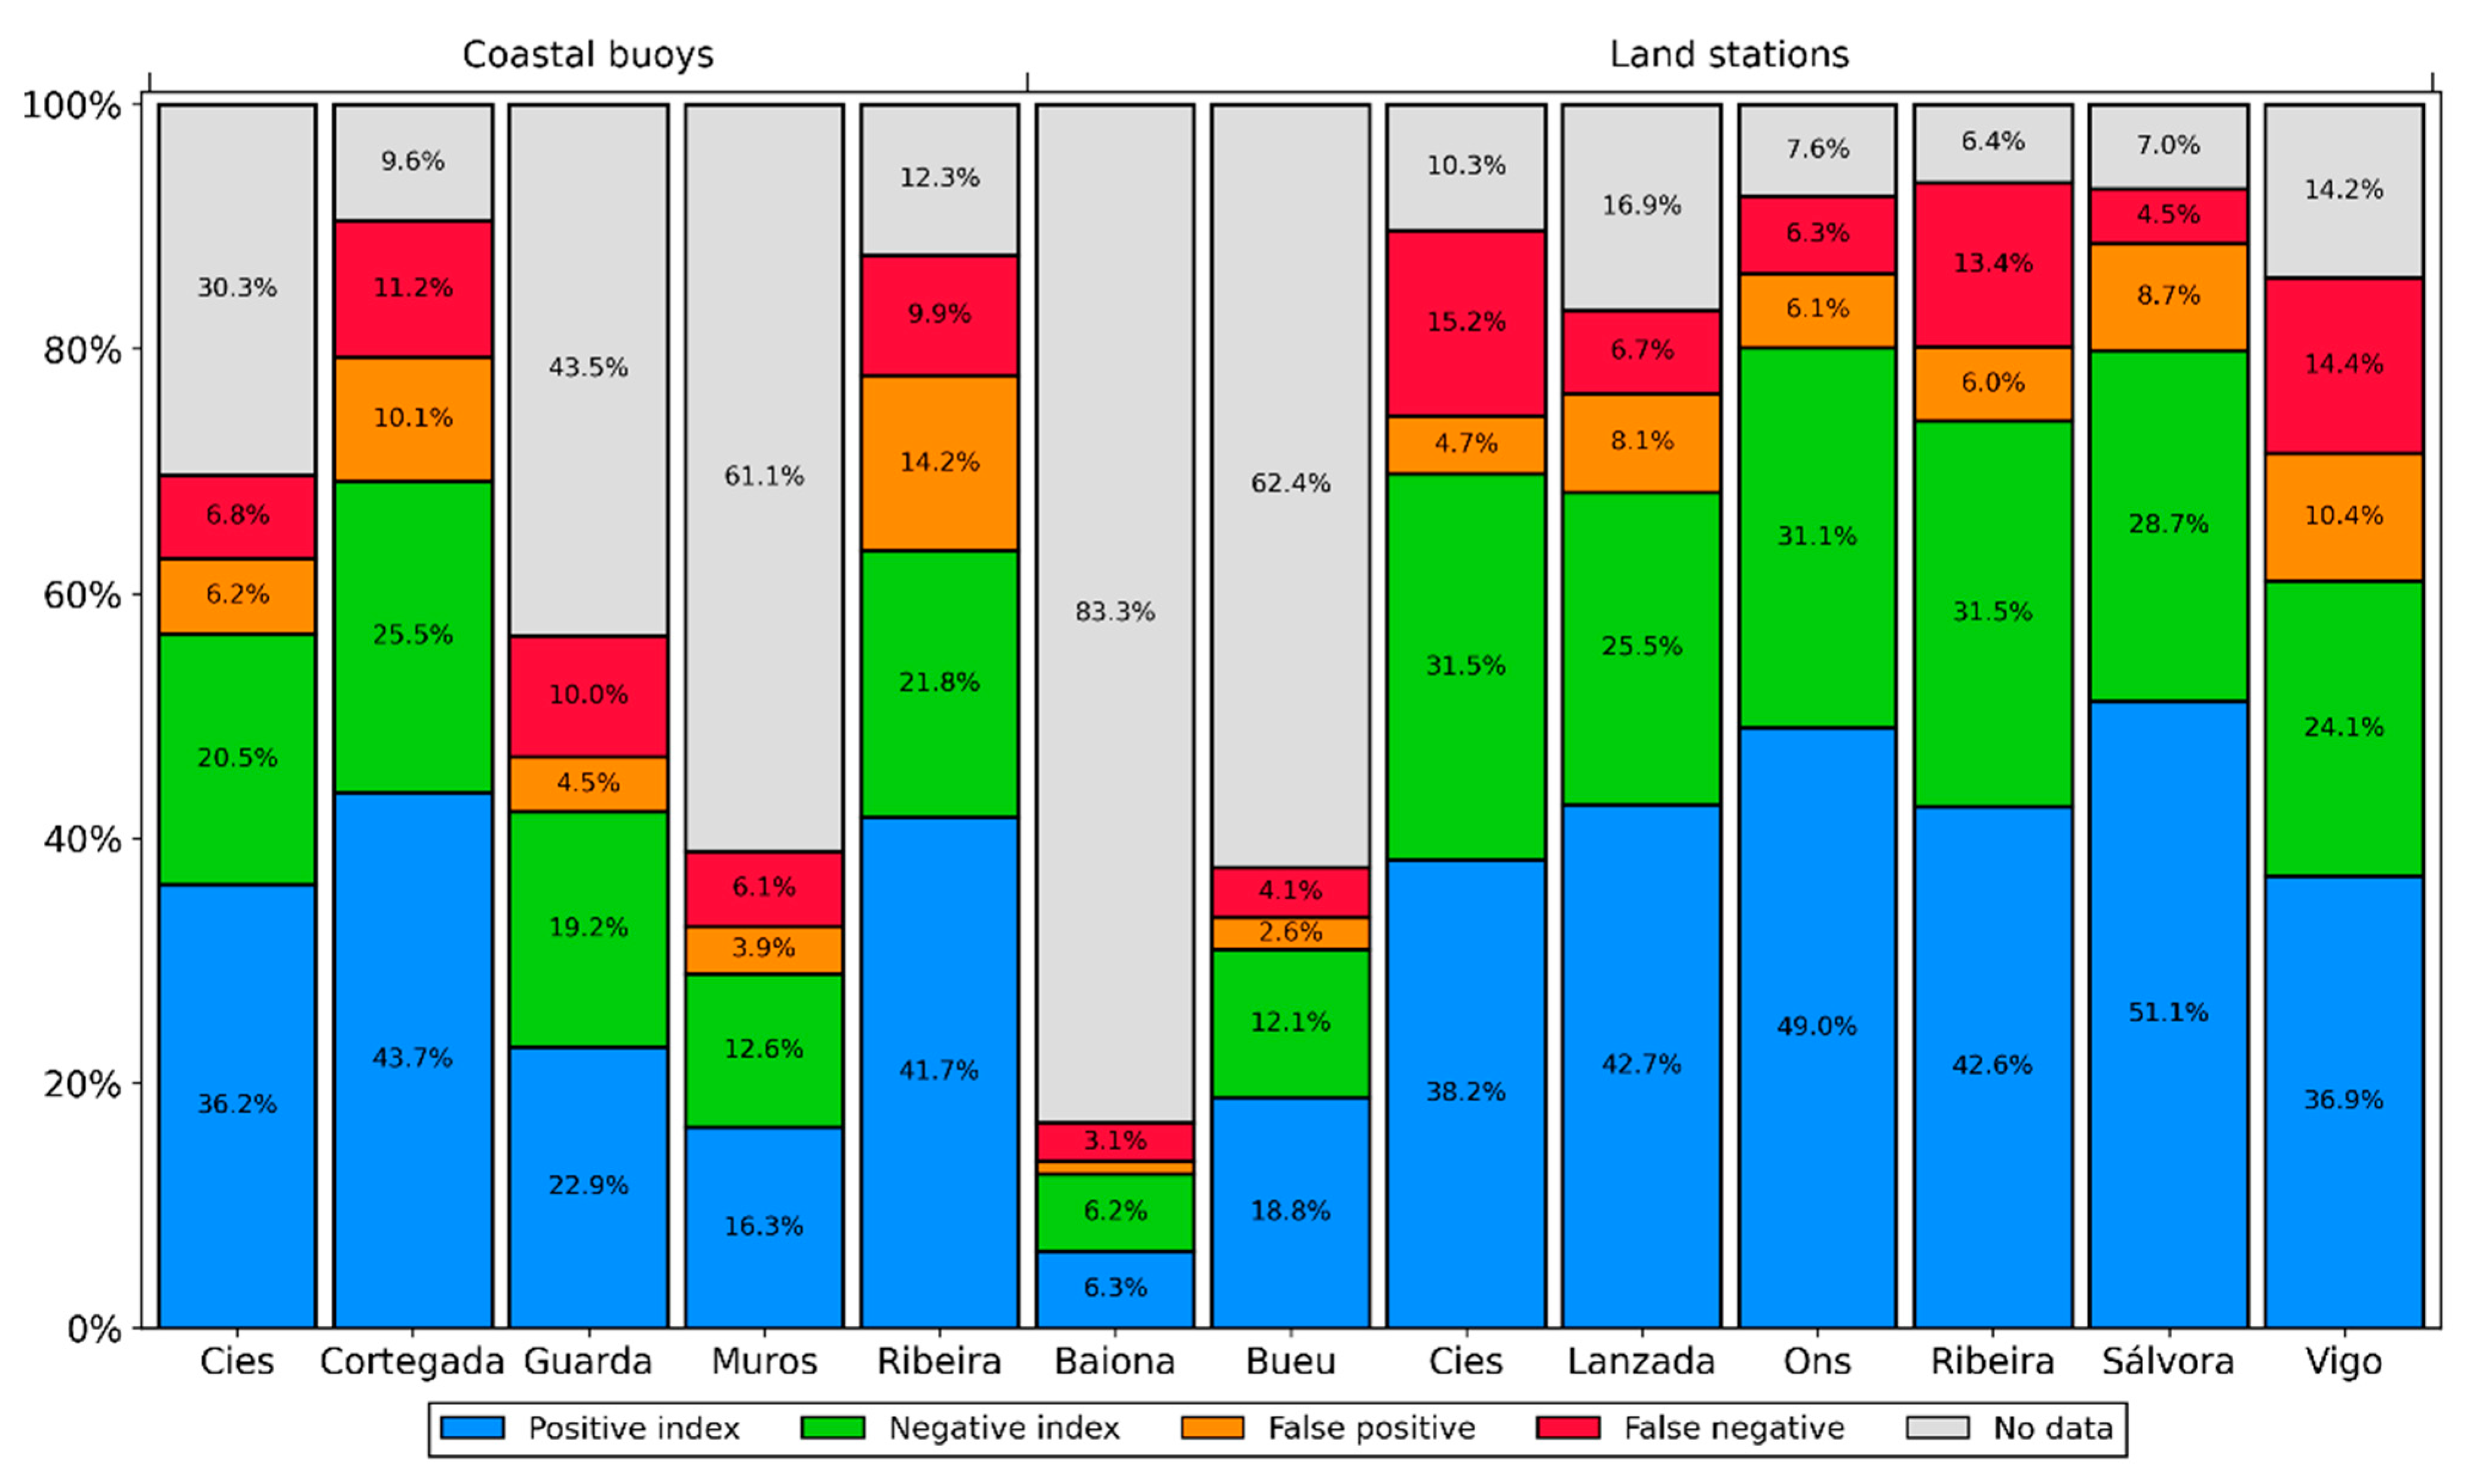
3.2. Complience with Criterion 2

As mentioned in the methodology section, a CR has been defined and calculated to assess the fit quality of the UI estimate. Table 3 includes the concordance ratio for each source, depending on the reference model used for contrasting.
In general, the UI estimations provide better results when contrasted against the FNMOC model, both for the buoys and the land stations, providing CR averaged values 10% higher than the MeteoGalicia WRC model. On the other hand, it can also be observed that overall, there are also higher CR values for the station-derived UI, highlighting the role of Ons, Sálvora and Ribeira land stations, as well as both the station and buoy of Cíes and the station of Baiona, with values higher than 0.7% for the MeteoGalicia model and 0.8 for the FNMOC.

3.3. Criteria Agreement and Source Selection

Considering the above, the mentioned sources would be relevant to be selected as valid data sources. However, it is necessary to take into account the two criteria applied in the selection methodology simultaneously in order to provide a proper assessment. To this end, Figure 4 and Figure 5 show the results of comparing the averaged and digitized UI index for each source against the corresponding index from the MeteoGalicia and FNMOC numerical models, including the effect of data availability.
These two figures illustrate the importance of using the two criteria simultaneously, since in the case of the Bueu station, the results of CR (criterion #2) were very acceptable, but nevertheless, the massive presence of voids invalidates the station.
Besides, these two figures show how the low availability of data from buoys reduces their suitability for use as sources of meteorological data, to the benefit of land stations. In fact, it is confirmed that the Ons, Sálvora and Ribeira stations would provide the best results and should be considered.
In view of the results, the stations with locations more exposed to the open sea are those that achieve a better percentage of agreement with the numerical models. The stations located on the islands of Ons and Sálvora, in that order, are the best-performing in relation to both models. Although the Cíes station is located in an archipelago as exposed to the open sea as the two previous islands, its poorer level of agreement can be explained by the station’s location on the southeastern part of the island of Monteagudo, which is more sheltered from the northwesterly winds.
The station on the Ons Islands, due to its CR values and its ratio of available historical data, seems to be the most suitable to describe the trends of positive and negative upwelling indices recorded by the two numerical models analyzed. This means that this meteorological land station fulfils the requirements stated in the sub-section on data source selection and can therefore be used as a data source to characterize upwelling events on Toralla Island. The station located on the island of Sálvora, with slightly lower CR results than Ons, can be used as a backup source to provide wind speed and direction data for the calculation of the UI at times when the Ons station is not operational due to maintenance or sensor failure.

4. Conclusions

This section contains the main conclusions drawn throughout the different tasks that make up this study.
In relation to the use of the upwelling index as an upwelling identifier, it was selected due to its advantages. Firstly, it uses existing data sources, therefore it does not require the installation and maintenance of new monitoring sensors. Furthermore, it can be calculated almost continuously with very low computational power and can be used in combination with the monitoring data currently available at the study location.
In relation to the use of MeteoGalicia land stations as sources of wind data, it is concluded that:
  • The station on the Ons islands achieves a high level of agreement with the upwelling index historical records of the available numerical models.
  • The station on the island of Sálvora also characterizes the oceanic wind regime with a high level of accuracy.
  • Both stations offer free, reliable, and near-real-time information.
  • The use of these stations allows solving the problems related to the operational use of the historical upwelling index series provided by the Spanish Institute of Oceanography.
  • Both stations can be used to characterize the occurrence of upwelling periods on Toralla Island.
It can be concluded that the selection and ranking of stations presented in this study could be useful as a source of raw data for research focusing on the optimization of the MeteoGalicia meteorological sensor network. However, such a potential study would have to be truly holistic in nature, making a meta-analysis of the quality of anchor data extracted from multiple studies from different fields of science and engineering (e.g., air quality, energy simulations, forest fire prevention, etc.) and targeting different locations.
In addition, it would be very interesting for future work to take into account other ocean-land interactions affecting coastal winds, such as the wind drop-off phenomenon, as the orography plays a fundamental role, and the UI scales could be affected. This would lead to more realistic models and allow a more accurate estimation of upwelling periods.

Author Contributions

Conceptualization, J.L.-P. and E.G.-Á.; data curation, R.P.-O. and J.L.-G.; funding acquisition, R.C.-R.; investigation, R.P.-O., J.L.-G. and R.d.l.H.; methodology, R.P.-O. and J.L.-G.; project administration, R.C.-R.; resources, R.d.l.H.; supervision, P.E.-O. and E.G.-Á.; validation, J.L.-G.; visualization, R.d.l.H.; writing—original draft, R.P.-O. and J.L.-G.; writing—review and editing, P.E.-O. and J.L.-P. All authors have read and agreed to the published version of the manuscript.

Funding

This research was financially supported by the company Aguas de Rodas through the project “Execución, identificación e explotación de auga de mar profunda” Ref. 2016 00013 of the Convenio NEOTEC Xunta de Galicia-Axencia Galega de Innovación (Spain).

Institutional Review Board Statement

Not applicable.

Informed Consent Statement

Not applicable.

Data Availability Statement

Not applicable.

Conflicts of Interest

The authors declare no conflict of interest.

References

  1. Lavín, A.; del Río, G.D.; Cabanas, J.M.; Casas, G. Índices de Afloramiento Para el Punto 43° N 11° W.; Período 1966–1989; Instituto Español de Oceanografía: Madrid, Spain, 1991; Volume 91. [Google Scholar]
  2. Álvarez Fernández, M.I. Caracterización de un Episodio de Afloramiento Invernal en la ría de Pontevedra; Vigo, Spain, 2002; pp. 1–84. [Google Scholar]
  3. Benazzouz, A.; Mordane, S.; Orbi, A.; Chagdali, M.; Hilmi, K.; Atillah, A.; Pelegrí, J.L.; Hervé, D. An improved coastal upwelling index from sea surface temperature using satellite-based approach—The case of the Canary Current upwelling system. Cont. Shelf Res. 2014, 81, 38–54. [Google Scholar] [CrossRef]
  4. Ryther, J.H. Photosynthesis and fish production in the sea. Science 1696, 166, 72–80. [Google Scholar] [CrossRef] [PubMed] [Green Version]
  5. Cushing, D.H. Upwelling and the Production of Fish. Adv. Mar. Biol. 1971, 9, 255–334. [Google Scholar]
  6. Fréon, P.; Barange, M.; Aristegui, J. Eastern Boundary Upwelling Ecosystems: Integrative and comparative approaches. Prog. Oceanogr. 2009, 83, 1–14. [Google Scholar] [CrossRef]
  7. Fernández, E.; Álvarez-Salgado, X.A.; Beiras, R.; Ovejero, A.; Méndez, G. Coexistence of urban uses and shellfish production in an upwelling-driven, highly productive marine environment: The case of the Ría de Vigo (Galicia, Spain). Reg. Stud. Mar. Sci. 2016, 8, 362–370. [Google Scholar] [CrossRef] [Green Version]
  8. Alvarez, I.; Gomez-Gesteira, M.; deCastro, M.; Novoa, E.M. Ekman transport along the Galician Coast (NW, Spain) calculated from QuikSCAT winds. J. Mar. Syst. 2008, 72, 101–115. [Google Scholar] [CrossRef]
  9. Pérez-Alberti, A.; Pires, A.; Freitas, L.; Chaminé, H. Shoreline change mapping along the coast of Galicia, Spain. Proc. Inst. Civ. Eng. Marit. Eng. 2013, 166, 125–144. [Google Scholar] [CrossRef]
  10. Von Richthofen, F. Führer für Forschungsreisende; Verlag Robert Oppenheim: Berlin, Germany, 1886. [Google Scholar]
  11. Barton, E.D.; Largier, J.L.; Torres, R.; Sheridan, M.; Trasviña, A.; Pazos, Y.; Valle-Levinson, A. Coastal upwelling and downwelling forcing of circulation in a semi-enclosed bay: Ria de Vigo. Prog. Oceanogr. 2015, 134, 173–189. [Google Scholar] [CrossRef] [Green Version]
  12. Arístegui, J.; Barton, E.D.; Álvarez-Salgado, X.A.; Santos, A.M.P.; Figueiras, F.G.; Kifani, S.; Hernández-León, S.; Mason, E.; Machú, E.; Demarcq, H. Sub-regional ecosystem variability in the Canary Current upwelling. Prog. Oceanogr. 2009, 83, 33–48. [Google Scholar] [CrossRef] [Green Version]
  13. Prego, R.; Bao, R. Upwelling influence on the Galician coast: Silicate in shelf water and underlying surface sediments. Cont. Shelf Res. 1997, 17, 307–318. [Google Scholar] [CrossRef] [Green Version]
  14. Enriquez, A.G.; Friehe, C.A. Effects of Wind Stress and Wind Stress Curl Variability on Coastal Upwelling. J. Phys. Oceanogr. 1995, 25, 1651–1671. [Google Scholar] [CrossRef]
  15. Dorman, C.E.; Holt, T.; Rogers, D.P.; Edwards, K. Large-Scale Structure of the June–July 1996 Marine Boundary Layer along California and Oregon. Mon. Weather. Rev. 2000, 128, 1632–1652. [Google Scholar] [CrossRef]
  16. Edwards, K.A.; Rogerson, A.M.; Winant, C.D.; Rogers, D.P. Adjustment of the marine atmospheric boundary layer to a Coastal Cape. J. Atmos. Sci. 2001, 58, 1512–1528. [Google Scholar] [CrossRef]
  17. Perlin, N.; Samelson, R.M.; Chelton, D.B. Scatterometer and model wind and wind stress in the Oregon–Northern California Coastal Zone. Mon. Weather Rev. 2004, 132, 2110–2129. [Google Scholar] [CrossRef]
  18. Aguilera, V.M.; Escribano, R.; Vargas, C.A.; González, M.T. Upwelling modulation of functional traits of a dominant planktonic grazer during “warm-acid” El Niño 2015 in a year-round upwelling area of Humboldt Current. PLoS ONE 2019, 14, e0209823. [Google Scholar] [CrossRef] [PubMed] [Green Version]
  19. Leitão, F.; Baptista, V.; Vieira, V.; Silva, P.L.; Relvas, P.; Teodósio, M.A. A 60-Year Time Series Analyses of the Upwelling along the Portuguese Coast. Water 2019, 11, 1285. [Google Scholar] [CrossRef] [Green Version]
  20. Mercado, J.; León, P.; Salles, S.; Cortés, D.; Yebra, L.; Gómez-Jakobsen, F.; Herrera, I.; Alonso, A.; Sánchez, A.; Valcárcel-Pérez, N.; et al. Time Variability Patterns of Eutrophication Indicators in the Bay of Algeciras (South Spain). Water 2018, 10, 938. [Google Scholar] [CrossRef] [Green Version]
  21. Dabuleviciene, T.; Kozlov, I.E.; Vaiciute, D.; Dailidiene, I. Remote Sensing of Coastal Upwelling in the South-Eastern Baltic Sea: Statistical Properties and Implications for the Coastal Environment. Remote Sens. 2018, 10, 1752. [Google Scholar] [CrossRef] [Green Version]
  22. Goela, P.C.; Cordeiro, C.; Danchenko, S.; Icely, J.; Cristina, S.; Newton, A. Time series analysis of data for sea surface temperature and upwelling components from the southwest coast of Portugal. J. Mar. Syst. 2016, 163, 12–22. [Google Scholar] [CrossRef] [Green Version]
  23. Nascimento, S.; Franco, P.; Sousa, F.; Dias, J.; Neves, F. Automated computational delimitation of SST upwelling areas using fuzzy clustering. Comput. Geosci. 2012, 43, 207–216. [Google Scholar] [CrossRef]
  24. Jing, Z.; Qi, Y.; Hua, Z.; Zhang, H. Numerical study on the summer upwelling system in the northern continental shelf of the South China Sea. Cont. Shelf Res. 2009, 29, 467–478. [Google Scholar] [CrossRef]
  25. Pardo, P.C.; Padín, X.A.; Gilcoto, M.; Farina-Busto, L.; Pérez, F.F. Evolution of upwelling systems coupled to the long-term variability in sea surface temperature and Ekman transport. Clim. Res. 2011, 48, 231–246. [Google Scholar] [CrossRef] [Green Version]
  26. Kok, P.H.; Akhir, M.F.M.; Tangang, F.; Husain, M.L. Spatiotemporal trends in the southwest monsoon wind-driven upwelling in the southwestern part of the South China Sea. PLoS ONE 2017, 12, e0171979. [Google Scholar] [CrossRef] [PubMed] [Green Version]
  27. Sousa, F.M.; Nascimento, S.; Casimiro, H.; Boutov, D. Identification of upwelling areas on sea surface temperature images using fuzzy clustering. Remote Sens. Environ. 2008, 112, 2817–2823. [Google Scholar] [CrossRef]
  28. Astudillo, O.; Dewitte, B.; Mallet, M.; Rutllant, J.A.; Goubanova, K.; Frappart, F.; Ramos, M.; Bravo, L. Sensitivity of the Near-Shore Oceanic Circulation Off Central Chile to Coastal Wind Profiles Characteristics. J. Geophys. Res. Oecans 2019, 124, 4644–4676. [Google Scholar] [CrossRef]
  29. Froján, M.; Castro, C.G.; Zúñiga, D.; Arbones, B.; Alonso-Pérez, F.; Figueiras, F.G. Mussel farming impact on pelagic production and respiration rates in a coastal upwelling embayment (Ría de Vigo, NW Spain. Estuar. Coast. Shelf Sci. 2018, 204, 130–139. [Google Scholar] [CrossRef]
  30. Alvarez, I.; Gomez-Gesteira, M.; deCastro, M.; Prego, R. Variation in upwelling intensity along the NorthWest Iberian Peninsula (Galicia). J. Atmos. Ocean Sci. 2005, 10, 309–324. [Google Scholar] [CrossRef]
  31. Jayaram, C.; Kumar, P.K.D. Spatio-temporal variability of upwelling along the southwest coast of India based on satellite observations. Cont. Shelf Res. 2018, 156, 33–42. [Google Scholar] [CrossRef]
  32. Dunbar, S.; Weiss, B.; Stiles, B.; Huddleston, J.; Callahan, P.; Callahan, P.; Perry, K.L.; Hsu, C. QuikSCAT Science Data Product User’s Manual; Lungu, T., Ed.; JPL: Pasadena, CA, USA, 2006. [Google Scholar]
  33. Torres, R.; Barton, E.D.; Miller, P.; Fanjul, E. Spatial patterns of wind and sea surface temperature in the Galician upwelling region. J. Geophys. Res. 2003, 108. [Google Scholar] [CrossRef] [Green Version]
  34. Prego, R.; Varela, M.; deCastro, M.; Ospina-Alvarez, N.; Garcia-Soto, C.; Gómez-Gesteira, M. The influence of summer upwelling at the western boundary of the Cantabrian coast. Estuar. Coast. Shelf Sci. 2012, 98, 138–144. [Google Scholar] [CrossRef] [Green Version]
  35. Sousa, M.; Alvarez, I.; Vaz, N.; Dias, J. Evaluating QuikSCAT wind data to study wind induced coastal phenomena along the Galician Coast. J. Coast. Res. 2011, 64, 445–449. [Google Scholar]
  36. Accadia, C.; Zecchetto, S.; Lavagnini, A.; Speranza, A. Comparison of 10-m Wind Forecasts from a Regional Area Model and QuikSCAT Scatterometer Wind Observations over the Mediterranean Sea. Mon. Weather Rev. 2007, 135, 1945–1960. [Google Scholar] [CrossRef]
  37. Sánchez, R.F.; Relvas, P.; Pires, H.O. Comparisons of ocean scatterometer and anemometer winds off the southwestern Iberian Peninsula. Cont. Shelf Res. 2007, 27, 155–175. [Google Scholar] [CrossRef]
  38. Alvarez-Salgado, X.A.; Gago, J.; Míguez, B.M.; Gilcoto, M.; Pérez, F.F. Surface waters of the NW Iberian margin: Upwelling on the shelf versus outwelling of upwelled waters from the Rías Baixads. Estuar. Coast. Shelf Sci. 2000, 51, 821–837. [Google Scholar] [CrossRef] [Green Version]
  39. Gomez-Gesteira, M.; Moreira, C.; Alvarez, I.; deCastro, M. Ekman transport along the Galician coast (northwest Spain) calculated from forecasted winds. J. Geophys. Res. 2006, 111. [Google Scholar] [CrossRef]
  40. Torres-Palenzuela, J.M.; Vilas, L.G.; Bellas, F.M.; Garet, E.; González-Fernández, Á.; Spyrakos, E. Pseudo-nitzschia Blooms in a Coastal Upwelling System: Remote Sensing Detection, Toxicity and Environmental Variables. Water 2019, 11, 1954. [Google Scholar] [CrossRef] [Green Version]
  41. González, J.; Herrera, J.L.; Varela, R.A. CIM-ECIMAT Ocean Meteorological Station Time-Series—Wind Data. PANGAEA 2020. [Google Scholar] [CrossRef]
  42. MeteoGalicia. Estacións Océano-Meteorolóxicas. 2022. Available online: http://www2.meteogalicia.gal/galego/observacion/plataformas/plataformas.asp (accessed on 20 September 2022).
  43. MeteoGalicia. Rede Meteorolóxica. 2022. Available online: https://www.meteogalicia.gal/observacion/estacions/estacions.action (accessed on 20 September 2022).
  44. Ekman, V.W. On the influence of the Earth’s rotation on ocean-currents. Ark. För Mat. Astron. Och Fys. 1905, 2, 52. [Google Scholar]
  45. Blanton, J.O.; Atkinson, L.P.; Castillejo, F.; Lavín, A. Coastal upwelling off the Rias Bajas, Galicia, Northwest Spain. I. Hydrogrophic Studies. Réunion Du Cons. Int. Explor. Mer 1984, 183, 79–90. [Google Scholar]
Figure 1. Map of the Rías Baixas shore, including the location of the different data sources.
Water 14 03387 g001
Figure 2. Flowchart on the methodology followed for selecting a data source.
Water 14 03387 g002
Figure 3. Positive UI period history for coastal buoys, land stations and numerical models.
Water 14 03387 g003
Figure 4. Concordance and divergence of UI between buoy stations and MeteoGalicia model, including the data availability.
Water 14 03387 g004
Figure 5. Concordance and divergence of UI between buoy stations and FNMOC model, including the data availability.
Water 14 03387 g005
Table 1. Data sources for upwelling index determination.
NameSource
Type
Distance to
ECIMAT [km]
Data
Record
Real
Time
Direct
UI
TorallaL0.22013–--
MeteoGalicia WRFM42.62010–2019-Yes
FNMOC WXMAPM102.72011–2021-Yes
Cíes buoyB7.92008–Yes-
Rande buoyB15.02007–Yes-
Guarda buoyB33.92010–Yes-
Ribeira buoyB40.62011–Yes-
Cortegada platformB47.32007–Yes-
Muros buoyB64.62015–Yes-
Vigo stationL7.62012–Yes-
Cíes stationL8.92012–Yes-
Baiona stationL9.92019–Yes-
Bueu stationL15.82017–Yes-
Ons stationL23.12005–Yes-
Lanzada stationL29.22012–Yes-
Sálvora stationL34.52006–Yes-
Ribeira stationL43.52000–Yes-
Note: B: coastal buoy; L: land station; M: ocean model node.
Table 2. Categories for evaluating the comparison between calculated and reference UI.
GroupCategoryBuoy/Station
UI Value
Model
UI Value
ConcordancePositive index (PI)++
Negative index (NI)
DivergenceFalse positive (FP)+
False negative (FN)+
No dataN/AN/A
Table 3. Concordance ratios for each source and the two reference numerical models.
Source NameTypeCR (vs. MeteoGalicia)CR (vs. FNMOC)
CíesB0.7310.813
CortegadaB0.6850.765
GuardaB0.6840.744
MurosB0.6380.743
RibeiraB0.6230.725
BaionaL-0.749
BueuL0.6890.822
CiesL0.7130.778
LanzadaL0.6950.822
OnsL0.7650.866
RibeiraL0.7130.793
SálvoraL0.7340.858
VigoL0.6320.711
Note: B: coastal buoy; L: land station.
Publisher’s Note: MDPI stays neutral with regard to jurisdictional claims in published maps and institutional affiliations.

