Article

Morphological Evolution Characteristics of River Cross-Sections in the Lower Weihe River and Their Response to Streamflow and Sediment Changes

1
State Key Laboratory of Soil Erosion and Dryland Farming on the Loess Plateau, Northwest A&F University, Xianyang 712100, China
2
Institute of Soil and Water Conservation, Chinese Academy of Sciences and Ministry of Water Resources, Xianyang 712100, China
3
University of Chinese Academy of Sciences, Beijing 100049, China
*
Author to whom correspondence should be addressed.
Water 2022, 14(21), 3419; https://doi.org/10.3390/w14213419
Submission received: 10 August 2022 / Revised: 19 October 2022 / Accepted: 24 October 2022 / Published: 27 October 2022

Abstract

:
River cross-section morphology and water and sediment conditions are deeply connected. In recent years, the lower Wei River has experienced regular flooding and drastic changes in river channel shape, causing significant harm to the economy and development of the lower reaches. This research investigated the morphological evolution features based on annual extensive cross-section data and water and sediment data from the hydrological stations of Xianyang, Lintong, and Huaxian in the lower Weihe River from 2006 to 2018 of river cross-sections and the reaction to water and sediment variations. The findings indicated that the lower Wei River’s cross-sectional alterations between 2006 and 2018 exhibited a trend of “flushing at both ends and siltation in the middle” while continuing to exhibit “non-flood flushing and flood siltation” features. The incoming sediment coefficient in the lower Weihe River declined dramatically, whereas the median diameter of suspended sediment particles grew significantly at the Lintong station. The average elevation of the river channel was highly synchronized with the change in the coming sediment coefficient, and the impact of big floods dramatically influenced the shape of the river cross-section. Human activities such as river management have directly affected the morphology of the river cross-section at Lintong station and caused a significant increase in the median diameter of suspended sediment particles, resulting in siltation in the Lintong river. The study’s findings can serve as a theoretical foundation for water and sediment regulation and river training in the lower Weihe River, reducing flooding damage.

1. Introduction

As elements are eroded, carried, and deposited by streamflow, the channel morphology continuously adjusts its cross-sectional, longitudinal profiles and planes [1]. The relationship between incoming streamflow and sediment and channel morphology is close, and the channel constantly self-regulates as the incoming streamflow and sediment conditions in the basin change [2,3,4]. The complexity of morphological changes in river cross-sections depends on the variety of streamflow-sediment combinations [5]. The development of river channel morphology has been the subject of extensive investigations for a long time, both domestically and internationally. Xia et al. [6] proposed an integrated method based on the geometric mean of the logarithmic transformation combined with a weighted mean based on the spacing of two consecutive sections; Xu [7] established a multi-equation system based on the influencing variables, such as suspended sediment discharge and its suspended sediment particles composition, flow rate and frequency of high sediment-bearing water flow, to estimate the river siltation rate; He [8] combined the bankfull discharge estimation method to develop a quasi-two-dimensional numerical model to calculate the bankfull discharge of a river segment to predict the spatial and temporal evolution of the river over a long period; Kong et al. [9] developed a systematic and general framework for river morphology extraction using multi-temporal remote sensing imagery and geomorphological parameters; Magliulo et al. [10] selected watersheds that are not affected by human activities to analyze the evolution of the river channel in its natural state. However, human activities have also significantly impacted river morphology in recent years, especially the operation of reservoirs [11,12,13], which has caused dramatic changes in river streamflow, sediment transport, and river morphology [14,15,16]. Some other studies have found that the incoming water and sediment in different geological features have different mechanisms of action on the river and produce different effects [17,18,19,20].
Since the Sanmenxia Reservoir has utilized the “store pure streamflow and drained muddy streamflow” method, the streamflow and sediment in the lower reaches of the Wei River have undergone significant changes [21,22]. The elevation of Tongguan has risen as a result of this, as has the siltation of the riverbed at the estuary of the Weihe River, the transformation of the lower portions into an above-ground river, and a reduction in the river’s ability to drain and move sediment, making the flood control pattern extremely harsh [23,24]. In order to solve the problem of river siltation, scholars have examined the causes of river flushing and siltation in the lower reaches of the Wei River. Liang et al. [25] presented a new explanation of “relatively large water scouring and relatively small water siltation” and came to the critical flow and sediment content derived based on non-equilibrium sediment transport theory; Deng and Guo [26] found that the area of the main channel of the lower Weihe River increased with the elevation of Tongguan and that the channel shrunk after 1986 with the decrease of the streamflow-sediment coefficient; Similarly, Zhang et al. [27] contended that the variance in the river cross-section in the lower Weihe River is influenced by both the water-sediment coefficient and the Tongguan height; Fan et al. [28] further suggested that the lower Weihe River channel has recently developed new characteristics, with the volume of the channel expanding at flat beach flow, the channel widening and scouring, and the change in the incoming sediment coefficient becoming the leading cause of the recent channel scouring in the lower Weihe River, while the change in the median diameter of suspended sediment particle and the stability of the Tongguan elevation also contribute. Most current research directly investigates the relationship between river scour-siltation and water-sediment changes in the lower Weihe River from the perspective of the river scour and siltation volume. However, few studies have been undertaken to investigate the cross-sectional morphology and cross-sectional elevation changes utilized to estimate river scour.
This study analyzed the morphological evolution characteristics of river cross-sections in the lower Weihe River based on the primary channel cross-section data and year-by-year information on runoff, sediment discharge, sediment concentration, the incoming sediment coefficient, the median diameter of suspended sediment particles, and major flood streamflow conditions at the hydrological stations in Xianyang, Lintong, and Huaxian from 2006 to 2018. The main research topics were (1) the morphological evolution of the lower Weihe River cross-section and (2) the relationship between changes in cross-section morphology and changes in incoming water and sediment. This study can provide a theoretical basis for streamflow, sediment control, and river regulation in the lower Weihe River.

2. Materials and Methods

2.1. Study Area

The Weihe River is the Yellow River’s largest tributary, flowing from Bird Rat Mountain in Dingxi City, Gansu Province, through Xianyang, Xi’an, and Weinan before merging with the Yellow River in Tongguan County, Weinan City, with a total length of 818 km and a basin area of 134,766 km2 (Figure 1). The lower reaches of the Wei River are at the entrance of the Yellow River, with a length of 208 km, a drop of 56 m, and an average specific drop of 0.28%; It has numerous tributaries, with the Jing River on the north bank being one of the primary sources of sediment for the Wei River, and confluent tributaries on the south bank originating from the northern Qinling Mountains, with steep slopes, rapid flow, and low sediment content, which have a “diluting” effect on the Wei River flow’s high sediment content [29]. The channel of the lower Weihe River can be classified as wandering, intermediating, or meandering based on its platform. From Xianyang to Gengzhen Bridge (4.5 km downstream of the mouth of the Jing River into Wei) is a wandering river section characterized primarily by a wide and shallow scattered riverbed, straight river channel, wavering mainstream, and susceptibility to mutation. Gengzhen Bridge to the mouth of the Chishui River is an intermediating river section; the channel is curved, narrow sections are interspersed, and broad sections have a heart beach; in recent years, it has been relatively stable under the control of the main channel control project. From the mouth of the Chishui River to the mouth of the Wei River is a meandering river section; the river channel is freely curved, the riverbed is relatively narrow and deep, the main channel does not swing much, and the main change of the river channel is gradual [30].

2.2. Datasets

In this paper, we selected three hydrological stations in the lower reaches of the Wei River, Xianyang, Lintong, and Huaxian, which are located in the wandering, transitional, and meandering channels, respectively, and collected the measured extensive cross-sectional data of the three hydrological stations before (March) and after (October) the flood each year from 2006 to 2018; as well as the measured water and sediment data from hydrological stations, such as streamflow, sediment discharge, sediment concentration and median diameter of suspended sediment particle, and so on, year by year and by flood season (April-September). The data came from the “Yellow River Basin Hydrological Information” published by the Yellow River Commission of the Ministry of Water Resources and the “China River Sediment Bulletin” provided by the Hydrological and Water Resources Monitoring and Forecasting Center of the Ministry of Water Resources. All data were validated and calibrated.

2.3. Incoming Sediment Coefficient

In the study of Yellow River sediment, the incoming sediment coefficient is an important streamflow-sediment parameter, and it has also been widely used in the evolution of the riverbed [31,32,33]. The variation of the incoming sediment coefficient is used in this study to analyze the flushing and siltation of the river channel. The incoming sediment coefficient formula is as follows:
ξ = S/Q
where: S is the average sediment content (kg/m3), Q is the average flow rate (m3/s).
The sizeable incoming sediment coefficient indicates that the sediment content is relatively large, the streamflow volume is relatively small, the sediment-carrying power is reduced, the sediment is quickly deposited, and the riverbed is silted up [12].

2.4. Trend Analysis

The Mann–Kendall test [34,35] is a widely used nonparametric test that does not require the data series to follow a specific distribution and can more objectively determine the trend of the data series over a long time. It is commonly used to predict the long-term trend of hydro-meteorological time series data such as runoff, temperature, and precipitation. The time series Y = (Y1, Y2, ..., Yn), the typical standard distribution statistic Z.
Z = { ( S 1 ) / ( V a r ( s ) ) 1 / 2     S > 0   0   S = 0 ( S + 1 ) / ( V a r ( s ) ) 1 / 2     S < 0  
which:
S = k = 1 n 1 y = k + 1 n s g n ( Y j Y k )
s g n ( Y j Y k ) = {   1             Y j Y k > 0   0               Y j Y k = 0 1               Y j Y k < 0  
V a r ( s ) = 1 18 [ n ( n 1 ) ( 2 n + 5 ) t t ( t 1 ) ( 2 t + 5 ) ]
where S follows the normal distribution and Var(s) denotes the variance.
Based on the Z-values obtained from the Mann–Kendall statistical test for the time series data, a positive Z-value indicates an upward trend, and vice versa. When n > 10, the|Z| ≥ 1.28, 1.64, and 3.32 indicate that the significance tests with 90%, 95% and 99% confidence levels are passed.

2.5. Change-Point Analysis

Fisher’s breakpoint test is a cluster analysis type based on Fisher’s systematic clustering method. The samples to be investigated are categorized in a specific order based on the similarity between the sample areas without disrupting the original order so that the differences between the categories are as significant as feasible and the sum of the differences within each category is as tiny as possible [36]. Suppose the subintervals of data in one group after classification is {ai, ai+1, ..., aj, aj}, then the sample means of its subintervals are:
a ̄ i j = 1 j i + 1 i = 1 j a i
The off-difference sum of squares is
D i j = i = 1 j ( a i a ̄ i j )
Fisher’s systematic clustering method uses the “sum of squares of deviations” as the class diameter, and the smaller the class diameter, the smaller the intra-class variation. Plotting the results of Dij on a curve, the curve’s minimum is the class split point, which is the mutation point of the data [37,38].

3. Results and Discussion

3.1. Changes in River Cross-Sectional Characteristics

3.1.1. Cross-Section Shape

As shown in Figure 2, the cross-sectional river pattern of Xianyang station was “V” shaped; continuous river training works on both sides prevented the main channel in the local area from shifting, but the cross-sectional area of the river increased significantly. The change of river cross-sectional morphology can be divided into three stages; the first stage, 2006–2008: The river’s bottom elevation was high, except at the thalweg point, where it was apparent down, but the rest of the bottom was relatively flat; the second stage, 2009–2012: The left bank of the riverbed had been cut down to the left, among which the overall height of the right bank of the river after 2011 was decreasing; In 2012, the width of the river trough’s bottom suddenly increased to roughly twice its original size; the third stage 2013–2018: The graphic showed that the main channel section of the river in the three stages was continuously down-cutting and the overall state of continued scouring.
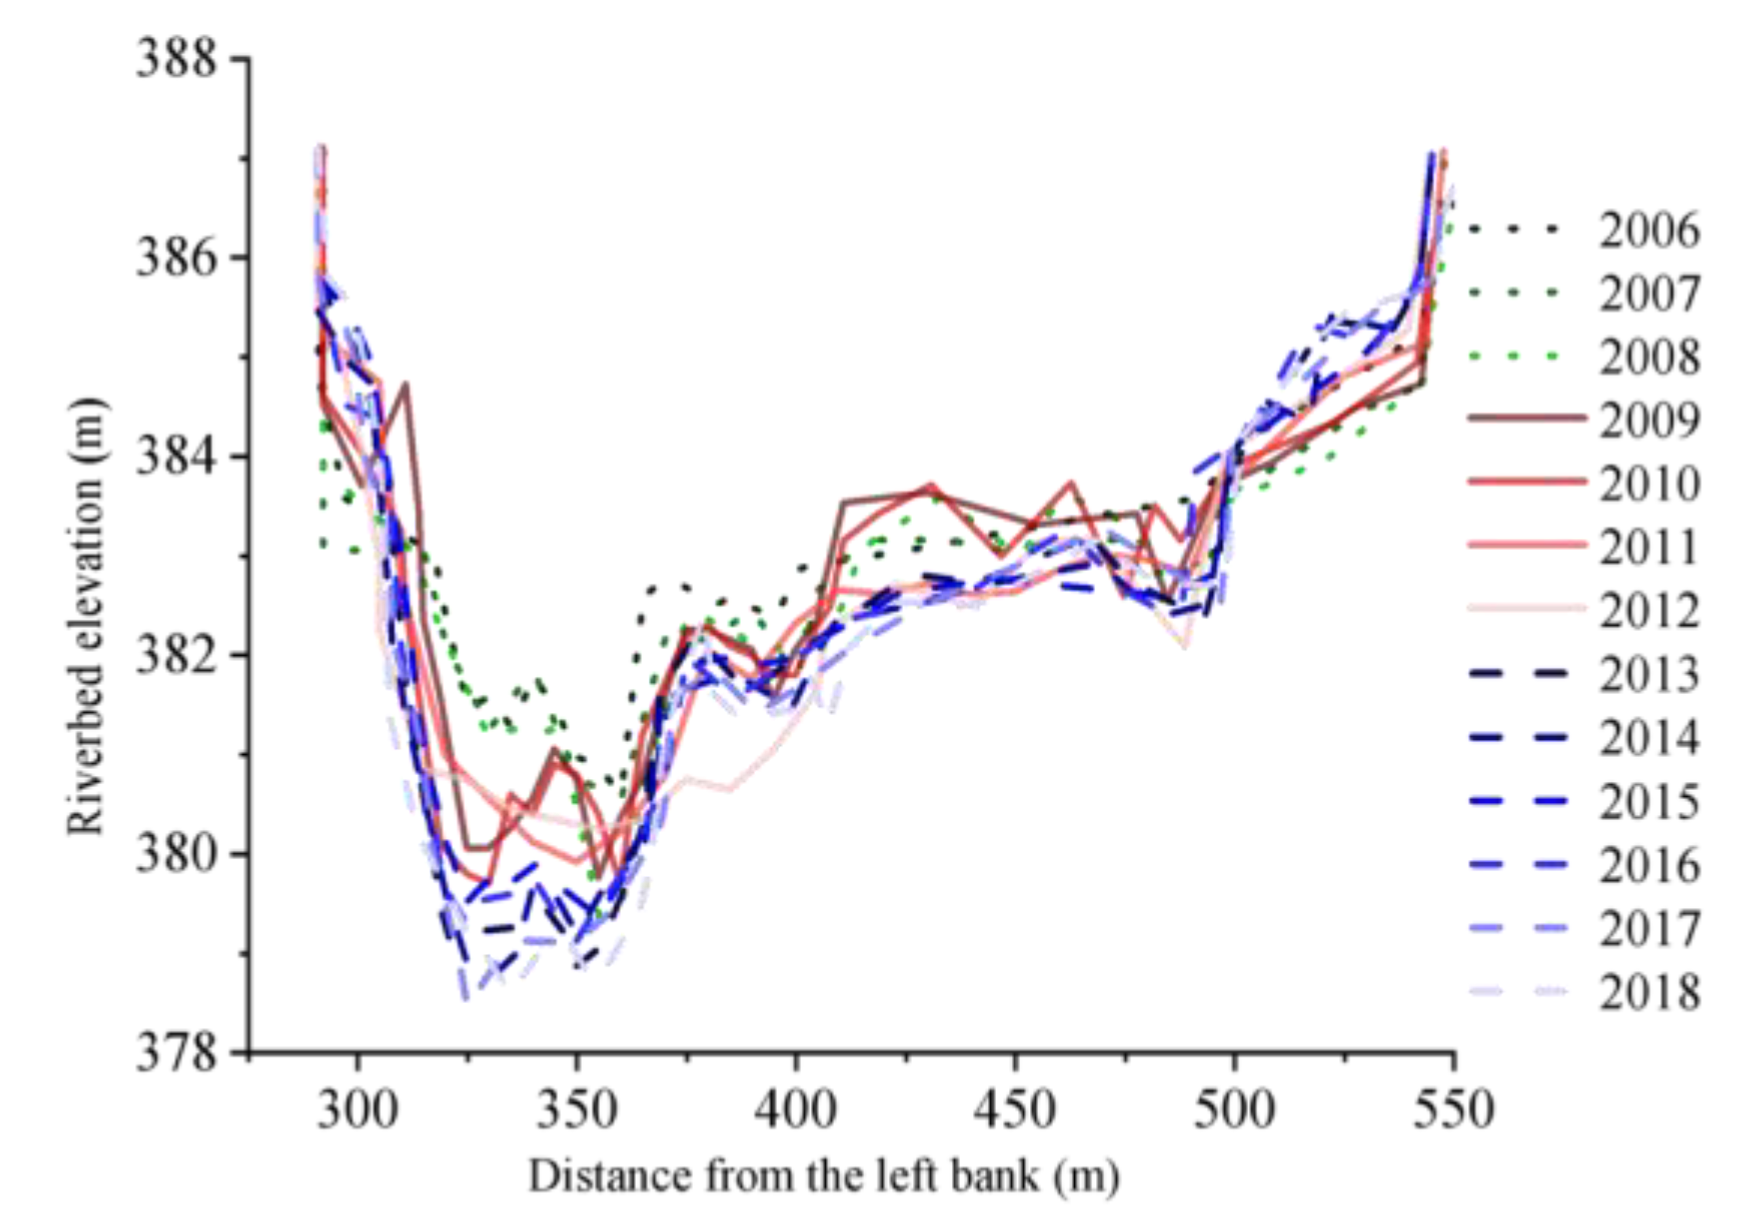
The river’s cross-sectional shape at Lintong station was a rough “U” shape (Figure 3), the left beach lip had not moved considerably, and the river channel had shifted significantly to the left. The morphological evolution is mainly divided into three stages: the first stage, from 2006 to 2009: the “U” shape of the channel was not apparent; the second stage, from 2010 to 2012: the left bank of the riverbed was elevated, the primary channel morphology became obvious “U” shape, and the bottom of the river channel was relatively stable; and the third stage from 2013 to 2018: the main channel of the river swung from right to left as a whole in 2013, with a plane swing distance of about 40 m, which was caused by the river training project. There was significant scouring of the riverbed’s left bank in 2018.
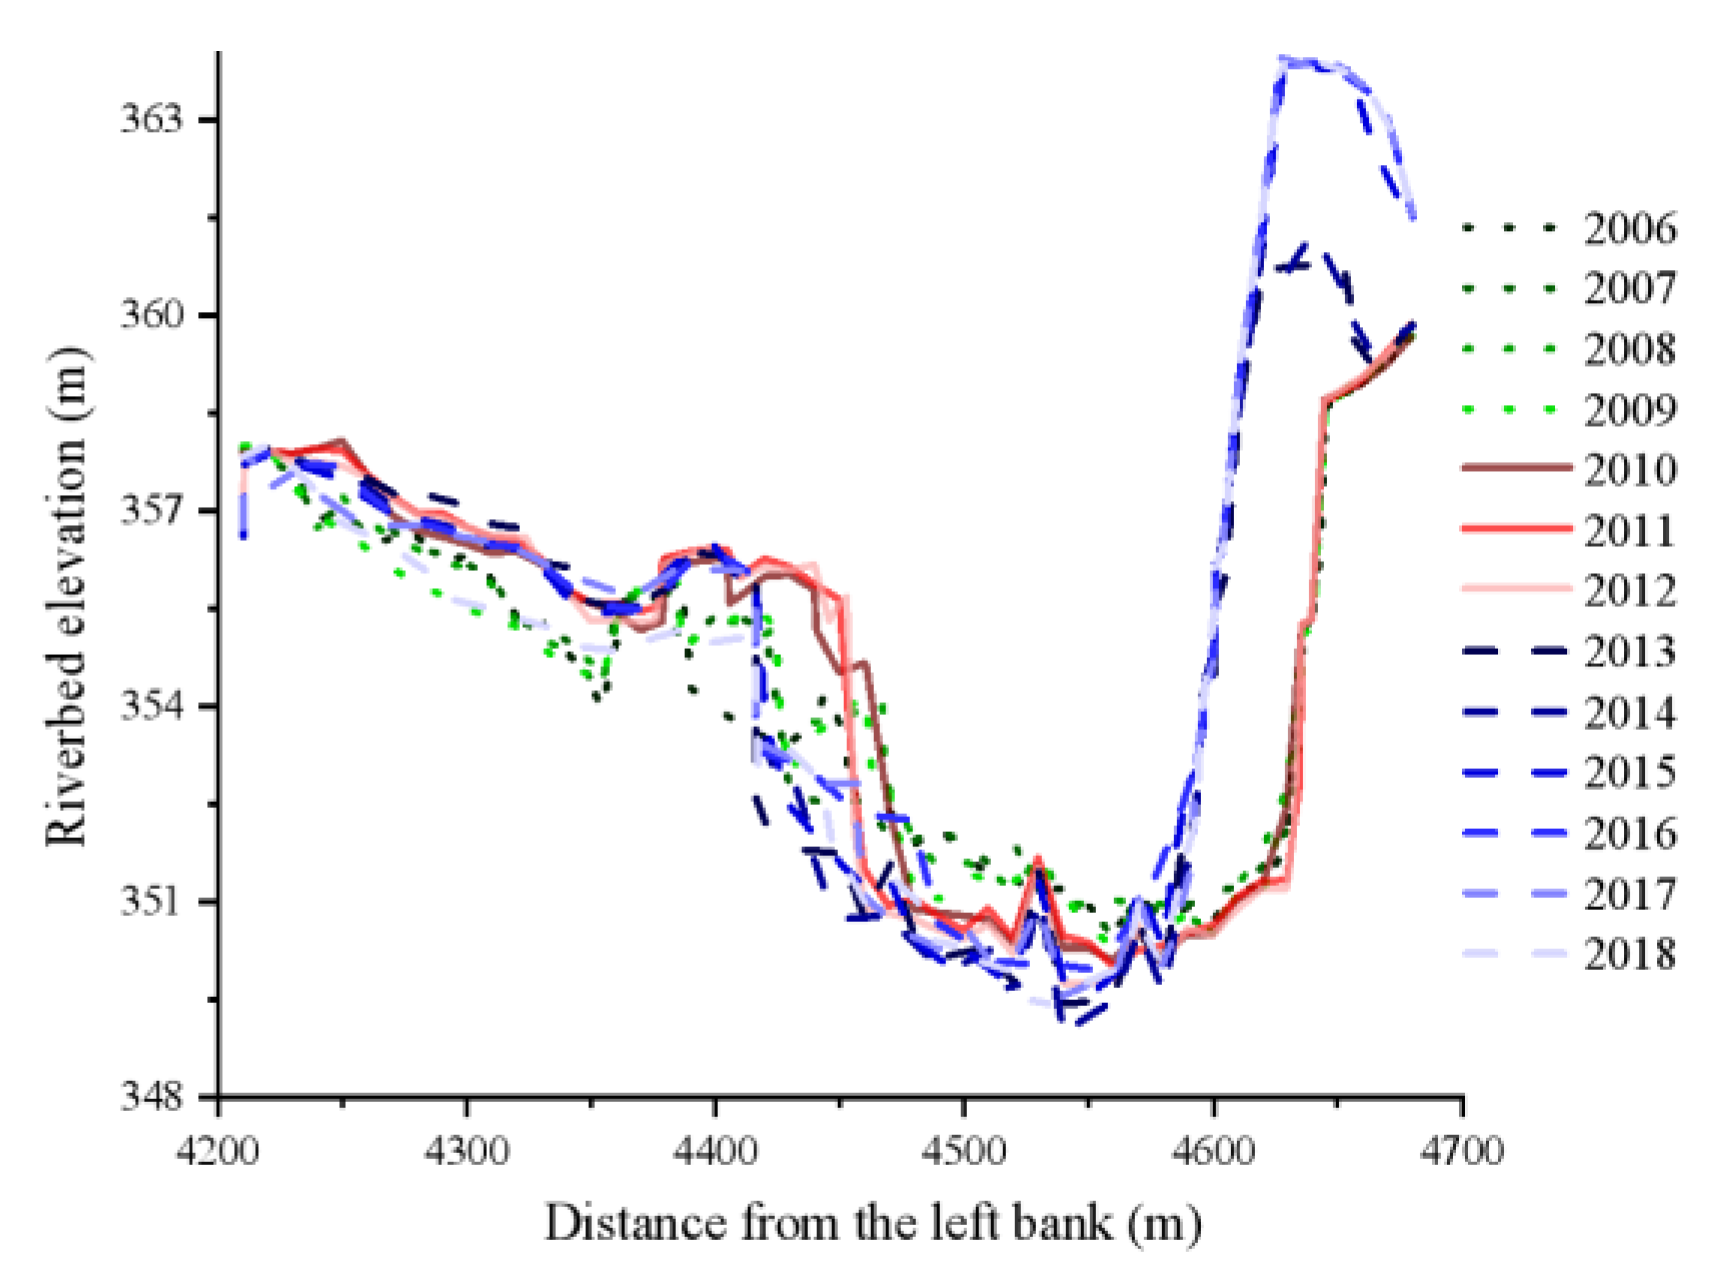
The river channel at Huaxian station has a gradual cross-sectional pattern (Figure 4), and it had been repeatedly scoured and silted up in recent years. Its main channel was shifted to the left as a whole, the left side of the main channel was shifted to the left by a total of 70 m, and the volume of the river channel was significantly expanded. Its morphological alterations can be split into three stages: the first was from 2006 to 2009, when the channel morphology was “U” and generally stable; the second was from 2010 to 2012, when the main channel swung 30 m to the left with a maximum undercut of 5 m, the riverbed was strongly scoured and turned into a “V” shape. The morphology of the river channel varied greatly from year to year. The final stage was from 2013–2018: The riverbed’s left bank shifted to the left over a prolonged period, the right bank’s beach lip’s height dropped, and the channel morphology returned to a “U” shape. Compared to the “U”−shaped river cross-section before 2010, the river’s main channel shifted dramatically to the left after 2013, and the shape of the bottom of the deep channel changed more noticeably each year.

3.1.2. Elevation Change of Cross-Section

Interannual elevation variation. Figure 5 displays the average elevation changes of the main channel of the recent post-flood cross-section at the three hydrological stations in the lower Weihe River. It is evident that while the average elevation of the cross-section at the Xianyang and Huaxian stations significantly decreased, it significantly increased at the Lintong station. The multi-year average elevations of the Xianyang, Lintong and Huaxian stations were 382.29, 354.88, and 336.42 m, respectively, with the maximum and minimum elevations of the Xianyang station occurring in 2007 and 2018, respectively, at 382.82 and 381.63 m; Lintong station’s maximum and minimum elevations were 355.70 and 354.40 m, respectively, in 2016, 2006, and 2009; Huaxian station’s maximum and minimum elevations were 337.87 and 335.15 m, respectively, in 2008 and 2015. The average elevation of the three hydrological stations after the flood was calculated using the multi-year average variation coefficient Cv, which was calculated without considering the effect of the height of the average river elevation. The results were 0.0009, 0.0012, and 0.0020, indicating that the multi-year average elevation of the Xianyang station was steadier, and the multi-year average elevation of the Huaxian station was more variable.
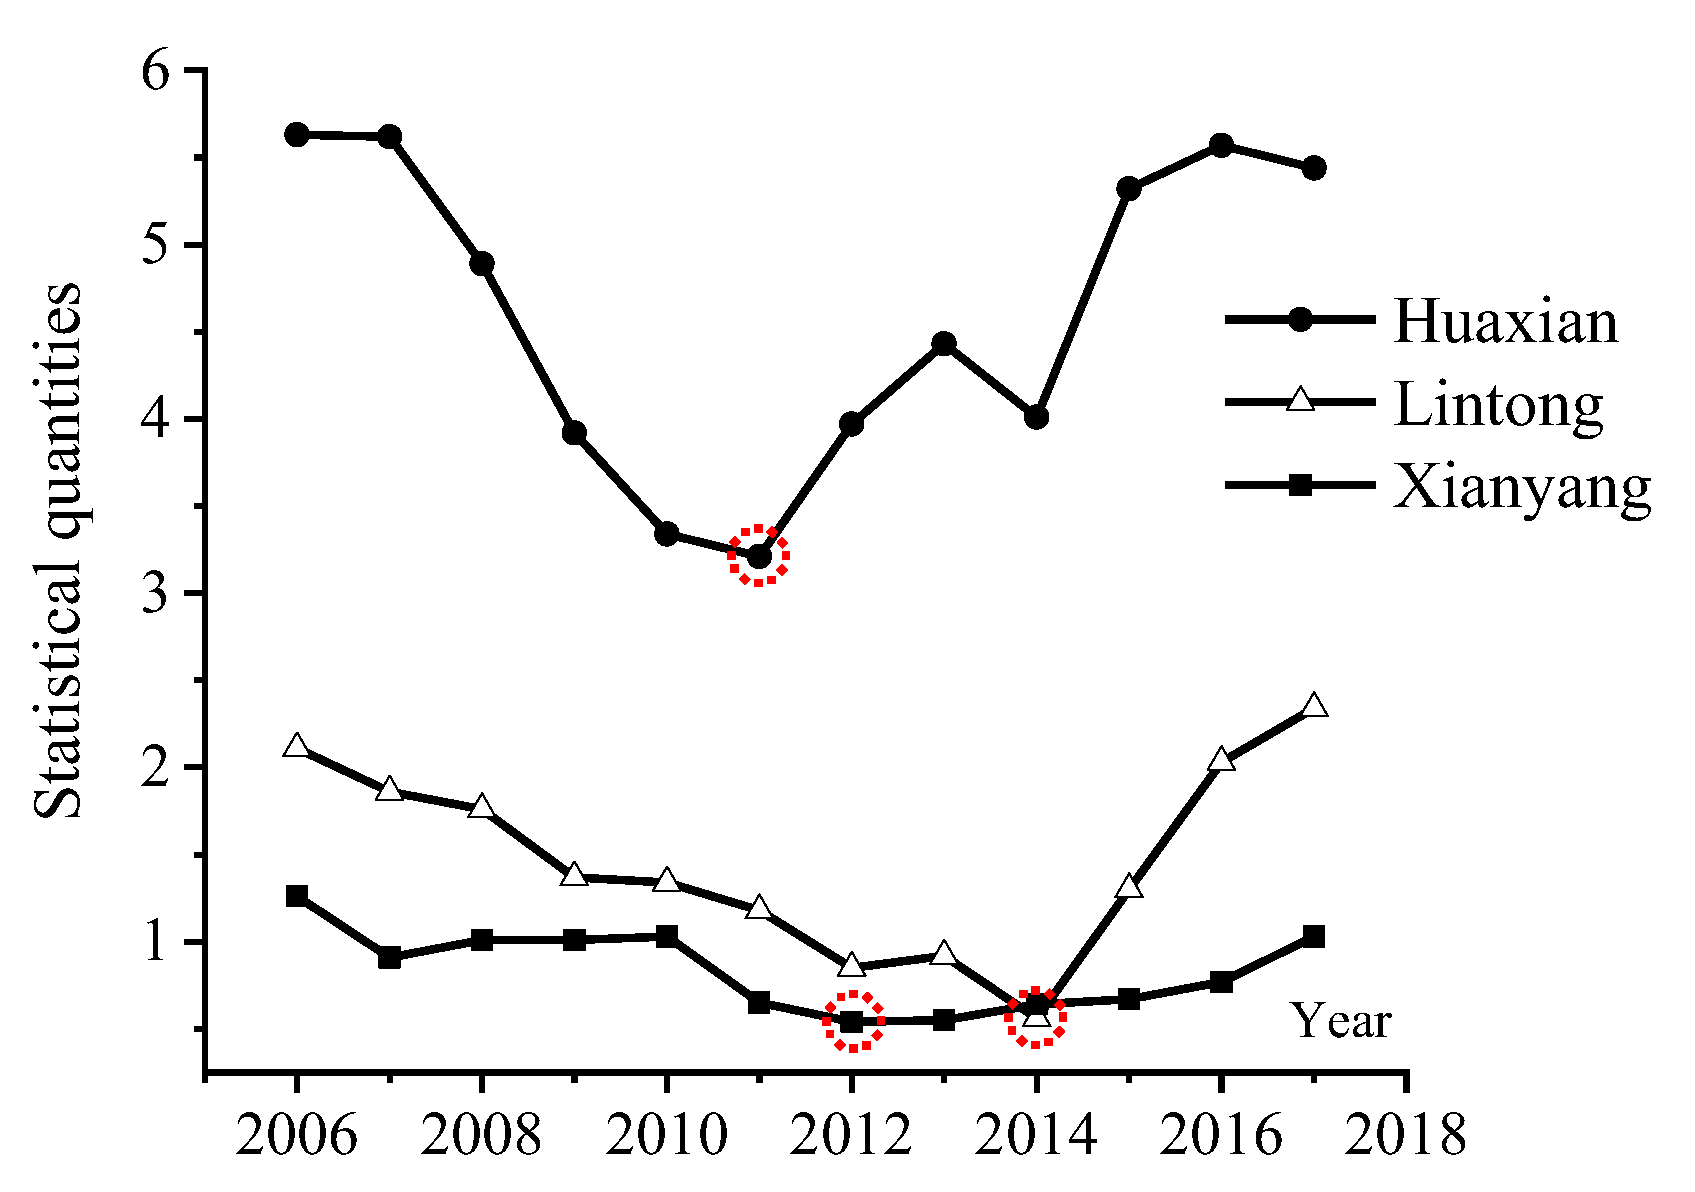
The results of Fisher’s breakpoint detection for the main channel cross-multi-year section’s mean elevation at mainly three hydrological stations in the lower Weihe River from 2006 to 2018 are shown in Figure 6. The figure shows that the Xianyang, Lintong, and Huaxian stations experienced their lowest points in 2012, 2014, and 2011, respectively, which means that in these years, the mean elevation of the central channel cross-sections at the three stations suddenly changed. Combining the results in Figure 5, Figure 6 shows that: the multi-year mean elevation statistic of Xianyang station |Z| value > 3.32 passed the 99% significance test, Z < 0, indicating that the Xianyang station’s multi-year average elevation overall exhibits a markedly declining trend, with an abrupt change in 2012. The multi-year mean elevation statistic |Z| value > 1.64 for Lintong passed the 95% significance test, Z > 0, indicating that the multi-year mean elevation of the Lintong station has a marked upward tendency overall and mutated in 2014. The multi-year mean elevation statistic |Z| value > 1.64 for the Huaxian station passed the 95% significance test, and Z < 0, indicating that the overall multi-year mean elevation of the Huaxian station significantly decreased trend and a sudden change in 2011. In summary, the lower Weihe River’s Xianyang and Huaxian station river cross-sections have shown a scouring trend since 2006, while the Lintong station cross-section has shown a siltation trend.
Intra-year elevation variation.Figure 7 shows the average elevation change of the main trough of the three hydrological station cross-sections before and after the flood period (April–September) from 2006 to 2018, and Table 1 shows the average elevation change of the main trough of the three hydrological station cross-sections during the flood and non-flood periods. The chart results show that the average elevation of Xianyang station before and after the flood was 382.23 m and 382.29 m, respectively; the average elevation rose in seven out of 13 years during the flood season, while in eight out of 12 years outside of the flood season, it declined. The average post-flood elevation of Lintong station was 354.88 m, and the average pre-flood elevation was 354.83 m. The average elevation rose in eight out of 13 years during the flood season while falling in eight out of 12 years outside the flood season. The average elevation of the Huaxian station after the flood was 336.42 m, the average elevation before the flood was 336.21 m, the average elevation during the flood period rose in nine out of 13 years, and the average elevation during the non-flood period fell in eight out of 12 years. The above results indicate that the recent flood water and sediment still mainly played a siltation role in the section, while the non-flood water and sediment played a scouring role. The multi-year average variation coefficient Cv of the average elevation difference of the main channel before and after the flood period was 6.88, 6.21, and 2.26 for Xianyang, Lintong, and Huaxian hydrological stations, respectively, which indicate that the incoming streamflow and sediment had a more dramatic effect on the cross-sectional elevation of Xianyang station during the flood period.

3.2. Characteristics of River Water and Sediment Changes

3.2.1. Variation of Water and Sediment Process

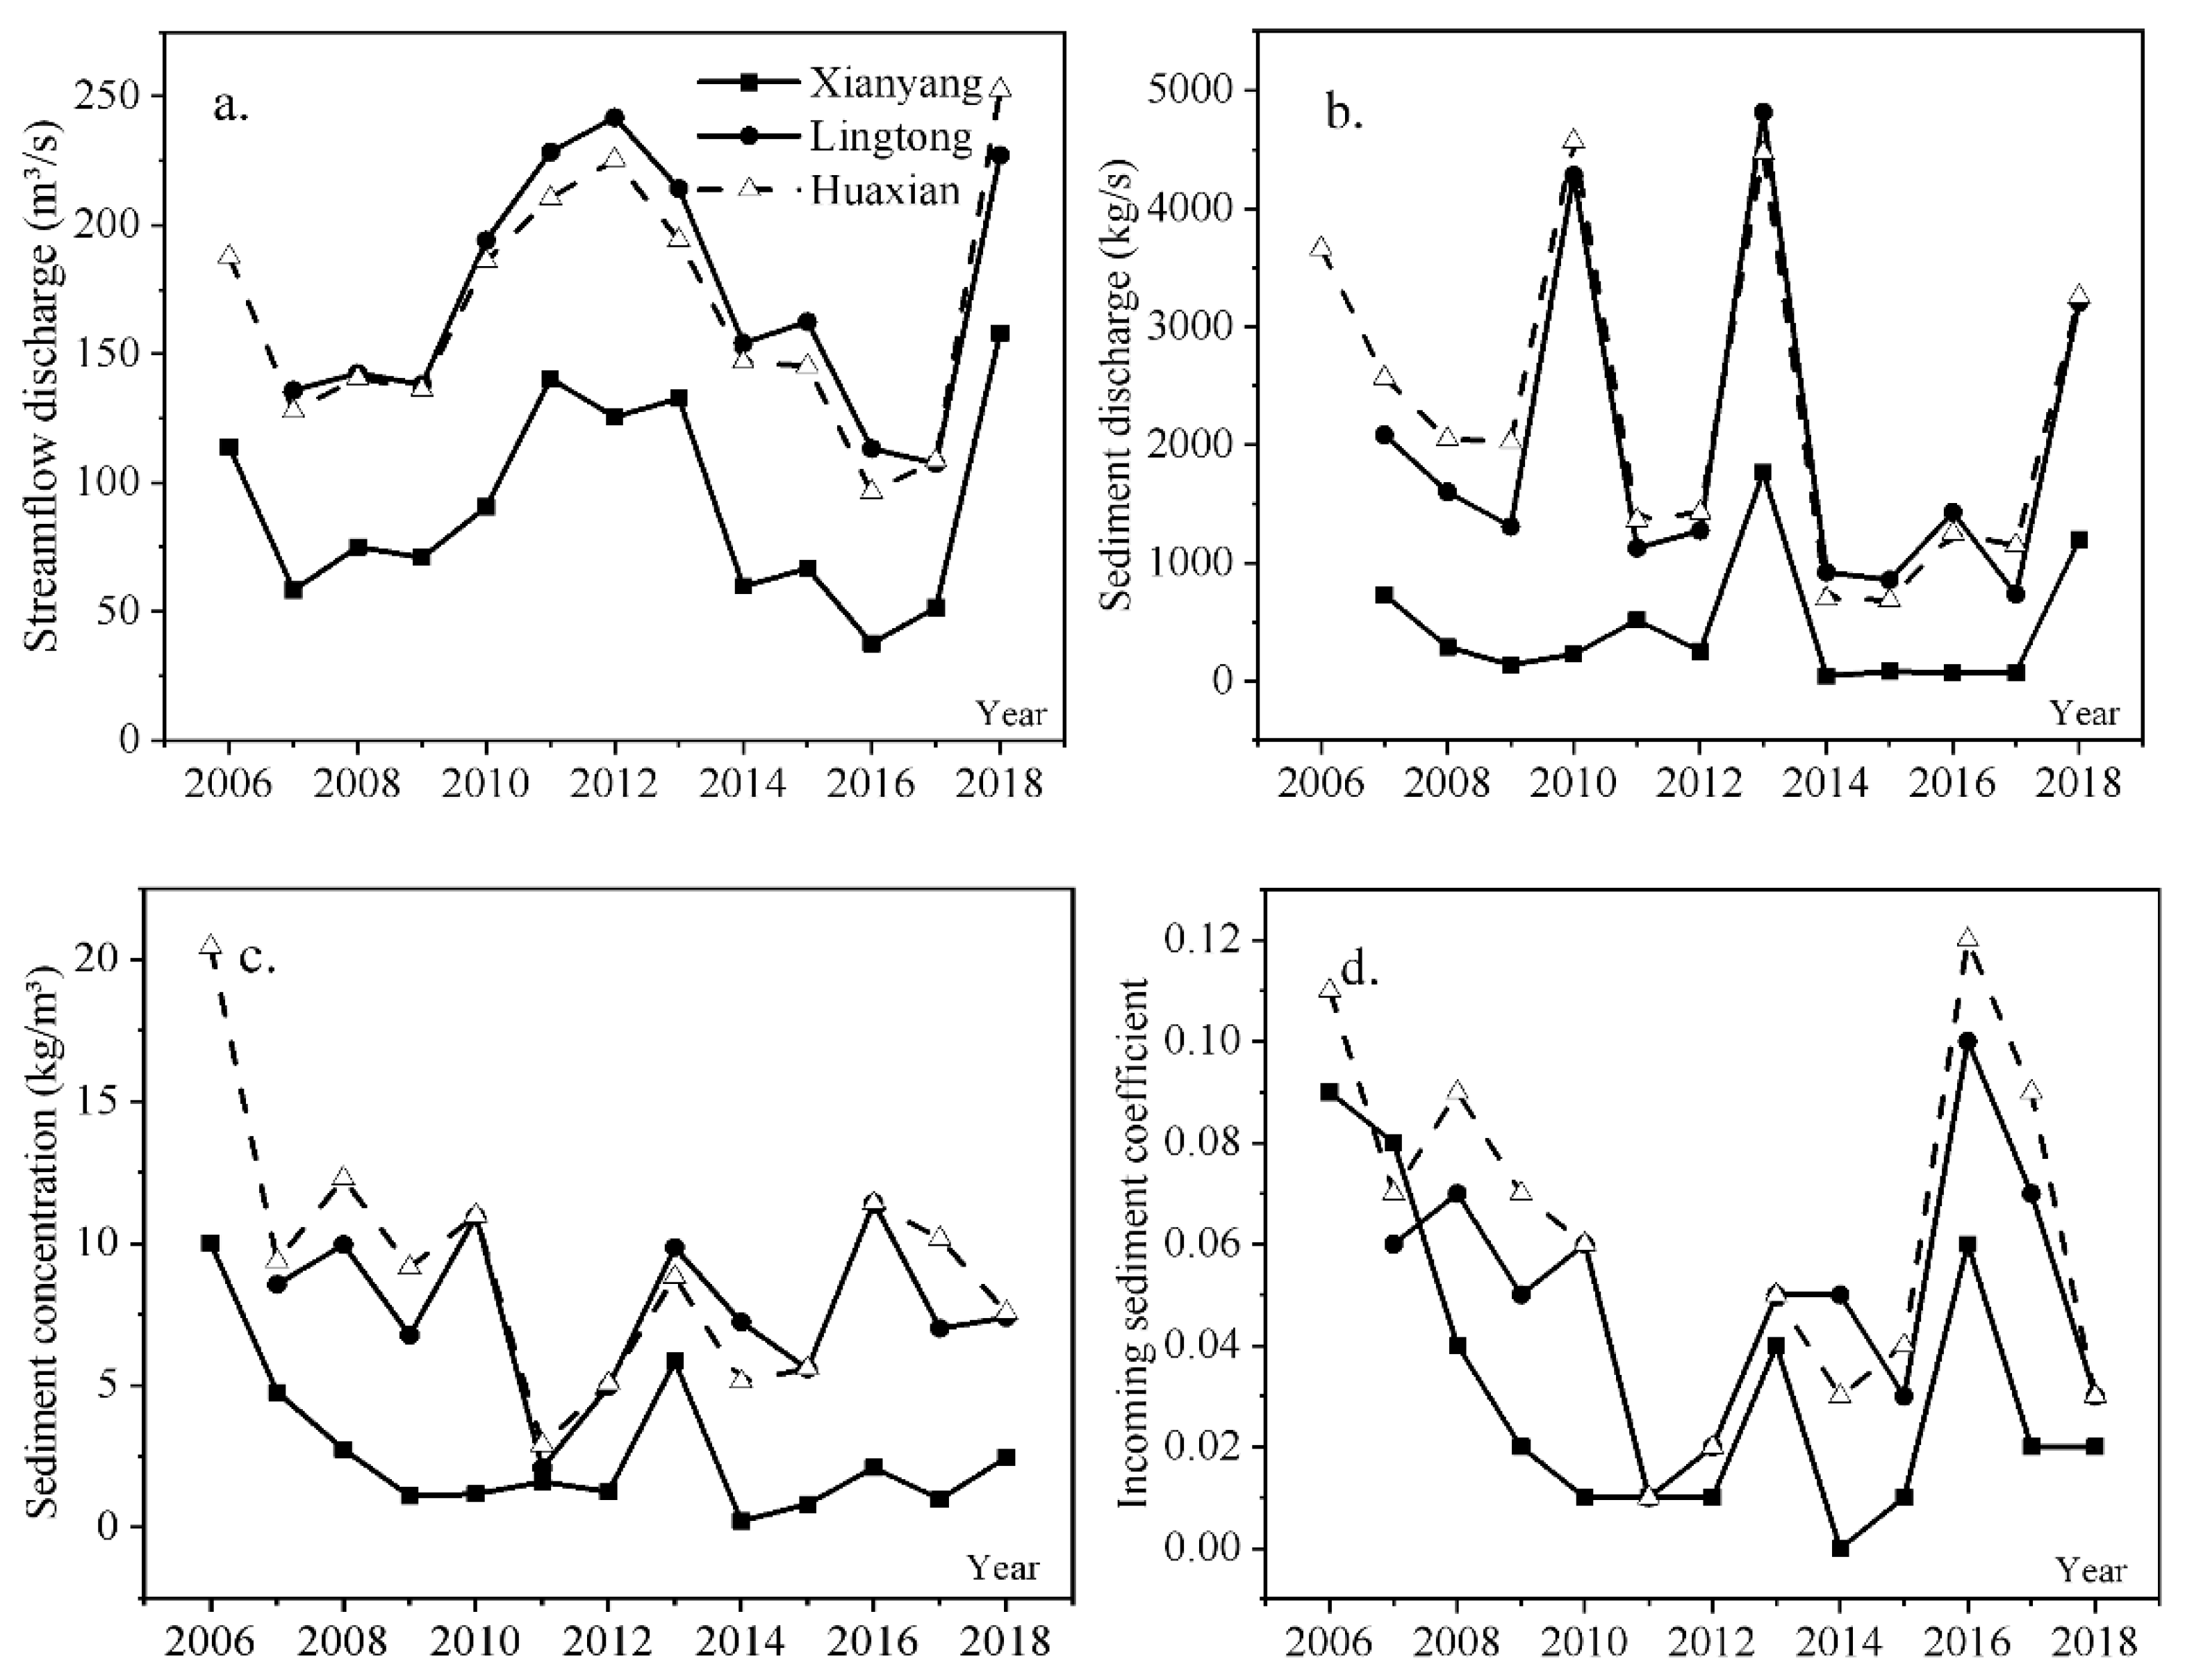
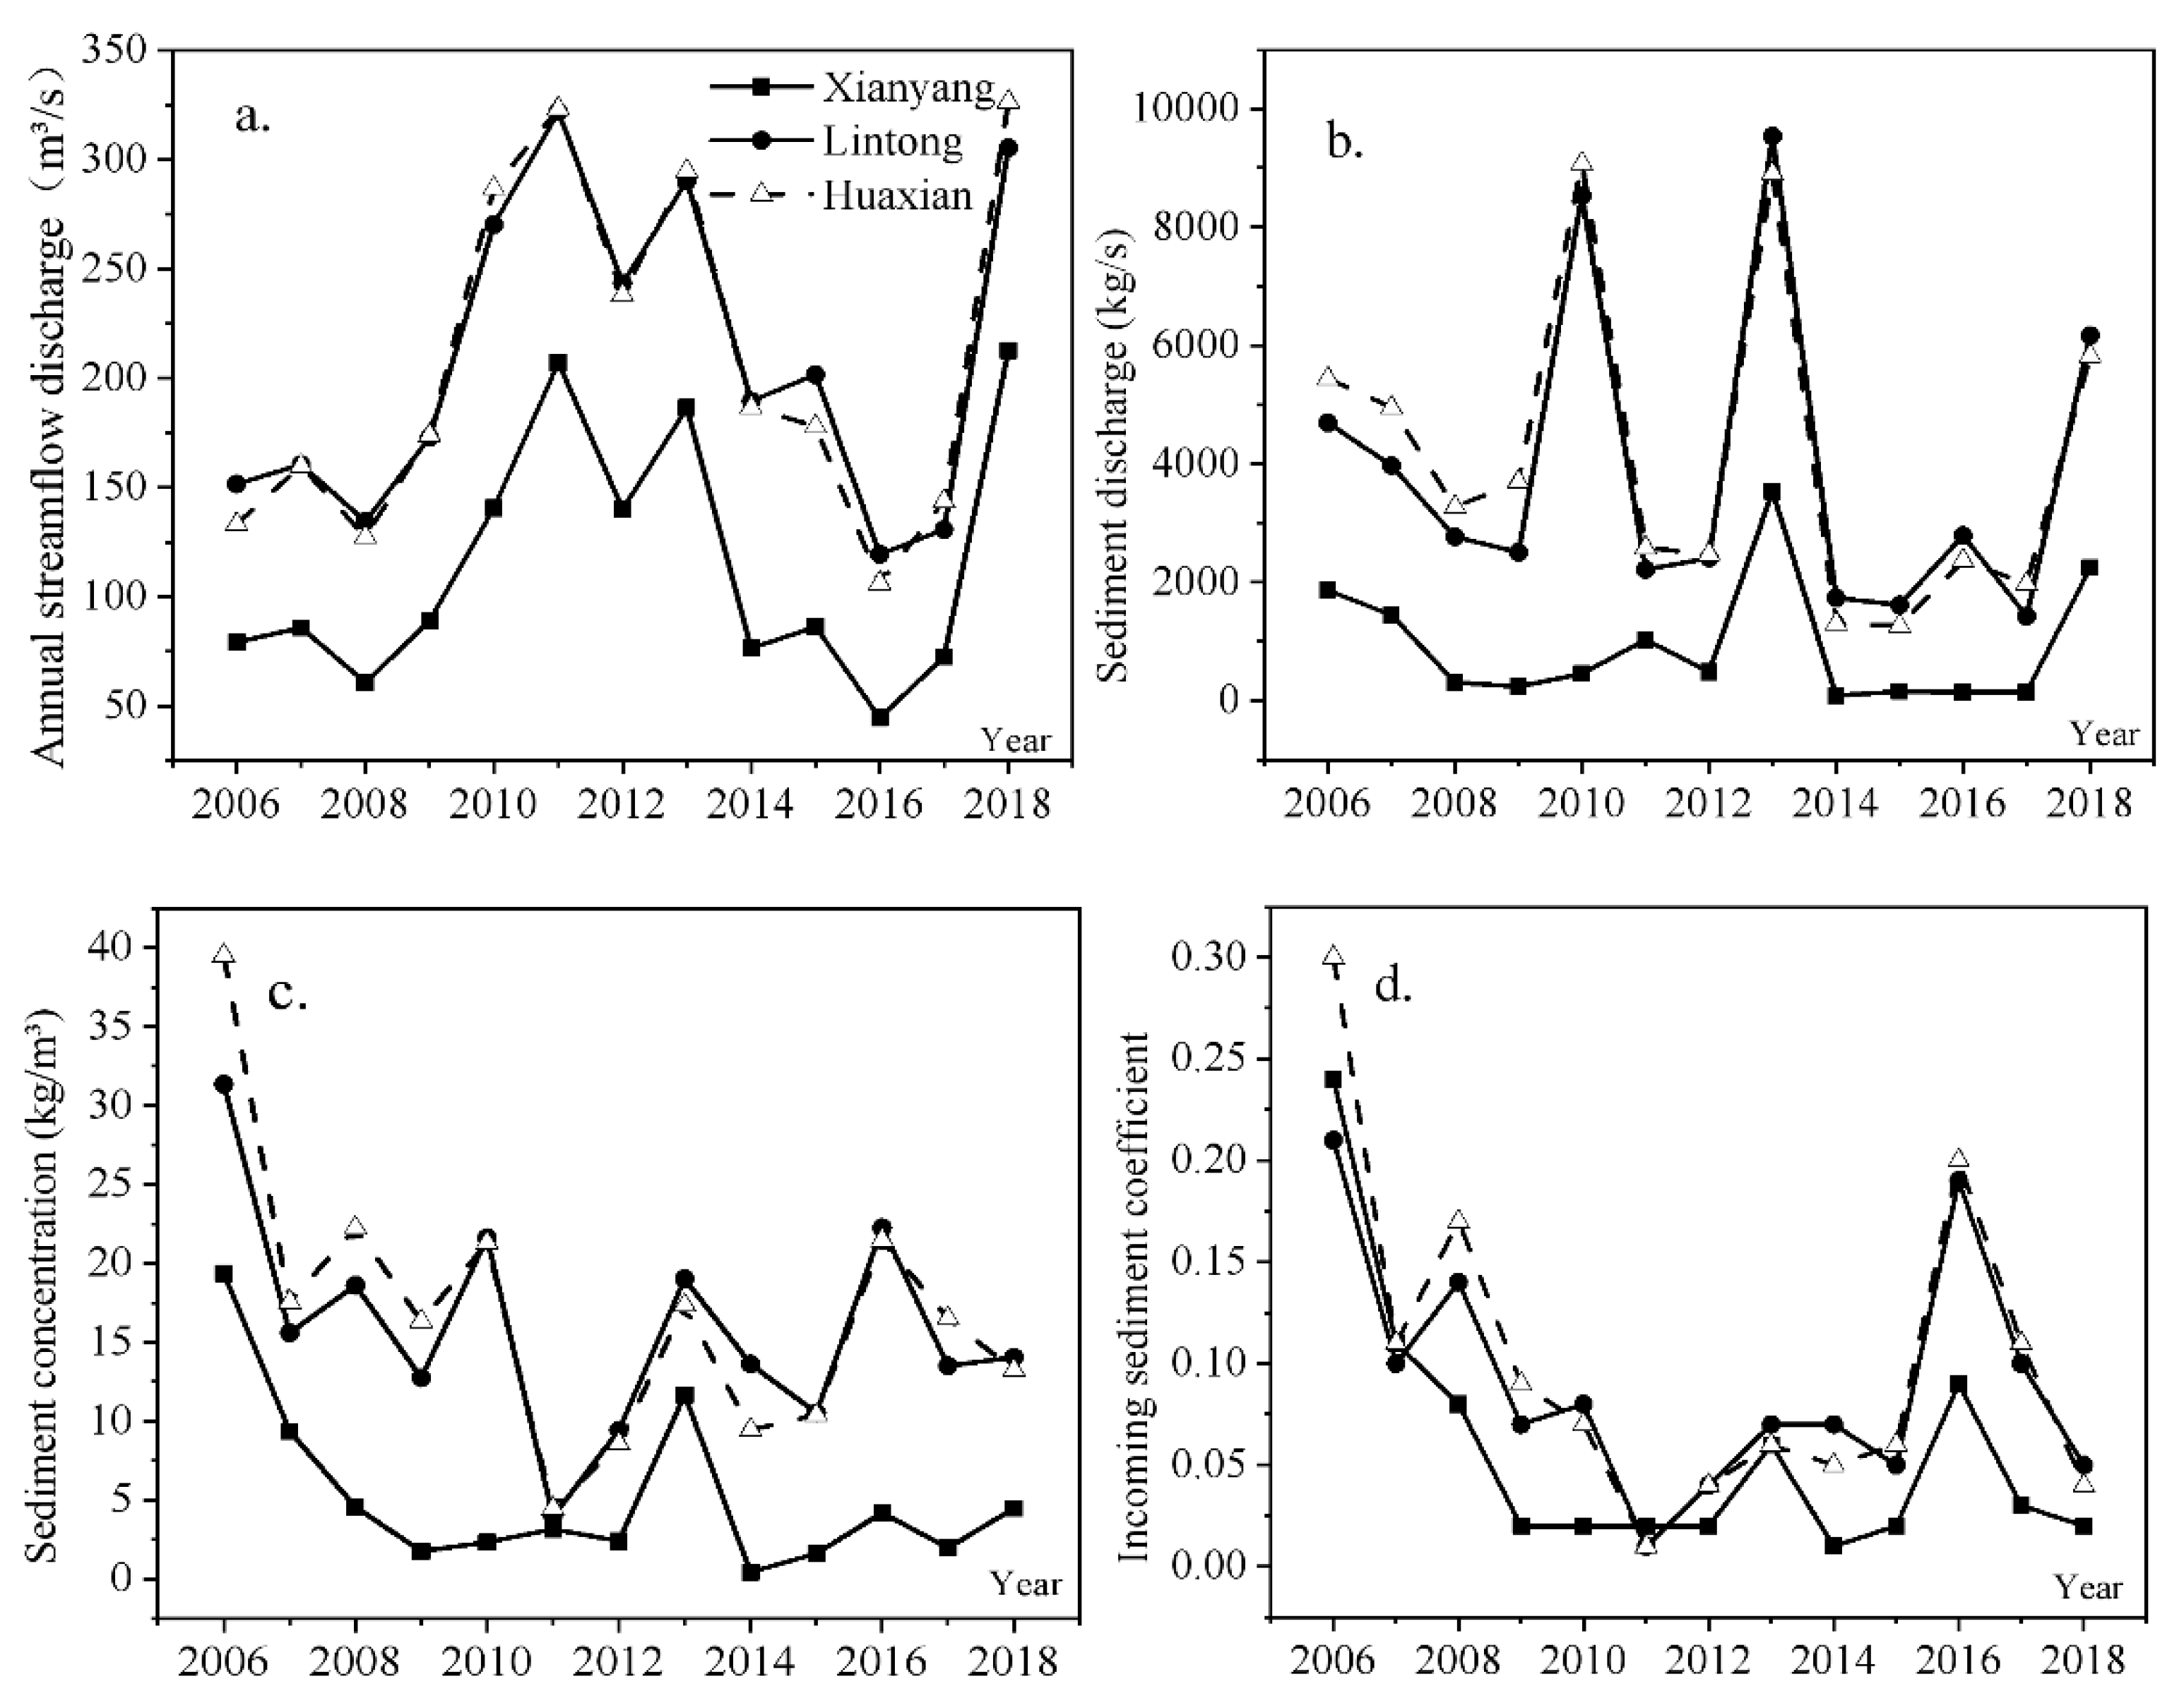
Interannual water-sediment variation. The Wei River is characterized by heterogeneous sources of streamflow and sediment, with the Jing and Bei Luo rivers to the north of the lower Wei River being the primary source of runoff and sediment. The Xianyang station is the uppermost hydrological station downstream. After the convergence of several downstream tributaries, the runoff volume, sediment content, and sediment transport are much smaller than those of the Lintong and Huaxian stations. According to the results of post-flood streamflow and sediment data in Table 2 and Figure 8, it is clear that although the streamflow and sediment volume at the downstream hydrological stations of the Weihe River vary greatly, the overall trend was the same. The multi-year average runoff discharges at Xianyang, Lintong, and Huaxian stations were 90.91 m3/s, 171.68 m3/s, and 166.11 m3/s, respectively; the sediment concentrations were 2.7 kg/m3, 7.65 kg/m3 and 9.15 kg/m3, respectively; the sediment discharges were 448.79 kg/s, 1969.38 kg/s and 2126.40 kg/s, respectively; the average incoming sediment coefficients were 0.031, 0.049 and 0.061, respectively. Through the Mann-Kendall test results of each station, it can be seen that there was a decreasing trend of multi-year runoff and sediment discharge in the Xianyang station and a significant decreasing trend in sediment concentration and incoming sediment coefficient; there was an increasing trend of multi-year runoff and sediment concentration in Lintong station, and a decreasing trend of sediment discharge and incoming sediment coefficient. The multi-year runoff discharge of the Huaxian station had an increasing trend; the sediment discharge, sediment concentration, and incoming sediment coefficient had a decreasing trend, among which the sediment discharge was significantly reduced. In summary, the multi-year runoff from Xianyang station had slightly decreased, while the runoff from the other two stations had increased over the years; the multi-year sediment concentration of Lintong station had slightly increased, likely due to its location at the mouth of the Jing River into Wei, while the sediment concentration of the other two stations had decreased over the years. The multi-year sediment discharge and incoming sediment coefficient of all three stations had decreased.
Inra-year water-sediment variation. According to Table 3, the multi-year average runoff volumes of Xianyang, Lintong and Huaxian stations were 114.00 m3/s, 207.14 m3/s and 206.12 m3/s, respectively; the sediment concentrations were 14.75 kg/m3, 15.87 kg/m3 and 16.80 kg/m3, respectively; the sediment discharge were 856.73 kg/s, 3806.64 kg/s and 3975.79 kg/s, respectively; the average incoming sediment coefficients were 0.056, 0.090 and 0.102, respectively. Combined with the streamflow-sediment change diagram in Figure 9 and the Mann–Kendall trend test results in Table 3, it can be seen that the trends of flood runoff, sediment concentration, sediment discharge, and incoming sediment coefficient of the three hydrological stations and the inter-annual change trends were more or less the same, the difference was that the multi-year flood runoff was in an increasing trend and the multi-year flood sediment concentration was in a decreasing trend.

3.2.2. Variation of Sediment Particles

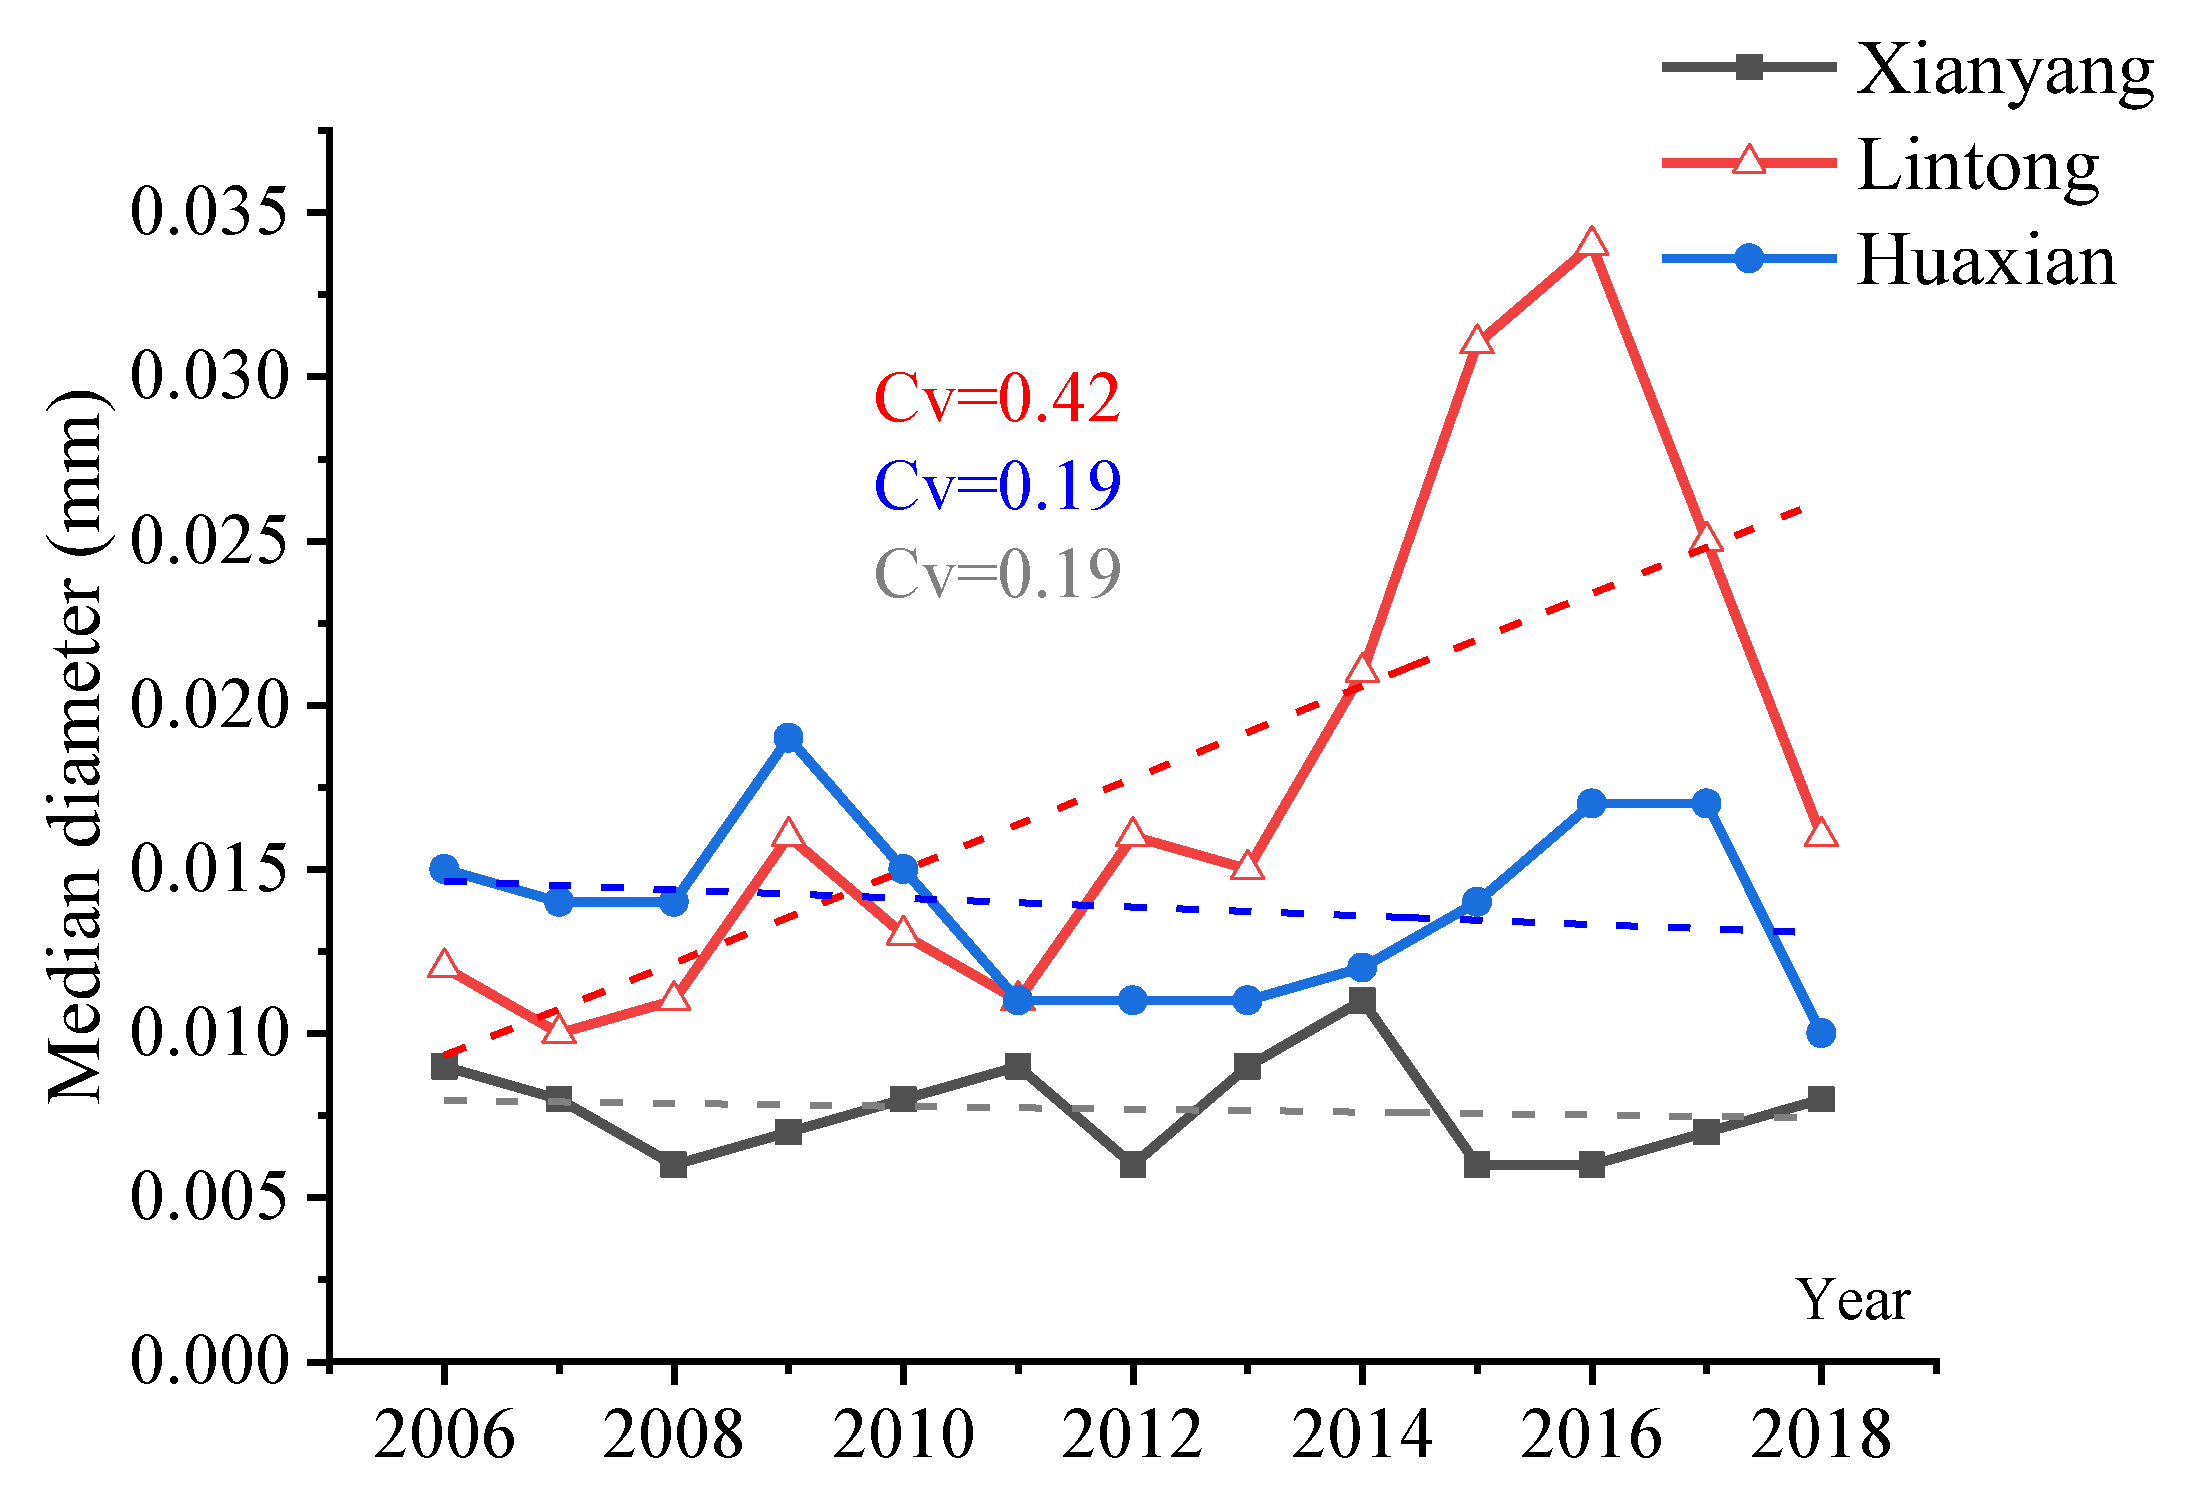
Changes in sediment grain size can affect the flushing and siltation state of the river, which is a crucial element in determining the sediment transport capacity of water flow [39]. Mostly fine sediment makes up the suspended sediment particle in the lower Weihe River. The distribution and change of median diameter of suspended sediment particles were depicted at the three stations in Figure 10, where the multi-year median diameter suspended sediment average particle size at the Xianyang, Lintong, and Huaxian stations were, respectively, 0.008 mm, 0.018 mm, and 0.014 mm. The maximum median diameter of suspended sediment particles at the Xianyang station was 0.011 mm, which appeared in 2014; the minimum value was 0.006 mm in 2008, 2012, 2015, and 2016, and the multi-year average coefficient of variation Cv was 0.19. The median diameter of suspended sediment particles at the Lintong station was more variable than others, the maximum value was 0.034 mm, which appeared in 2016, and the minimum value was 0.01 mm, which appeared in2007; the multi-year average variation coefficient Cv was as high as 0.42, and the difference between the maximum and minimum median diameter of suspended sediment particles could be 0.024 mm, which was 1.3 times of the multi-year average value, its annual average median diameter of suspended sediment particles kept increasing from 2014 to 2017, much higher than the multi-year average. The maximum median diameter of suspended sediment particles of 0.019 mm at the Huaxian station appeared in 2009, while the minimum value of 0.01 mm appeared in 2018, with the multi-year average variation coefficient Cv of 0.19. In conclusion, the Lintong station had the largest median diameter of suspended sediment particles, while the Xianyang station had the smallest. Both Xianyang and Huaxian stations had a very flat change or nearly no change, except for the Lintong station, where the change in the multi-year median diameter of suspended sediment particles was more pronounced and had a clear rising trend.

3.2.3. Typical Flood Characteristics

Sediment scouring and siltation in the lower Weihe River mainly occur during the flood period. When the flood peak flow exceeds 2000 m3/s, the channel starts to scour [40]. In this paper, we collected and collated the flood fields with flood peak flow greater than 2000 m3/s from 2006 to 2018, and the main data are shown in Table 4. it is worth mentioning that the maximum sediment concentration during the flood period in Xianyang station is less than 100 kg/m3 except for 273 kg/m3 in 2006, 114 kg/m3 in 2007, and 130 kg/m3 in 2016. It belongs to low sediment concentration flood. The maximum sediment concentration during the flood period at Lintong station exceeded 400 kg/m3 in 9 years, even reaching 641 kg/m3 in 2006, 536 kg/m3 in 2014, and 760 kg/m3 in 2016. the maximum sediment concentration at Huaxian station exceeded 300 kg/m3 in 9 years, including 5 years greater than 400 kg/m3, reaching 724 kg/m3 in 2006 and 808 kg/m3 in 2016. The heterogeneous sources of water and sediment in the Weihe River make the matching of flood periods extremely uneven, with the peak flow at Lintong and Huaxian stations not corresponding to the annual maximum sediment concentration and the highest sediment concentration often corresponding to small flows, so that floods with high sediment concentration and low flows often occur at the two stations. The highest sediment concentration of the floods at the three hydrological stations in 2011, 2013, and 2018 hardly exceeded 100 kg/m3, which were low sediment concentration floods.

3.3. Response of River Cross-Section Changes to Water and Sediment

3.3.1. Correspondence to Water and Sediment Changes

It can be seen from the average elevation data of the river cross-sections before and after the flood season at the three hydrological stations that, between the years 2006 and 2018, siltation occurred during the flood season at the Xianyang station for seven years, Lintong station for eight years, and Huaxian station for nine years. At all three hydrological stations, the runoff volume during the flood season was approximately 1.25 times greater than the average annual runoff volume, and the sediment concentration, sediment discharge, and incoming sediment coefficient are roughly twice as high as the average annual values, as shown in Table 2 and Table 3. In the lower Weihe River during the flood season, river flushing, siltation, and entering sediment coefficient are well correlated [28]. Because the increase in water volume during the flood is less than the increase in sediment volume, the average sediment content rises, and the incoming sediment coefficient rises dramatically, causing more sediment to be suspended and deposited [31], which is one of the reasons why the post-flood elevation of the main channel has been higher in recent years than the pre-flood level. The incoming sediment coefficient was lowest at Xianyang station and highest at Huaxian station, indicating that the incoming sediment coefficient is less likely for the river to silt the smaller.
We discovered that the incoming sediment coefficient at Xianyang station remained at a superficial level from 2010 to 2012, and the mean elevation changed abruptly in the last year when the incoming sediment coefficient decreased continuously and increased abruptly; the incoming sediment coefficient at Huaxian station decreased until 2011 and then began to increase, and the elevation also changed abruptly at this time. In this regard, we put together the annual average elevation and incoming sediment coefficient trend change from 2006 to 2018 (selected the data after 2011 for processing because of the river reconstruction in 2011 at Lintong station), as shown in Figure 11. According to Figure 8 above, the streamflow and sediment conditions at the Lintong and Huaxian stations were not significantly different. The streamflow and sediment at the Xianyang station were smaller than the other stations, with an incoming sediment coefficient about half that of the other two. When the trend lines of the average elevation and incoming sediment coefficient of the three hydrological stations were compared, we can see that the elevation and incoming sediment coefficient trends are highly synchronized under water and sediment conditions at Lintong and Huaxian stations. The decreasing elevation trend at Xianyang station was faster than the incoming sediment coefficient, which may be related to the smaller incoming sediment coefficient. In summary, there is a good relationship between the average elevation and the incoming sediment coefficient in the lower Weihe River, in line with related research [26,28].

3.3.2. Response to Sediment Particles

Under the same hydrological conditions, it is easier for streamflow flow to transport fine sediment than coarse sediment, and coarse sediment settles down more quickly in the process of transport [39]. The median diameter of suspended sediment particles at the Lintong station has increased significantly, with the average variation coefficient as high as 0.42 from 2006–2018. However, there has been no significant change at Xianyang and Huaxian stations. The trend of incoming streamflow and sediment in Lintong station is the same as in Huaxian station. However, the elevation of the central trough in Huaxian station has been rising in recent years, while that in Lintong station has been declining. After comparing the conclusion of the incoming sediment coefficient in the three stations, it is initially speculated that it may have a great relationship with human activities and the median diameter of suspended sediment particles. In 2011, Shaanxi Province started the comprehensive improvement of the Shaanxi section of the Wei River and carried out a river treatment project for Lintong in 2013. From the results in Figure 10, it can be seen that influenced by the renovation of the river channel by Shaanxi government activities, the median diameter of suspended sediment particles at Lintong station was smaller than that of Huaxian station before 2011. After that, the median particle size of sediment increased significantly and was much larger than that of the Huaxian and Xianyang stations; therefore, more sediment settled in the main channel of the Lintong station during sediment transport.

3.3.3. Response to Floods

The streamflow and sediment conditions in the lower reaches of the Weihe River are primarily determined by the incoming streamflow and sediment during the flood period. Different flood incoming streamflow and sediment conditions determine the different flushing and siltation characters [41]. River eddies, flashbacks, and stagnant flows occurring during floods can significantly reduce river velocity and deposit suspended silt into the streamflow [42,43]. However, hydrologic years and specific floods can also result in sediment depletion [44].
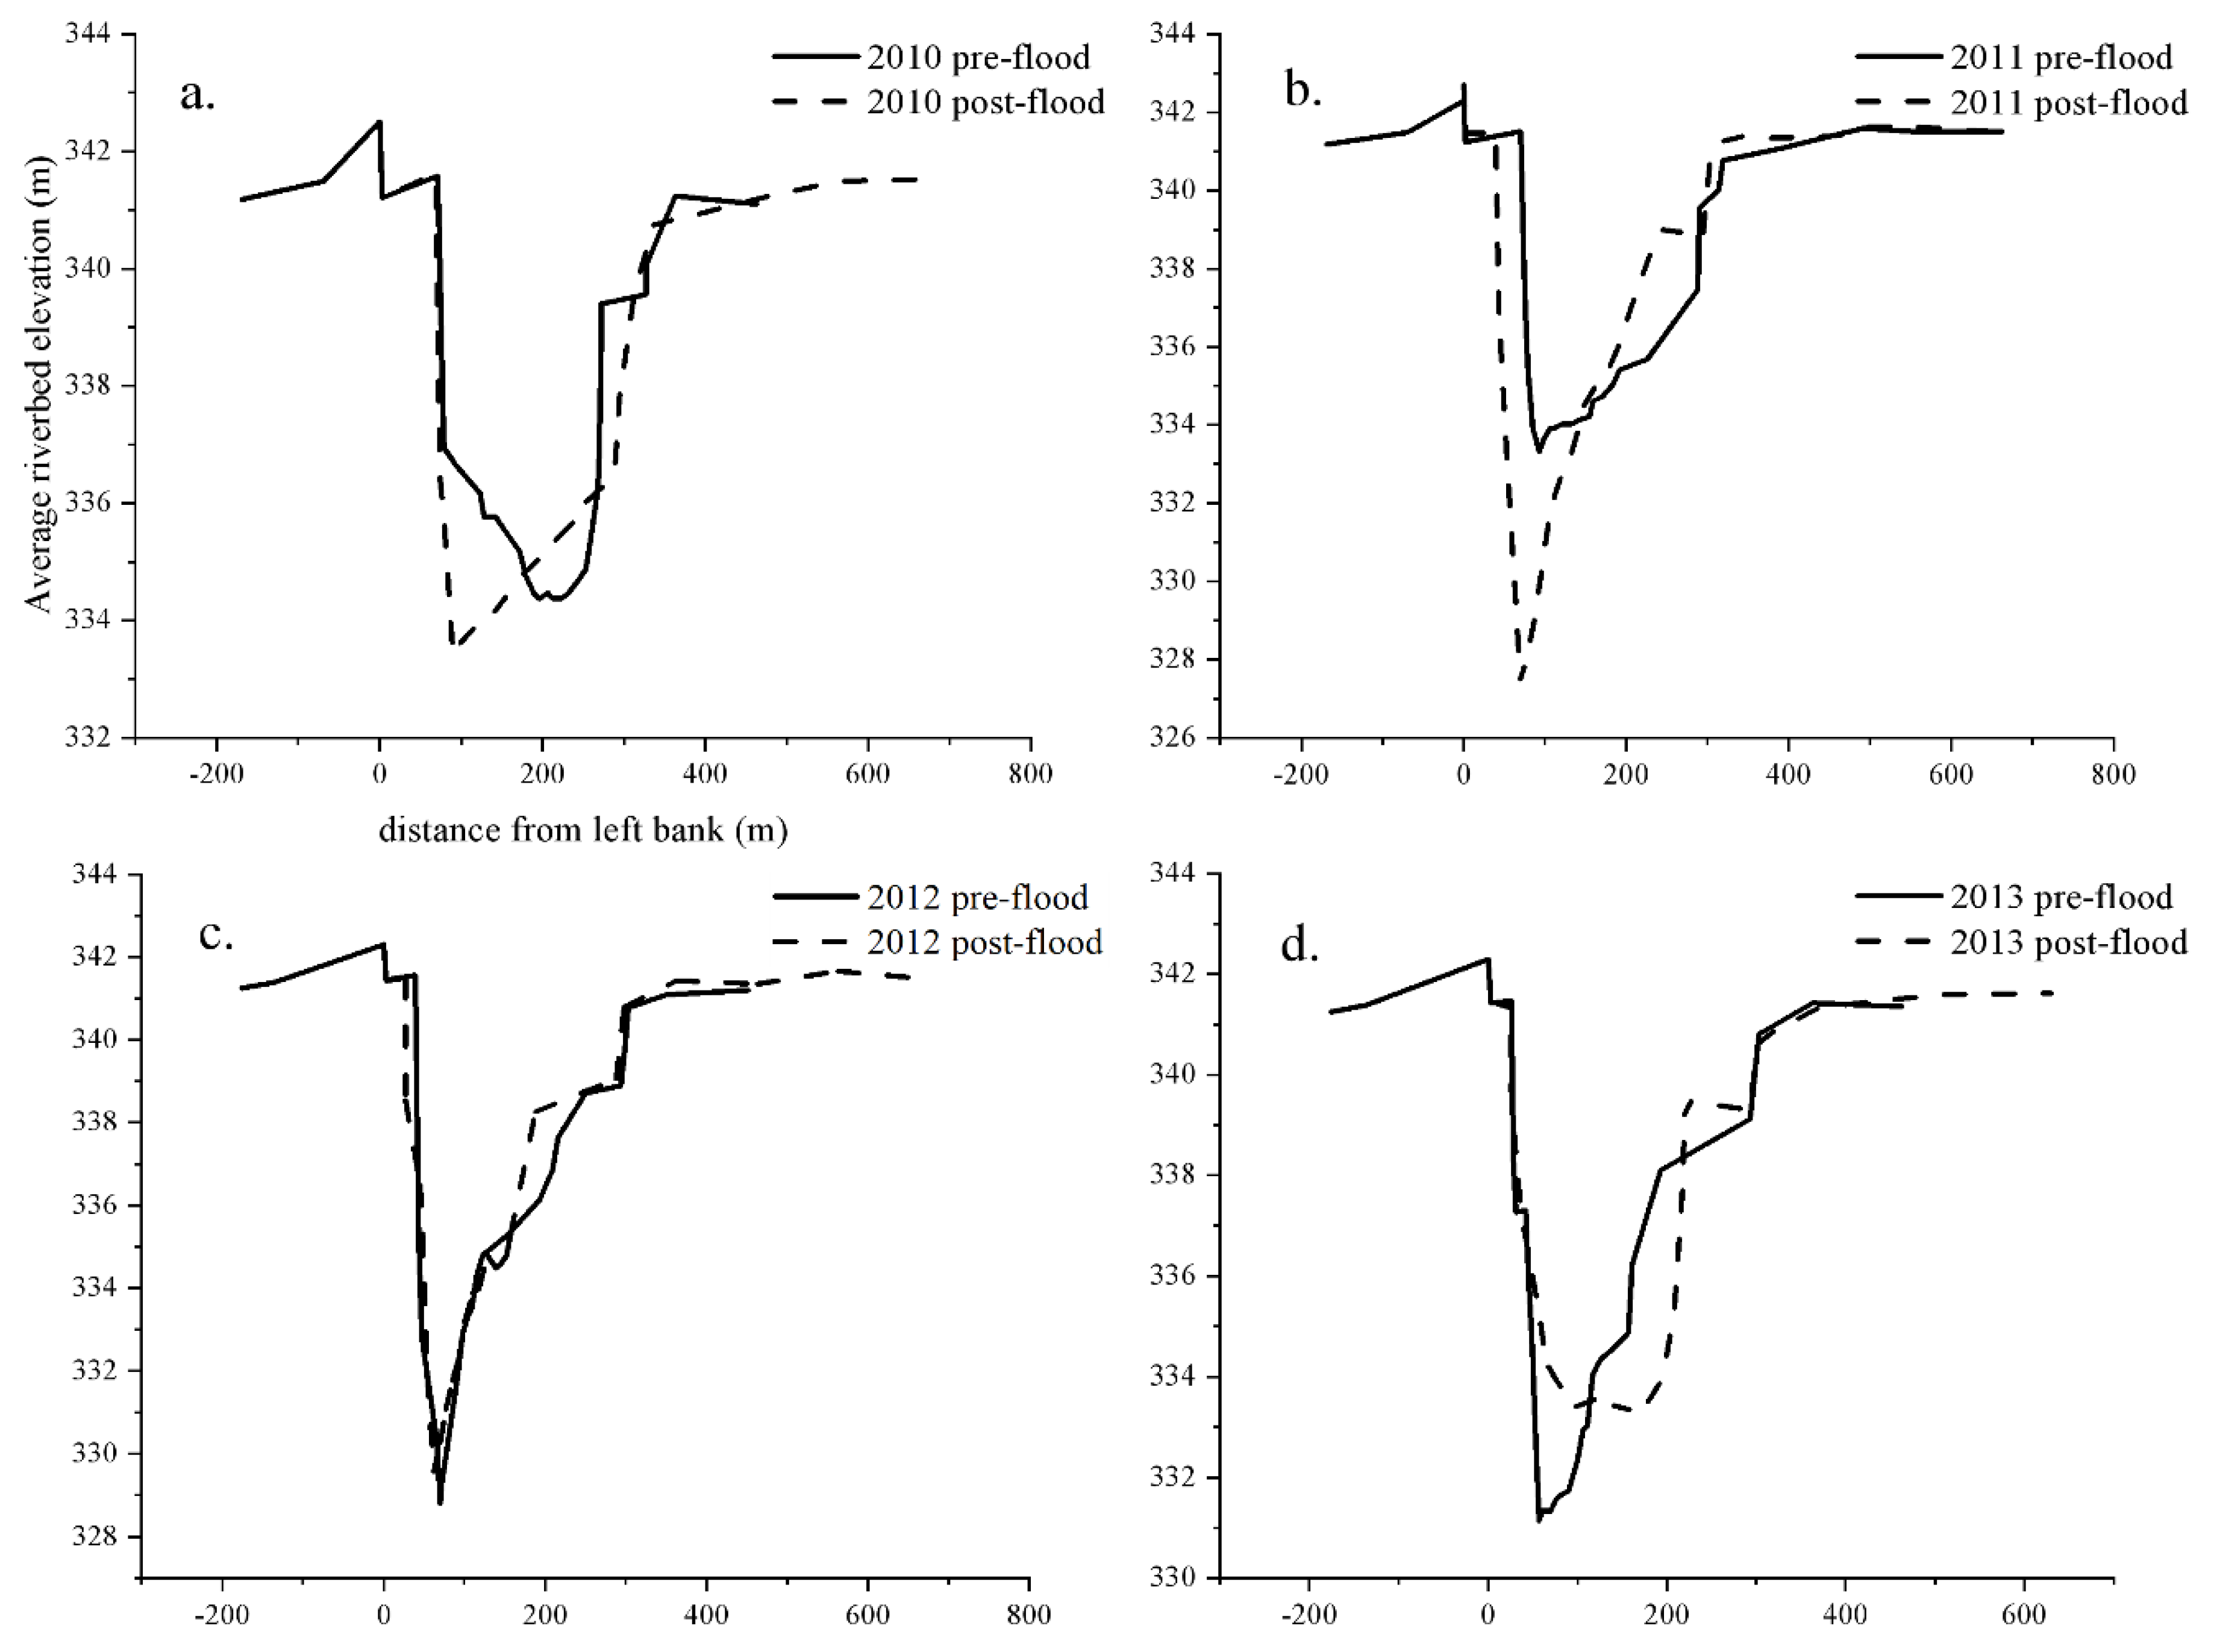
The frequent floods in the mainstream of the lower Weihe River have significantly impacted the morphology of the river cross-sections. Observing the timing of sudden changes in river channel morphology of three hydrological stations: Xianyang station in 2009, 2011, 2012, and 2013; Lintong station in 2010, 2013, and 2018; and Huaxian station in2010, 2011, 2012, and 2013, almost all of them occurred in flood years with large flood peaks, among which the cross-sectional morphology at Huaxian station responded more strongly to floods. Therefore, we take the Huaxian station as an example for analysis (Figure 12). 2010 flood peak flow at Huaxian station reached 2170 m3/s, but a small flood with high sediment concentration of 458 kg/m3 occurred in the same year, so the overall section was slightly scoured; in 2011, three large floods with low sediment concentration occurred, and the river section was severely scoured; in 2012, the flood peak flow and maximum sand content were basically the same as in 2010, and the section was also slightly scoured. In 2013, the flood peak flow was 2470 m3/s, the maximum sediment concentration was only 99.3 kg/m3, and the river channel was widened.
There are two main factors affecting the evolution of riverbeds. One is the boundary conditions of riverbeds, and the other is the water and sediment conditions. Stream flow is the dynamic condition that changes the morphology of the riverbed, while sediment is the material condition that constructs the riverbed. Under the same cross-sectional conditions, the higher the runoff velocity, the higher the impact force. Under the same hydrological conditions, the higher the sediment concentration of the river, the larger the median diameter of suspended sediment particles, the easier the sediment is deposited, and the more likely the riverbed is to siltation [4,5].
The Lintong station is at the confluence of the Jing River (the main source of sediment) and the mainstream of the Wei River, and the changes in its cross-section are special compared to the changes in the river cross-section at the other two hydrological stations. According to the flood peak data in Table 4, the flood peak flow and maximum sediment concentration at Lintong station were more significant than the other two stations in several floods; the median diameter of suspended sediment particles at Lintong station was enormous, so its sediment is more easily deposited in the violent vortex, back flood, and streamflow stagnation phenomenon, makes the river channel keeps silting up. Therefore, the continuous siltation in the section of the Lintong station results from the combined effect of streamflow, sediment conditions, and human activities [2,22,45].

4. Conclusions

Following an analysis of the change processes in river cross-sectional morphology and streamflow and sediment in various river sections to explore the relationship between them using real observed streamflow and sediment data as well as extensive cross-section data from the lower Weihe River from 2006 to 2018, the following results were made:
(1)
The river cross-sections at Xianyang and Huaxian stations in the lower reaches of the Wei River suffered scouring from 2006 to 2018, whereas the Lintong station experienced continuous siltation, exhibiting the general characteristic of “scouring at both ends and siltation in the middle”. The three stations’ annual pattern of river cross-section variation still demonstrates “non-flood scouring and flood siltation”;
(2)
Between 2006 and 2018, the lower Weihe River’s runoff volume increased, the sediment concentration and discharged decreased, and the incoming sediment coefficient significantly decreased. The overall state was characterized by “more water and less sediment”. The median diameter of suspended sediment particles at the Xianyang and Huaxian stations changed gradually and decreased slightly, whereas the median diameter of suspended sediment particles at the Lintong station increased slightly;
(3)
Large floods impact the cross-sectional morphology of the channel, and variations in the mean elevation of the main channel in the lower Weihe River are closely correlated with the changes in the incoming sediment coefficient. Additionally, the scouring and silting of the river channel are significantly impacted by variations in the median diameter of suspended sediment particles. The type of human activities, such as river training projects, can also directly impact the cross-sectional morphology.

Author Contributions

Conceptualization, C.M. and P.G.; methodology, C.M.; validation, P.G. and D.Q.; formal analysis, C.M. and P.G.; investigation, C.M.; resources, C.M.; data curation, C.M. and P.G.; writing—original draft preparation, C.M.; writing—review and editing, P.G., X.M. and D.Q.; supervision, P.G. and X.M.; project administration, C.M. All authors have read and agreed to the published version of the manuscript.

Funding

This work was funded by the National Natural Science Foundation of China (Grant No. U2243211).

Institutional Review Board Statement

Not applicable.

Informed Consent Statement

Not applicable.

Data Availability Statement

Not applicable.

Conflicts of Interest

The authors declare no conflict of interest.

References

  1. Schumm, S.A. The Fluvial System; Wiley-Interscience: New York, NY, USA, 1977. [Google Scholar]
  2. Gregory, K.J. The human role in changing river channels. Geomorphology 2006, 79, 172–191. [Google Scholar] [CrossRef]
  3. Rădoane, M.; Obreja, F.; Cristea, I.; Mihailă, D. Changes in the channel-bed level of the eastern Carpathian rivers: Climatic vs. human control over the last 50 years. Geomorphology 2013, 193, 91–111. [Google Scholar] [CrossRef]
  4. Biedenharn, D.S.; Thorne, C.R.; Watson, C.C. Recent morphological evolution of the Lower Mississippi River. Geomorphology 2000, 34, 227–249. [Google Scholar] [CrossRef]
  5. Phillips, J.D. Toledo Bend reservoir and geomorphic response in the lower Sabine River. River Res. Appl. 2003, 19, 137–159. [Google Scholar] [CrossRef]
  6. Xia, J.; Li, X.; Li, T.; Zhang, X.; Zong, Q. Response of reach-scale bankfull channel geometry to the altered flow and sediment regime in the lower Yellow River. Geomorphology 2014, 213, 255–265. [Google Scholar] [CrossRef]
  7. Xu, J. A study of sedimentation rate in the lower Yellow River based on cross-section measurement data. Z. Geomorphol. 2012, 56, 239–254. [Google Scholar] [CrossRef]
  8. He, L. Application of the numerical model in evaluating the effects of a planned reservoir on reach-scale bankfull discharge of the lower Wei River. J. Mt. Sci.-Engl. 2018, 15, 1057–1070. [Google Scholar] [CrossRef]
  9. Kong, D.; Latrubesse, E.M.; Miao, C.; Zhou, R. Morphological response of the Lower Yellow River to the operation of Xiaolangdi Dam, China. Geomorphology 2020, 350, 106931. [Google Scholar] [CrossRef]
  10. Magliulo, P.; Bozzi, F.; Leone, G.; Fiorillo, F.; Leone, N.; Russo, F.; Valente, A. Channel adjustments over 140 years in response to extreme floods and land-use change, Tammaro River, southern Italy. Geomorphology 2021, 383, 107715. [Google Scholar] [CrossRef]
  11. Poeppl, R.E.; Coulthard, T.; Keesstra, S.D.; Keiler, M. Modeling the impact of dam removal on channel evolution and sediment delivery in a multiple dam setting. Int. J. Sediment. Res. 2019, 34, 537–549. [Google Scholar] [CrossRef]
  12. Liu, W.; Wang, S.; Sang, Y.; Ran, L.; Ma, Y. Effects of large upstream reservoir operations on cross-sectional changes in the channel of the lower Yellow River reach. Geomorphology 2021, 387, 107768. [Google Scholar] [CrossRef]
  13. Ma, H.; Nittrouer, J.A.; Fu, X.; Parker, G.; Zhang, Y.; Wang, Y.; Lamb, M.P.; Cisneros, J.; Best, J.; Parsons, D.R.; et al. Amplification of downstream flood stage due to damming of fine-grained rivers. Nat. Commun. 2022, 13, 3054. [Google Scholar] [CrossRef] [PubMed]
  14. Magilligan, F.J.; Nislow, K.H. Changes in hydrologic regime by dams. Geomorphology 2005, 71, 61–78. [Google Scholar] [CrossRef]
  15. Petts, G.E.; Gurnell, A.M. Dams and geomorphology: Research progress and future directions. Geomorphology 2005, 71, 27–47. [Google Scholar] [CrossRef]
  16. Dai, Z.; Liu, J.T. Impacts of large dams on downstream fluvial sedimentation: An example of the Three Gorges Dam (TGD) on the Changjiang (Yangtze River). J. Hydrol. 2013, 480, 10–18. [Google Scholar] [CrossRef]
  17. Diefenderfer, H.L.; Borde, A.B.; Cullinan, V.I. Floodplain Wetland Channel Planform, Cross-Sectional Morphology, and Sediment Characteristics Along an Estuarine to Tidal River Gradient. J. Geophys. Res. Earth Surf. 2021, 126, e2019JF005391. [Google Scholar] [CrossRef]
  18. Zheng, S.; Edmonds, D.A.; Wu, B.; Han, S. Backwater controls on the evolution and avulsion of the Qingshuigou channel on the Yellow River Delta. Geomorphology 2019, 333, 137–151. [Google Scholar] [CrossRef]
  19. Sziło, J.; Bialik, R.J. Bedload transport in two creeks at the ice-free area of the Baranowski Glacier, King George Island, West Antarctica. Pol. Polar Res. 2017, 38, 21–39. [Google Scholar] [CrossRef] [Green Version]
  20. Sziło, J.; Bialik, R. Grain Size Distribution of Bedload Transport in a Glaciated Catchment (Baranowski Glacier, King George Island, Western Antarctica). Water 2018, 10, 360. [Google Scholar] [CrossRef] [Green Version]
  21. Zheng, S.; Wu, B.; Thorne, C.R.; Tan, G. Case Study of Variation of Sedimentation in the Yellow and Wei Rivers. J. Hydraul Eng. 2015, 141, 05014009. [Google Scholar] [CrossRef]
  22. Tian, S.; Luo, W.; Jia, Z.; Butalia, R.S. Temporal variation of over-bank flooding of Wei River and its impact on a riparian wetland in Xi’an, China. Hydrol. Process. 2010, 24, 1296–1307. [Google Scholar] [CrossRef]
  23. Guangqian, W.; Baosheng, W.; Zhao, Y. Sedimentation problems and management strategies of Sanmenxia Reservoir, Yellow River, China. Water Resour Res. 2005, 41. [Google Scholar] [CrossRef] [Green Version]
  24. ShanZheng, H.B. Delayed morphological adjustment of the Yellow and lower Wei Rivers upstream of the Sanmenxia dam at multi-temporal scales. Catena 2022, 212, 106035. [Google Scholar]
  25. Liang, Z.; Li, W.; Zhang, C. Study on the flushing and siltation characteristics of the lower Weihe and Yellow River channels. Yellow River 2003, 25, 5–6+9–45. (In Chinese) [Google Scholar]
  26. Deng, A.; Guo, Q. Characteristics and evolution mechanism of cross sections along the Lower Weihe River. J. Sediment Res. 2006, 5, 33–39. (In Chinese) [Google Scholar]
  27. Zhang, C.; Jiang, N.; Hou, S.; Yi, X. Recent analysis of the causes of river siltation in the lower Weihe River. Yellow River 2006, 6, 75–76+79. (In Chinese) [Google Scholar]
  28. Fan, X.; Shi, C.; Shao, W.; Zhou, Y. Study’of fluvial processes of Lower Weihe River in recent years. J. Sediment Res. 2013, 1, 20–26. (In Chinese) [Google Scholar]
  29. He, L. Numerical evaluation of the effects of the Dongzhuang reservoir on channel deposition in the Lower Wei River in China. J. Mt. Sci.-Engl. 2021, 18, 1550–1563. [Google Scholar] [CrossRef]
  30. Shao, W.; Shi, C.; Fan, X.; Zhou, Y.; Bai, J. Sediment budgets for a sediment-laden river: The lower Wei River in the period 1960–1990. Earth Surf. Proc. Land 2015, 40, 414–426. [Google Scholar] [CrossRef]
  31. Hou, S.; Wang, P.; Guo, Y.; Hu, T. Factors driving riverbed scouring and sedimentation in the Bayangaole to Toudaoguai reaches of the Upper Yellow River. J. Geogr. Sci. 2016, 26, 1305–1320. [Google Scholar] [CrossRef]
  32. Yin, Z.; Zhang, H.; Tan, G.; Liu, Y.; Feng, Z.; Shu, C.; Wang, J.; Zhang, G. Operating Effects of the Three Gorges Reservoir on the Riverbed Stability in the Wuhan Reach of the Yangtze River. Water 2021, 13, 3353. [Google Scholar] [CrossRef]
  33. Yuan, X.; Tian, F.; Wang, X.; Liu, Y.; Chen, M. Small-scale sediment scouring and siltation laws in the evolution trends of fluvial facies in the Ningxia Plain Reaches of the Yellow River (NPRYR). Quatern Int. 2018, 476, 14–25. [Google Scholar] [CrossRef]
  34. Kendall, M.G. A New Measure of Rank Correlation. Biometrika 1938, 30, 81–93. [Google Scholar] [CrossRef]
  35. Mann, H.B. Nonparametric Tests Against Trend. Econometrica 1945, 13, 245–259. [Google Scholar] [CrossRef]
  36. Fisher, W.D. On Grouping for Maximum Homogeneity. J. Am. Stat. Assoc. 1958, 53, 789–798. [Google Scholar] [CrossRef]
  37. Lindberg, M.B. Fisher: A turbo Pascal unit for optimal partitions. Comput. Geosci.-UK 1990, 16, 717–732. [Google Scholar] [CrossRef]
  38. Roach, T.; Kapelan, Z.; Ledbetter, R. Resilience-based performance metrics for water resources management under uncertainty. Adv. Water Resour. 2018, 116, 18–28. [Google Scholar] [CrossRef]
  39. Xu, T. A Study on the coupling relation between the water and sediment yield sub-system and river channel deposition sub-system: An example from the Yellow River. Acta Geogr. Sin. 1997, 39–47. (In Chinese) [Google Scholar]
  40. Zhang, C.; Zhang, C.; Yi, X.; Luo, L. Analysis of the flooding and siltation characteristics and non-siltation critical flow in the lower Weihe River. Yellow River 2011, 33, 27–28+31+146. (In Chinese) [Google Scholar]
  41. Feng, P.; Li, Q.; Cao, Q.; Zhang, L. Characteristics and sediment carrying capacity of the hyperconcentrated floods in the Jing River and Wei River. J. Sediment Res. 2021, 46, 8–14. (In Chinese) [Google Scholar]
  42. Zhang, Y.; Huang, C.C.; Pang, J.; Zha, X.; Zhou, Y.; Yin, S.; Wang, J. Comparative study of the modern flood slackwater deposits in the upper reaches of Hanjiang and Weihe River Valleys, China. Quatern Int. 2012, 282, 184–191. [Google Scholar] [CrossRef]
  43. Qin, Y.; Zhang, X.; Wang, F.; Yan, H.; Han, H. Scour and silting evolution and its influencing factors in Inner Mongolian Reach of the Yellow River. J. Geogr. Sci. 2011, 21, 1037–1046. [Google Scholar] [CrossRef]
  44. Asselman, N.E.M. Suspended sediment dynamics in a large drainage basin: The River Rhine. Hydrol Process. 1999, 13, 1437–1450. [Google Scholar] [CrossRef]
  45. Yu, L. The Huanghe (Yellow) River: Recent changes and its countermeasures. Cont. Shelf Res. 2006, 26, 2281–2298. [Google Scholar] [CrossRef]
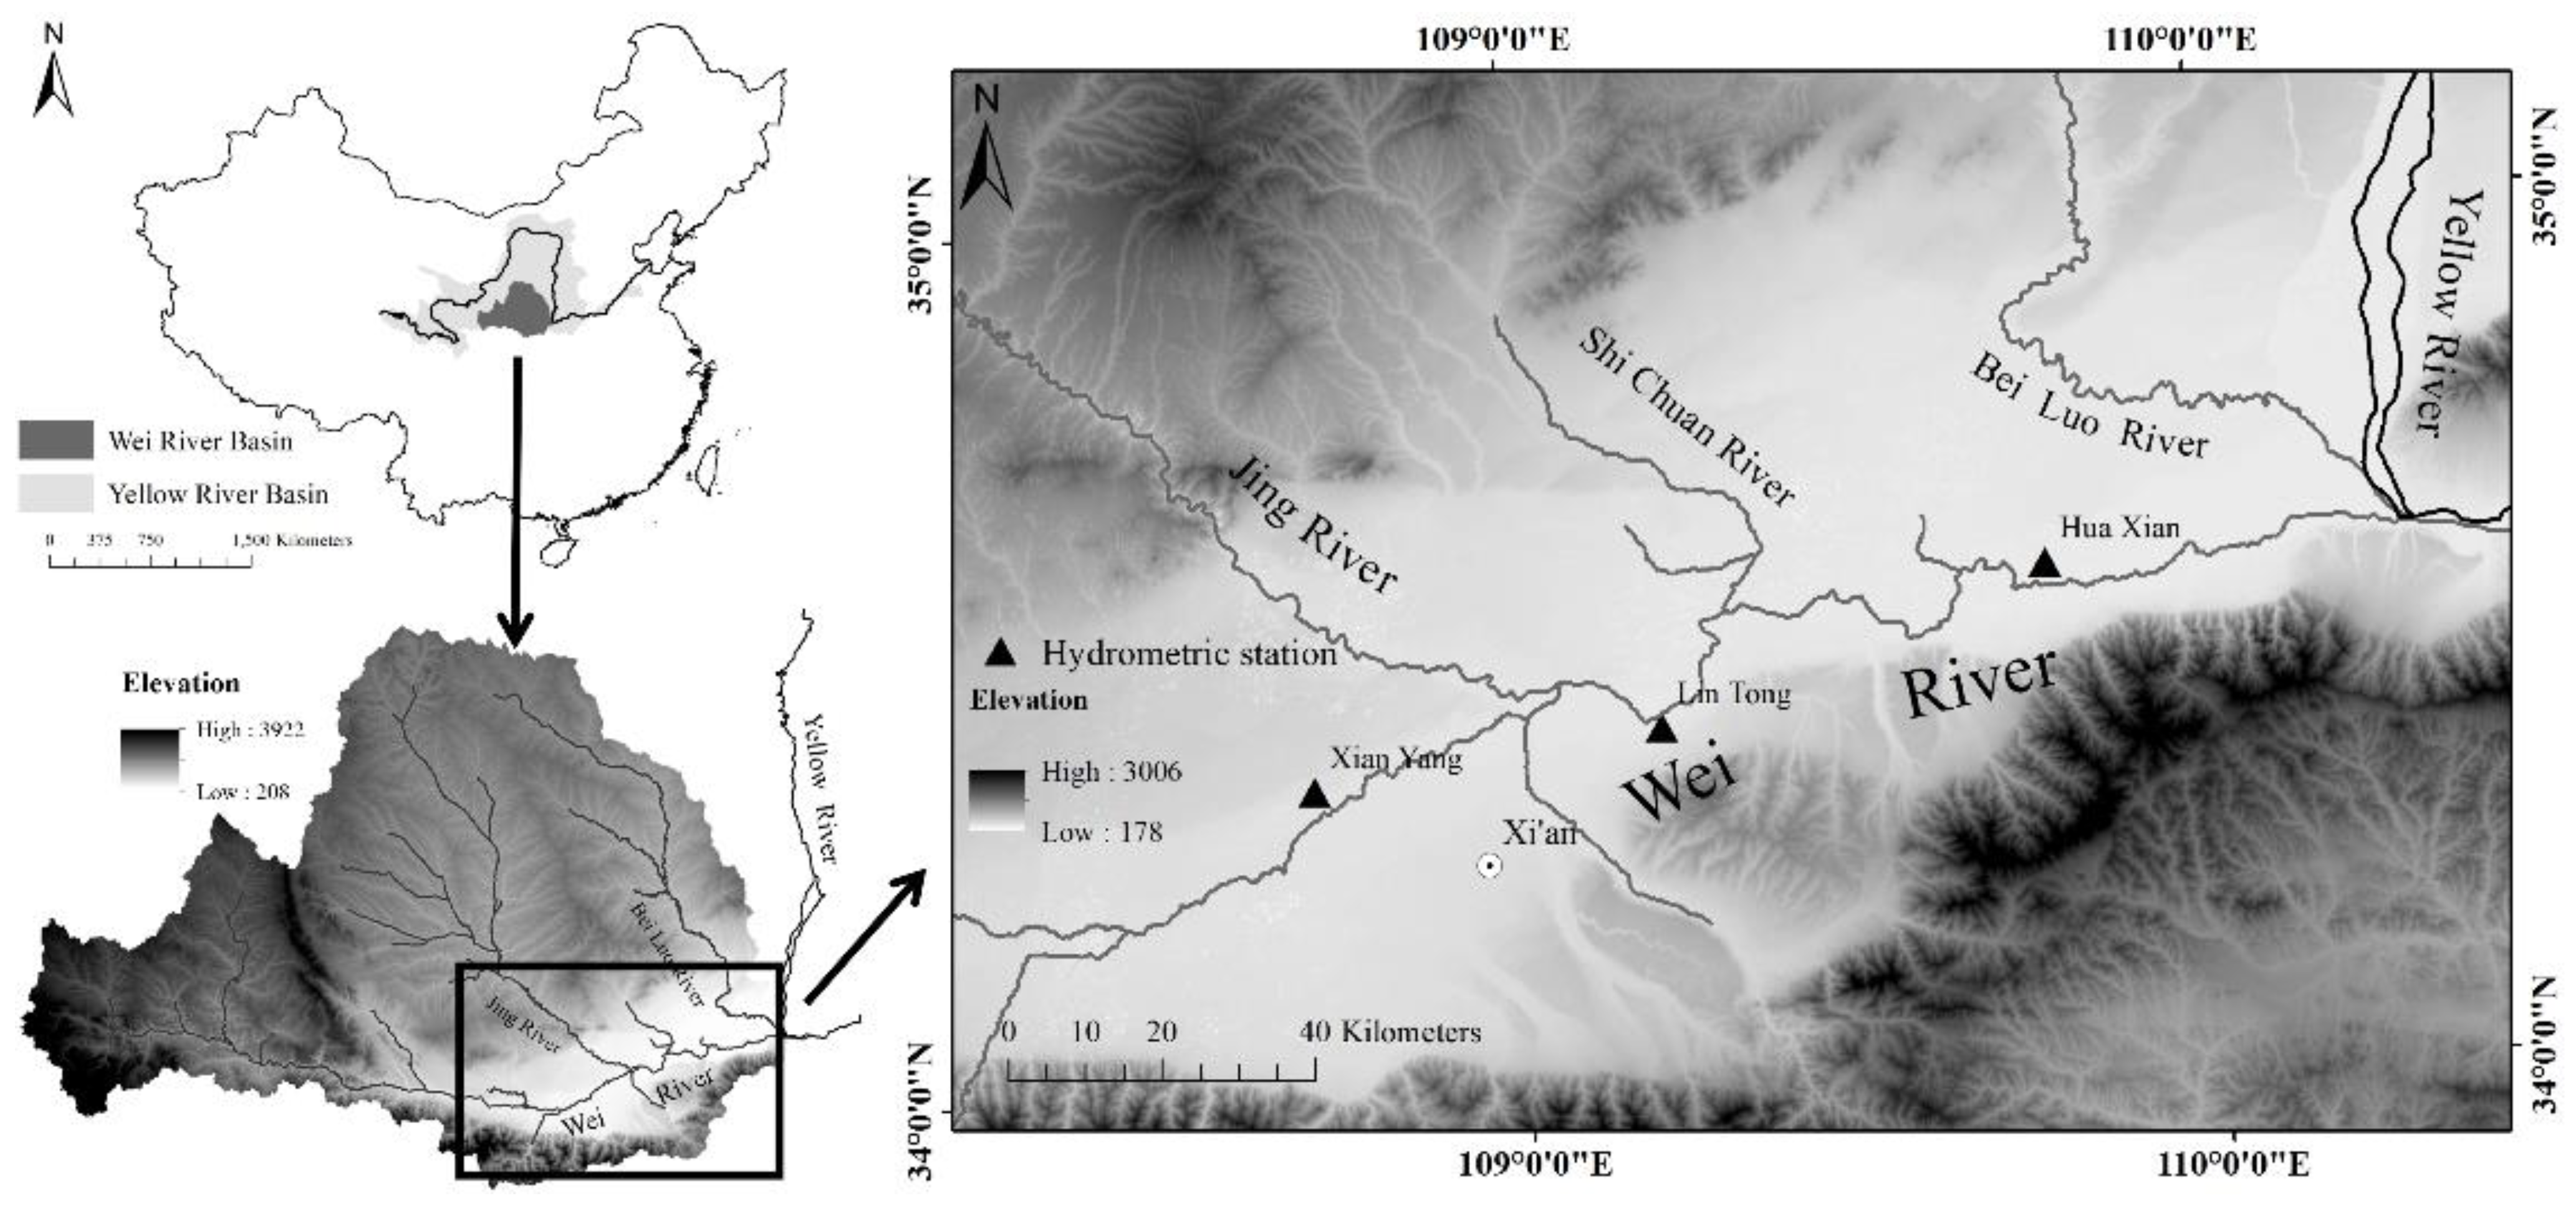
Figure 1. Schemes follow the same formatting.
Water 14 03419 g001
Figure 2. 2006–2018 Xianyang station post-flood cross-section.
Water 14 03419 g002
Figure 3. 2006–2018 Lintong station post-flood cross-section.
Water 14 03419 g003
Figure 4. 2006–2018 Huaxian station post-flood cross-section.
Water 14 03419 g004
Figure 5. The average elevation of the main channel in: (a) Xianyang station; (b) Lintong station; and (c) Huaxian station post-flood-section in 2006–2018. The dashed lines indicate the trend line; the Z statistic was obtained from the Mann–Kendall test. (**: p < 0.01, *: p < 0.05).
Water 14 03419 g005
Figure 6. Fisher breakpoint detection of the average elevation of the main channel in the lower Weihe section in 2006–2018: The circle part is the lowest point.
Water 14 03419 g006
Figure 7. The average elevation of the main channel of the: (a) Xianyang station; (b) Lintong station; and (c) Huaxian station before and after the floods in 2006–2018.
Water 14 03419 g007
Figure 8. Variation of annual (a) streamflow discharge, (b) sediment discharge, (c) sediment concentration, and (d) incoming sediment coefficient in the lower Weihe River in 2006–2018.
Water 14 03419 g008
Figure 9. Variation of: (a) streamflow discharge; (b) sediment discharge; (c) sediment concentration; and (d) incoming sediment coefficient in the lower Weihe River during flood season in 2006–2018.
Water 14 03419 g009
Figure 10. Variation of the median diameter of suspended sediment in the lower Weihe River in 2006–2018.
Water 14 03419 g010
Figure 11. Comparison chart of average elevation and incoming sediment coefficient in the: (a) Xianyang station; (b) Lintong station; and (c) Huaxian station in 2006–2018.
Water 14 03419 g011
Figure 12. Comparison of the cross-section before and after the flood season in: (a) 2010; (b) 2011; and (c) 2012 (d) 2013 at Huaxian Station.
Water 14 03419 g012
Table 1. Mean elevation changes of hydrological stations in the lower Weihe River during the flood and non-flood periods in 2006–2018. Unit: (m).
YearXianyangLingtongHuaxian
Flood SeasonNon-Flood SeasonFlood SeasonNon-Flood SeasonFlood SeasonNon-Flood Season
2006−0.62−0.48−0.060.010.080.29
20070.530.04−0.44
0.330.010.58
2008−0.120.171.02
−0.07−0.3−0.97
20090.090.080.38
0.390.16−0.15
2010−0.450.2−0.25
−0.41−0.07−0.14
20110.830.01−0.18
−0.25−0.04−0.81
2012−0.1−0.040.19
−1.110.71−0.23
20130.95−0.340.32
−0.38−0.04−0.39
20140.27−0.20.98
0.02−0.05−1.09
2015−0.020.84−0.37
−0.22−0.060.7
20160.10.210.04
0.41−0.28−0.05
2017−0.580.070.68
−0.22−0.1−0.67
20180.01−0.370.15
+: elevated, −: reduced.
Table 2. Average streamflow-sediment indexes of hydrological stations in the lower Weihe River in 2006–2018.
Hydrological StationStreamflowSediment ConcentrationSediment DischargeIncoming Sediment Coefficient
Average
(m3 s−1)
ZAverage
(kg m−3)
ZAverage
(kg s−1)
ZAverageZ
Xianyang90.91−0.182.70−1.28448.79−0.890.03−1.28
Lintong171.680.217.650.071969.38−1.170.05−0.48
Huaxian166.110.189.15−1.042244.63−1.770.06−1.04
Table 3. Average streamflow-sediment indexes data of hydrological stations in the lower Weihe River during flood season in 2006–2018.
Hydrological StationStreamflowSediment ConcentrationSediment DischargeIncoming Sediment Coefficient
Average
(m3 s−1)
ZAverage
(kg m−3)
ZAverage
(kg s−1)
ZAverageZ
Xianyang114.000.435.18−1.16934.46−1.040.06−1.04
Lintong207.140.6715.87−0.553874.86−1.280.09−1.16
Huaxian206.120.9216.80−1.164088.64−1.650.10−1.28
Table 4. Typical flood main streamflow and sediment data.
Flood YearHydrological StationsPeak Discharge
(m3 s−1)
LastedMaximum Sediment Content during Flood (kg m−3)
2010Lintong280027 July 2010–31 July 2010453
Huaxian217020 August 2010–31 August 2010458
2011Xianyang21403 September 2011–11 September 201138.5
219012 September 2011–16 September 2011
397017 September 2011–1 October 2011
Lintong26605 September 2011–11 September 201143.3
266012 September 2011–17 September 2011
540018 September 2011–27 September 2011
Huaxian21306 September 2011–11 September 201141.2
218012 September 2011–17 September 2011
505017 September 2011–3 October 2011
2012Xianyang25501 September 2012–7 September 201220.5
Lintong25901 September 2012–7 September 2012486
Huaxian22501 September 2012–8 September 2012353
2013Xianyang324023 July 2013–26 July 201377.4
Lintong385023 July 2013–26 July 2013111
Huaxian247023 July 2013–27 July 201399.3
2018Xianyang424010 July 2018–20 July 201853.8
Lintong24603 July 2018–9 July 2018193
445010 July 2018–22 July 2018
Huaxian21402 July 2018–9 July 2018111
338010 July 2018–22 July 2018
Publisher’s Note: MDPI stays neutral with regard to jurisdictional claims in published maps and institutional affiliations.