
Analysis of Thermal Pollution Reduction Efficiency of Bioretention in Stormwater Runoff under Different Rainfall Conditions


Abstract
:1. Introduction
2. Materials and Methods
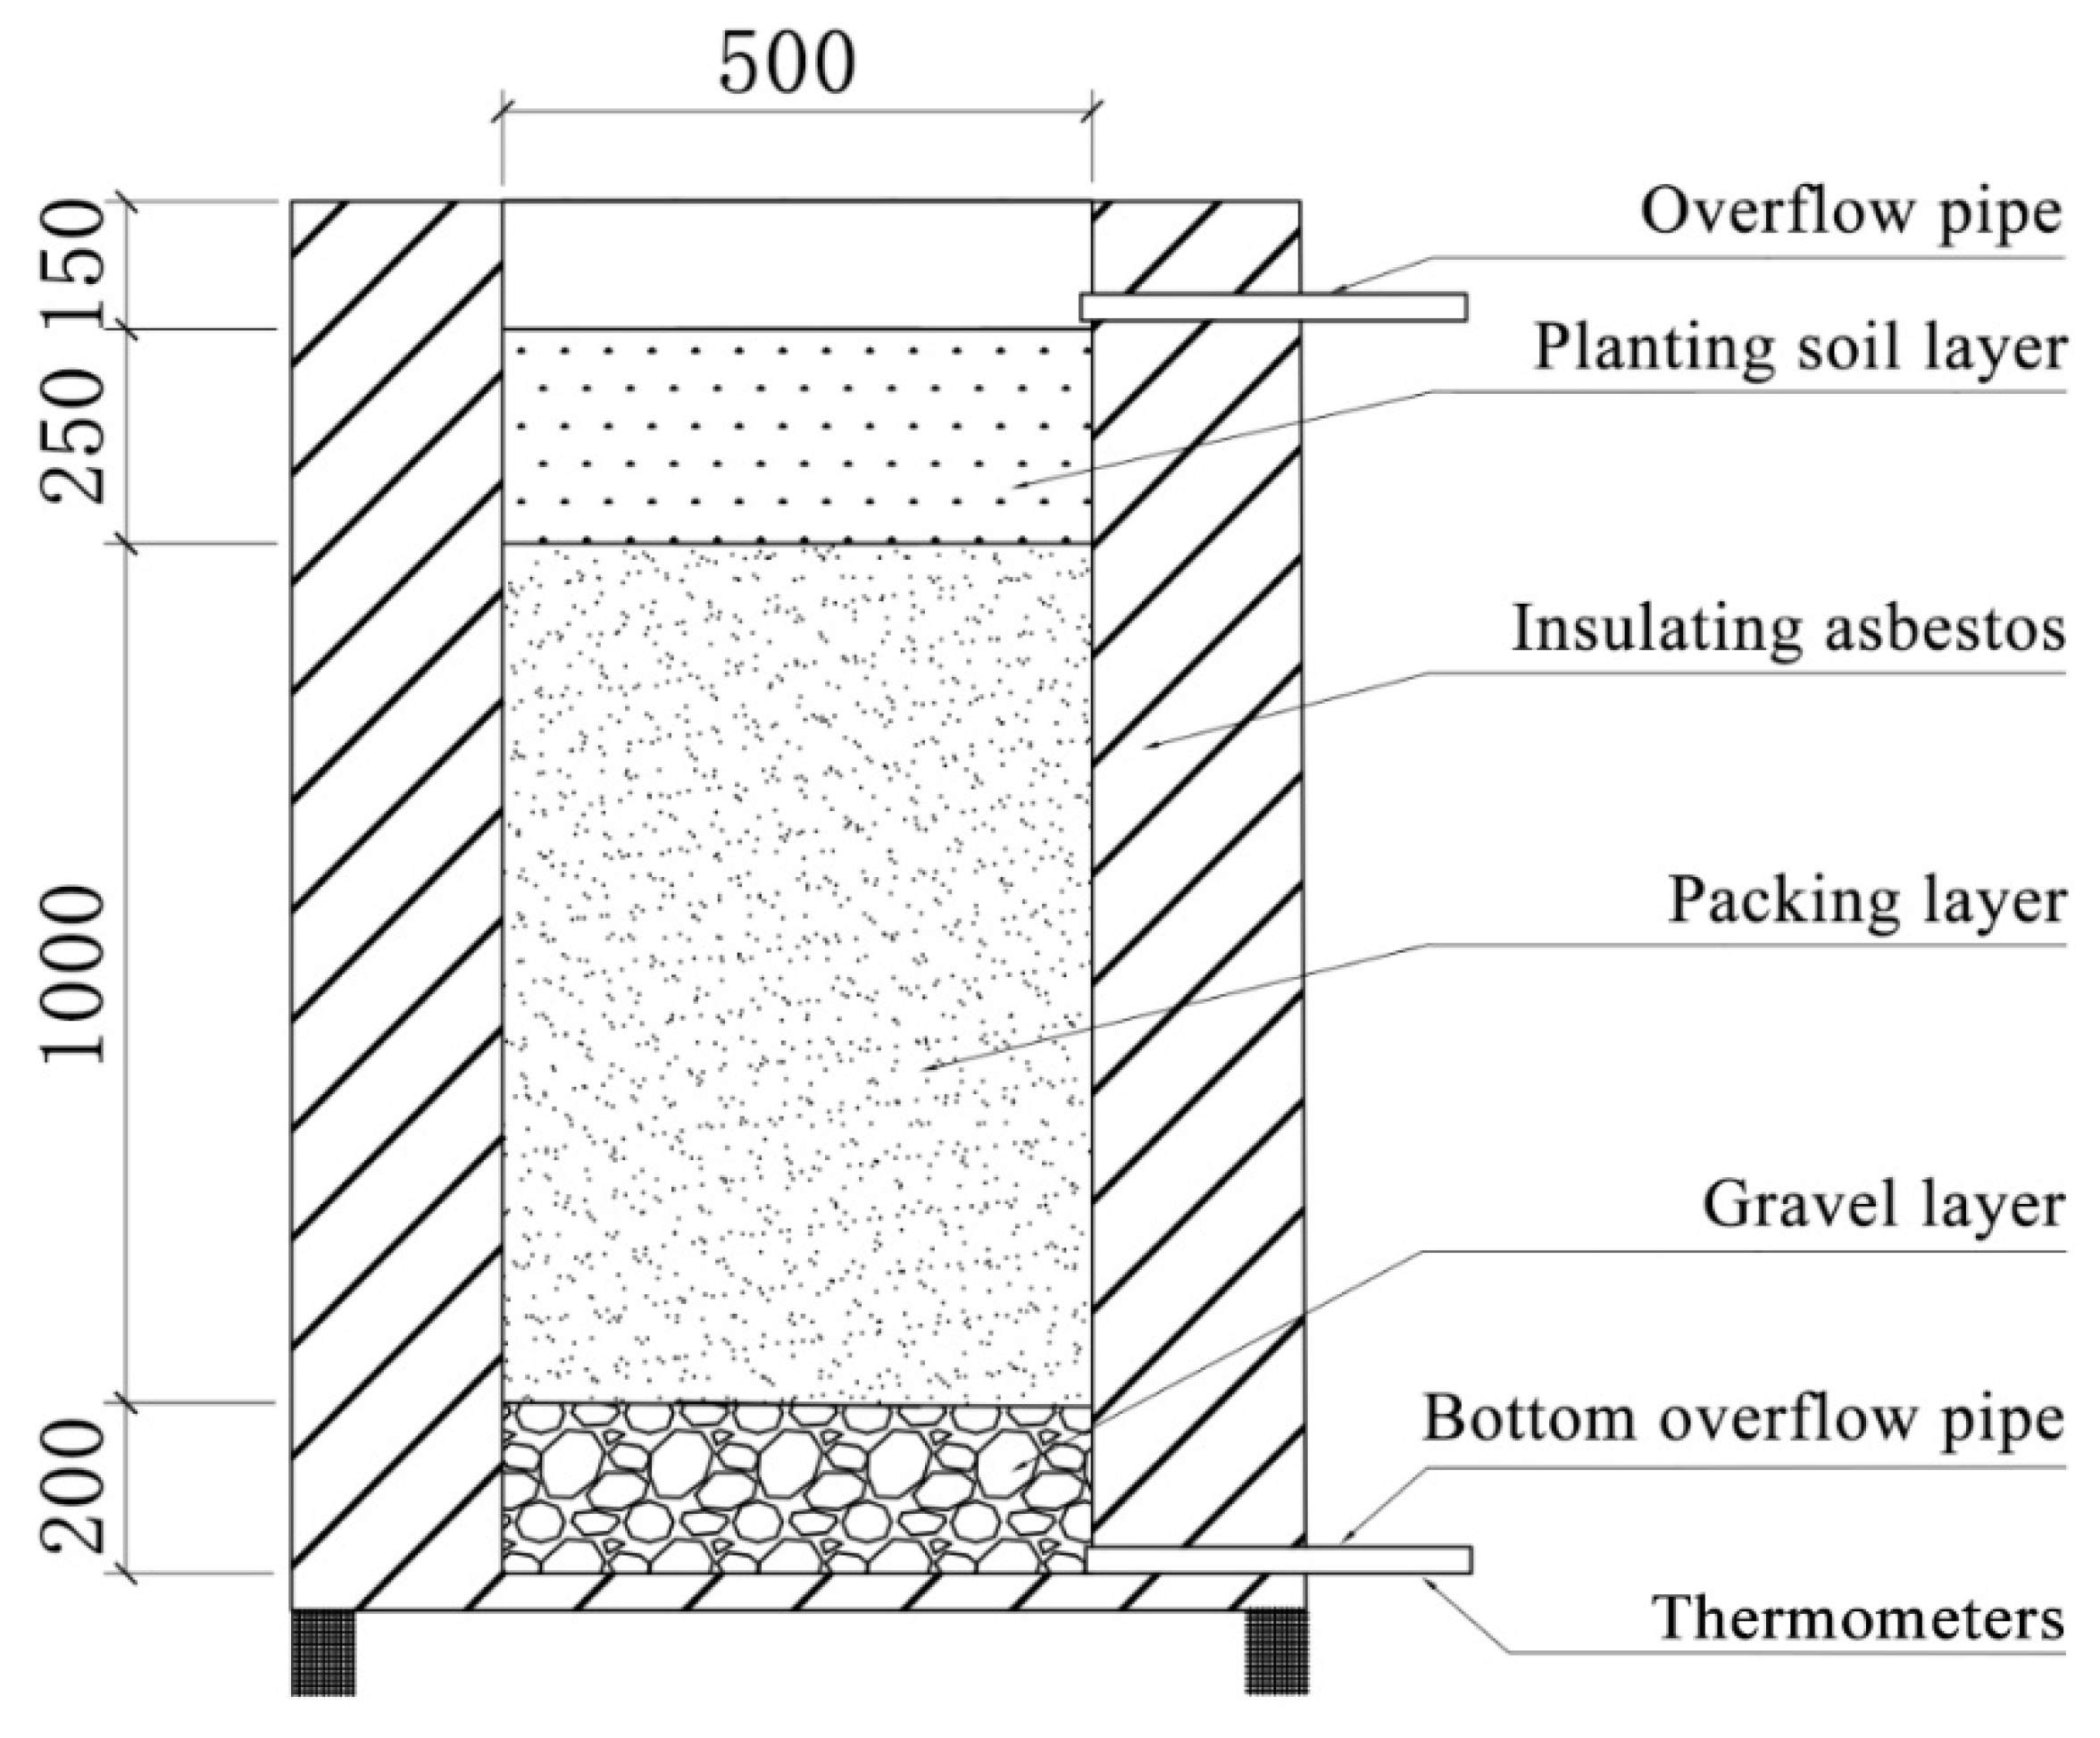
2.1. Device Design
2.2. Conceptual Design
2.3. Evaluation Parameters
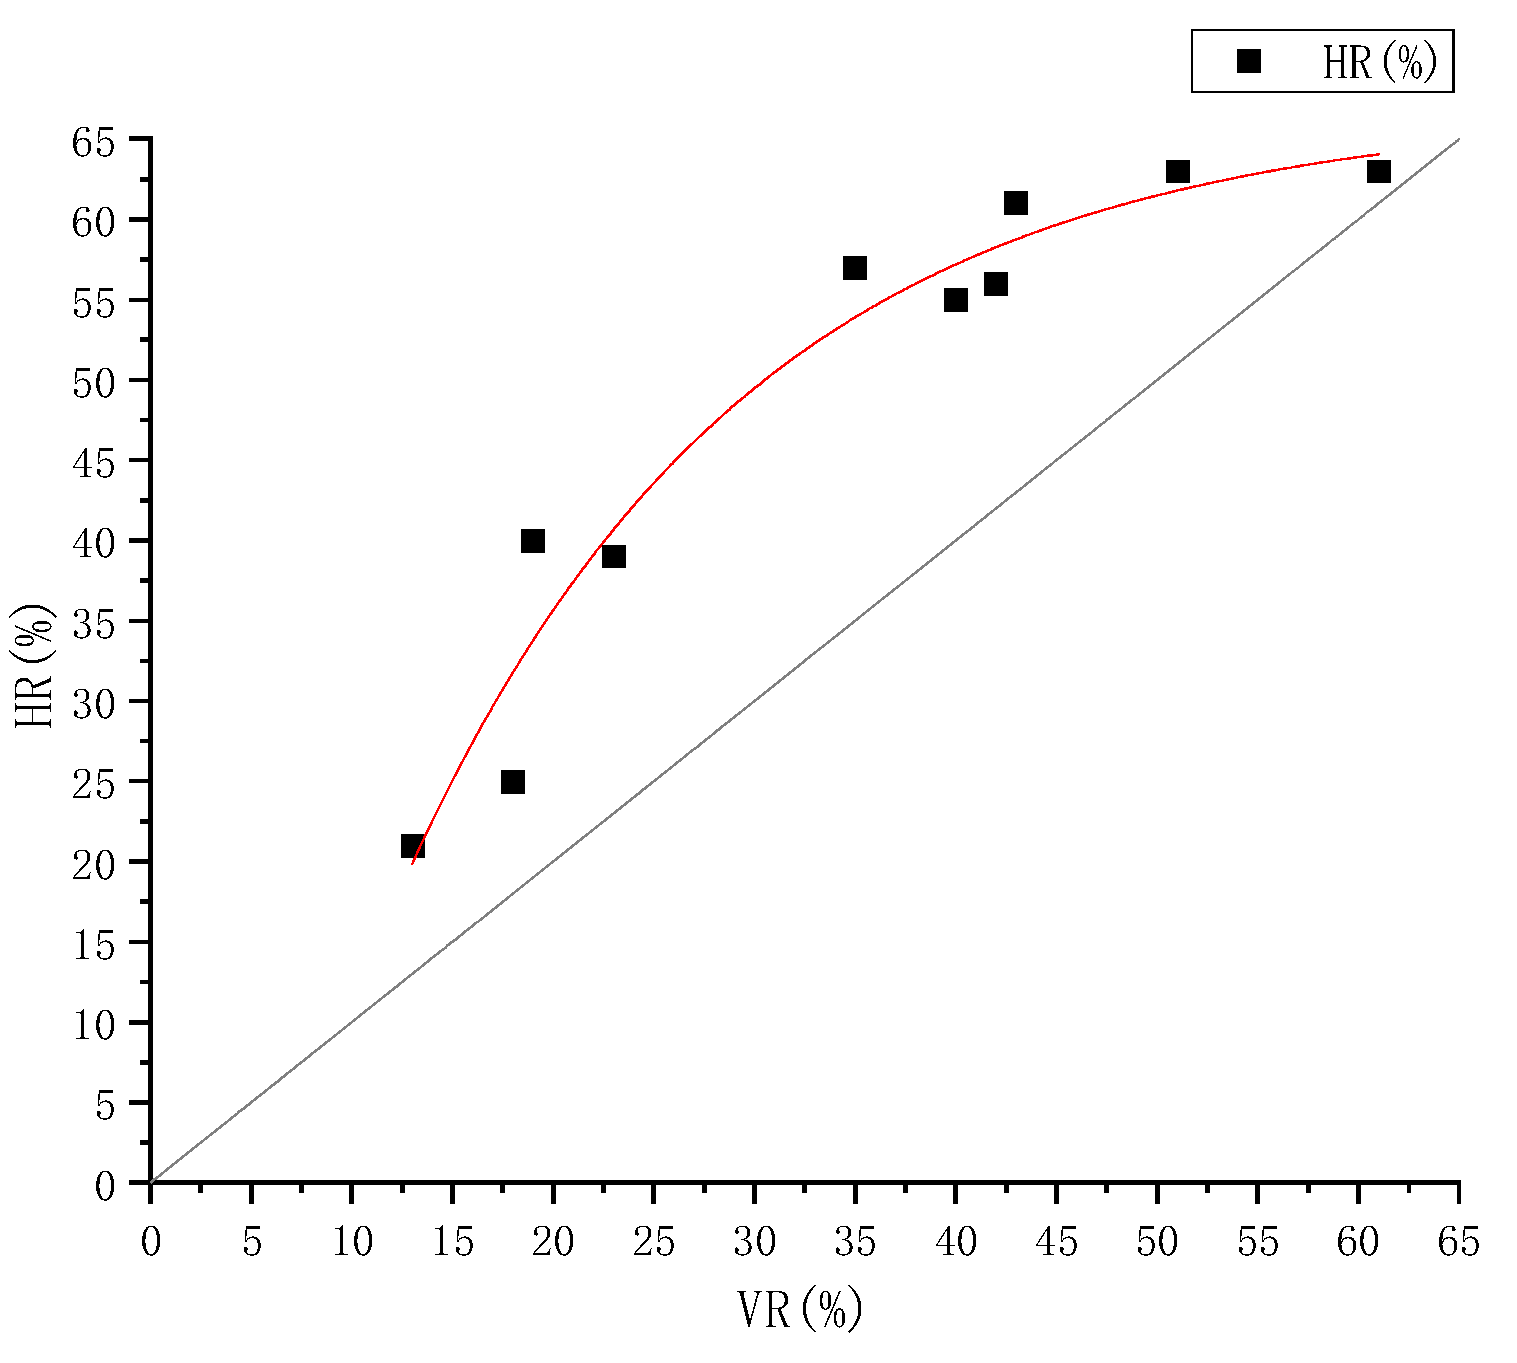
2.3.1. Reduction Rate of Heat Pollution Load of Rainwater Runoff
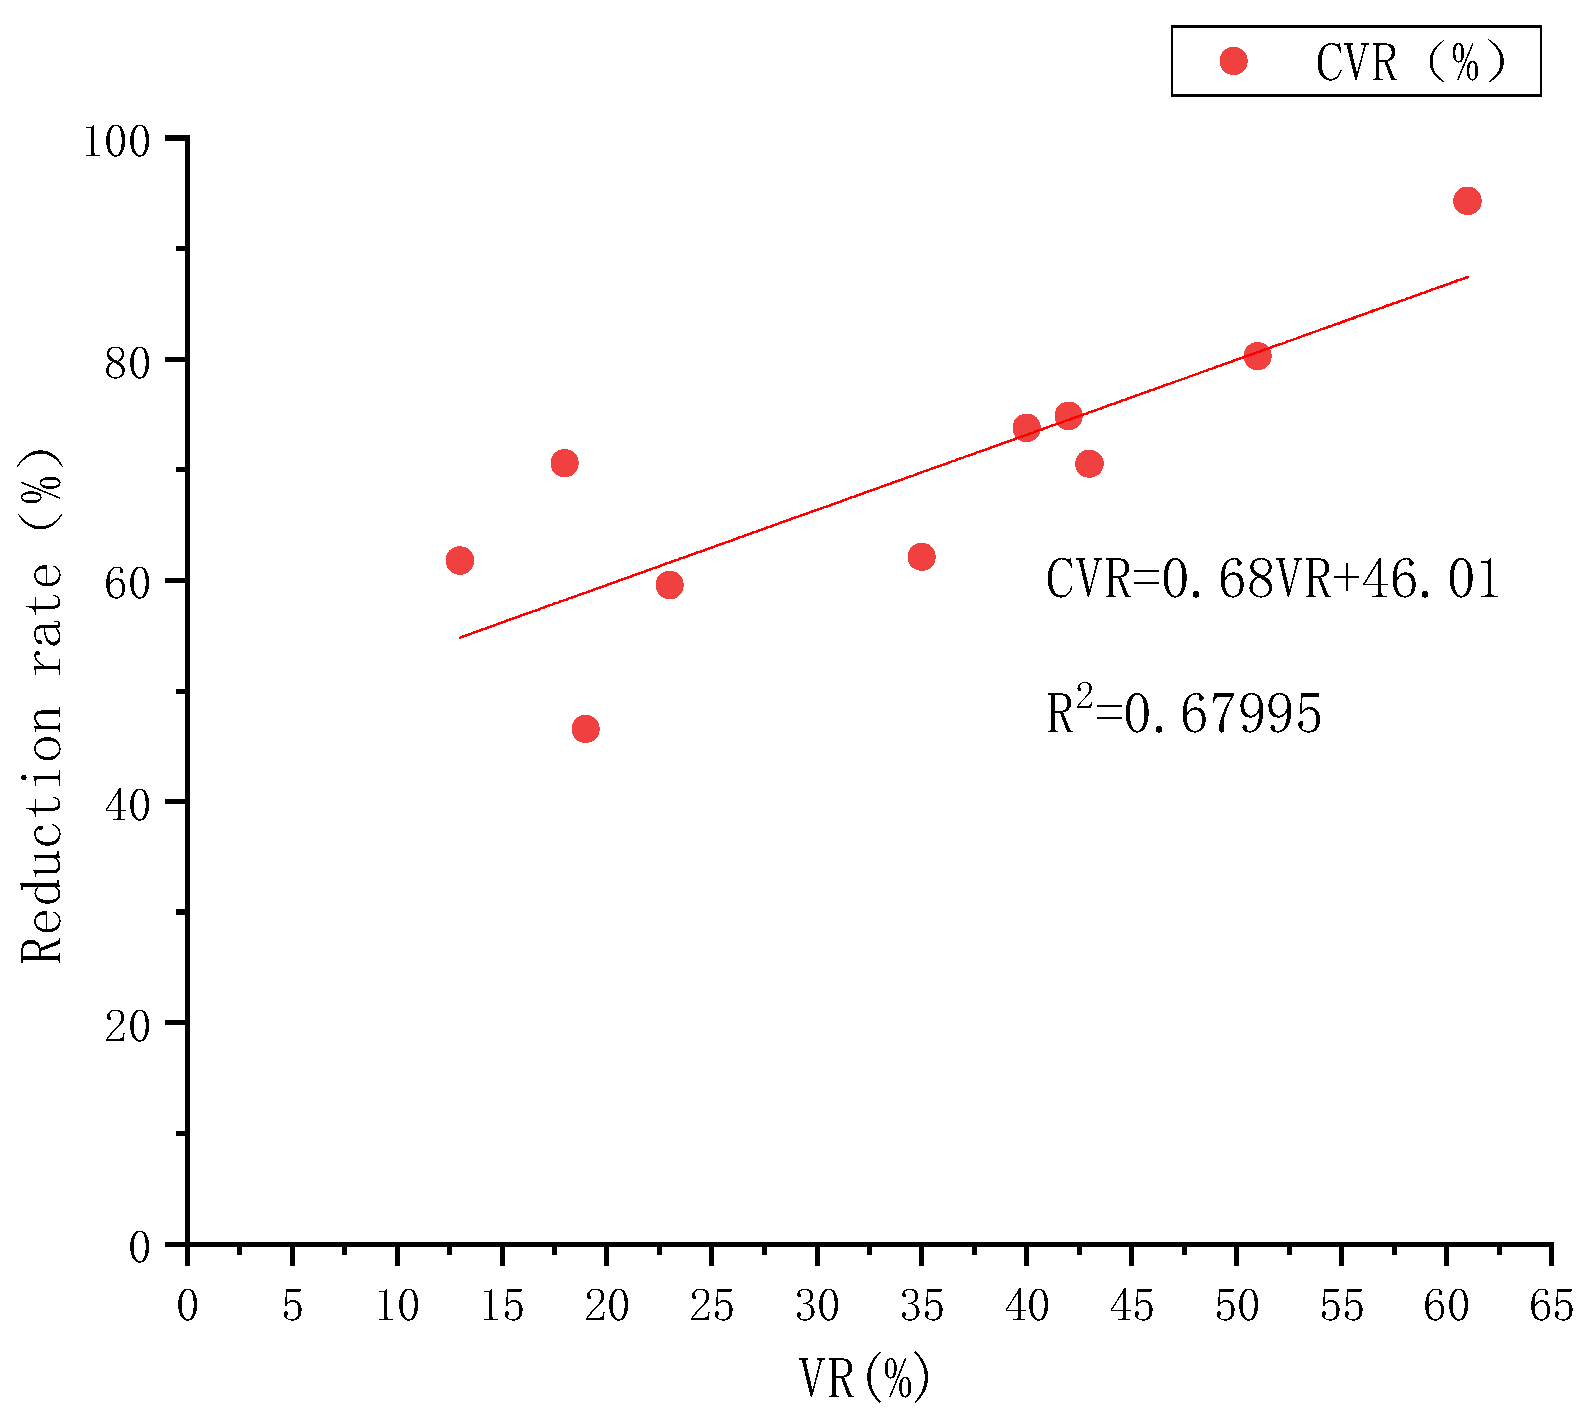
2.3.2. Volume Control Ratio of Rainwater Runoff Heat Load
2.3.3. Temperature Control Ratio of Rainwater Runoff Heat Load
2.4. Analytical Method
3. Results and Discussion
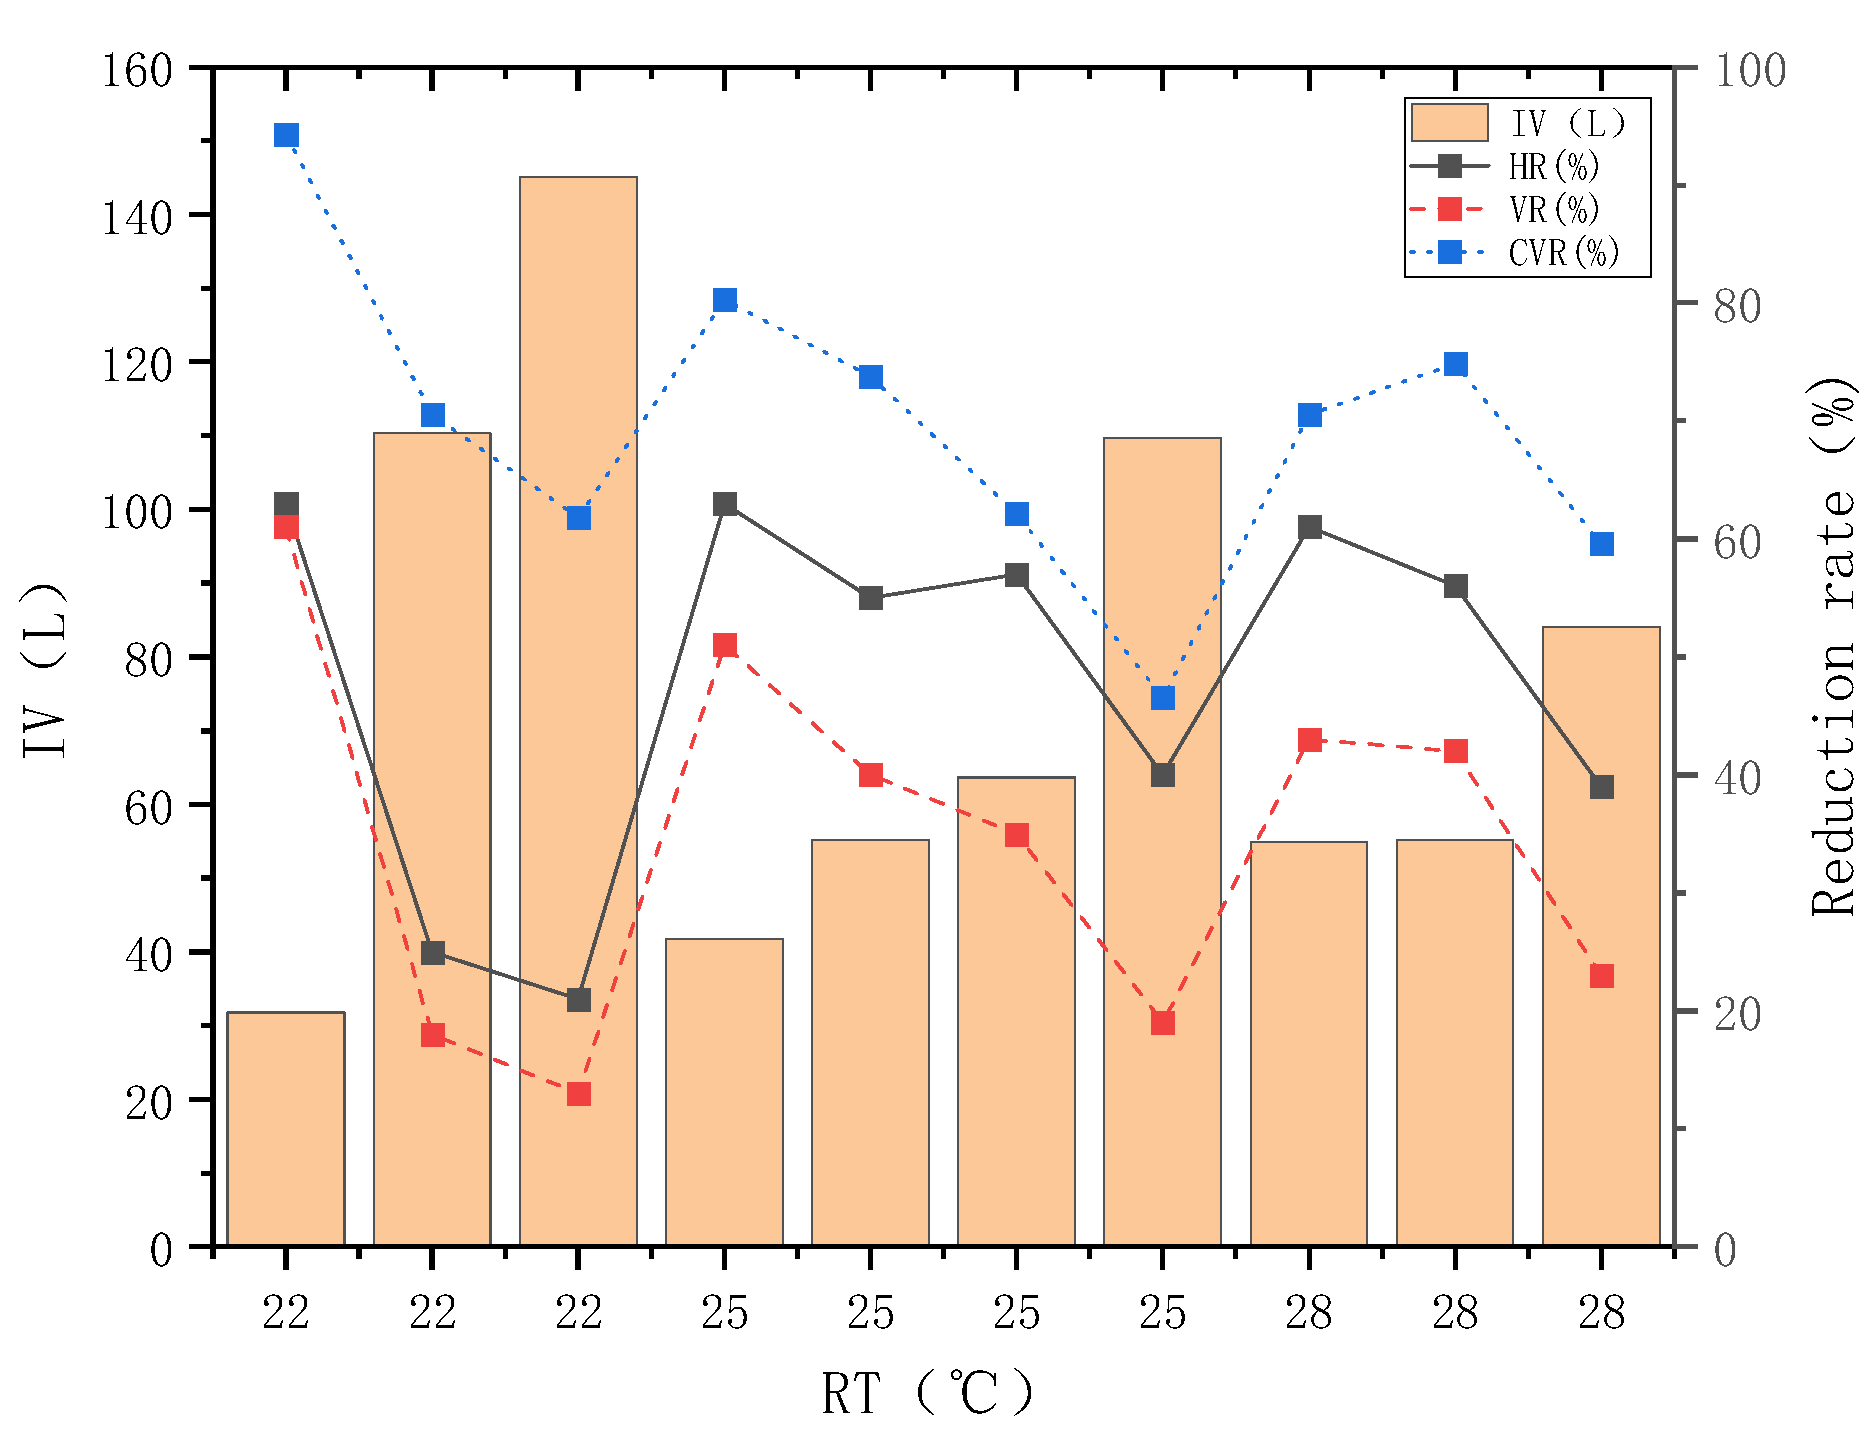
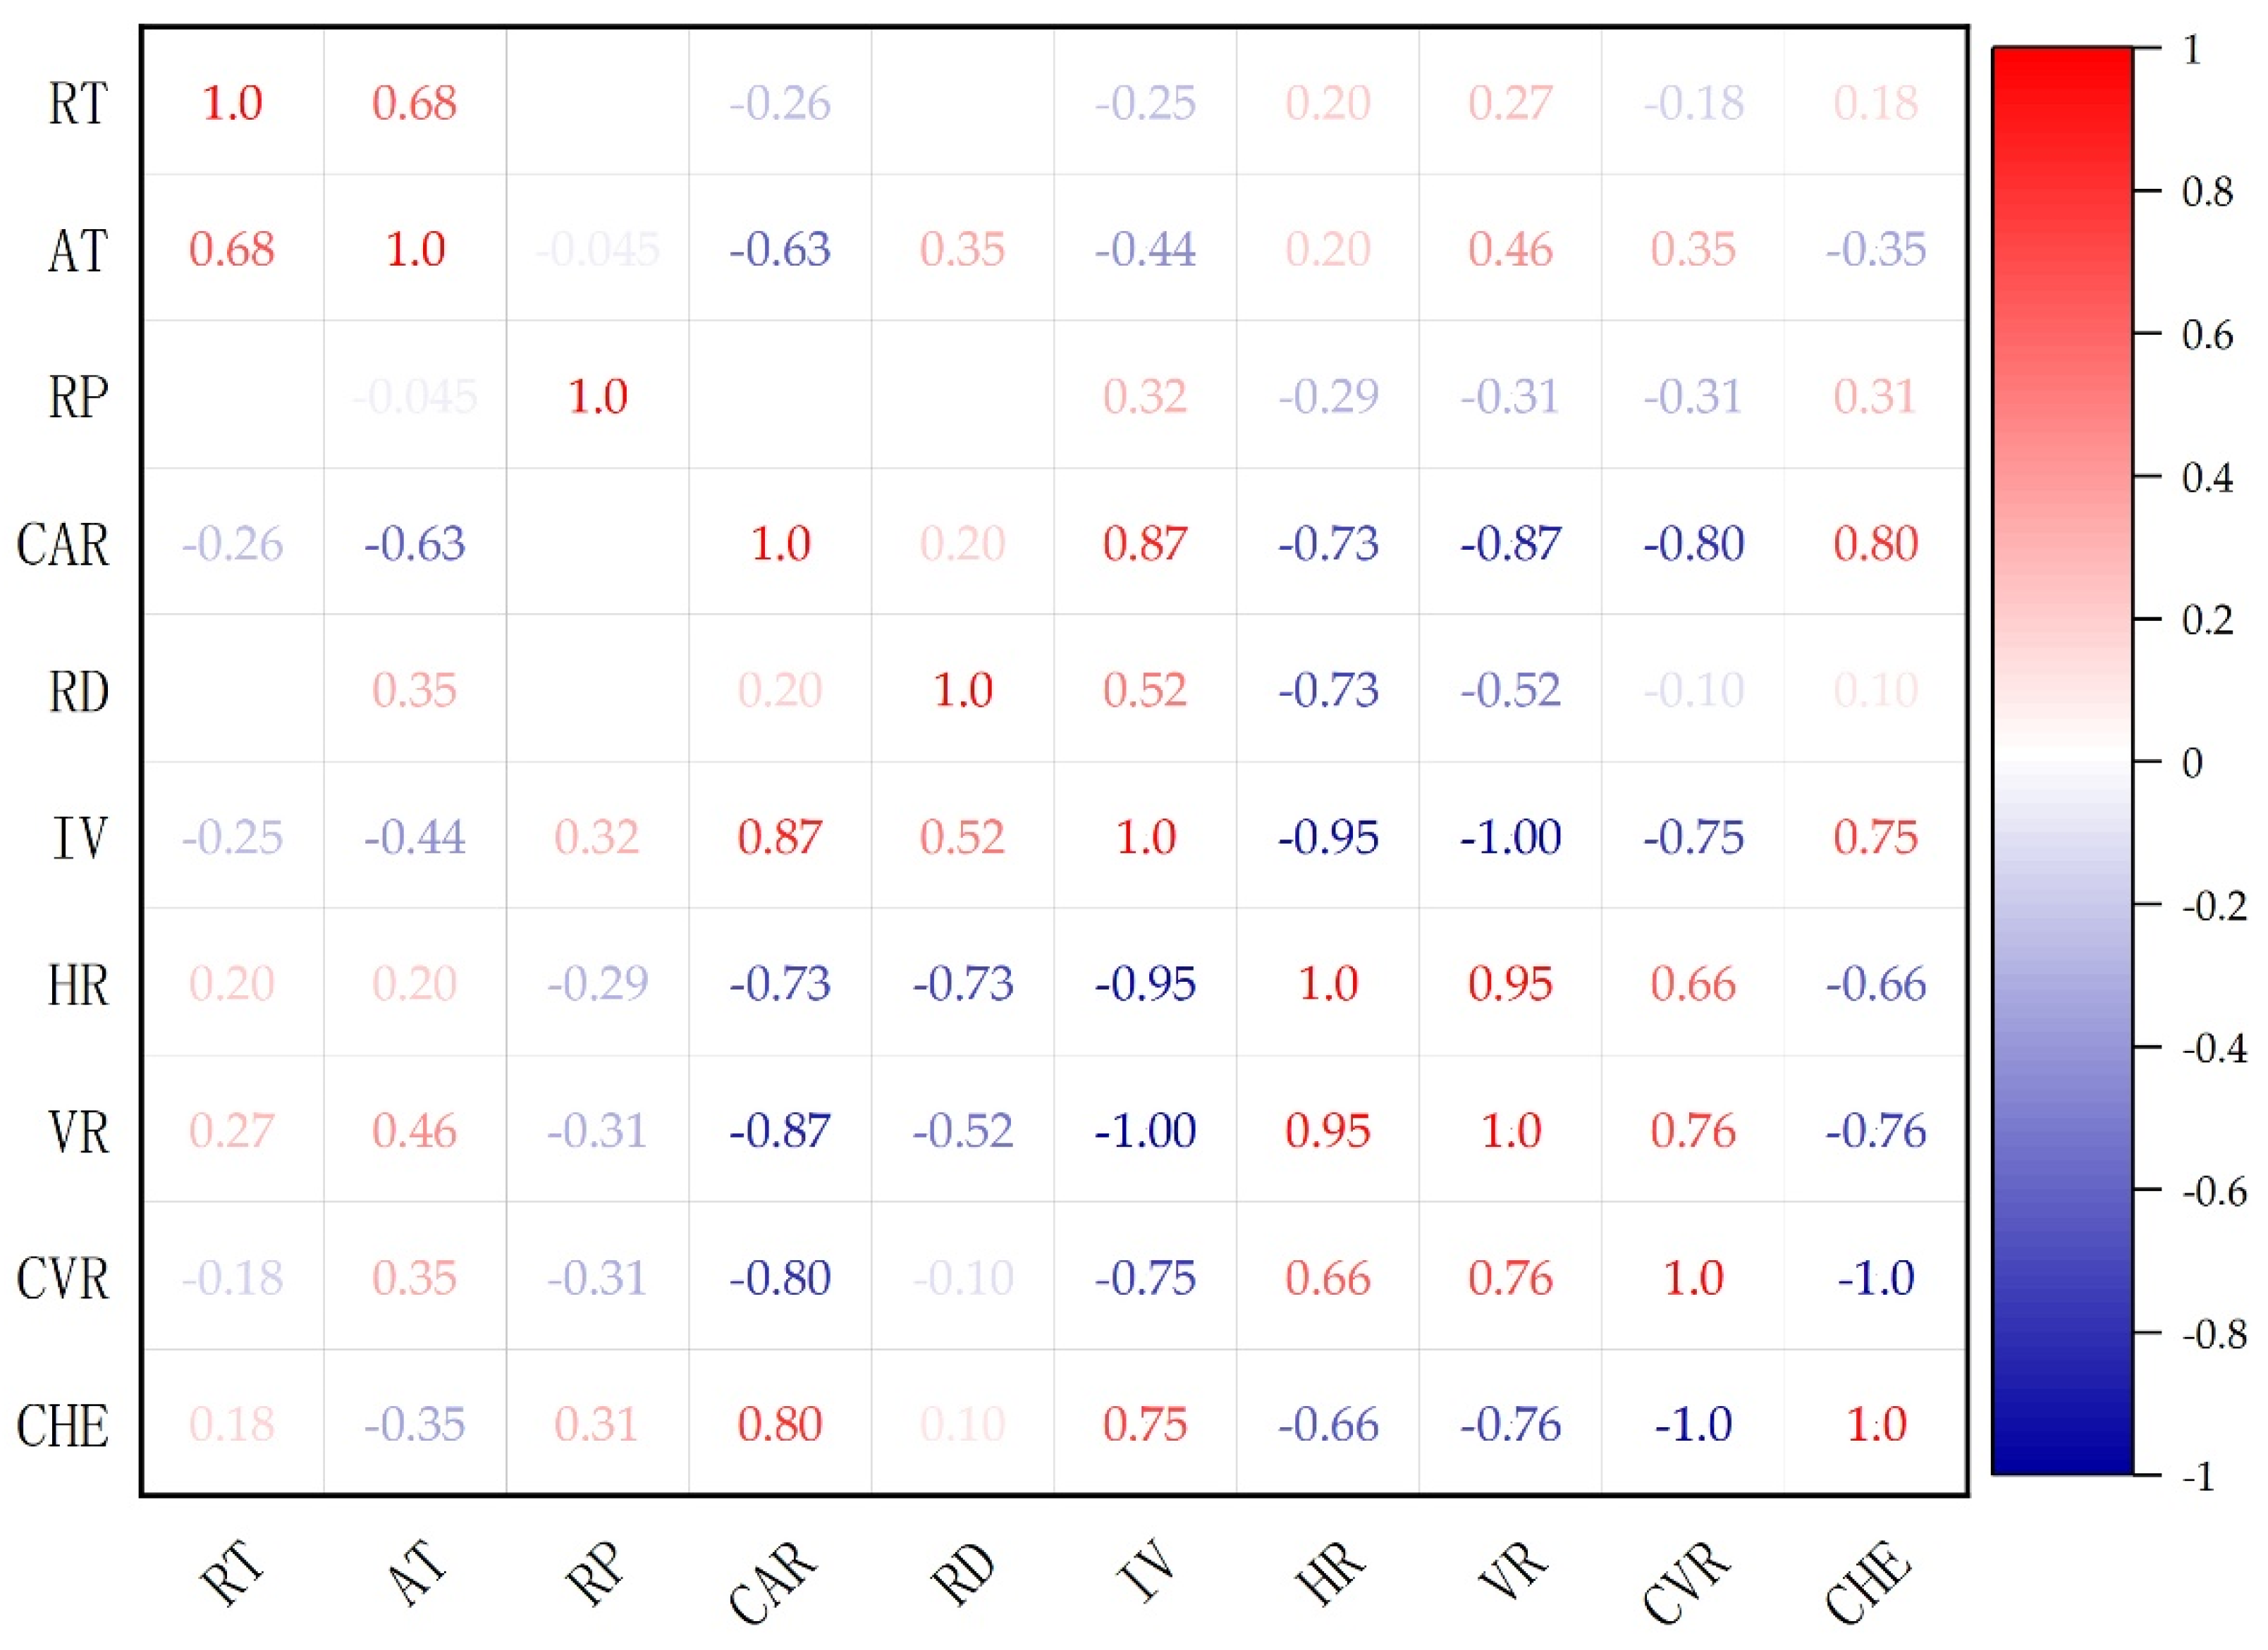
3.1. Influence of Rainfall Pattern Parameters on the Reduction of Heat Pollution Load of Rainwater Runoff
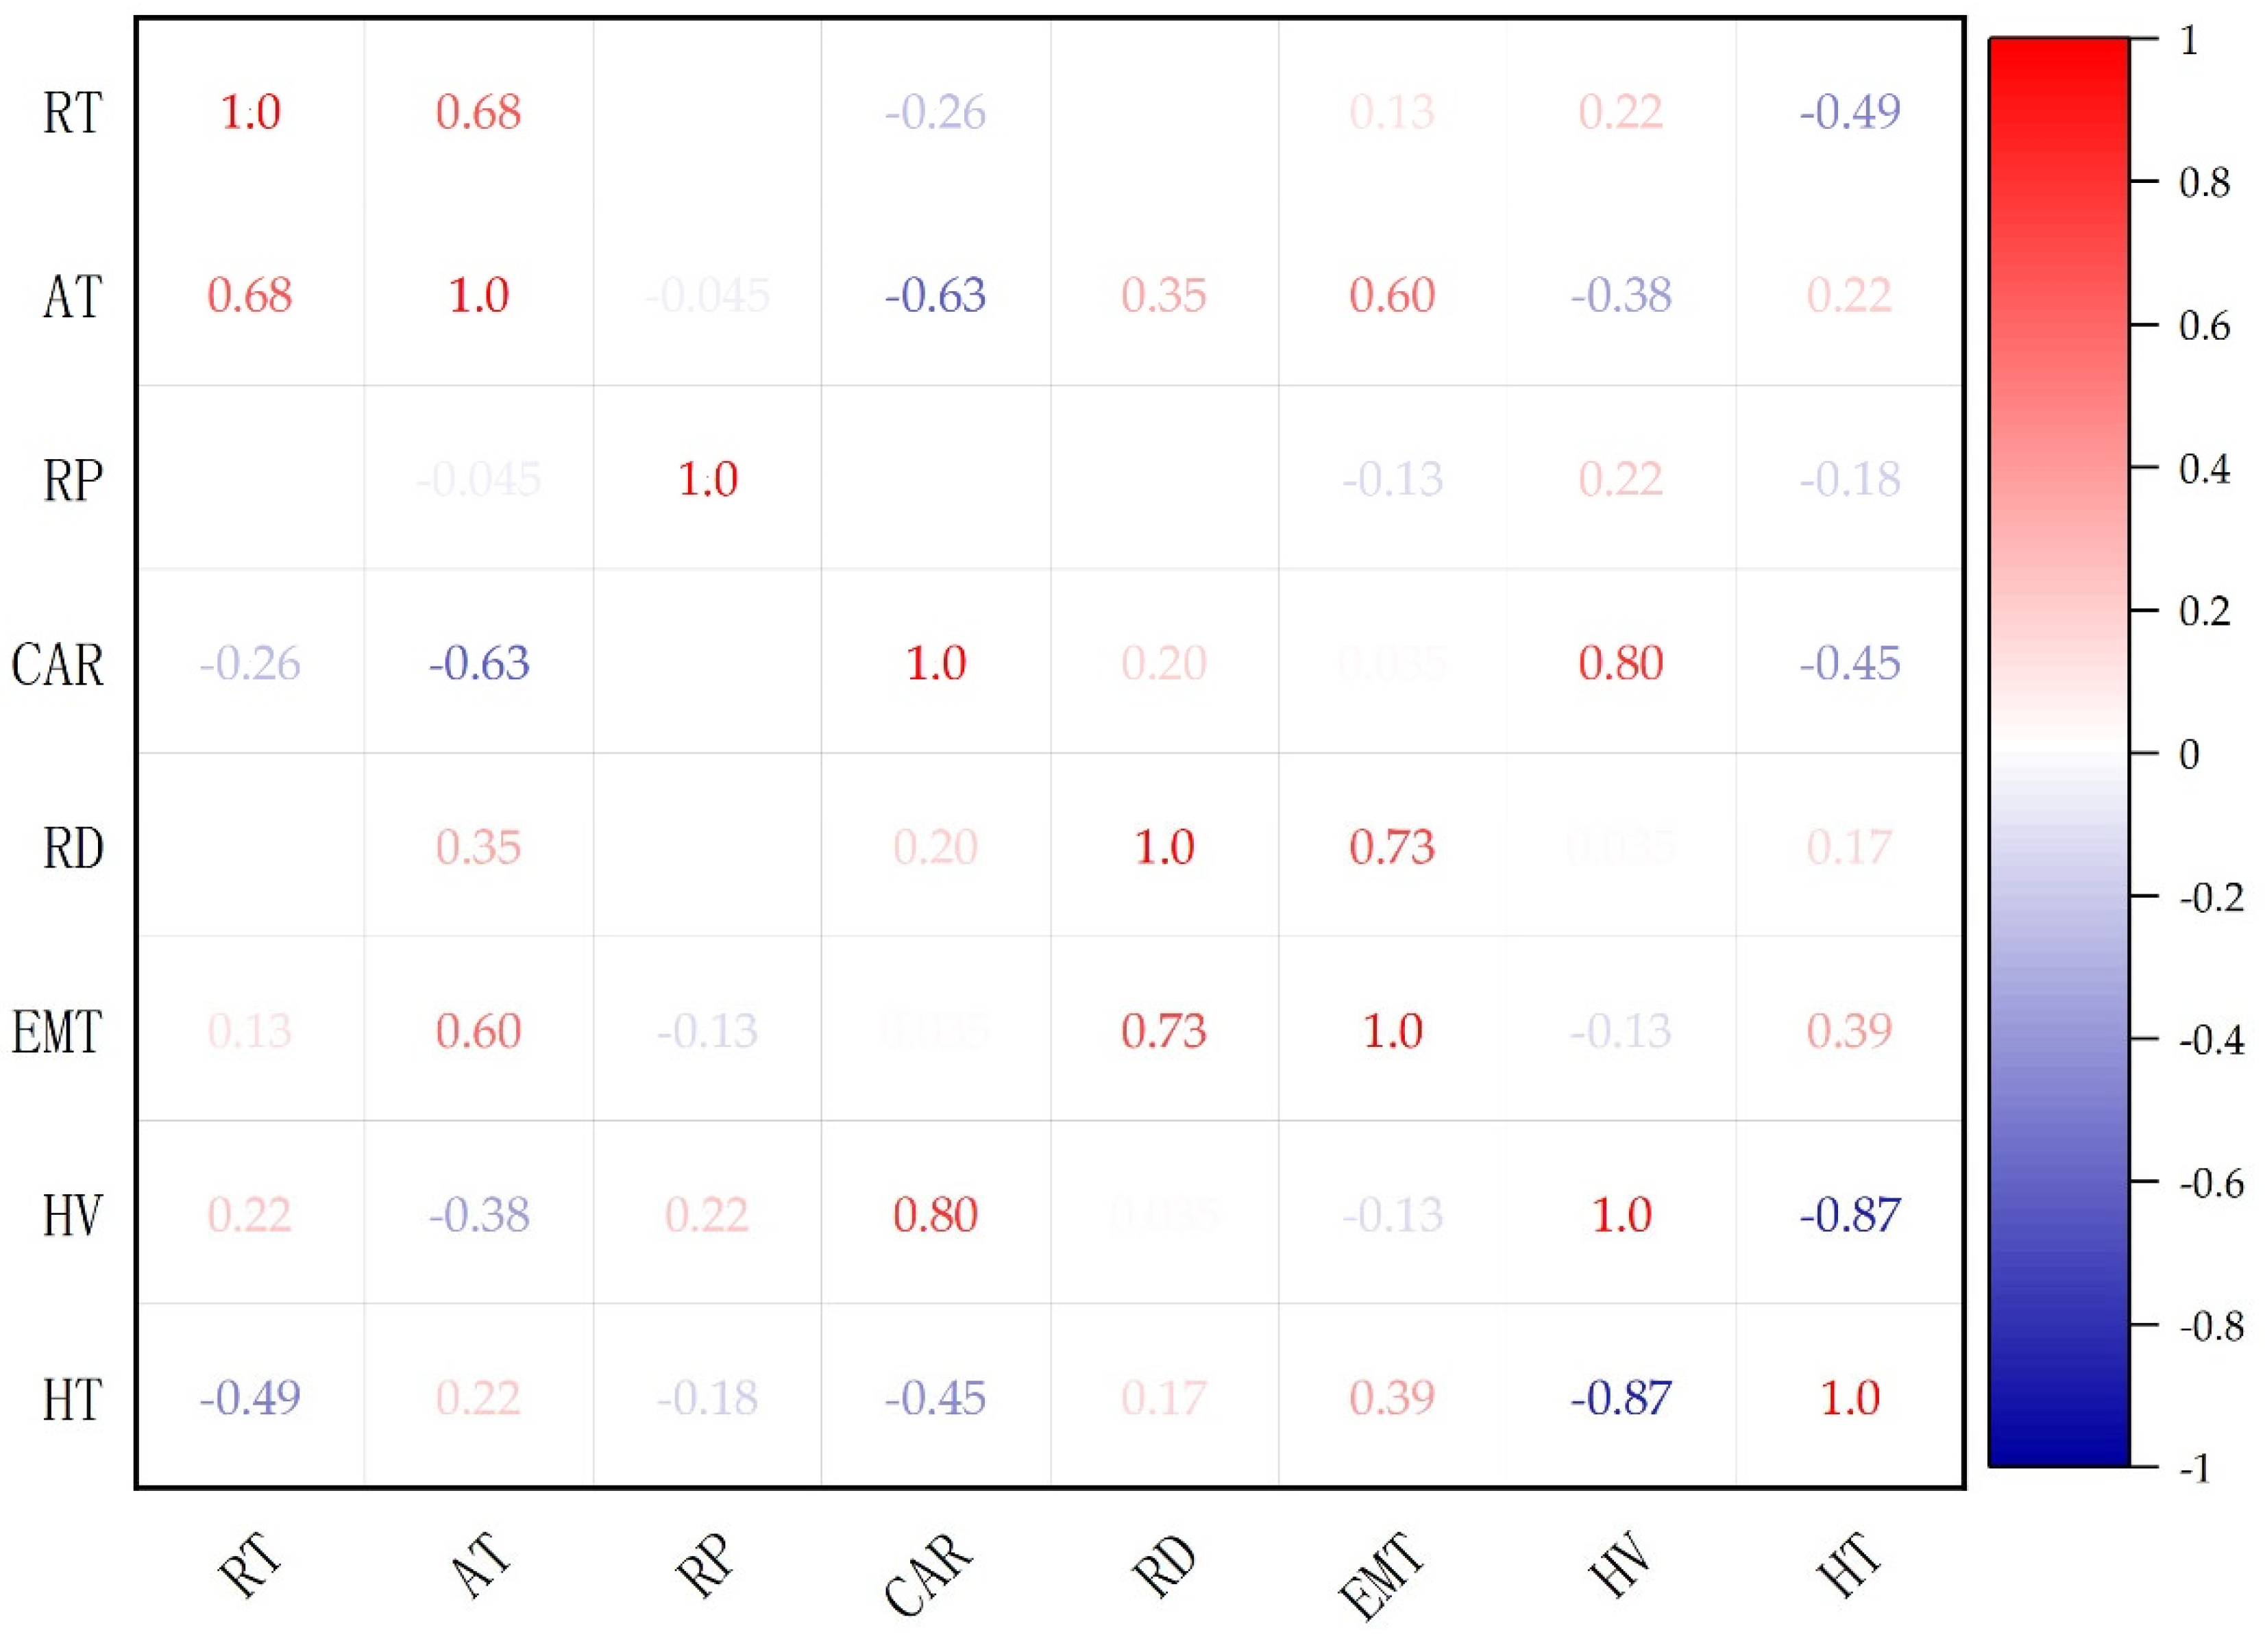
3.2. Influence of Rain Pattern Parameters on HV and HT
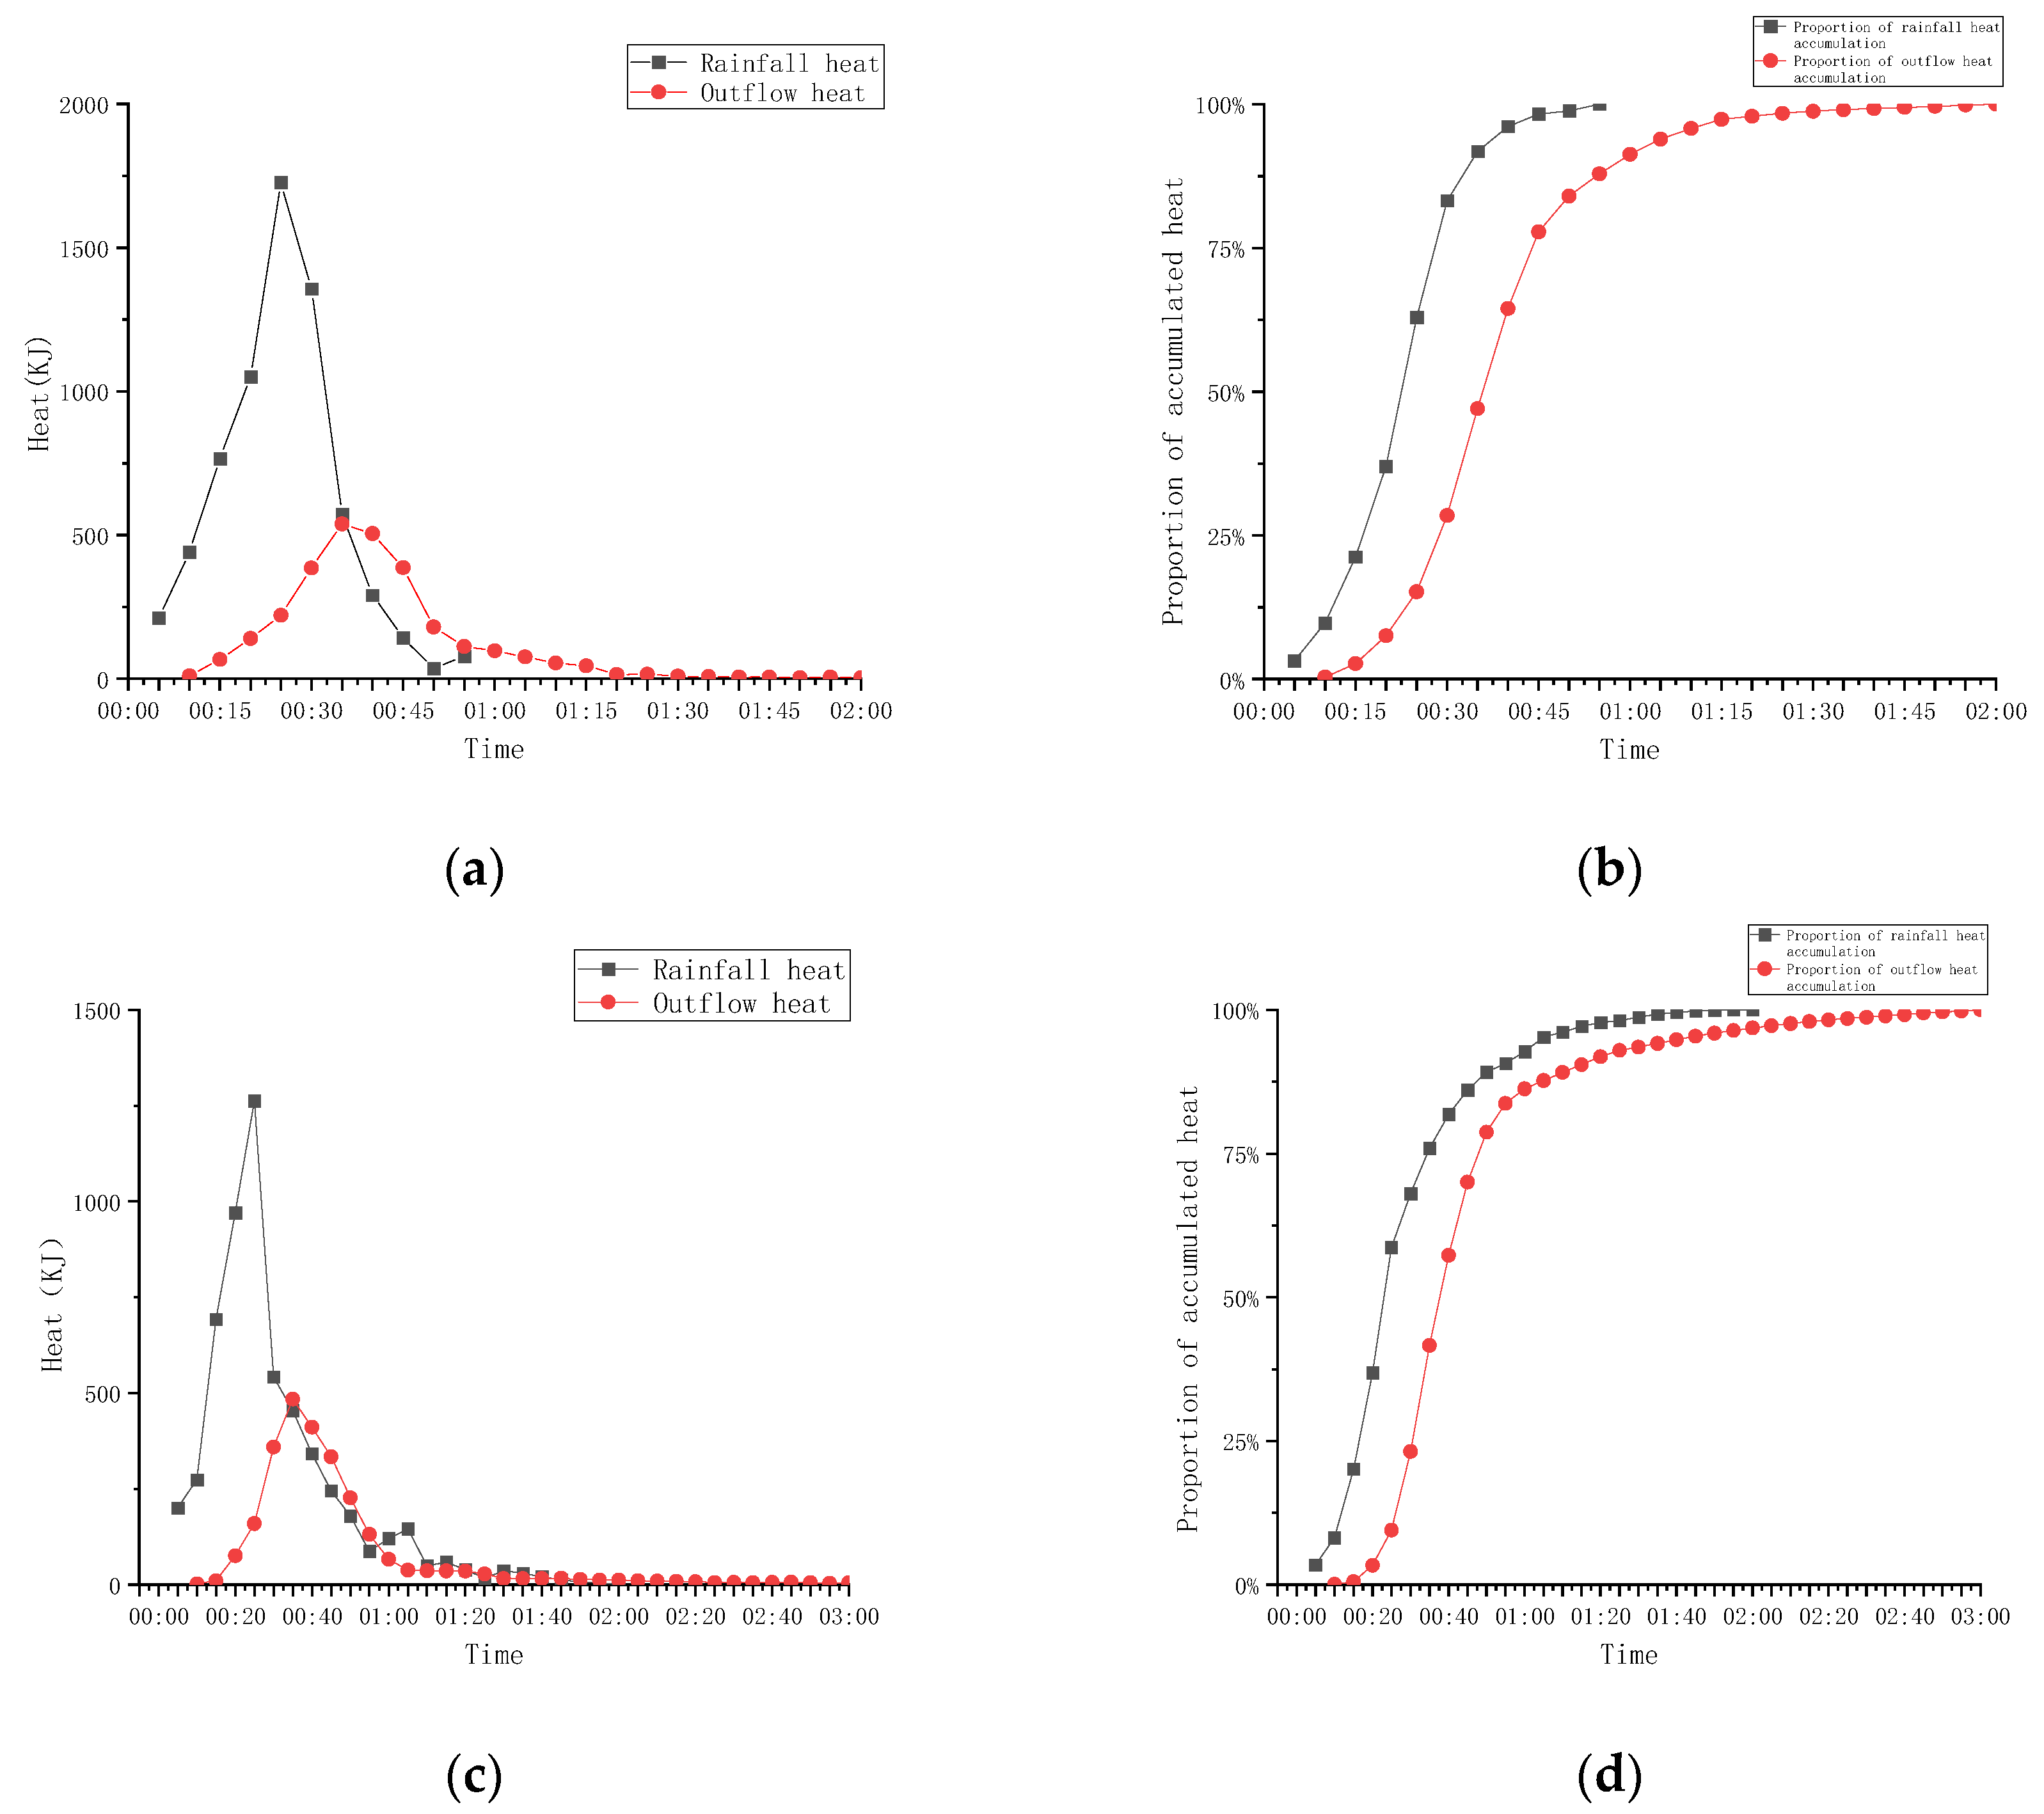
3.3. Analysis of the Heat-Emission Curve of Bioretention
4. Summary and Conclusions
Author Contributions
Funding
Data Availability Statement
Conflicts of Interest
References
- Armson, D.; Stringer, P.; Ennos, A.R. The effect of tree shade and grass on surface and globe temperatures in an urban area. Urban For. Urban Green. 2012, 11, 245–255. [Google Scholar] [CrossRef]
- Thompson, A.; Wilson, T.; Norman, J.; Gemechu, A.; Roa-Espinosa, A. Modeling the Effect of Summertime Heating on Urban Runoff Temperature1. JAWRA J. Am. Water Resour. Assoc. 2008, 44, 1548–1563. [Google Scholar] [CrossRef]
- Nelson, K.C.; Palmer, M.A. Stream Temperature Surges under Urbanization and Climate Change: Data, Models, and Responses. JAWRA J. Am. Water Resour. Assoc. 2007, 43, 440–452. [Google Scholar] [CrossRef]
- James, W.; University of Guelph; Xie, J.; Jenson, G.A. Modeling Thermal Enrichment of Streams due to Solar Heating of Local Urban Stormwater. J. Water Manag. Model. 1999, R204-08, 139–157. [Google Scholar] [CrossRef] [Green Version]
- Herb, W.R.; Janke, B.; Mohseni, O.; Stefan, H.G. Thermal pollution of streams by runoff from paved surfaces. Hydrol. Process. 2008, 22, 987–999. [Google Scholar] [CrossRef]
- Jinqi, W.; Yuzhi, S.; Jin, H. Effects of Increasing Water Temperature on Water Properties and Aquatic Organisms: A Critical Review. J. Hydroecology 2020, 41, 100–109. (In Chinese) [Google Scholar]
- U S Environmental Protection Agency. Technical Guidance on Implementing the Stormwater Runoff Requirements for Federal Projects under Section 438 of the Energy Independence and Security Act of 2007; U S Environmental Protection Agency: Washington DC, USA, 2009.
- Yuan-lin, H. Analytical Study on the Overall Benefits of LID Stormwater System. Master’s Thesis, Beijing University of Civil Engineering and Architecture, Beijing, China, 2012. [Google Scholar]
- Xiao-jing, L.; Jun-qi, L.; Hai-jun, Q. Advance in thermal pollution of urban rainfall runoff and its mitigation measures. J. Adv. Sci. Technol. Water Resour. 2013, 33, 89–94. (In Chinese) [Google Scholar]
- Yanwen, L. A Comparison of Road Rainwater Stagnation and Purification of the Different Bio-retention System Composed by Four Kinds of Plants. Master’s Thesis, Southwest University, Chongqing, China, 2017. [Google Scholar]
- Jones, M.P.; Hunt, W.F.; Smith, J.T. The Effect of Urban Stormwater Bmps on Runoff Temperature in Trout Sensitive Waters. In Proceedings of the 2007 ASAE Annual Meeting American Society of Agricultural and Biological Engineers, Minneapolis, MN, USA, 17–20 June 2007. [Google Scholar]
- Jones, M.P.; Hunt, W.F. Bioretention Impact on Runoff Temperature in Trout Sensitive Waters. J. Environ. Eng. 2009, 135, 577–585. [Google Scholar] [CrossRef]
- Long, D.L.; Dymond, R.L. Thermal Pollution Mitigation in Cold Water Stream Watersheds Using Bioretention. JAWRA J. Am. Water Resour. Assoc. 2013, 50, 977–987. [Google Scholar] [CrossRef]
- Weitong, X.; Jianlong, W.; Yanjie, W. Immigration of thermal pollution from stormwater runoff via rain garden. J. Water Resour. Hydropower Eng. 2020, 51, 162–167. (In Chinese) [Google Scholar]
- Shan, Z. Study of the Reduction of Urban Stormwater Runoff Thermal Pollution by Bioretention. Master’s Thesis, Beijing University of Civil Engineering and Architecture, Beijing, China, 2020. [Google Scholar]
- Li, J.; Gong, Y.; Li, X.; Yin, D.; Shi, H. Urban stormwater runoff thermal characteristics and mitigation effect of low impact development measures. J. Water Clim. Chang. 2018, 10, 53–62. [Google Scholar] [CrossRef]
- Li, H.; Davis, A.P. Water Quality Improvement through Reductions of Pollutant Loads Using Bioretention. J. Environ. Eng. 2009, 135, 567–576. [Google Scholar] [CrossRef]
- Sabouri, F.; Gharabaghi, B.; Mahboubi, A.; McBean, E. Impervious surfaces and sewer pipe effects on stormwater runoff temperature. J. Hydrol. 2013, 502, 10–17. [Google Scholar] [CrossRef]
- Hunt, W.F.; Davis, A.; Traver, R. Meeting Hydrologic and Water Quality Goals through Targeted Bioretention Design. J. Environ. Eng. 2012, 138, 698–707. [Google Scholar] [CrossRef]
- Jing-lei, M. Design Storm Pattern Analysis in the City of Beijing. Master’s Thesis, Lanzhou Jiaotong University, Lanzhou, China, 2011. [Google Scholar]
- Ke, J.; Zhe, Y.; Chao, W. Pilot Protection Based on Spearman Rank Correlation Coefficient for Transmission Line Connected to Renewable Energy Source. J. Autom. Electr. Power Syst. 2020, 44, 103–111. (In Chinese) [Google Scholar]
- Cohen, J. Statistical Power Analysis for the Behavioral Sciences, 2nd ed.; Routledge: New York, NY, USA, 1988; p. 334. [Google Scholar]
- Jones, M.P.; Hunt, W.F. The Effect of Bioretention on Runoff Temperature in Trout Sensitive Waters. In Proceedings of the American Society of Agricultural and Biological Engineers, Providence, RI, USA, 29 June–2 July 2008. [Google Scholar] [CrossRef]
- Junqi, L.; Mengqi, S.; Xiaojing, L. Experimental Study on Thermal Pollution Control of Stormwater Runoff by Bioretention. J. Water Resour. Prot. 2022, 38, 6–12. (In Chinese) [Google Scholar]


| Case | Rainfall Temperature (°C) | Rainfall Return Period (Year) | Catchment Area Ratio | Rainfall Duration (min) | Influent Volume (L) |
|---|---|---|---|---|---|
| 1 | 22 | 1 | 1:5 | 60 | 31.82 |
| 2 | 22 | 2 | 1:10 | 120 | 110.32 |
| 3 | 22 | 5 | 1:10 | 120 | 145.02 |
| 4 | 25 | 2 | 1:05 | 60 | 41.75 |
| 5 | 25 | 2 | 1:05 | 120 | 55.16 |
| 6 | 25 | 1 | 1:10 | 60 | 63.63 |
| 7 | 25 | 5 | 1:10 | 60 | 109.76 |
| 8 | 28 | 5 | 1:05 | 60 | 54.88 |
| 9 | 28 | 2 | 1:05 | 120 | 55.16 |
| 10 | 28 | 1 | 1:10 | 120 | 84.08 |
| Range | Correlation |
|---|---|
| Strong correlation | |
| Moderate correlation | |
| Weak correlation | |
| No linear relationship |
| Case | Rainfall Temperature (°C) | Air Temperature (°C) | Influent Volume (L) | Heat Reduction Rate (%) | Volume Reduction Rate (%) | HR/VR | Contribution of Volume Reduction (%) | Contribution of Heat Exchange (%) |
|---|---|---|---|---|---|---|---|---|
| 1 | 22 | 20 | 31.82 | 63 | 61 | 1.03 | 94.30 | 5.70 |
| 2 | 22 | 19 | 110.32 | 25 | 18 | 1.39 | 70.58 | 29.42 |
| 3 | 22 | 18 | 145.02 | 21 | 13 | 1.62 | 61.80 | 38.20 |
| 4 | 25 | 22 | 41.75 | 63 | 51 | 1.24 | 80.26 | 19.74 |
| 5 | 25 | 23 | 55.16 | 55 | 40 | 1.38 | 73.78 | 26.22 |
| 6 | 25 | 16 | 63.63 | 57 | 35 | 1.63 | 62.12 | 37.88 |
| 7 | 25 | 17 | 109.76 | 40 | 19 | 2.11 | 46.55 | 53.45 |
| 8 | 28 | 24 | 54.88 | 61 | 43 | 1.42 | 70.54 | 29.46 |
| 9 | 28 | 27 | 55.16 | 56 | 42 | 1.33 | 74.86 | 25.14 |
| 10 | 28 | 24 | 84.08 | 39 | 23 | 1.70 | 59.57 | 40.43 |
| Case | EMT (°C) | HV | HT |
|---|---|---|---|
| 1 | 19.95 | 1.003 | 6.761 |
| 2 | 20.02 | 1.389 | 2.778 |
| 3 | 20.01 | 1.615 | 2.322 |
| 4 | 18.63 | 1.235 | 2.473 |
| 5 | 18.99 | 1.375 | 2.288 |
| 6 | 16.74 | 1.629 | 1.725 |
| 7 | 18.41 | 2.105 | 1.517 |
| 8 | 19.22 | 1.419 | 1.945 |
| 9 | 21.27 | 1.333 | 2.330 |
| 10 | 22.31 | 1.696 | 1.919 |
| Case | RT (°C) | RD (min) | IV (L) | PTRH (min) | PTOH (min) |
|---|---|---|---|---|---|
| 1 | 22 | 60 | 31.82 | 25 | 35 |
| 2 | 22 | 120 | 110.32 | 25 | 40 |
| 3 | 22 | 120 | 145.02 | 25 | 35 |
| 4 | 25 | 60 | 41.75 | 25 | 30 |
| 5 | 25 | 120 | 55.16 | 25 | 35 |
| 6 | 25 | 60 | 63.63 | 25 | 35 |
| 7 | 25 | 60 | 109.76 | 25 | 40 |
| 8 | 28 | 60 | 54.88 | 25 | 35 |
| 9 | 28 | 120 | 55.16 | 25 | 40 |
| 10 | 28 | 120 | 84.08 | 25 | 40 |
| RF(°C) | RP (year) | CAR | RD (min) | IV (L) | HR (%) |
|---|---|---|---|---|---|
| 25 | 1 | 1:10 | 60 | 63.63 | 57 |
| 25 | 2 | 1:5 | 120 | 55.16 | 55 |
Publisher’s Note: MDPI stays neutral with regard to jurisdictional claims in published maps and institutional affiliations. |
© 2022 by the authors. Licensee MDPI, Basel, Switzerland. This article is an open access article distributed under the terms and conditions of the Creative Commons Attribution (CC BY) license (https://creativecommons.org/licenses/by/4.0/).
Share and Cite
Li, J.; Li, J.; Li, X.; Li, Z. Analysis of Thermal Pollution Reduction Efficiency of Bioretention in Stormwater Runoff under Different Rainfall Conditions. Water 2022, 14, 3546. https://doi.org/10.3390/w14213546
Li J, Li J, Li X, Li Z. Analysis of Thermal Pollution Reduction Efficiency of Bioretention in Stormwater Runoff under Different Rainfall Conditions. Water. 2022; 14(21):3546. https://doi.org/10.3390/w14213546
Chicago/Turabian StyleLi, Junqi, Jing Li, Xiaojing Li, and Zimu Li. 2022. "Analysis of Thermal Pollution Reduction Efficiency of Bioretention in Stormwater Runoff under Different Rainfall Conditions" Water 14, no. 21: 3546. https://doi.org/10.3390/w14213546
APA StyleLi, J., Li, J., Li, X., & Li, Z. (2022). Analysis of Thermal Pollution Reduction Efficiency of Bioretention in Stormwater Runoff under Different Rainfall Conditions. Water, 14(21), 3546. https://doi.org/10.3390/w14213546