Article

Performance Analysis of an Eductor-Based Membrane Distillation Unit

1
School of Engineering, RMIT University, Melbourne, VIC 3083, Australia
2
Faculty of Engineering and Food Technology, University of Agriculture and Forestry, Hue University, Thua Thien Hue 530000, Vietnam
*
Author to whom correspondence should be addressed.
Water 2022, 14(22), 3624; https://doi.org/10.3390/w14223624
Submission received: 16 October 2022 / Revised: 6 November 2022 / Accepted: 7 November 2022 / Published: 10 November 2022

Abstract

:
Thermal desalination technologies involve two primary processes: vapor generation from saline water, and effective recovery of the resulting condensate. Membrane distillation (MD) systems are among the emerging thermal desalination technologies which use a hydrophobic membrane to recover condensate through either direct or indirect contact (with the cooling fluid) condensation. The specific process technology (for thermal energy transfer and condensate recovery) depends on the type of MD. Direct contact membrane distillation (DCMD) and vacuum membrane distillation (VMD) are two significant MD processes, with DCMD having the advantage of direct condensation and simple design, while VMD systems have high yield through sub-atmospheric vapor generation. This work focuses on developing an eductor-based MD process incorporating the strengths of both DCMD and VMD. It is an experimental study with a water jet eductor replacing the vacuum pump and condenser in a typical VMD system for active permeate vapor transfer and condensation. Unlike the exiting VMD systems, the proposed design recovers condensate by direct contact condensation. The sub-cooled water acts as a motive flow which entrains the secondary vapor into the stream, causing mass transfer via condensation at the interface. The modified VMD was found to have achieved better flux compared to the conventional VMD system. The performance of the eductor, sensitivity to parameters, and the practicality of the technology have been analyzed.

1. Introduction

Although about 71% of the earth is covered by water, only 0.5% of it is in a usable freshwater form in rivers, lakes, and aquifers [1,2]. This fact of limited availability and increasing scarcity due to rapid urbanization is undeniable. Limited availability, overconsumption, and deterioration of freshwater sources are additional factors impacting this intensified shortage [3,4]. Despite the counterarguments, water recycling and freshwater production from sea water come forward as immediate remedies [5,6]. A variety of desalination technologies have been developed as effective solutions for brackish and saline water treatment. Broadly, they are classified based on the methods used, such as evaporation and condensation, filtration, and crystallization, which are actuated either by thermal, mechanical, electrical, or chemical energies from either renewable or non-renewable energy sources [7,8]. Thermal desalination (evaporation and condensation) has been one of the most preferred methods for freshwater production, with recent focus shifting towards membrane distillation (MD) (a membrane-based thermal desalination process). In comparison to pure thermal distillation, MD has higher energy efficiency and yield. The process involves separation of vapor from saline feed with porous hydrophobic membranes. Like many other desalination technologies, MD requires pre-treatment (coagulation, flocculation, clarification, filtration, etc.) [9].
The commercial and academic research on MD technologies involves membrane fabrication, module configuration, thermal energy sources, and spacer configuration. The primary focus is on strength enhancement, increasing yield, optimizing energy consumption, and minimizing gap losses. There are different types of MD configurations that are named based on how the feed, membrane, and permeate interact. This paper focuses on the design optimization of the vacuum membrane distillation (VMD) system. The conventional VMD system uses a mechanical vacuum pump to maintain the vacuum on the permeate side while the permeate vapor is condensed around an indirect contact condenser.
This work uses an eductor for active vapor transfer and condensation in a VMD system. This work experimentally studies the possibility of using eductors to replace vacuum pumps and condensers in VMD units. Unlike existing VMD, this process performs direct contact condensation i.e., the vapour condenses in direct contact with the cooling water. This work has been performed with an aim to reduce the footprint of MD for developing a simple and compact portable desalination unit.

2. Technology and Mechanism Description

2.1. Eductor

Eductors are static mechanical devices that utilize pressure energy in a primary fluid (motive fluid) for suction and compression of a low-pressure secondary fluid. Both the primary and secondary fluid can be any combination of liquid, condensable gas, or non-condensable gas. Some other applications also use particles at the secondary fluid inlet. In an MD application, an eductor replaces the large vacuum pump and condensers for combined active vapor transfer and condensation. Water is used as the motive fluid for suction of saturated vapor from the permeate side of the desalination module.
Eductors consist of a primary nozzle, secondary fluid inlet pipe, suction chamber, mixing chamber, throat, and diffuser. Figure 1a shows the functional components of an eductor. The pressure energy in the motive fluid is converted to kinetic energy through the nozzle such that a low-pressure zone is created in the suction chamber which entrains the secondary fluid, explained within Figure 1b. The momentum transfer between the high-velocity motive fluid jet and the surrounding vapor carries forward the entrained fluid. The collapsing of vapor bubbles during direct contact condensation (DCC) at the interphase interface increases the secondary fluid-carrying capacity of the motive fluid. Condensation progresses along the axial direction of the eductor, and it has been found that the entrained vapor becomes completely condensed within the throat. The diffuser of an eductor is analogous to a compressor which discharges the low-pressure condensed secondary fluid to an elevated pressure. Both the mechanical and thermal activity within the system contribute to the performance of the eductor. The general performance of an eductor is measured by its entrainment ratio (Equation (1)) and pressure ratio (Equation (2)).
E r = m ˙ s m ˙ p
P r = P b P s P i P s
where Er is the entrainment ratio, m ˙ s is the suction mass flow rate, m ˙ p is the primary (motive fluid) mass flow rate, and Pr is the pressure ratio. Pb is the back pressure that can be controlled by opening or closing a valve at the outlet of the eductor (beyond the pressure rising diffuser). Ps is the suction pressure that is experienced by the secondary fluid, and it is measured at an inlet to the suction port. Pi is the inlet pressure, i.e., the pressure at which the motive fluid (primary fluid) is supplied to the eductor.
The entrainment of vapor into the eductor can be defined by applying an energy balance to the adiabatic secondary fluid pipe, giving the Equation (3):
2 h g o h g 2 V g 2 = 0
where hgo is the specific enthalpy of vapor at the nozzle inlet, hg2 is the specific enthalpy of the primary nozzle outlet, and Vg2 is the outlet velocity of the nozzle.
For condensation based on Clausius–Clapeyron and Bernoulli’s theorem, the DCC heat transfer coefficient of vapor into a sub-cooled water jet (Hc) is defined by [10] as:
H c = 1.414   h f g 3 / 2 v g v g v l T g T g T l
where hfg is the latent heat, vg is the specific volume of vapor, vl is the specific volume of liquid, Tg is the temperature of vapor, and Tl is the temperature of liquid.
The energy balance at the interface of the annular flow defines the condensation rate (dMg/dt) within the eductor as follows [11]:
d M g d t = H c T g T l β h f g
Practically, there are two geometric points in an eductor at which chocking occurs. This chocking phenomenon helps in understanding the fundamental flow mechanism within the single and multiphase flow paths. It occurs when a flow passes a restriction towards a lower pressure zone at a constant mass flow rate. The first point is at the exit of the primary nozzle while the second one is in the throat. In some cases, the secondary chocking of a two-phase flow may not be clearly observed due to the influence of outlet pressure. Koirala et al. computationally explored the entraining and condensing capacity of an eductor (Figure 2). The commercial eductor used for the work was able to achieve an entrainment ratio of 0.004, and complete condensation was achieved within the total length of 14 cm. This supports the early assumption regarding the usability of an eductor for combined vacuum generation and condensation [12]. The figure further describes the single species two-flow mechanism within an eductor. The region of interphase interaction is the zone of mass transfer, and the rate of mass transfer is higher after the throat. Similarly, complete condensation of vapor occurs within an eductor system.

2.2. Mechanism of Membrane Distillation (MD)

The condensation of permeate vapor in the primary or motive fluid (low TDS liquid water) leads to a rise in the temperature of the motive fluid which adversely effects the vacuum. It should be noted that the vacuum pressure generation capacity of an eductor is a function of the motive fluid velocity and temperature. Therefore, it is important to maintain the motive fluid flow rate above a minimum value to minimize the temperature rise of the motive fluid. In the proposed system vapor transport from the feed to the permeate side is driven by the feed temperature and vacuum pressure, like in a typical VMD system. On the other hand, the permeate vapor is condensed directly in the stream of fresh liquid water like a DCMD system and hence the proposed system could be considered as analogous to a combination of VMD and DCMD.
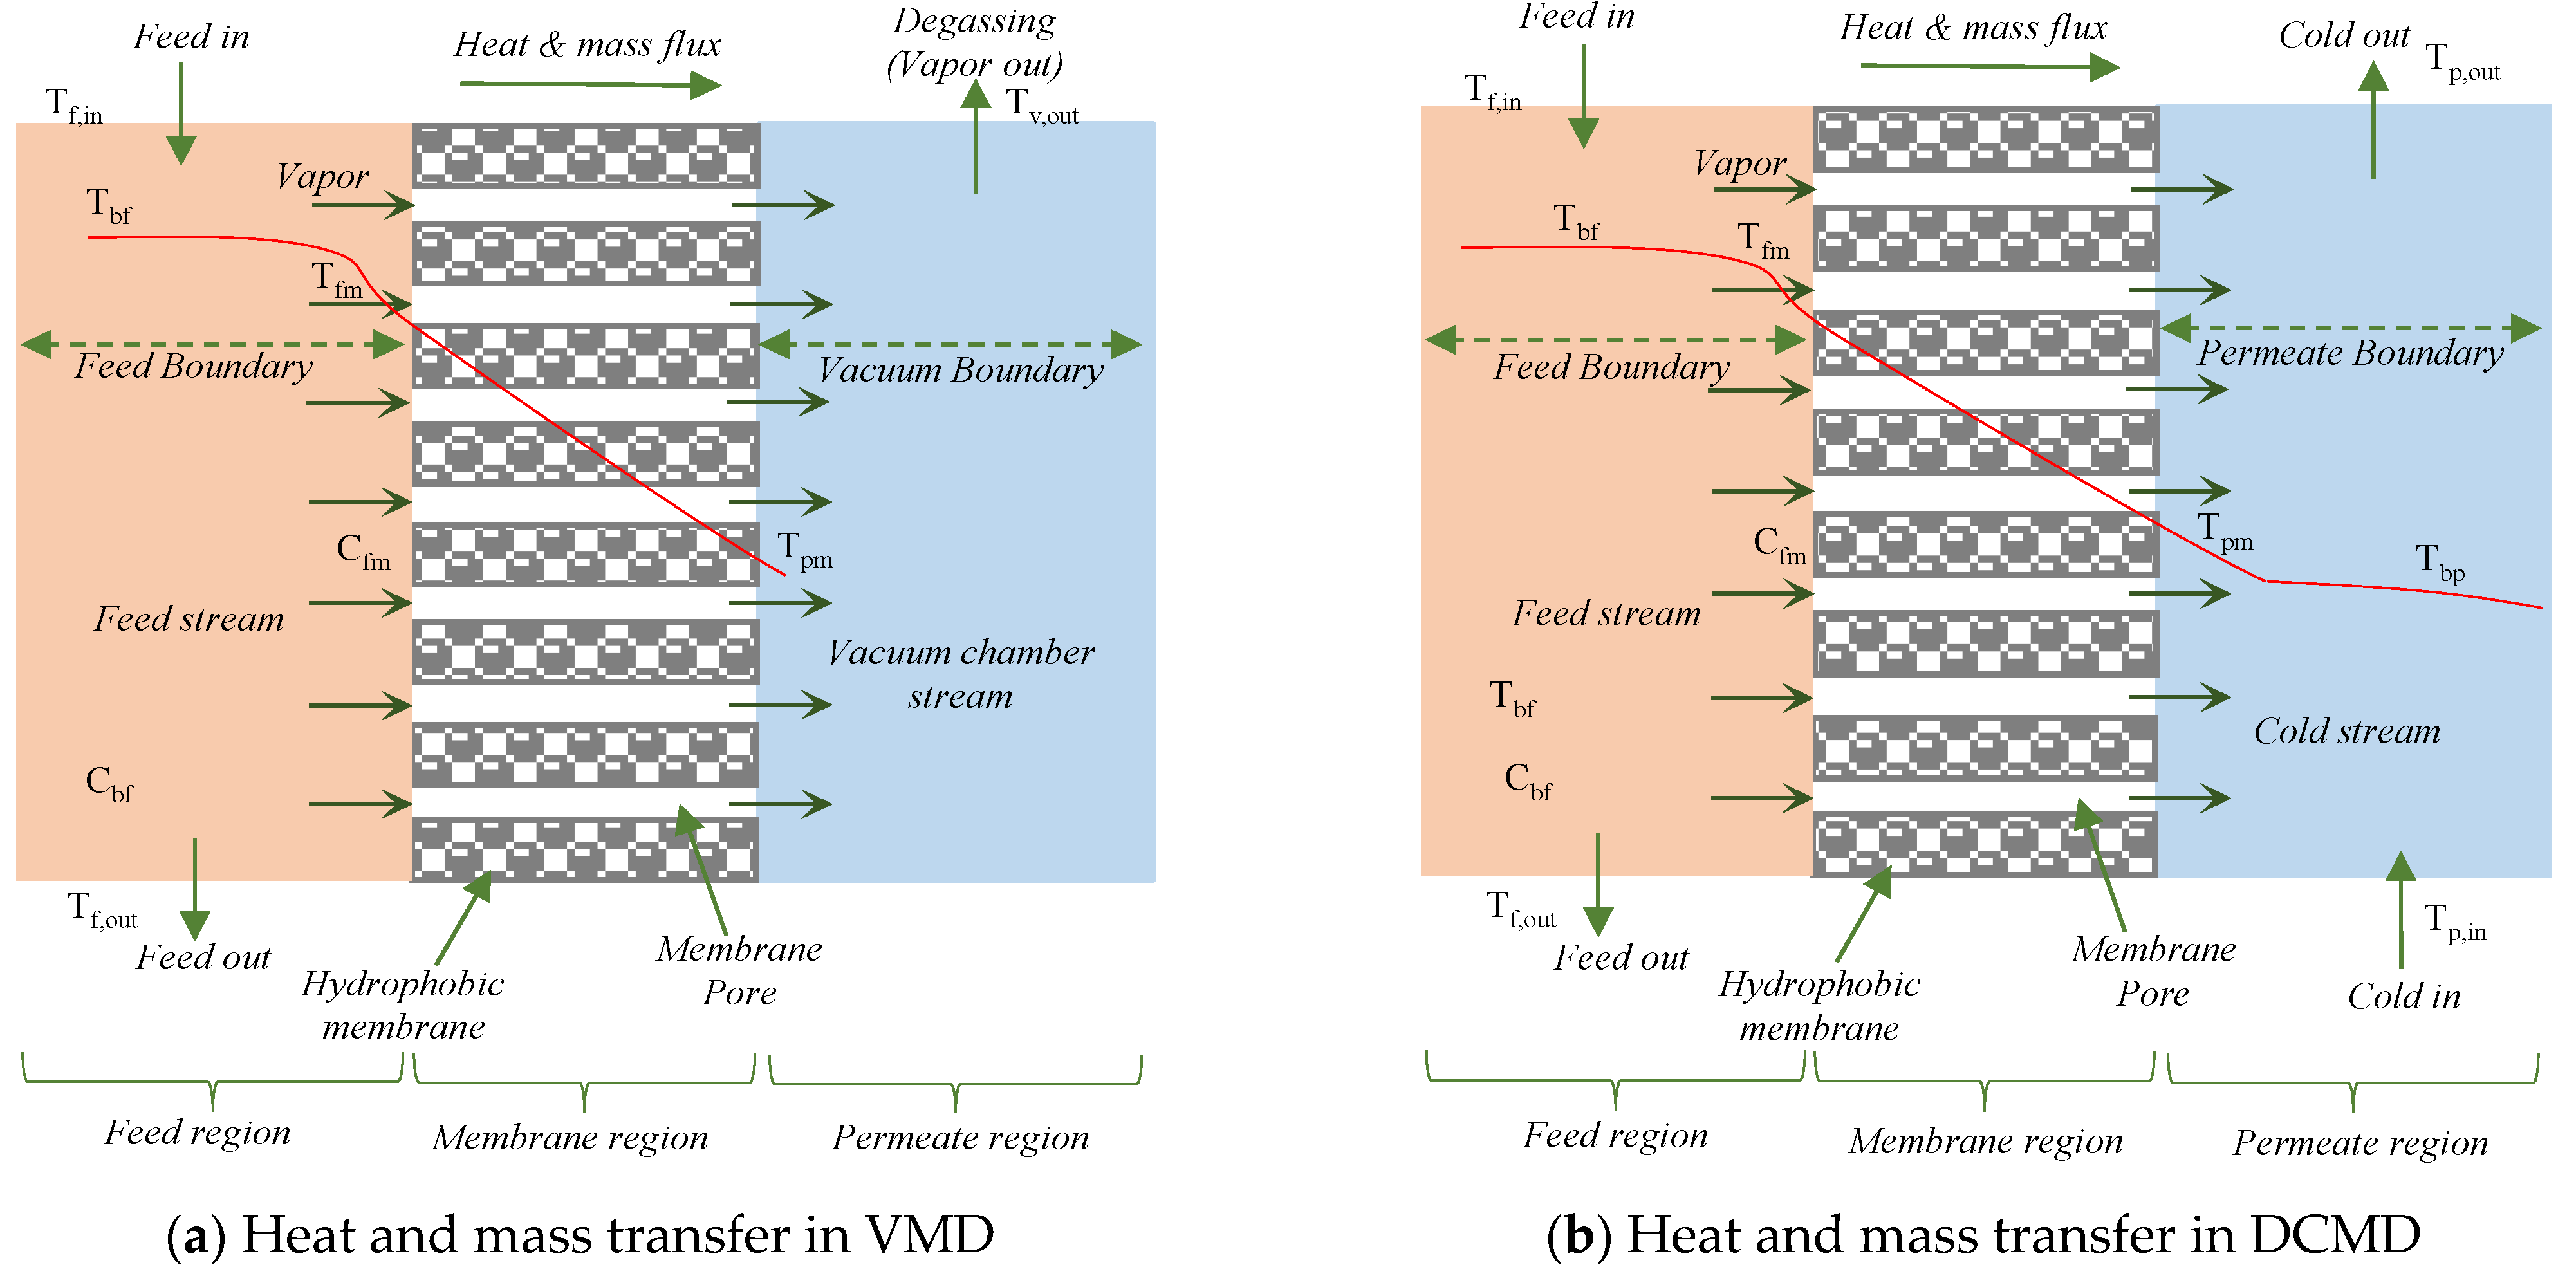
The thermal mechanism of freshwater production has been discussed with the aid of existing mathematical models and schematic diagram shown in Figure 3. In this section, heat and mass transfer in both direct contact membrane distillation (DCMD) and vacuum membrane distillation (VMD) are discussed. A flat plate and frame membrane module, with a flat sheet membrane, has been considered for the description of the mechanism. In both configurations (DCMD and VMD), the hot saline feedwater is pumped into the feed side where, at the feed channel, the solution directly contacts the membrane surface. The trans-membrane vapor separation mechanism and zone of condensation are two major factors differentiating the two processes. For DCMD, vapor is captured and condensed in the permeate side, where trans-membrane boundary travel is due to the vapor pressure difference resulting from the temperature difference between the two sides of the membrane. The temperature difference at the two walls is due to the boundary layer temperature of feed and permeate flows. The condensation of vapor occurs in the cold freshwater flow stream, which is pumped either counter-currently or co-currently into the permeate side of the module. For VMD, vapor is carried away from the module by the action of a vacuum pump and is condensed separately in a condenser. The transmembrane vapor travel is still due to the pressure difference, but this time it is due to vapor pressure at the feed side and the mechanically induced sub-atmospheric pressure on the permeate side. The condensation of the separated vapor occurs outside the membrane module in a specialized condenser.
The DCMD process is widely used because of its simple configuration (e.g., no need for an external condenser system) and its relatively high freshwater production rate [13]. However, the low thermal energy efficiency, due to the high heat conduction losses across the membrane, is a downside for DCMD [14]. For VMD, due to the lower applied permeate pressure compared to the feed pressure of volatile vapor, which is separated from the feed solution, the vapor molecules are transferred through membrane pores from the feed to the permeate side [15]. In the case of VMD, the heat conduction losses and the heat transfer resistance on the permeate side are negligible. Therefore, higher thermal efficiency and freshwater production are expected in comparison to a DCMD module, especially at lower temperature [16]. The main drawbacks of VMD are its complicated structure and higher risk of pore wetting due to the greater pressure difference [17].

2.2.1. Heat Transfer

In membrane distillation, both heat and mass transfer occur concurrently. To acquire accurate and reliable predicted results for membrane surface temperatures and permeate flux, the dominant mechanisms of heat and mass transfer need to be determined. In general, to predict the mass transfer, the heat transfer estimation is a prerequisite [17,18,19]. In DCMD and VMD, convective heat transfer from the bulk feed solution through the thermal boundary layer to membrane surface on the feed side is demonstrated in Equation (6):
Q f   ˙ = h f   A   T f T m , f
In this equation, hf (W·m−2·K−1), Tf (K), and Tmf (K) are the convective heat transfer coefficient on the feed side, the bulk feed temperature, and the membrane surface temperature on the feed side, respectively. The bulk fluid temperature on the feed side is estimated based on the feed inlet temperature (Tf,in) and the feed outlet temperature (Tf,out) as in Equation (7):
T f = T f , in + T f , out 2
The total heat transfer through the membrane consists of sensible heat (heat transferred by conduction) and latent heat (heat transferred due to the water vapor transport through membrane pores). For DCMD, this type of heat transfer can be calculated using Equation (8):
Q ˙ m = k m δ m   A   T m , f T m , p + J w   A   Δ H v , w
For VMD, the heat transfer by conduction is negligible. Therefore, Equation (8) is modified to Equation (9) [17]:
Q ˙ m = J w   A   Δ H v , w
where Jw (kg·m−2·s−1) and Δ H v , w (kJ/kg) are the permeate flux and latent heat of vaporization, respectively. Δ H v , w   can be evaluated at the mean membrane surface temperature Tm(K) using the Equation (10) [17,20]:
Δ H v , w = 1.7535 T m + 2024.3
The thermal conductivity of the membrane can be estimated by using Maxwell’s model according to Equations (11) and (12) [21]:
k m = k g 1 + 2 β φ + 2 β 3 0 . 1 β φ 2 + 0 . 05 φ 3 exp 4 . 5 β 1 β φ
β = k p k g / k p + 2 k g ;   φ = 1 ε m
where kg and kp are the thermal conductivity of the gas phase inside the membrane pores and the thermal conductivity of the membrane material, respectively.
On the permeate side of a DCMD module, the heat transfer by convection from the membrane surface, through the thermal boundary layer to the bulk fluid, is given by Equation (13):
Q ˙ p = h p   A   T m , p T p
where hp (W·m−2·K−1), Tp (K), and Tmp (K) are the convective heat transfer coefficient on the permeate side, bulk permeate temperature, and membrane surface temperature on the permeate side, respectively. The bulk temperature on the permeate side is estimated based on the permeate inlet temperature (Tp,in) and the permeate outlet temperature (Tp,out), and is determined using Equation (14):
T p = T p , in + T p , out 2
For VMD, the convective heat transfer is not considered due to the presence of a vacuum.
In a steady state condition, the overall heat flux for a DCMD module can be derived by combining Equations (8), (10), and (14):
h f   A   T f T m , f = k m δ m   A   T m , f T m , p + J w   A   Δ H v , w = h p   A   T m , p T p
For a VMD module, Equation (15) can be written as shown in Equation (16):
h f   A   T f T m , f = J w   A   Δ H v , w
The membrane surface temperature is calculated based on an iterative approach for energy balance in the system, defined through Equation (8).
T m , f = h m T p + h f h p T f + h f T f J w Δ H v , w h m + h f 1 + h m h p
T m , p = h m T f + h p h f T p + h p T p J w Δ H v , w h m + h p 1 + h m h f
For a VMD module, the membrane surface temperature on the feed side can be estimated based on Equation (16), as shown in Equation (19):
T m , f = T f J w Δ H v , w h f
To determine the heat transfer coefficient, the Nusselt number given by Equation (20) is appropriate. The values of Nusselt number can be estimated using the Equations (20a) and (20b) [18].
Nu j = h j d h k j
Nu j = 1.62 × R e P r d d h / L 1 / 3 R e < 2300
Nu j = 0 . 023 × R e 4 / 5 × P r d 1 / 3 R e > 2300
where j can be for feed (f) or permeate (p), k is the solution thermal conductivity, dh is the hydraulic diameter calculated based on spacer characteristics, L is the characteristic length, R e Reynolds number, and P rd   Prandtl number.

2.2.2. Mass Transfer Mechanism

For DCMD, water vapor is transferred from the feed side, through the membrane pores to the permeate side, due to the vapor pressure difference, which in turn is caused by the membrane surface temperature difference. There is a relationship between mass flux (Jw) and vapor pressure difference (∆Pv), expressed by Equation (21) [22]:
J w = B m · Δ P v = B m · P v , m f P v , m p
where Pv,mf, and Pv,mp are the partial pressures of water vapor at the feed–membrane interface and permeate–membrane interface, respectively. These pressures can be estimated at Tm,f, and Tm,p by using Sharqawy’s equation [23].
In the case of VMD, the vacuum replaces the cold solution on the permeate side, therefore the partial vapor pressure at the membrane surface on the permeate side (Pv,mp) in Equation (21) can be assumed to be equal to the vacuum pressure for simplified calculation [17]. As a result, Equation (21) can be written for VMD, as showed in Equation (22):
J w = B m · Δ P v = B m · P v , m f P v a c u u m
To determine the governing mass transfer mechanism in membrane pores, the Knudsen number, as determined in Equation (23), is used:
Kn = λ w / d p
where the mean free path of water molecules (λw) can be calculated using Equation (24) [13,17].
λ w = k B T m 2 π P m d e 2
where de, dp, Pm, and kB, are Collison diameters of water vapor, pore diameter, mean pressure within the membrane pores, and the Boltzman constant, respectively.
In DCMD, the viscous flow is negligible. Therefore, three types of mass transfer mechanisms in the membrane pores can be taken into consideration: molecular diffusion, combined Knudsen-molecular diffusion, and Knudsen-type diffusion [17]. In the case of VMD, the molecular diffusion is neglected, hence the viscous flow model, Knudsen flow model, and their combination are the mass transport mechanisms. Generally, the membrane distillation coefficient (Bm) for DCMD and VMD can be determined using Equations (25)–(27) as shown in Table 1 for DCMD, and Equations (28)–(30) as shown in Table 2 for VMD.
In Table 1 and Table 2, τ, δm, εm, r, R, µ, M, Pa, and p, are membrane tortuosity, membrane thickness, membrane porosity, mean pore size radius, gas constant, fluid viscosity, the molecular weight of water, entrapped air pressure, and average pressure in the pore, respectively. T is the absolute temperature in the pore and Tm is the average temperature across the membrane. P is the total pressure in the pore and D is the diffusion coefficient.
In the case of the feedwater being saline, the concentration polarization effect should also be considered in the prediction of mass flux in both DCMD and VMD. During the saline water treatment process by DCMD and VMD, the concentration of bulk feed solution is lower than the concentration of the solution at the membrane surface due to the accumulation of non-volatile substances [24,25]. The relationship between mass flux and the concentration polarization coefficient (CPC) is demonstrated through implementing thin film theory, as shown in Equation (31) [17]:
CPC = C m , f C f = exp J w ρ f k s
where Cf, Cm,f, ρf, and ks are the bulk solution concentration, solution concentration at the membrane surface, solution density, and mass transfer coefficient respectively. To determine the mass transfer coefficient, the Sherwood number correlation is used, as shown in Equation (32) [17]:
Sh f = k s · d h D = 0.0588 · Re f 0.55 . Sc f 0.33
where D (m2·s−1) and Scf are the diffusion coefficient of the solute and the Schmidt number, which are determined in Equations (33) and (34), respectively [26]. To simplify the modelling, it is assumed that the proposed system will operate at low salinities and the effect of salinity on the diffusion coefficient will be negligible, hence the following equation of the diffusion coefficient has been used.
D ( T m , f ) = 0 . 72598   +   0 . 023087 × T m , f + 0 . 00027657 × T m , f 2 × 10 9
Sc f = μ f ρ f D

3. Eductor-Based Membrane Distillation

3.1. Concept Discussion

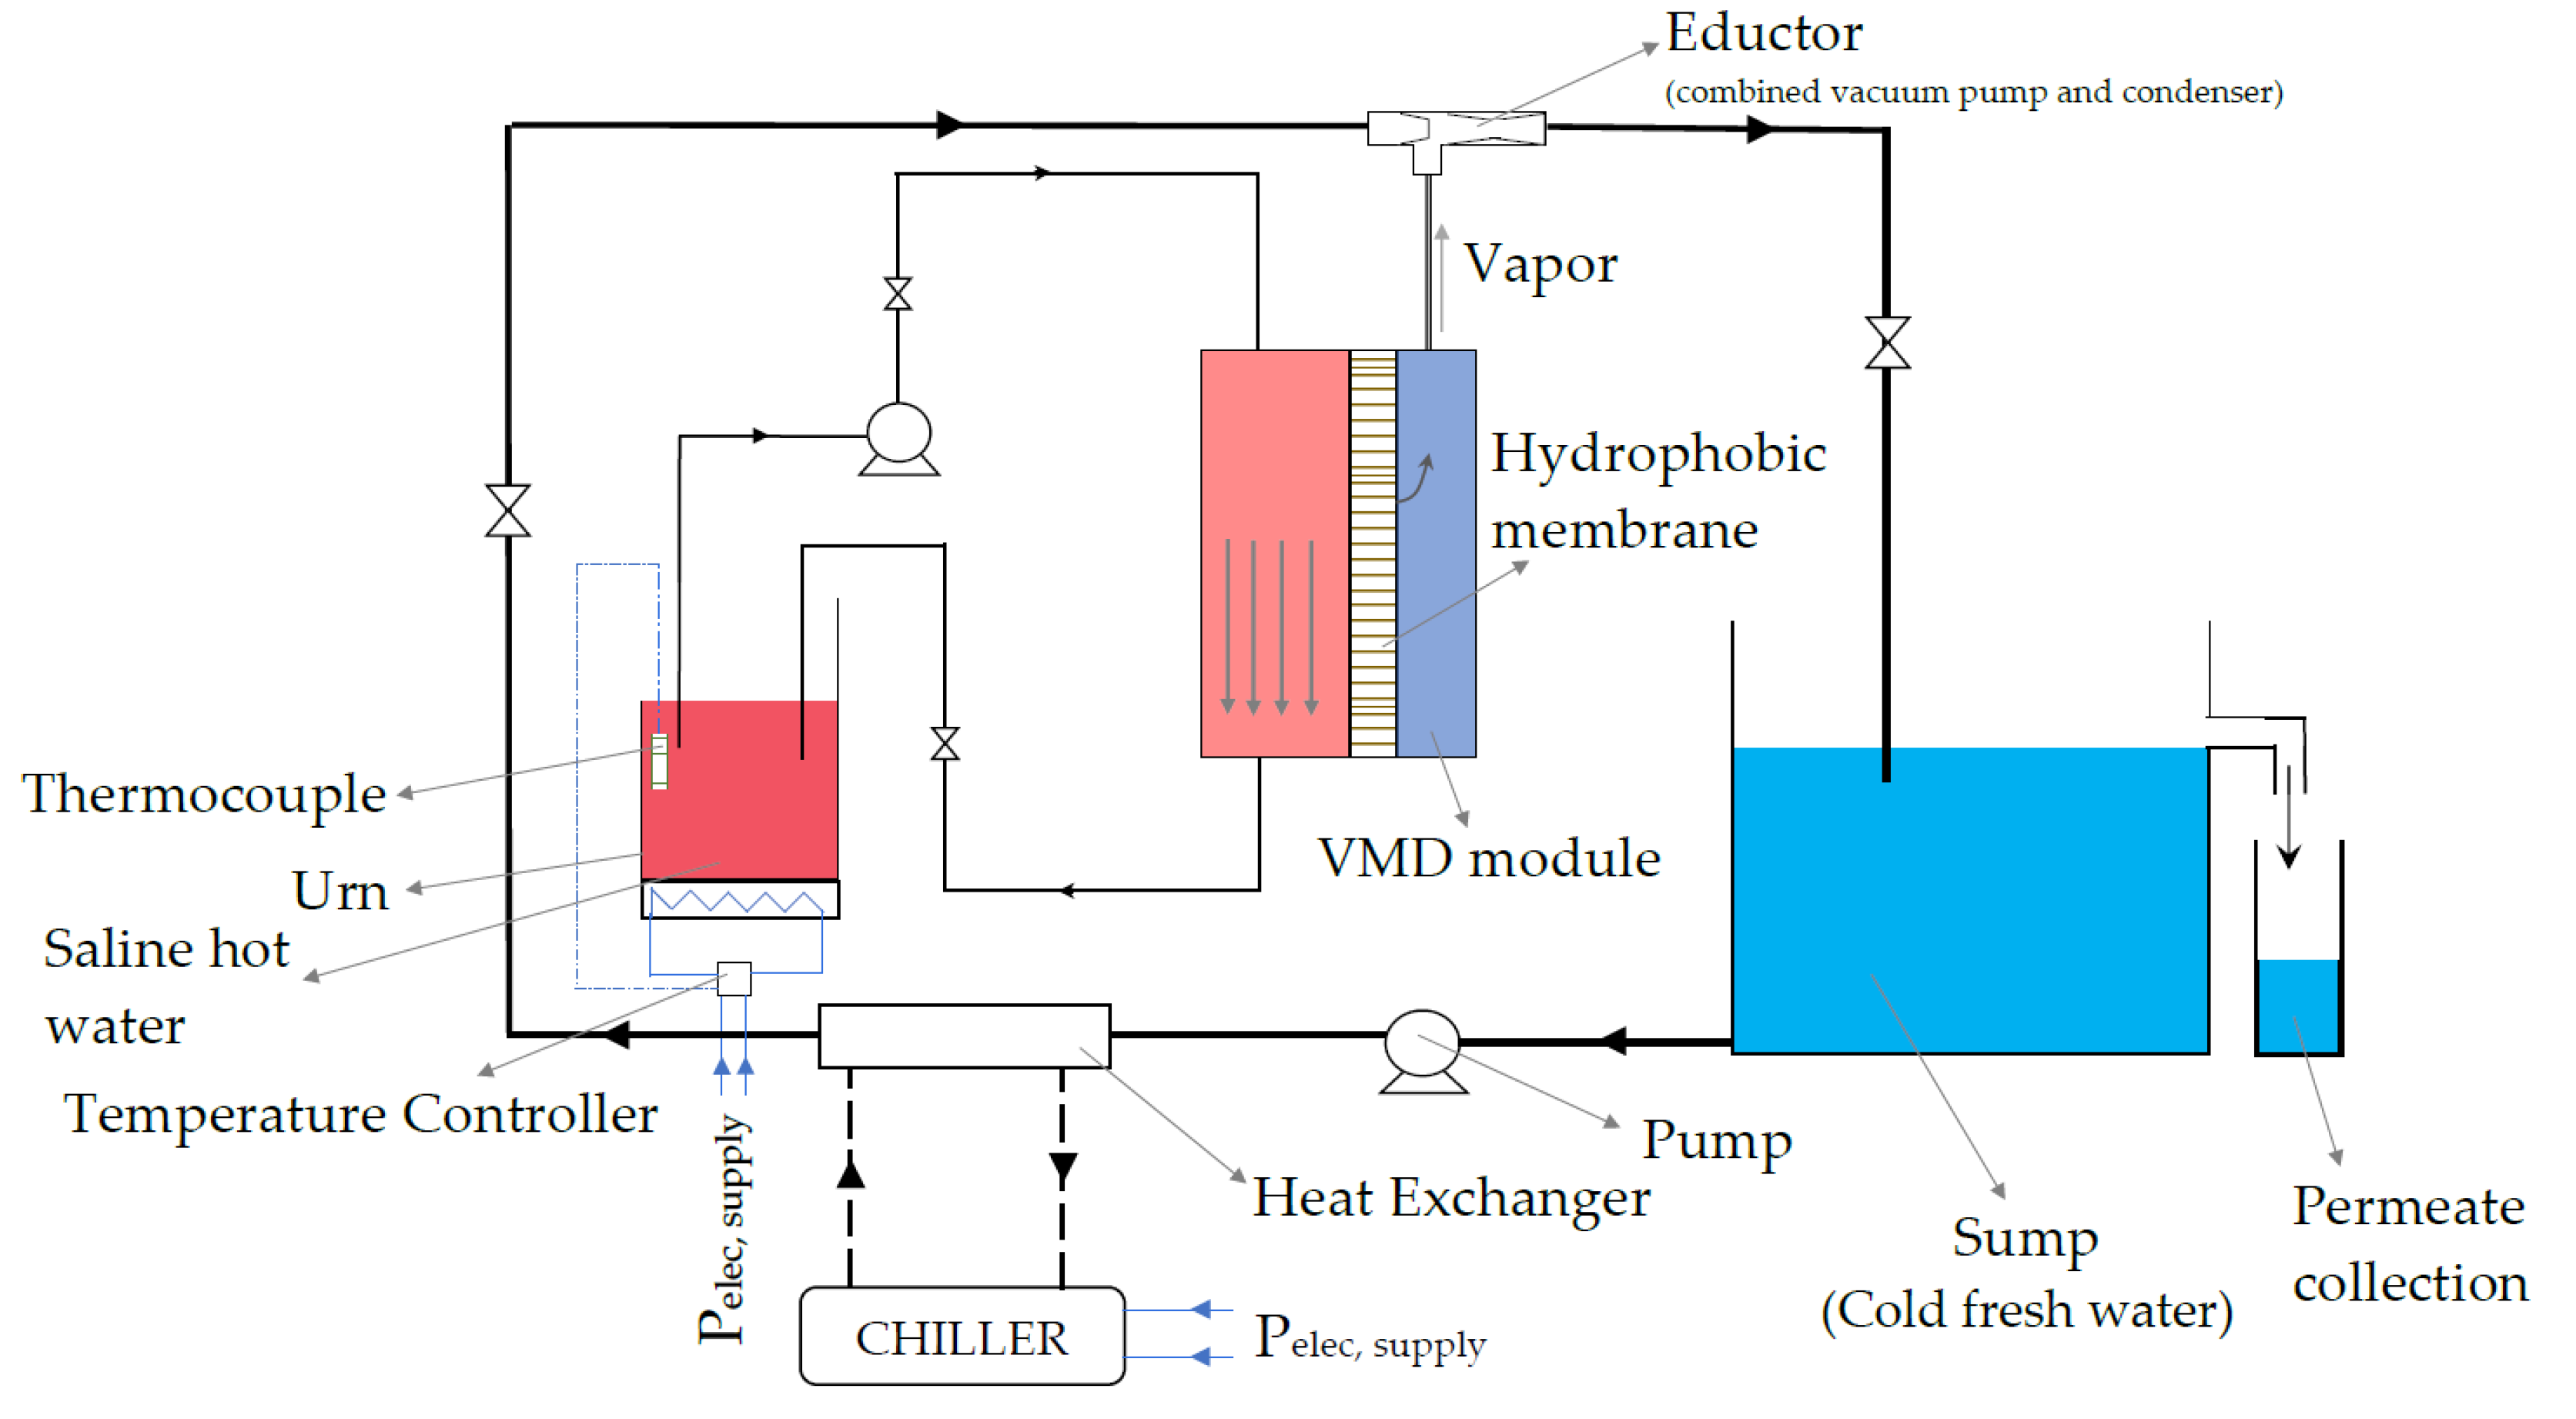
DCMD is the simplest technology among MD configurations and operates due to a partial vapor pressure difference between the feed and permeate side. The DCC of permeate vapor is the most desirable trait in this process. Similarly, in VMD, degassing clears air from the membrane pore and maintains a sufficient pressure gradient for permeate transport. Considering the drawbacks of comparatively higher specific energy consumption and lower flux in DCMD, and the complex and bulky design in VMD, a modified VMD has been proposed, as shown in Figure 4. This schematic can be taken as a reference for developing an eductor-based water desalination unit. The setup consists of a membrane module (specifications shown in Table 3) and a commercial eductor. The saline water is recirculated in the feed side from an electric urn (simulating a generalized heat source). The permeate side of the module is a vacuum chamber, connected to the suction port of an eductor. The second freshwater loop entrains permeate vapor into the water stream, where it condenses through direct contact with the circulating liquid. The condensed permeate is then collected in an overflow tank. By incorporating the benefit of a permeate vacuum chamber and DCC, a very simple and compact water desalination unit can be developed. This system also enables effective utilization of low temperature feedwater as there is a larger potential of sub-atmospheric vapor generation.

3.2. Experimental Set-Up Description

Figure 5 shows the experimental setup developed in the lab for this performance study. Pressure sensors and thermocouples were installed at different positions on the eductor and membrane module. The inlet, outlet, and suction pressures and temperatures were monitored for the eductor. Similarly, feed in and out flow rates and temperatures were monitored in the membrane module. The concentration of the freshwater loop is constantly monitored to ensure the functional performance of the membrane. A DataTaker DT80 data logger was used for data monitoring and acquisition. The pressures were measured through piezo-resistive transducers, temperatures were measured with k-type thermocouples, and flow rates were measured with an ultrasonic flow meter (for feed inlet) and a vortex flow meter (for the eductor inlet).

4. Results and Discussion

The usability of an eductor for active vapor transfer and condensation in a modified VMD system has been examined in this section. It includes capacity assessment of the eductor along with the flux achieved. In addition, the thermal and electrical energy usage and sensitivity to operational parameters were examined.

4.1. Capacity Assessment of the Eductor

The concept of this membrane distillation system is based on eductor-enhanced sub-atmospheric phase separation. The assessment of the operational limit of the eductor with respect to secondary fluid pressure, Ps, has been considered as the primary factor required to plan for the operational parameters of the final water production unit.
Most of the available literature is focused on the compression of the secondary fluid to an intermediate pressure (motive > intermediate > secondary). In contrast, the ability to attain a given secondary pressure for different combinations of primary and secondary pressures has not been evaluated.
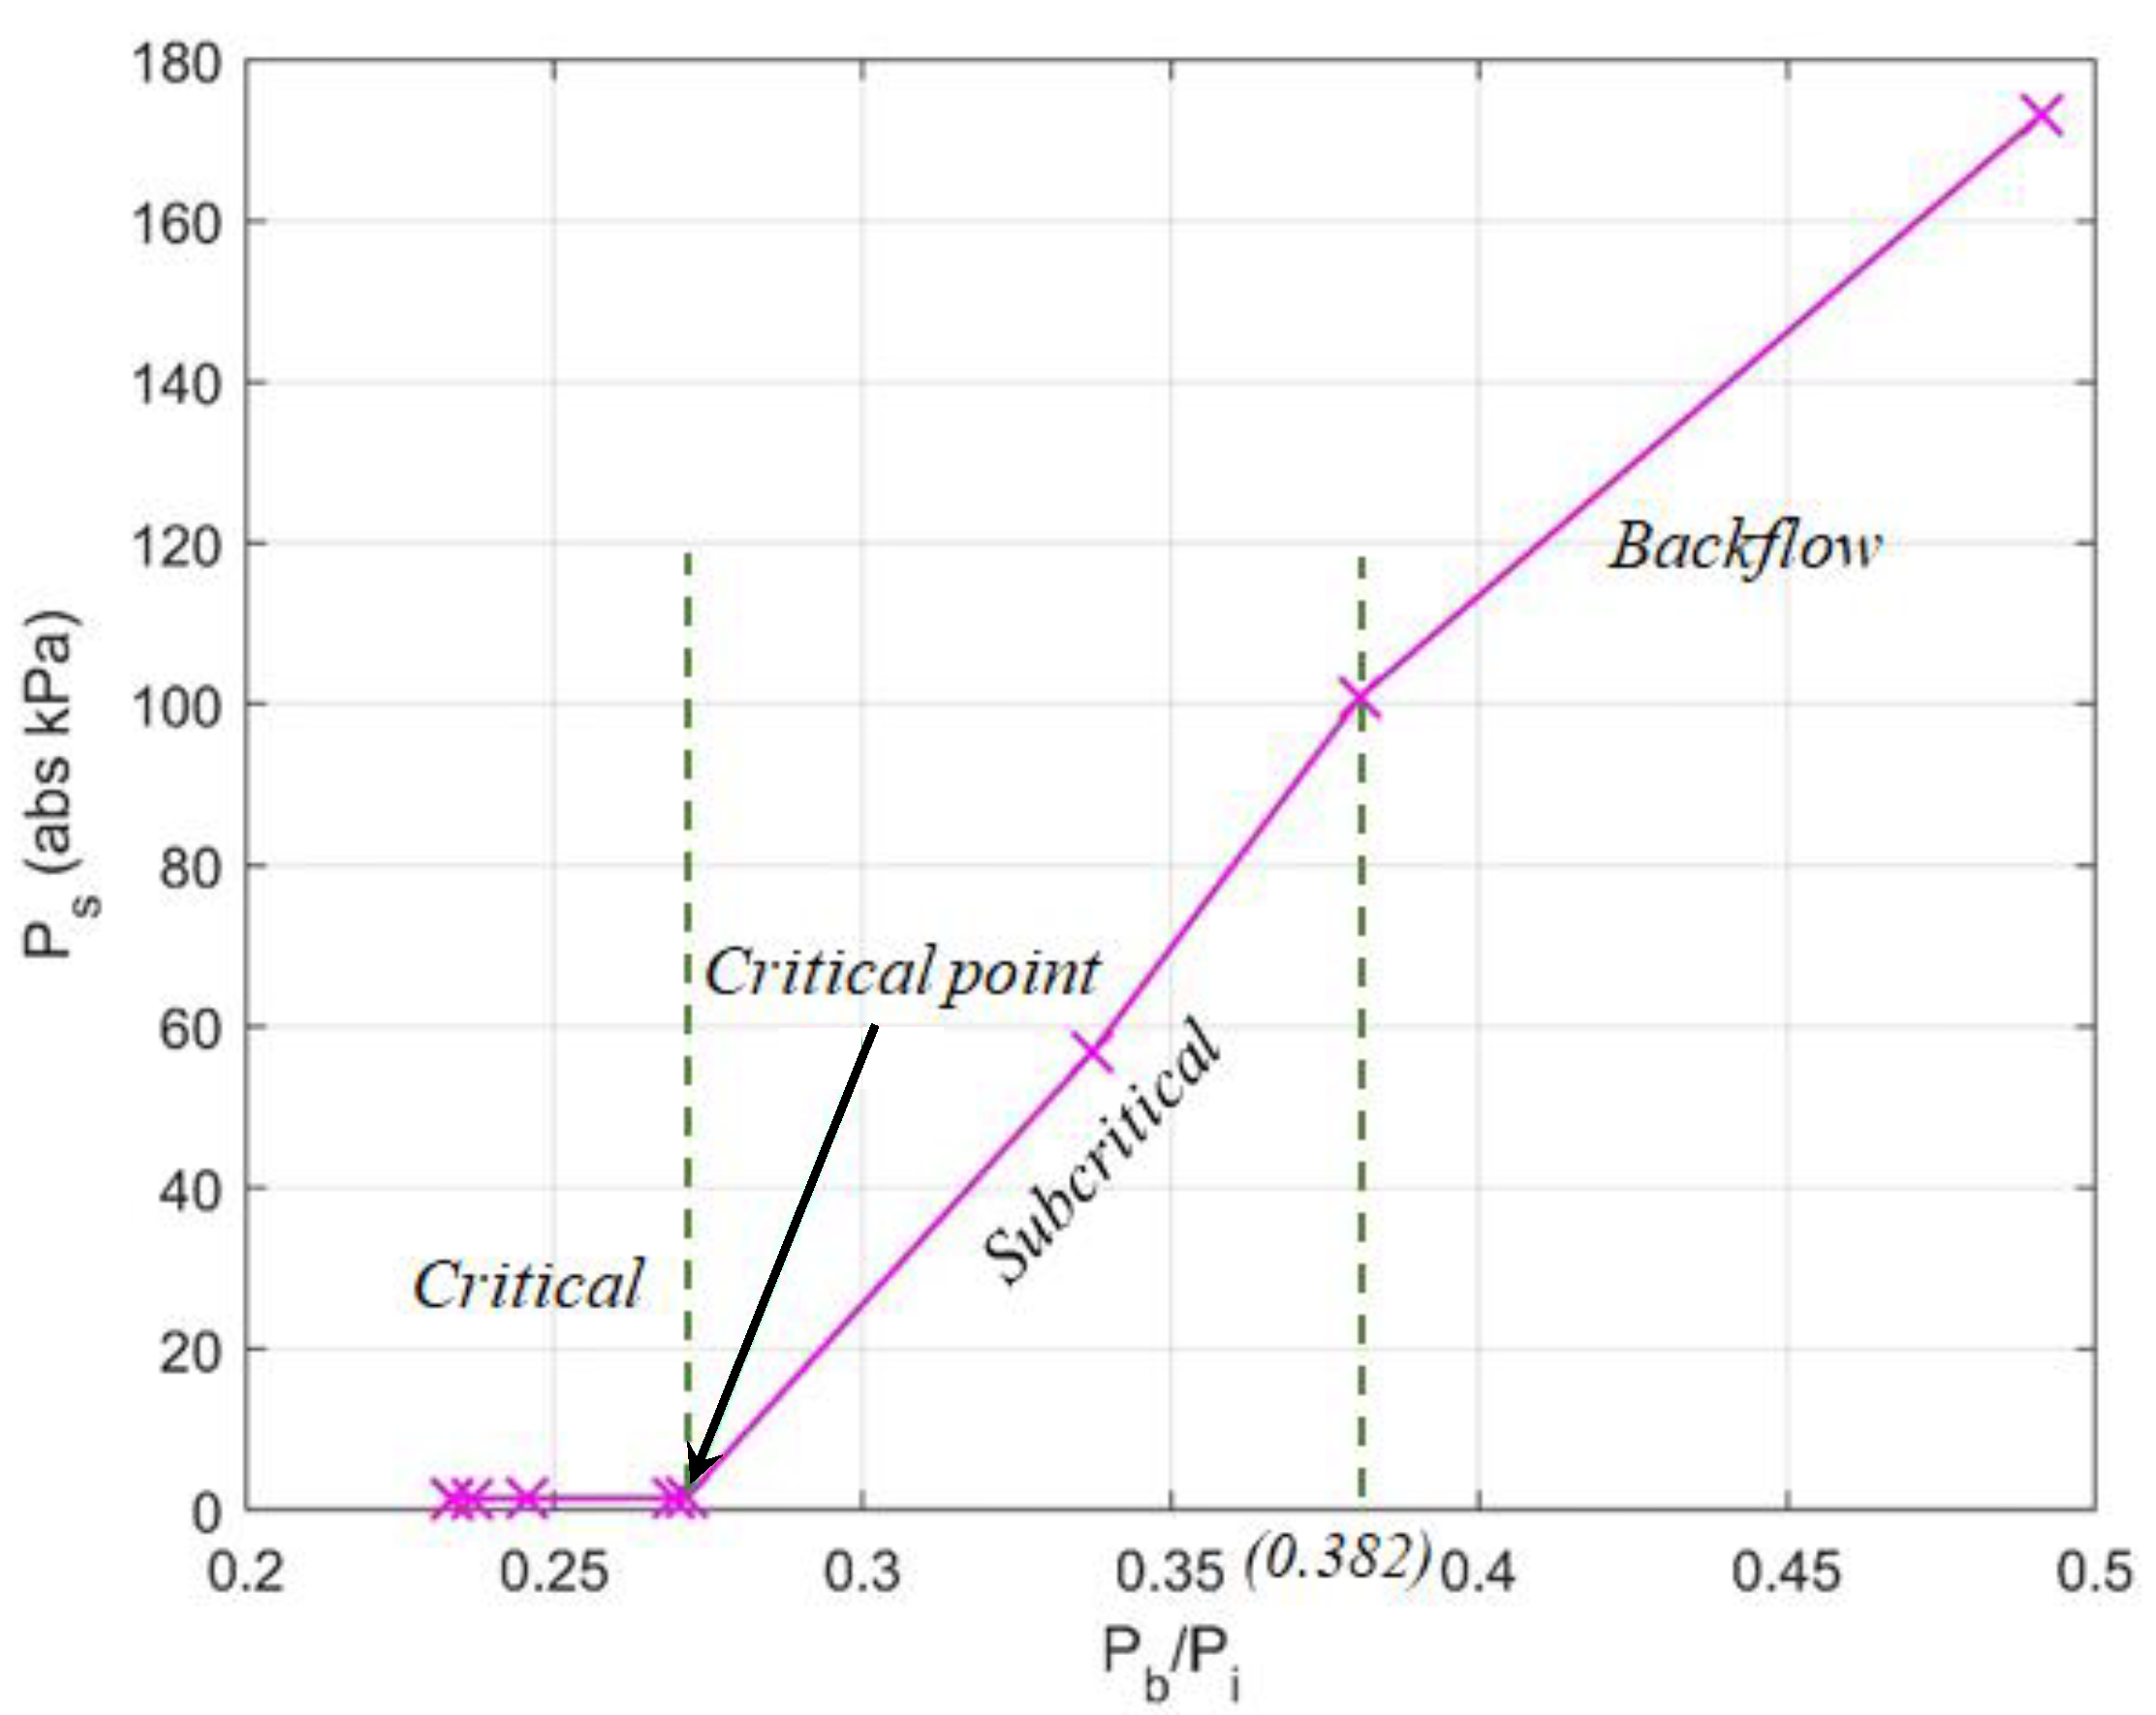
Figure 6 shows the inter-relationship between the motive fluid pressures (inlet, Pi, and outlet, Pb) and secondary fluid pressure (suction, Ps). The measurements were taken at constant inlet pressure and varying outlet pressure (also referred to as back pressure) and maintaining constant volume condition at the inlet to the suction port by closing the valve. Maintaining a constant volume condition at the suction port provided the opportunity to estimate maximum suction pressure at different back pressures (Pb). At the critical point (choked flow), a constant Ps of 3.4 kPa (absolute) was measured for a Pb/Pi ratio of 0.27. Past this critical back pressure to inlet pressure ratio, the vacuum generation capacity of the eductor started to decrease, i.e., absolute pressure at the suction port started to increase. This continued until the Pb/Pi ratio of 0.382, where the pressure at the suction port was observed to rise above the atmospheric pressure, this indicates a flow reversal (back flow) condition where the secondary flow ceases and the motive (primary) fluid enters the suction port. Therefore, it is recommended that the proposed system be operated at sub-critical Pb/Pi ratio to ensure forward flow of the permeate from the feed to the motive fluid direction, and higher efficiency.
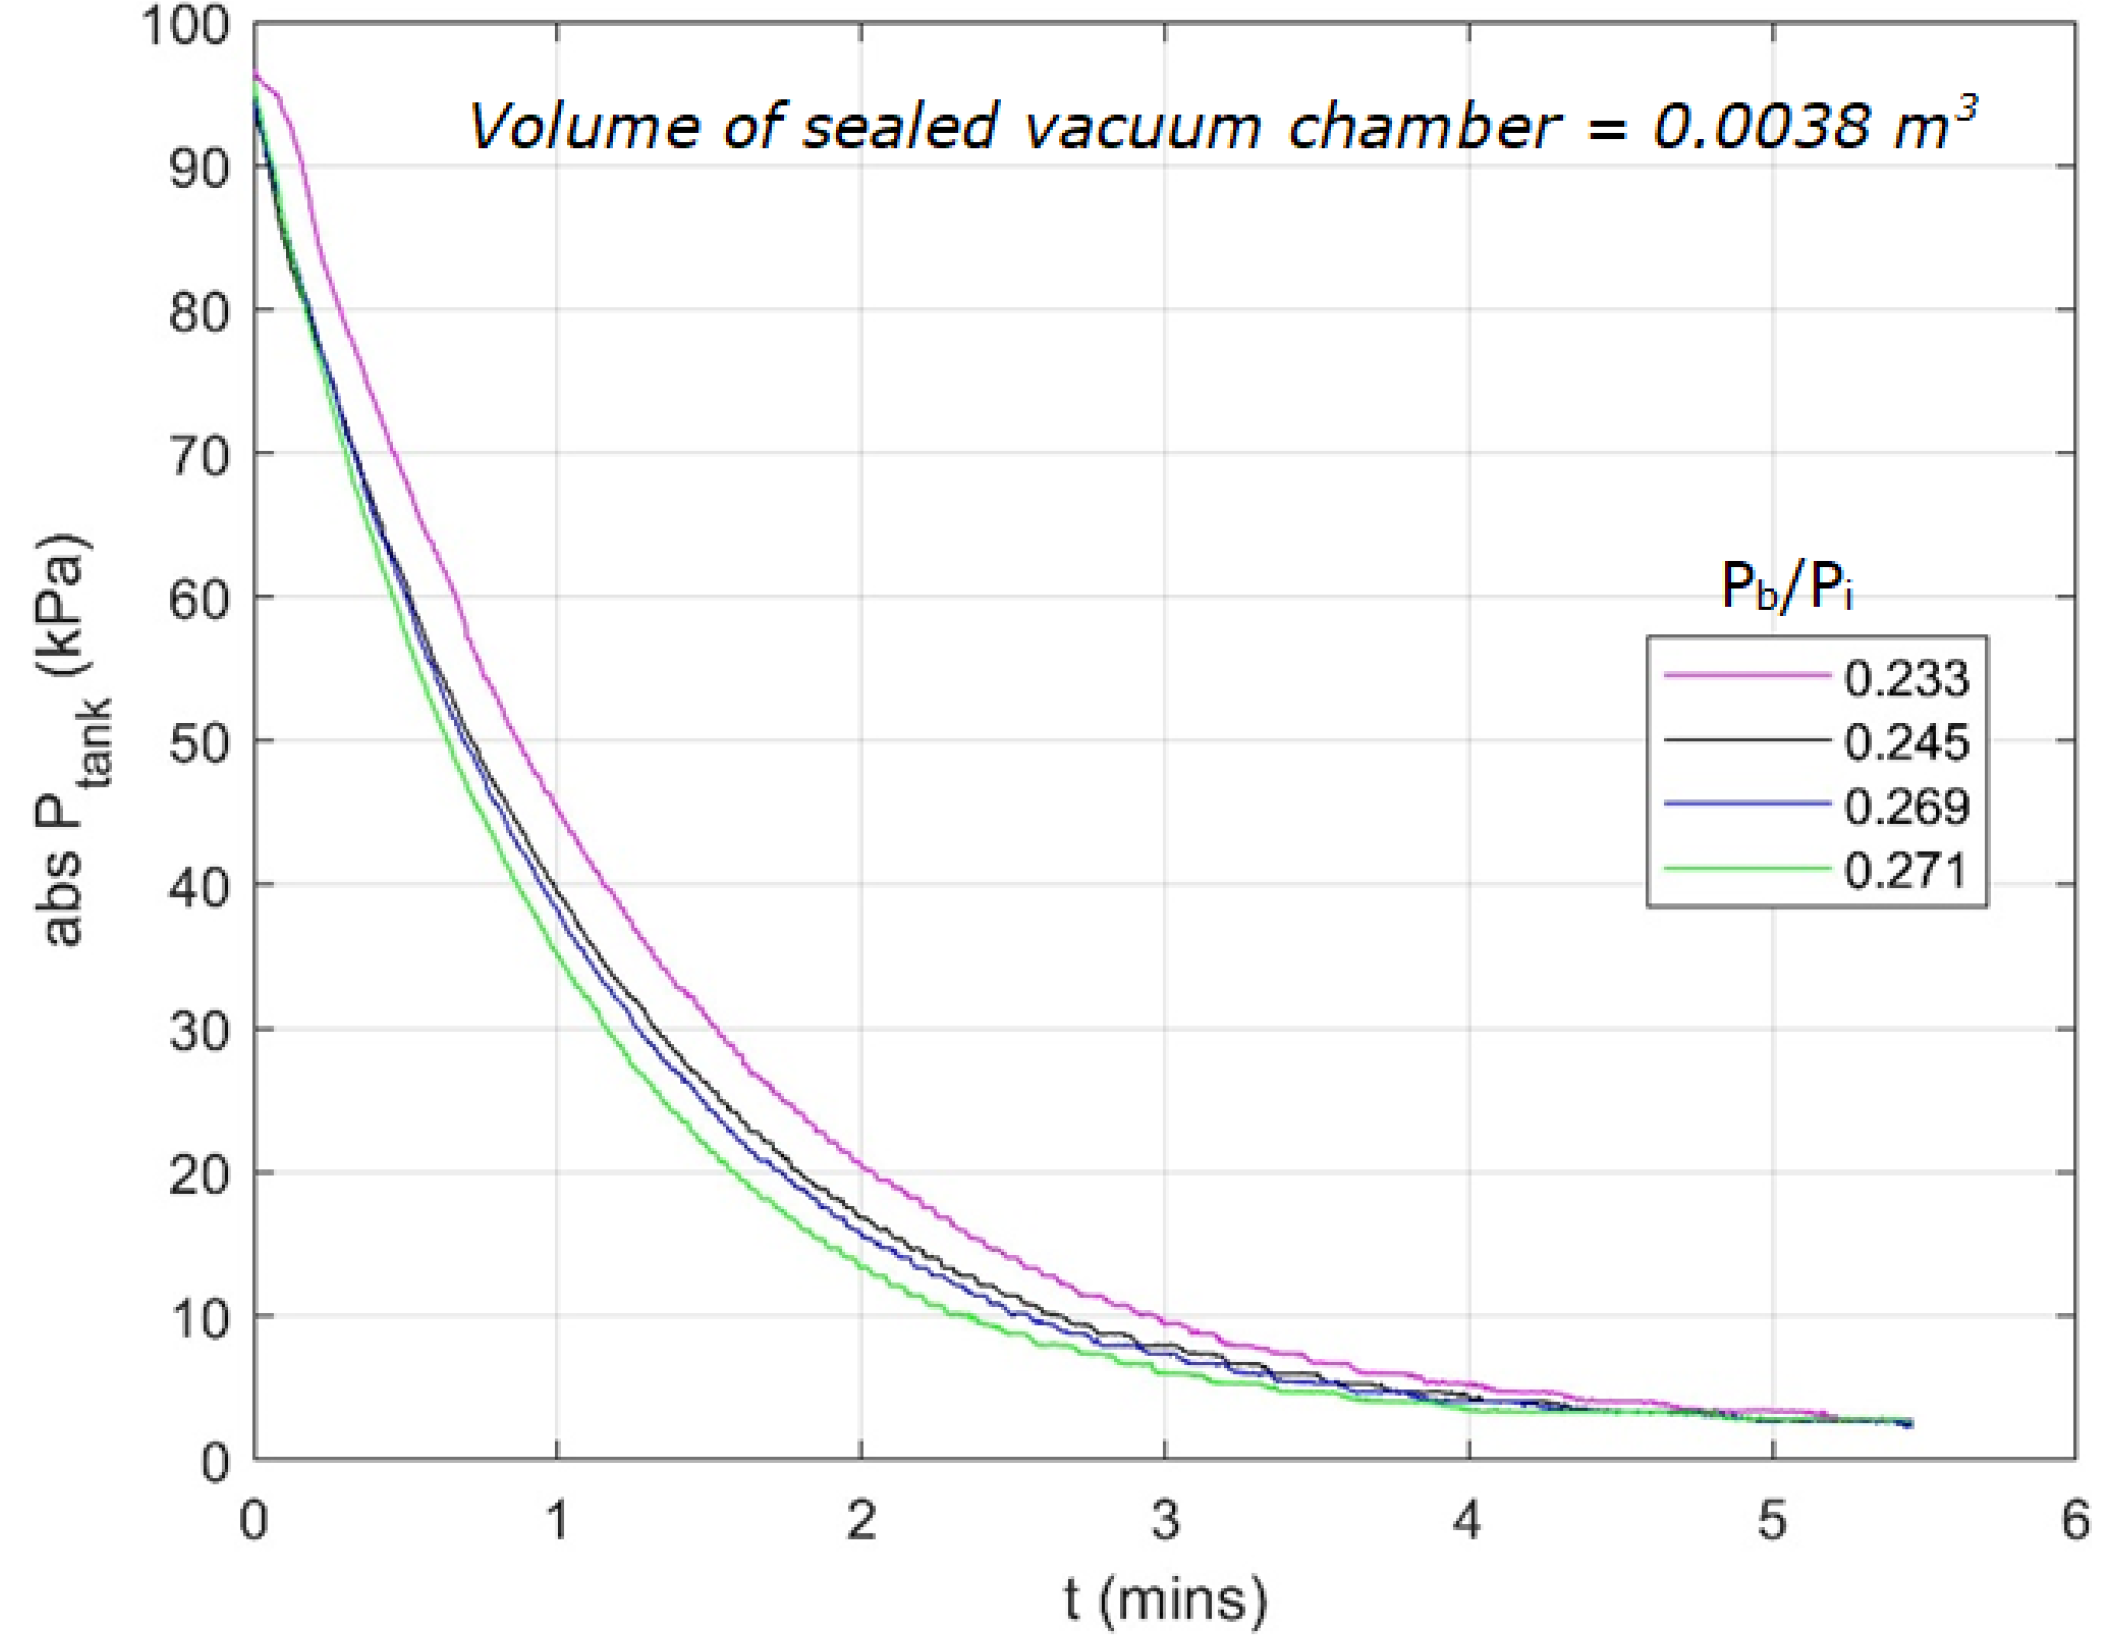
In Figure 7, the plot for degassing duration of a vacuum sealed chamber of volume 0.0038 m3 is shown. This aids the interpretation of the observation in Figure 6, as it provides a more descriptive depiction of the influence of Pb/Pi on the degassing rate. A piezo-resistive pressure transducer was installed in the chamber, which recorded time-dependent pressure data at a frequency of 5 Hz. The inter-relationship between back pressure and forward moving flow contributes to both momentum and thermal energy exchange within the flow path of the eductor. When the back pressure is increased at constant inlet pressure (i.e., increasing Pb/Pi), it obstructs the forward path of two-phase flow. This results in the compression of the secondary fluid until the physical limit, and eventually reduces entraining mass flow rate to cause reverse flow. Figure 6 describes the process during the compression. The average time required for complete degassing i.e., reaching a pressure of 4.2 kPa absolute, is 5.42 min.

4.2. Performance of Desalination Module

4.2.1. Impact of Feed Temperature

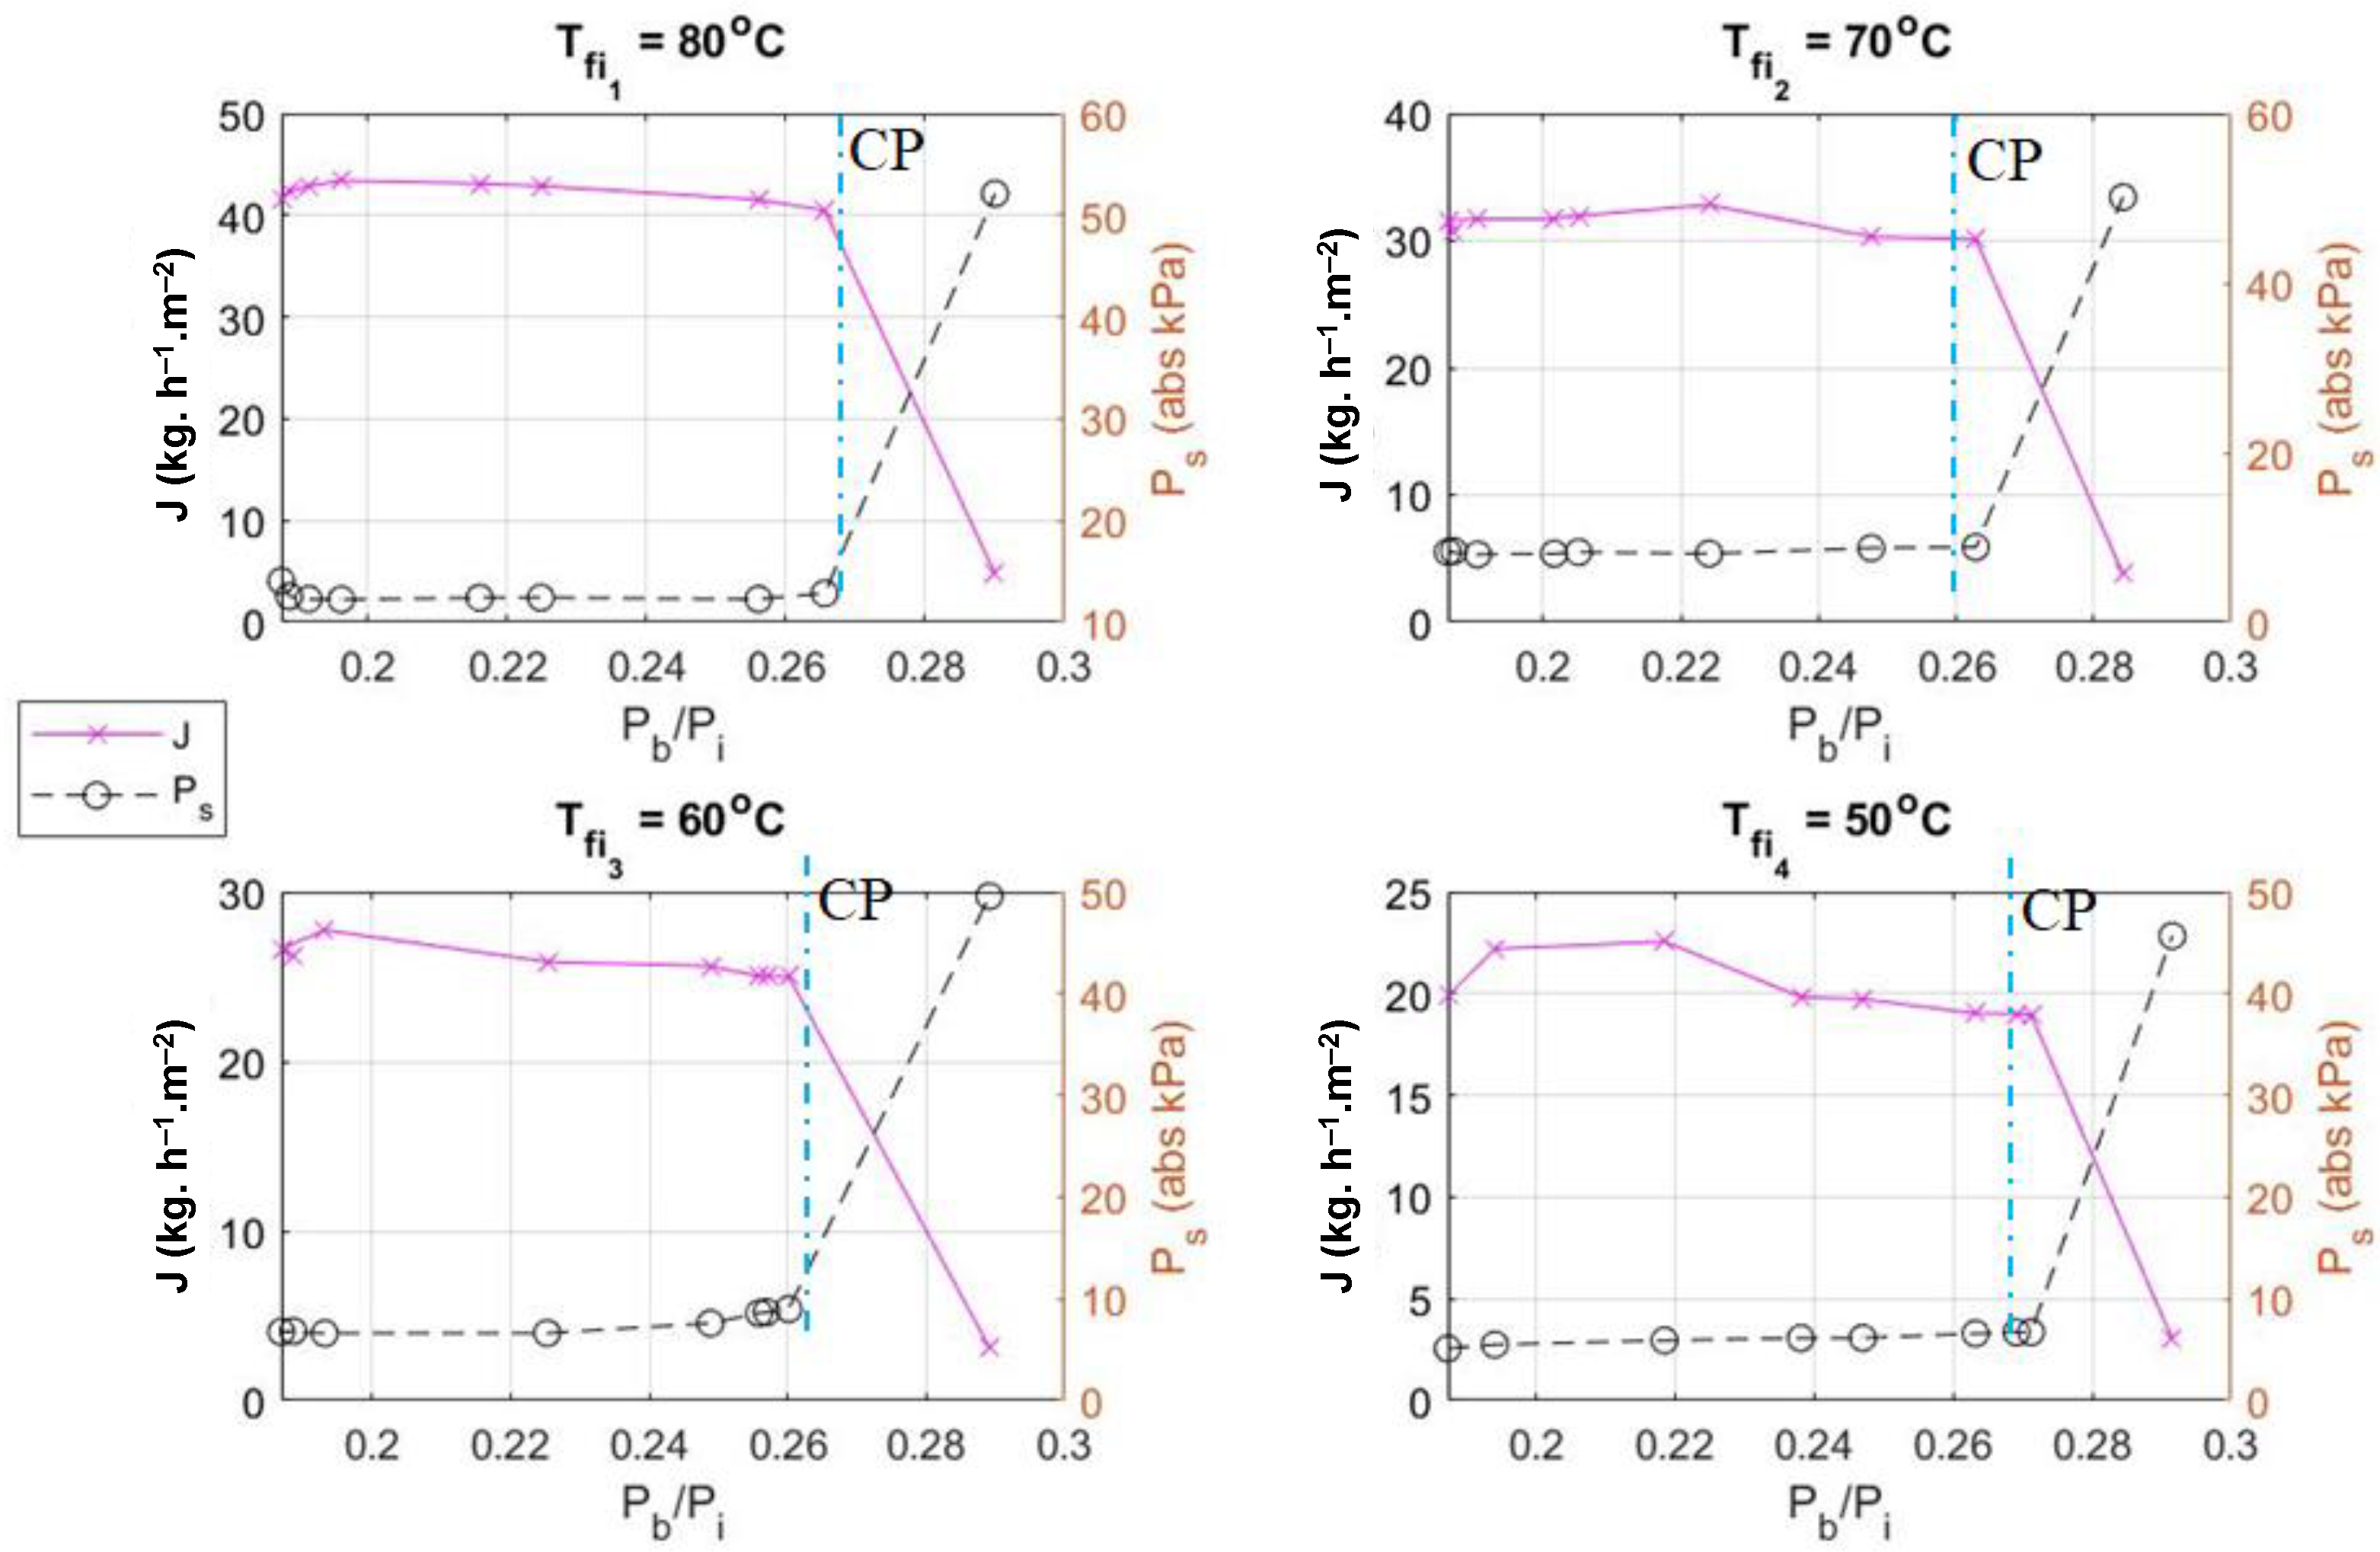
The development and performance analysis of an eductor-based desalination system to replace the conventional vacuum pump and condenser in VMD is the primary focus of this work. Figure 8 shows the performance of the desalination module at four different feed temperatures (Tfi): 50 °C, 60 °C, 70 °C, and 80 °C. The mass flux (J) and instantaneous vacuum pressure (Ps) were plotted against Pb/Pi. The difference in operation before and after the critical point is clearly visible in all four cases, with a larger flux before the critical back pressure is reached and a sudden decline in flux after. The maximum flux for the feed temperatures of 50 °C, 60 °C, 70 °C and 80 °C are 23.1 kg·hr−1·m−2, 27.6 kg·hr−1·m−2, 33.8 kg·hr−1·m−2, and 43.12 kg·hr−1·m−2, respectively.
At higher temperatures, a lower latent heat of vaporization is required, hence the evaporation rate is faster. The sub-atmospheric conditions further aid this by allowing the free expansion of liquid molecules with absorption of energy. In addition to the vapor generation, the mechanical impact (i.e., pressure propelled pumping and degassing of pores) are some of the important associated characteristics. The mechanical work can be clearly observed through the suction pressure measurements in Figure 6 and Figure 8. This gain in the suction pressure is the influence of vapor being drawn into the system. The measurement of absolute suction pressure plotted in the secondary axis shows small variations while remaining at extreme sub-atmospheric conditions before the critical point, and a significant rise in the pressure after it. The characteristic of the eductor allows it to operate in only certain design conditions. The critical point and back flow condition depend on the design criterion considered. Increasing the back pressure beyond the critical Pb/Pi ratio results in a rapid increase in the total pressure in the suction chamber. This is due to a decrease in the velocity of the motive fluid and hence the dynamic pressure of the motive fluid in the suction chamber. This results in the observed rise in the static pressure in the suction chamber and decreases the trans-membrane pressure that drives the vapor transfer. The average absolute suction pressure at the critical points for the feed temperatures of 50 °C, 60 °C, 70 °C, and 80 °C are 7.32 kPa, 8.71 kPa, 11.52 kPa, and 13.6 kPa, respectively. Considering the utilization of mechanical energy, the region of operation around the critical point is more efficient.

4.2.2. Impact of Feedwater Flow Rate

The objective of this section is to identify the influence of feedwater flow rate (Qfi) on freshwater production rate of flux (J). This relationship is shown in Figure 9. The plot is for two different feed temperatures, 70 °C and 80 °C. The observations were noted for flow rates ranging from 1 LPM to 5.2 LPM. For 80 °C, at 1.1 LPM a flux of 32.5 kg·hr−1·m−2 was observed, which sharply increases to 41.2 kg·hr−1·m−2 for a Qf of 3.18 LPM and then shows only a small variation past this point. Similarly, for the case of 70 °C, for Qf = 1.21 LPM, a flux of 18.1 kg·hr−1·m−2 was noted, which then increased sharply up to 34.5 kg·hr−1·m−2 for Qf = 3.3 LPM, and then showed only minute variations for further increases in Qf. This indicates the presence of an optimum feedwater flow rate, and shows that for operation beyond this rate, not much change in yield can be achieved. The identification of or selection of this point through design will be advantageous from both a thermal and electrical energy usage point of view. The average specific thermal energy consumption (STEC) was estimated to be around 3000 kJ/kg of permeate produced.

4.3. Performance of the Eductor

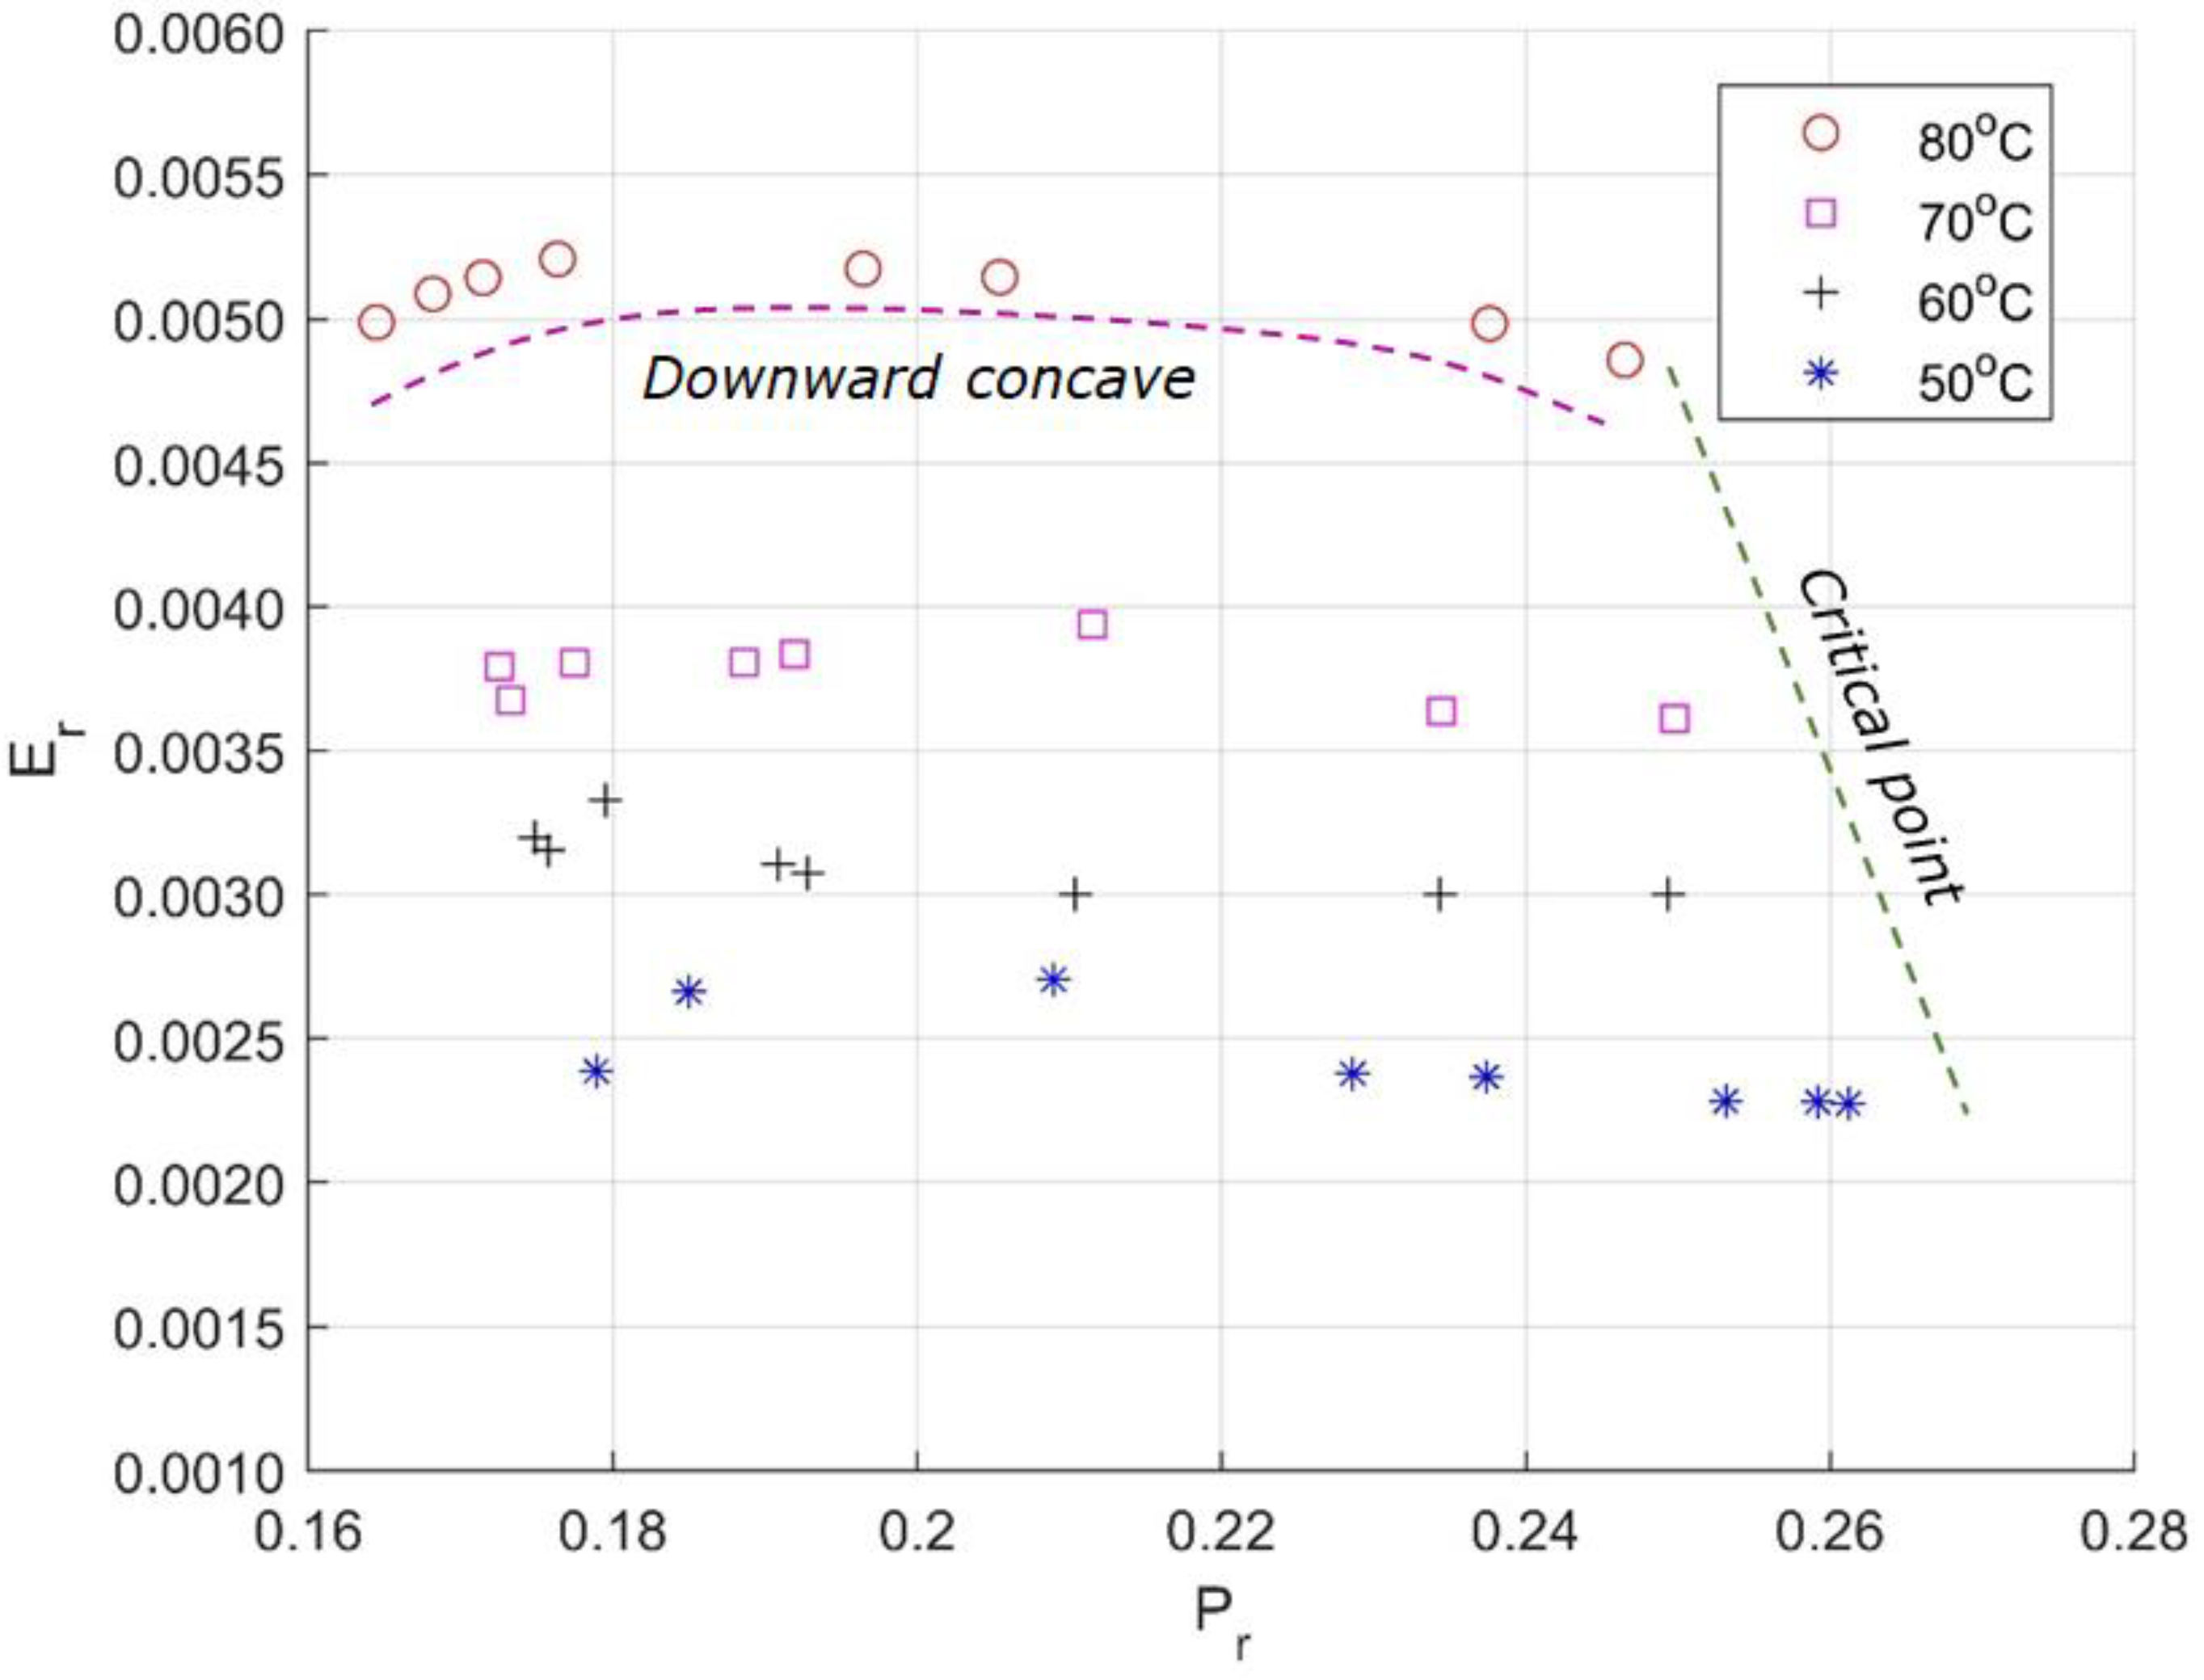
The initial assessment of eductors in Section 4.1 was focused on single-phase and non-condensing two-phase flows. These conditions are applicable during the start-up phase of the desalination module. In Figure 10, a more descriptive and detailed performance evaluation of an eductor for two-phase condensing flow, which includes mutual exchange of momentum, heat, and mass, is shown. The plot is for entrainment ratio (Er) against the pressure ratio (Pr) for different temperatures of feedwater. The collective mechanical and thermal performance of the eductor can be visualized. Although the experiments were performed until reversed flow was observed, the graph only summarizes data for the conditions until critical chocking occurred. The variation in Pr is a result of changes in back pressure, which indicates the compressible nature of the process.
The basic thermodynamic principles of fluid temperature and phase saturation pressure govern the trend of the increasing entrainment ratio with increasing feedwater temperature. At higher feedwater temperatures and constant sub-atmospheric pressure, the mass transfer rate is higher. With a larger proportion of vapor entraining into the flow passage, a larger proportion of momentum is shared with the low-pressure secondary fluid, resulting in earlier critical chocking. Close to the critical conditions, the damping effect of the outlet pressure ensures a greater interaction time between the secondary fluid and the motive fluid, resulting in an increasing rate of condensation. Another noticeable phenomenon can be observed in the process, where with increasing back pressure, the entrainment ratio forms an asymmetric downward concave trend. Shifting of the peak Er to the left side of the critical point is due to the combined thermal and mechanical effects on the vapor liquid interaction.
With larger bubbles collapsing, there is an increase in voids, which are then filled with more incoming vapor bubbles. The maximum Er of 0.0053, 0.0039, 0.0034, and 0.0027 was recorded for 80 °C, 70 °C, 60 °C, and 50 °C, respectively. The critical points for 80 °C, 70 °C, 60 °C, and 50 °C were observed at Pr of 0.244, 0.25, 0.251, and 0.262 respectively.

5. Practicality of Modified Eductor Based VMD (E-MD)

Based on the equations presented in Section 2.2.1, a theoretical study of existing VMD was performed. The model results were compared with the experimental work of Mengual et al. [27] (Figure 11) and they are in good agreement. A comparison with this experimental work has also been done by Kim et al. [28] for their theoretical study. The prime objective of this study is to establish the position of the current eductor-based membrane distillation system from the point of view of freshwater yield.
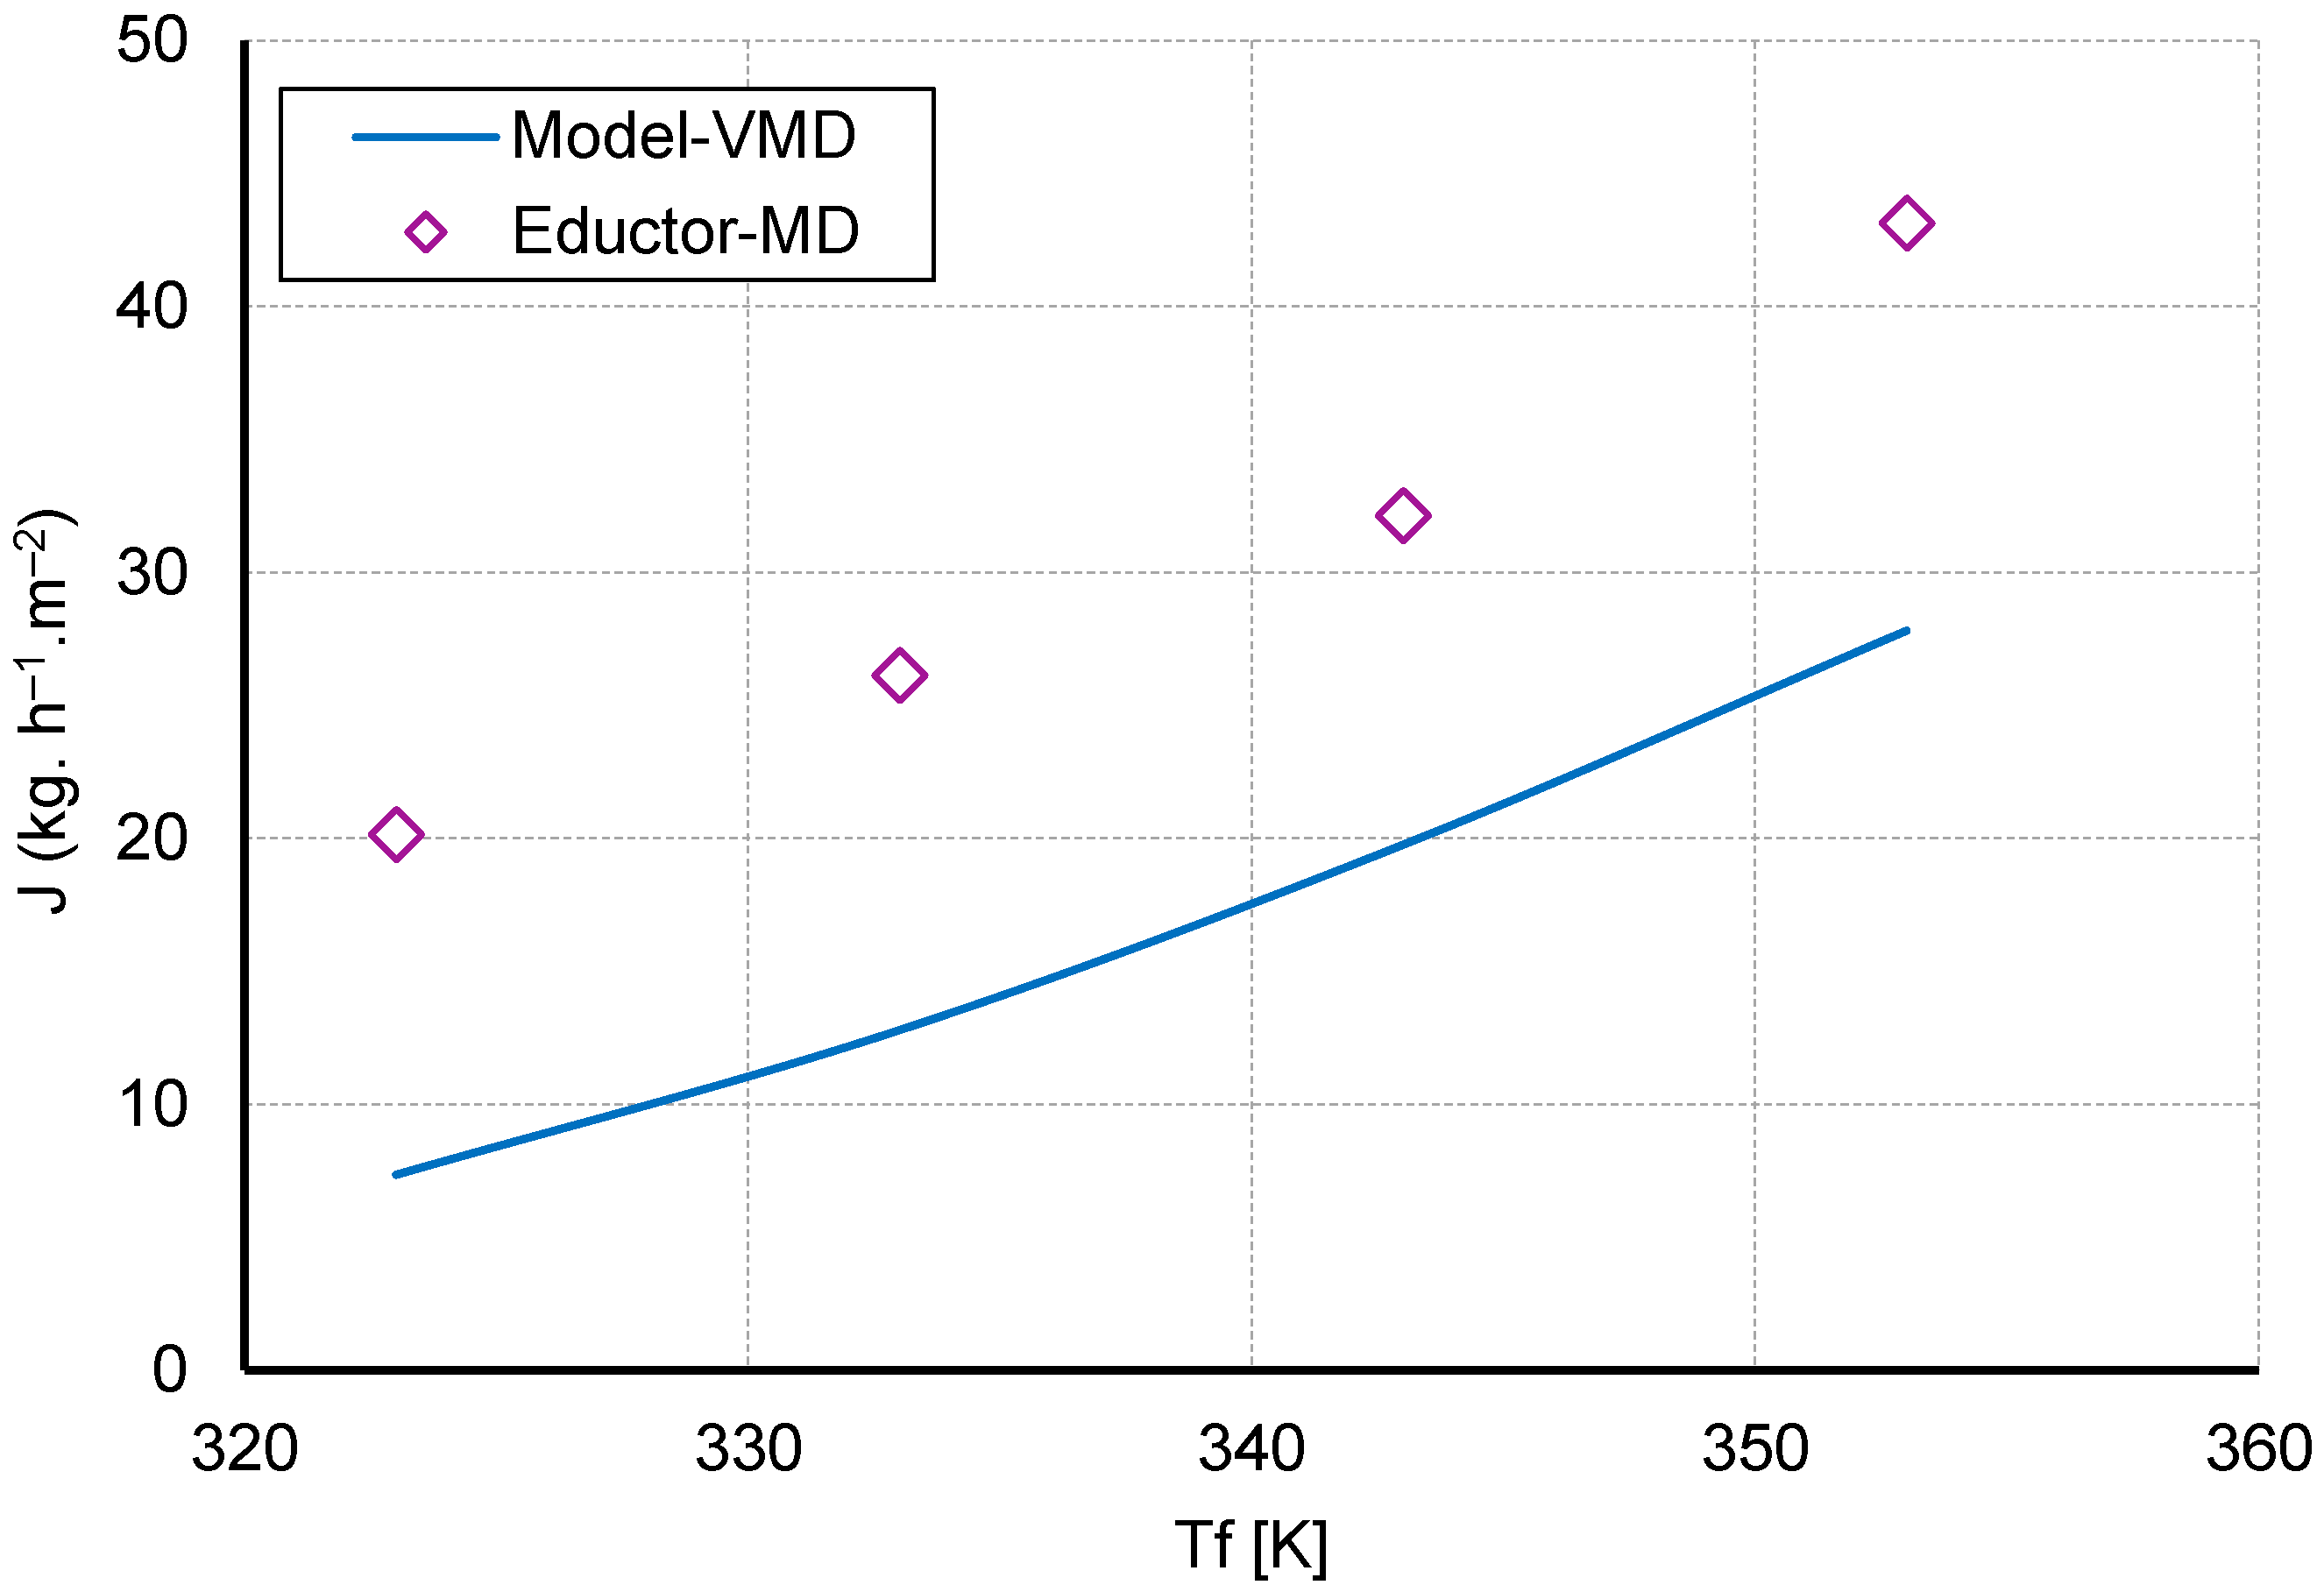
Figure 12 is a comparative study of the flux of the modified eductor-based VMD or E-MD with conventional VMD. The plots for VMD are based on the verified analytical model from Figure 11. The values for E-MD are selected from the maximum experimental flux at each of the recorded feedwater temperatures. The proposed eductor-based membrane distillation system, which is basically a modified VMD system, was found to have better performance compared to the model for VMD. For the feed temperature of 80 °C, the maximum flux measured experimentally was 43.1 kg·m−2·hr−1 while for the theoretical VMD model it was 27.83 kg·m−2·hr−1. In comparison to conventional VMD (indirect condensation), the direct contact condensation in modified VMD or E-MD is clearly more effective [29], as there is no thermal resistance at the interface like there is in a traditional condenser. This simultaneous thermal and mechanical activity of the cooling fluid in E-MD enhances the performance of the system compared to standard VMD. Although it does not use a vacuum pump, the energy consumption is relatively high compared to other technologies because of the amount of energy required for mechanical operation in the eductor.
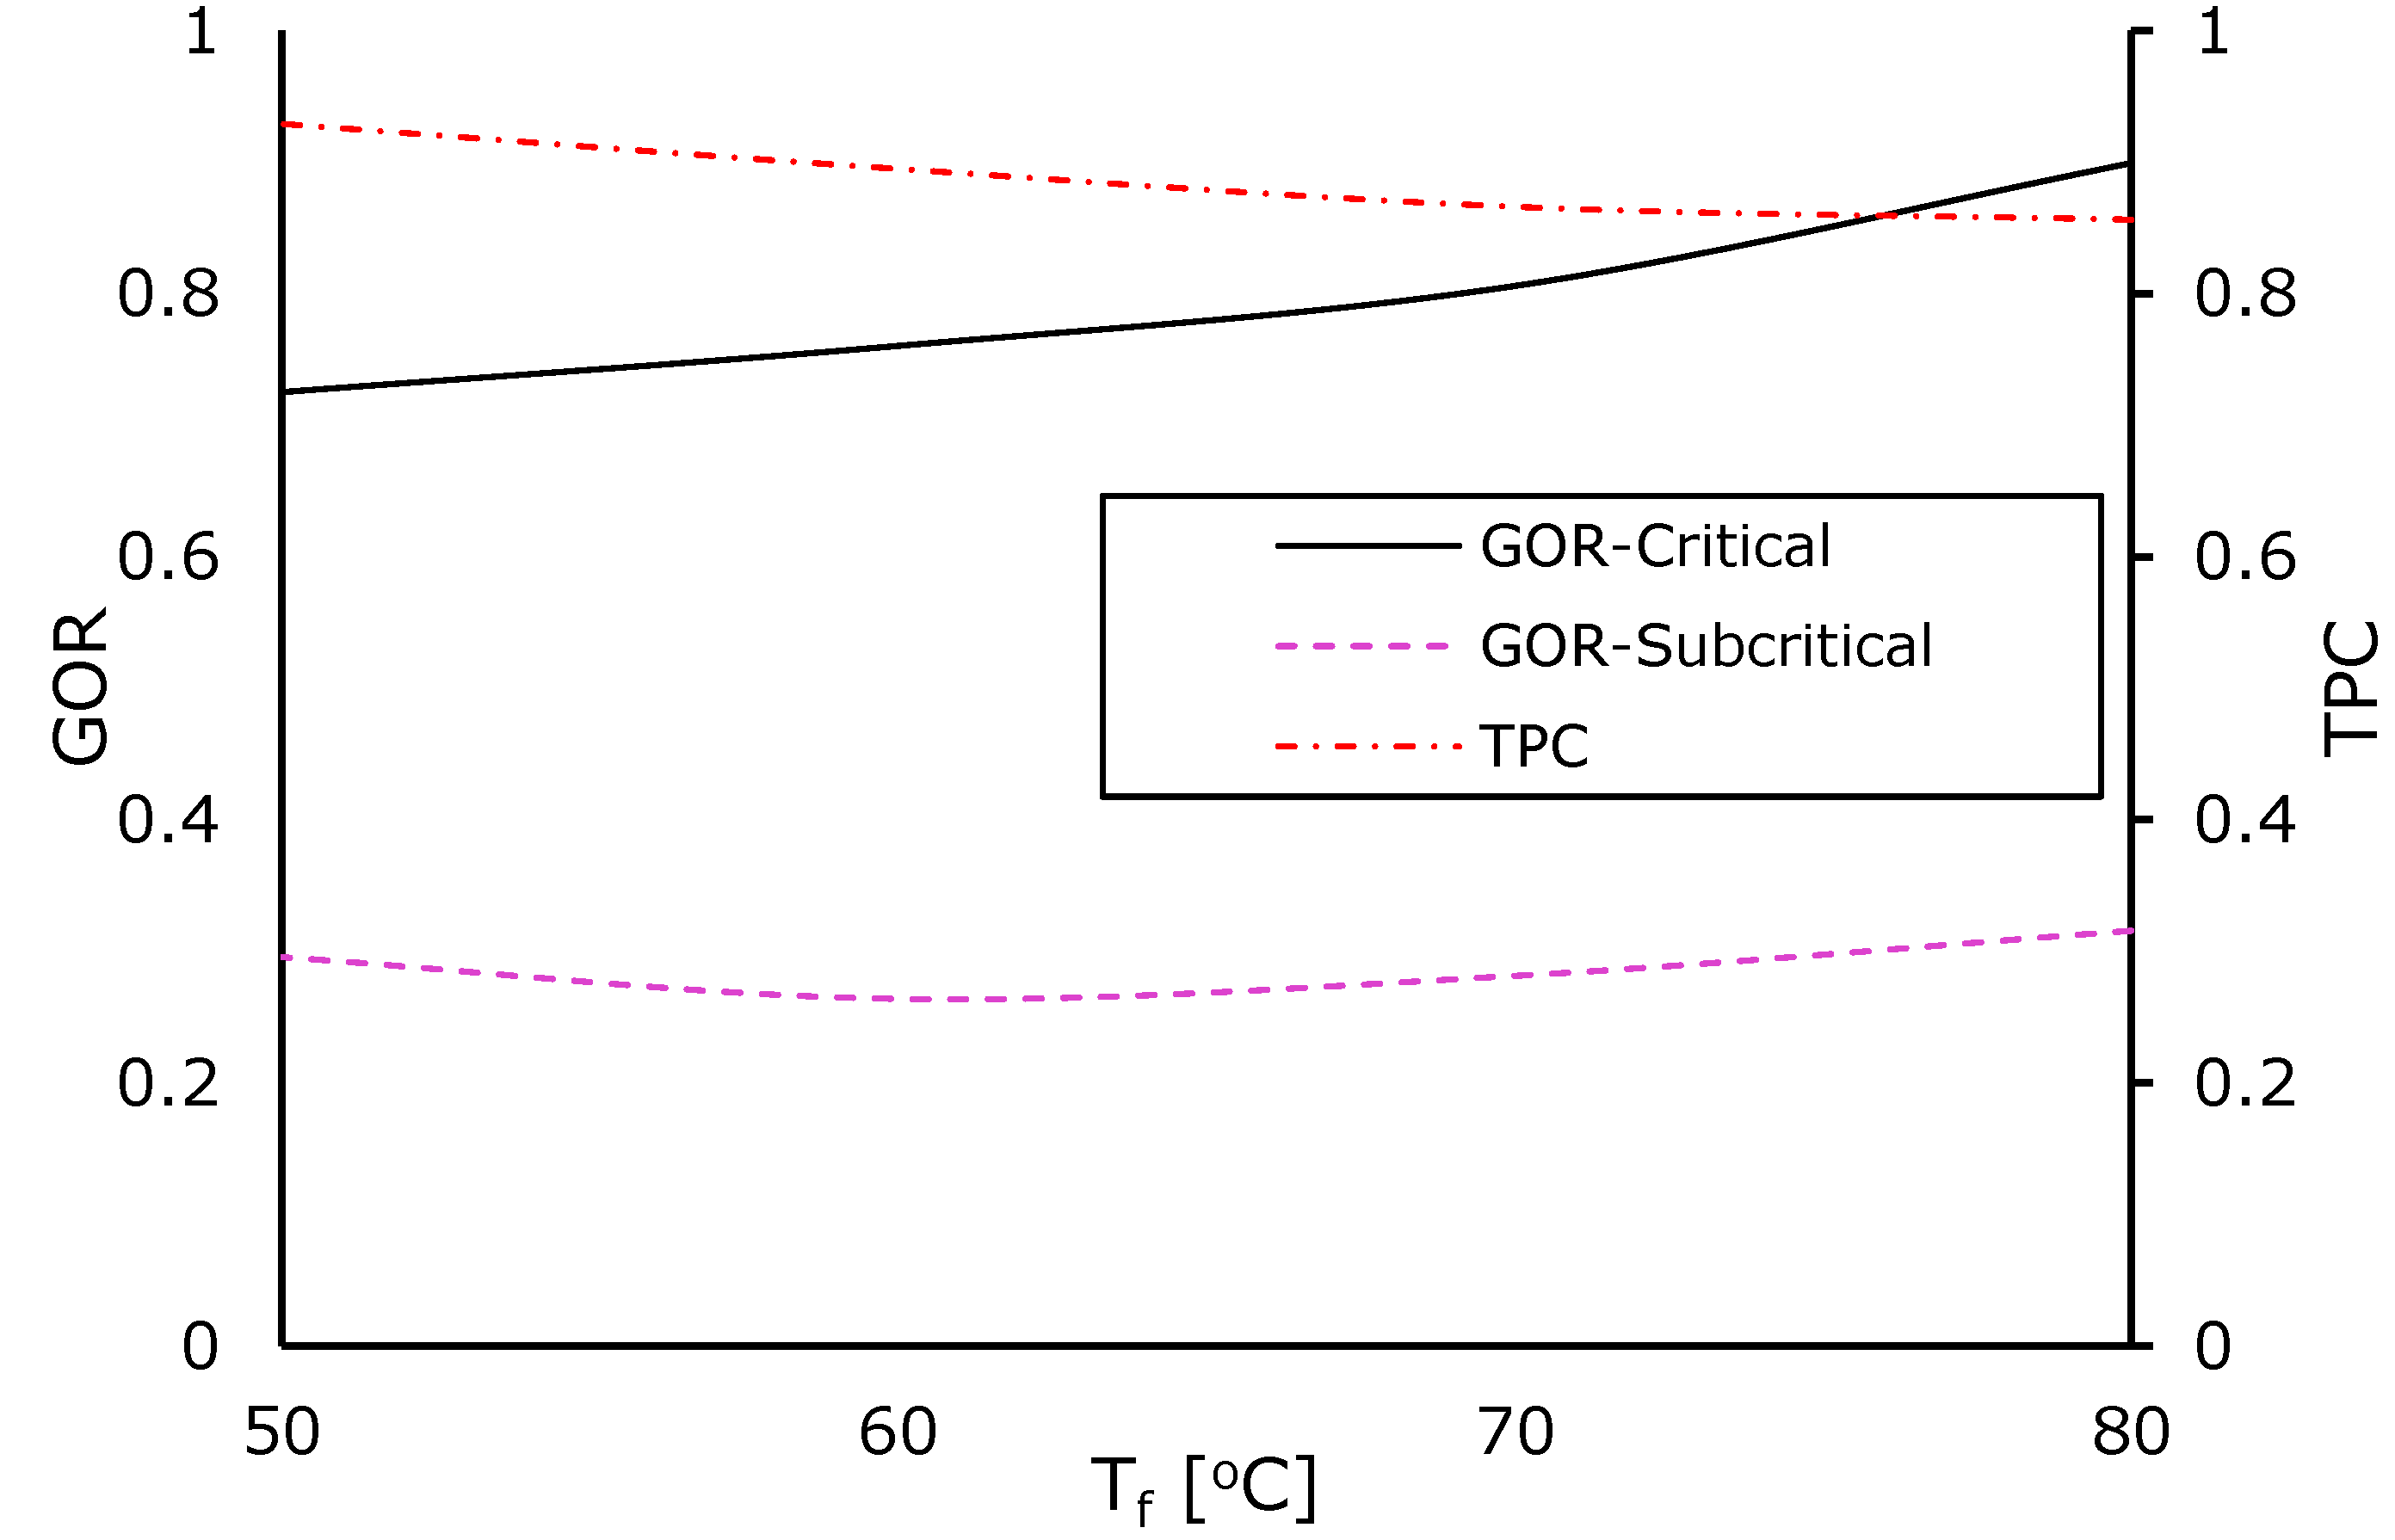
Figure 13 is the plot for gain output ratio (GOR) with respect to feedwater temperature (Tf). The GOR-Critical is based on the average value of flux at the critical point, and GOR-subcritical is based on the flux after the critical point. The value of GOR-Critical ranges from 0.72 to 0.87 while the value of GOR-Subcritical ranges from 0.29 to 0.31. Increasing feedwater temperature has a positive influence on the value of GOR. The value of the temperature polarization coefficient (TPC) was calculated based on the iterative process for calculating membrane surface temperature in Equations (17)–(20). The TPC was calculated to be 0.92 for 50 °C and 0.85 for 80 °C. The value of TPC decreases with increasing Tf.

6. Sensitivity Analysis

The use of instrumentation and control systems ensured consistent data acquisition in the experimental system. The physical parameters, such as temperature, flow rate, and pressure, were monitored using appropriate sensors. Some other influencing parameters were also monitored but were tedious to control. These parameters were identified during the experiments and were observed for the purpose of sensitivity analysis. Basically, the temperature of eductor inlet, and rising concentration in the feedwater side are the two factors that have been discussed here.
During the mass transfer from vapor to liquid streams, the latent heat in the vapor is absorbed by motive fluid (water), the mixing that occurs as a result of turbulent flow is assumed to maintain thermal equilibrium in the motive fluid stream. The thermal energy interaction between the vapor and motive fluid stream increases the temperature of the motive fluid at the eductor outlet. If not controlled, this rise in temperature continues. The increase in Tei reduces the mass transfer rate, and hence allows accumulation of vapor in the suction track, which reduces the Pr due to the increase in Ps. The experiment was conducted for about 60 min without active cooling of the motive fluid. During this experiment, Tei increased from 27.6 °C to 42.1 °C. As a result, the value of Pr decreased from 0.17 to 0.162. This significantly reduced both the mechanical and thermal performance of the eductor. This experiment was conducted for Tfi = 80 °C, with the chiller turned off, and all other conditions were as per the description in Table 4. For a multiphase same-species heat transfer device like an eductor, the motive fluid temperature is an important influencing parameter that needs to be considered. In addition, the design temperature needs to be set to an easily achievable value from a work input perspective.
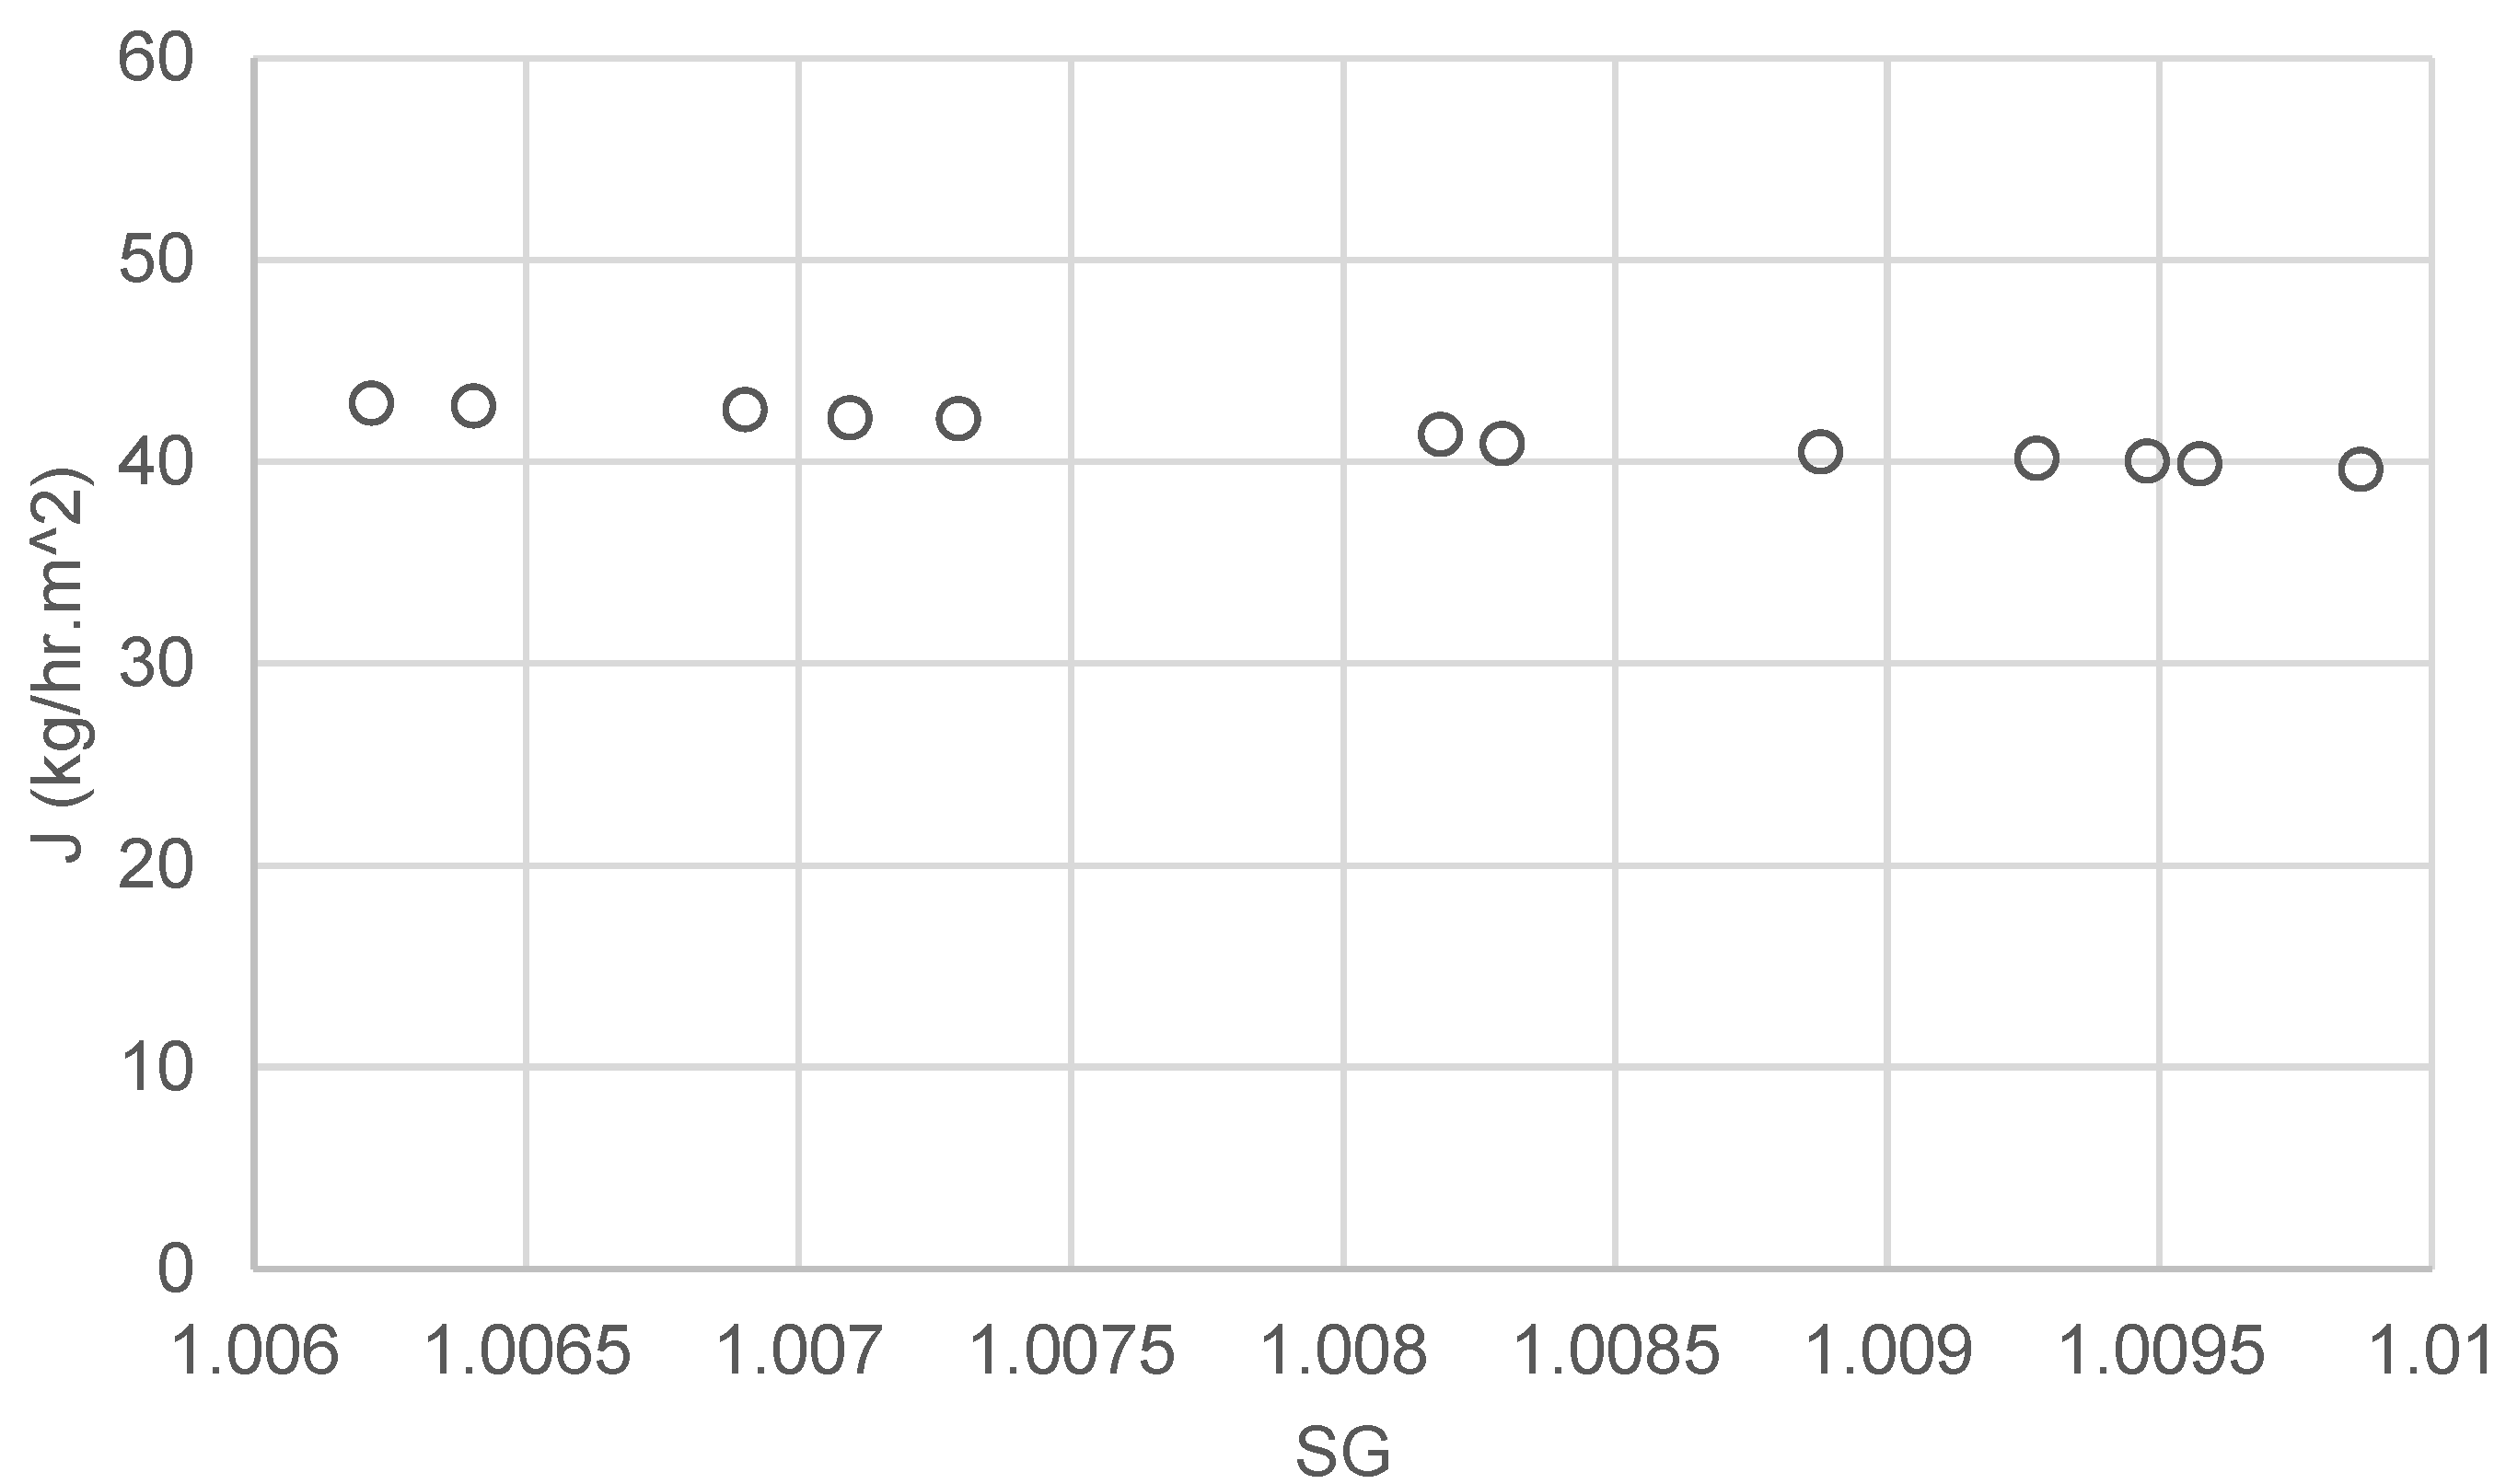
The effect of the rise in salinity on the permeate mass flux was also observed for the salinity range of approximately 0.5% to 1% (i.e., SG of around 1.005 to 1.01). The specific gravity (SG) and flux (J) were constantly monitored during the experiment. Figure 14 is the resulting plot for J with respect to SG. The variation in J was observed to be from 39.5 kg·h−1·m−2 to 42 kg.h−1·m−2. The average experimental uncertainty of all the experiments results was around ±5.4%. The variation in the flux over the SG range of 1.005 to 1.01 was within the uncertainty and it could be said that at these low salinities, the effect of the concentration was negligible on the flux.

7. Conclusions

This study was focused on developing a system using an eductor as an alternative device for active vapor transfer and condensation in a membrane distillation process. The primary activity involved a performance study of an eductor-based membrane distillation process. The proposed system incorporates the advantages of both DCMD and VMD to provide enhanced performance. A flux (J) of up to 42.9 kg·h−1·m−2 was calculated, which is significantly higher than conventional VMD under similar operating conditions. The value of J is dependent on Qf, hence the optimum value is to be selected to ensure the highest energy efficiency. The operation of the eductor is segregated into critical and sub-critical regions separated by a critical point. It is always recommended to operate the eductor at the critical point.
The replacement of both the vacuum pump and condenser in VMD with an eductor will present a simple and compact technology. With no moving parts and a mechanically simple system, the adaptability and maintainability become more convenient. The E-MD system has been shown to be sensitive to motive fluid temperature in the eductor.
In summary, a simple and compact eductor-based MD system has been developed. This technology is simple, compact, and produces a greater freshwater flux compared to standard MD systems. The implementation of this technology in off-grid desalination systems will help to reduce the existing footprint of such systems. In addition, the eductor has been practically verified to be an active vapor transfer, degassing, and condensing unit. Further extending the understanding of two-phase single species flow in eductors would help in creating a simple and compact desalination system.

Author Contributions

Conceptualization, R.K. and A.D.; data curation, R.K.; formal analysis, R.K.; investigation, R.K.; methodology, R.K., A.D. and K.I.; writing—original draft, R.K.; supervision, A.D. and K.I.; writing—review and editing, R.K., Q.L.V., E.R., A.D. and K.I. All authors have read and agreed to the published version of the manuscript.

Funding

This research received no external funding.

Institutional Review Board Statement

Not applicable.

Informed Consent Statement

Not applicable.

Data Availability Statement

The data is an experimental outcome and has been stored with the first author. Data will be made available on request by sending email to [email protected].

Acknowledgments

Not applicable.

Conflicts of Interest

The authors declare no conflict of interest.

References

  1. Boretti, A.; Rosa, L. Reassessing the projections of the World Water Development Report. NPJ Clean Water 2019, 1–6. [Google Scholar] [CrossRef] [Green Version]
  2. Darre, N.C.; Toor, G.S. Desalination of Water: A Review. Curr. Pollut. Rep. 2018, 4, 104–111. [Google Scholar] [CrossRef]
  3. Ibrahim, A.G.; Rashad, A.M.; Dincer, I. Exergoeconomic analysis for cost optimization of a solar distillation system. Sol. Energy 2017, 151, 22–32. [Google Scholar] [CrossRef]
  4. El-Dessouky, H.; Ettouney, H. Introduction. In Fundamentals of Salt-Water Desalination; Elsevier Science B.V.: Amsterdam, The Netherlands, 2002. [Google Scholar]
  5. Tal, A. The Desalination Debate—Lessons Learned Thus Far. Environ. Sci. Policy Sustain. Dev. 2011, 53, 34–48. [Google Scholar] [CrossRef]
  6. Curto, D.; Franzitta, V.; Guercio, A. A review of the Water Desalination Technologies. Appl. Sci. 2021, 11, 670. [Google Scholar] [CrossRef]
  7. Alkaisi, A.; Mossad, R.; Barforoush, A.-S. A Review of the Water Desalination Systems Integrated with Renewable Energy. Energy Procedia 2017, 110, 268–274. [Google Scholar] [CrossRef]
  8. Ma, Q.; Lu, H. Wind energy technologies integrated with desalination systems: Review and state-of-the-art. Desalination 2011, 277, 274–280. [Google Scholar] [CrossRef]
  9. Altmann, T.; Das, R. Process improvement of sea water reverse osmosis (SWRO) and subsequent decarbonization. Desalination 2021, 499, 114791. [Google Scholar] [CrossRef]
  10. Sideman, S.; Moalem-Maron, D. Direct contact condensation. Adv. Heat Transf. 1982, 15, 227–281. [Google Scholar]
  11. Zhang, Z.; Chong, D.; Yan, J. Modeling and experimental investigation on water-driven steam injector for waste heat recovery. Appl. Therm. Eng. 2012, 40, 189–197. [Google Scholar] [CrossRef]
  12. Han, Y.; Wang, X.; Yuen, A.C.Y.; Li, A.; Guo, L.; Yeoh, G.H.; Tu, J. Characterization of choking flow behaviors inside steam ejectors based on the ejector refrigeration system. Int. J. Refrig. 2020, 113, 29307. [Google Scholar] [CrossRef]
  13. Camacho, M.L.; Dumee, L.; Zhang, J.; Li, J.; Duke, M.; Gomez, J.; Gray, S. Advances in membrane distillation for water de-salination and purification applications. Water 2013, 5, 94–196. [Google Scholar] [CrossRef] [Green Version]
  14. Manawi, Y.M.; Kharaisheh, A.K.; Fard, A.K.; Benyahia, F.; Adham, S. Effect of operatonal parameters on distillate flux in direct contact membrane distillation (DCMD): Comparison between experimental and model predicted performance. Desalination 2014, 336 (Suppl. C), 110–120. [Google Scholar] [CrossRef]
  15. EI-Bourawi, M.S.; Ding, A.; Ma, R.; Khayet, M. A framework for better understanding membrane distillation seperation process. J. Membr. Sci. 2006, 285, 4–29. [Google Scholar] [CrossRef]
  16. Koo, J.; Han, J.; Sohn, J.; Lee, S.; Hwang, T.-M. Experimental comparison of direct contact membrane distillation (DCMD) with vacuum membrane distillation (VMD). Desalination Water Treat. 2013, 51, 6299–6309. [Google Scholar] [CrossRef]
  17. Khayet, M.; Matsuura, T. Membrane Distillation: Principles and Applications; Elsevier: Amsterdam, The Netherlands, 2011. [Google Scholar]
  18. Andrjesdóttir, Ó.; Ong, C.L.; Nabavi, M.; Paredes, S.; Khalil, A.S.G.; Michel, B.; Poulikakos, D. An experimentally optimized model for heat and mass transfer in direct contact membrane distillation. Int. J. Heat Mass Transf. 2013, 66, 855–867. [Google Scholar] [CrossRef]
  19. Qtaishat, M.; Matsuura, T.; Kruczek, B.; Khayet, M. Heat and mass transfer analysis in direct contact membrane distillation. Desalination 2008, 219, 272–292. [Google Scholar] [CrossRef]
  20. Lawson, K.W.; Lloyd, D.R. Membrane distillation. J. Membr. Sci. 1997, 124, 1–25. [Google Scholar] [CrossRef]
  21. Garcia-Payo, M.C.; Izquierdo-Gil, M.A. Thermal resistance technique for measuring the thermal conductivity of thin microporous membranes. J. Phys. D Appl. Phys. 2004, 37, 3008–3016. [Google Scholar] [CrossRef]
  22. Schofield, R.W.; Fane, A.G.; Fell, C.J. Heat and mass transfer in membrane distillation. J. Membr. Sci. 1987, 33, 299–313. [Google Scholar] [CrossRef]
  23. Nayar, K.G.; Sharqawy, M.H.; Banchik, L.D.; Lienhard, J.H.V. Thermophysical properties of seawater: A review and new correlations that include pressure dependence. Desalination 2016, 390, 1–24. [Google Scholar] [CrossRef]
  24. Ve, Q.L.; Koirala, R.; Bawahab, M.; Faqeha, H.; Do, M.C.; Nguyen, Q.L.; Date, A.; Akbarzedeh, A. Experimental investigation of the effect of the spacer and operating conditions on mass transfer in direct contact membrane distillation. Desalination 2021, 500, 114. [Google Scholar] [CrossRef]
  25. Aas, G.A.; Mea, A.; Ha, S.A.; Masa, A.M.A. Effect of different salts on mass transfer coefficient and inorganic fouling of TFC membranes. J. Membr. Sci. Technol. 2017, 7, 100175. [Google Scholar] [CrossRef]
  26. Boudinar, M.B.; Hanbury, W.T.; Avlonitis, S. Numerical simulation and optimisation of spiral-wound modules. Desalination 1992, 86, 273–290. [Google Scholar] [CrossRef]
  27. Mengual, J.I.; Khayet, M.; Godino, M.P. Heat and mass transfer in vacuum membrane distillation. Int. J. Heat Mass Transf. 2004, 47, 865–875. [Google Scholar] [CrossRef]
  28. Kim, Y.-D.; Kim, Y.-B.; Woo, S.-Y. Detailed modeling and simulation of an out-in configuration vacuum membrane distillation process. Water Res. 2018, 132, 23–33. [Google Scholar] [CrossRef]
  29. Bhuyan, D. Direct and indirect contact film-wise as well as dropwise condensation of water vapour with and without non-condensable gas-A review. Int. Res. J. Eng. Technol. 2020, 7, 10. [Google Scholar]
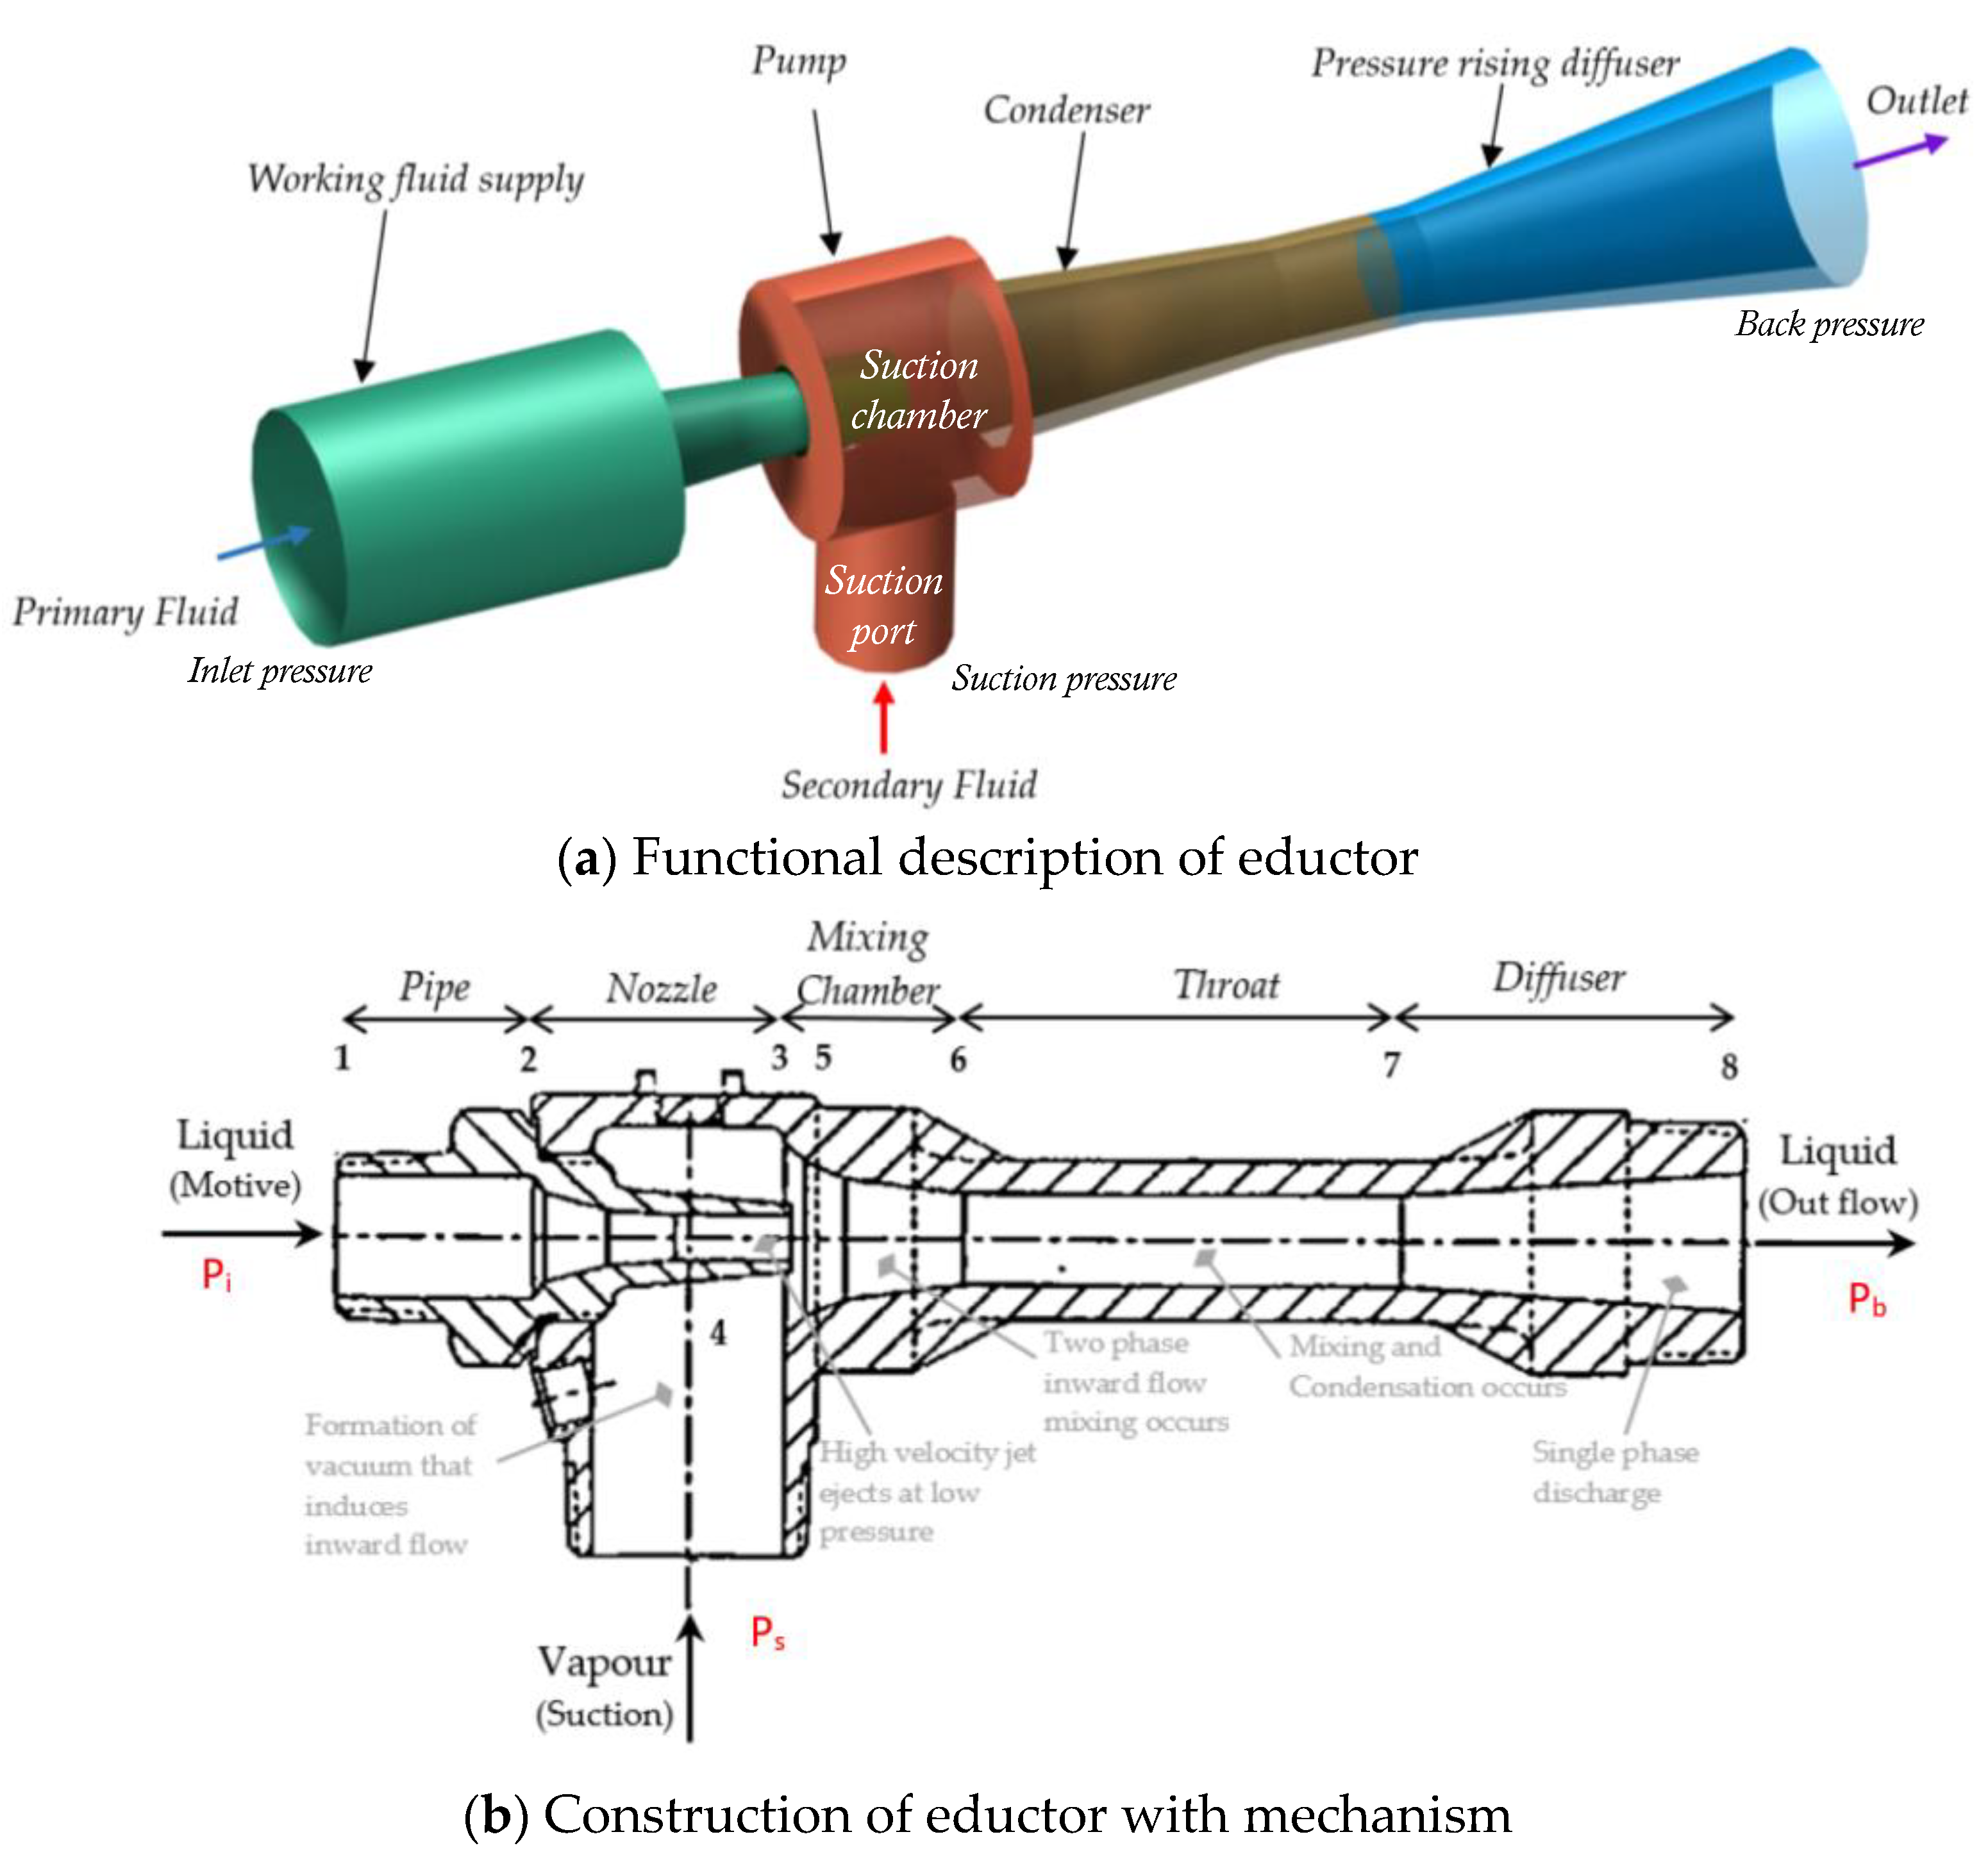
Figure 1. Components of an eductor and their function.
Water 14 03624 g001
Figure 2. Two phase flow inside eductor.
Water 14 03624 g002
Figure 3. Heat and mass transfer in VMD and DCMD.
Water 14 03624 g003
Figure 4. Eductor-based membrane distillation unit.
Water 14 03624 g004
Figure 5. Experimental setup of the module.
Water 14 03624 g005
Figure 6. Experimental study of the suction capacity of an educator.
Water 14 03624 g006
Figure 7. Degassing rate of eductor at different Pb/Pi for initialization of distillation desalination.
Water 14 03624 g007
Figure 8. Mass flux (J) with respect to Pb/Pi at different Tfi (cold side temperature constant at Tp = 15 °C).
Water 14 03624 g008
Figure 9. Mass flux (J) with respect to feed flow (Qfi).
Water 14 03624 g009
Figure 10. Performance of the eductor; entrainment ratio, Er, vs pressure ratio, Pr.
Water 14 03624 g010
Figure 11. Validation of empirical model considered for VMD.
Water 14 03624 g011
Figure 12. Flux comparison of eductor-based MD with VMD.
Water 14 03624 g012
Figure 13. GOR and TPC with respect to the feed temperature.
Water 14 03624 g013
Figure 14. Influence of increasing concentration during freshwater production on flux (J).
Water 14 03624 g014
Table 1. Estimation of membrane distillation coefficient (Bm) in DCMD [17,20].
Mass Transfer MechanismMD Coefficient (Bm)Eq No.Condition
Molecular diffusion B m M = ε m τ × δ m PD P a M RT (25)Kn < 0.01
Combined Knudsen-molecular diffusion B m K M = 1 RT δ m 3 τ 2 ε m r π M 8 RT 1 / 2 + P a × τ ε m PD 1 (26)0.01 < Kn < 1
Knudsen flow model B m K = 2 3 RT ε m r τ × δ m 8 RT π M 1 / 2 (27)Kn > 1
τ = 1 ε m
PD = 1 . 895 × 10 5 T m 2 . 072
Table 2. Estimation of membrane distillation coefficient (Bm) in VMD [17].
Mass Transfer MechanismMD Coefficient (Bm)Eq No.Condition
Viscous flow model B m V = 1 R T δ m ε m r 2 8 τ μ p (28)Kn < 0.01
Combined Knudsen-viscous mechanism B m K V = 1 RT δ m 2 3 ε m r τ 8 R T π M 1 / 2 + ε m r 2 8 τ μ p (29)0.01 < Kn < 10
Knudsen flow model B m K = 2 3 RT ε m r τ × δ m 8 RT π M 1 / 2 (30)Kn > 10
Table 3. Physical properties of membrane module, membrane, and eductor.
ParticularDescriptionUnitsSymbols
Membrane Module
Width2mmW
Length180mmL
Breadth180mmB
Membrane
MaterialPTFE
Pore size0.22µmdp
Thickness190–240µmδt
Porosity80%
Eductor
Inlet diameter12mmDed,in
Outlet diameter12mmDed,out
Suction diameter12mmDed,suc
Eductor length114mmLed
Table 4. Operating parameters of the hybrid system.
ParticularDescriptionUnitsSymbols
Membrane Module operating parameter
Feed flow5.02LPMQf,in
Feed temperature50, 60, 70 & 80 (+/−2)°CTf
Eductor operating parameter
Eductor inflow4.85LPMQe,in
Eductor inlet Temperature15°CTe,in
Publisher’s Note: MDPI stays neutral with regard to jurisdictional claims in published maps and institutional affiliations.