Article

A 3D Fully Non-Hydrostatic Model for Free-Surface Flows with Complex Immersed Boundaries

1
Department of Maritime Information and Technology, National Kaohsiung University of Science and Technology, Kaohsiung 80543, Taiwan
2
Master’s Program in Offshore Wind Energy Engineering, College of Maritime, National Kaohsiung University of Science and Technology, Kaohsiung 80543, Taiwan
*
Author to whom correspondence should be addressed.
Water 2022, 14(23), 3803; https://doi.org/10.3390/w14233803
Submission received: 14 October 2022 / Revised: 18 November 2022 / Accepted: 19 November 2022 / Published: 22 November 2022
(This article belongs to the Special Issue Research on the Interaction of Water Waves and Ocean Structures)

Abstract

:
A fully non-hydrostatic hydrodynamic model is developed to simulate a three-dimensional, incompressible, and viscous free-surface flow passing downstream rigid rectangular and circular cylinders. A direct numerical simulation (DNS) based on the volume of fluid (VOF) and immersed boundary (IB) method is presented for solving the Navier–Stokes equations. The numerical scheme provides accurate solutions with high efficiency using the novel computational procedure to model severe surface deformations. A staggered finite difference method with a Cartesian mesh coordinate system is used to discretize the governing equations with the complexity of the deformed free-surface flow, for which the numerical schemes include a free-surface tracking technique based on the VOF and a VOS-based IB method to simulate 3D dam-break flows passing the slender objects. Additionally, the case studies demonstrate the accuracy and flexibility of the proposed model to predict the impact forces of the surface flow against the different configurations of structures. The results reveal that the temporal variation of the impact force acted on the rectangular obstacle is dominated by the aspect ratio. The force increases with the increase in the shape parameter. The resistance caused by a thin obstacle is considerably less than the blunt shape.

1. Introduction

Numerical computations of three-dimensional free-surface flow are important for the practical activities in the field of hydraulic engineering, for example, a flood caused by dam break or a sudden opening of a sluice to produce the impact force on buildings, bridges, and piers downstream [1,2,3]. The phenomena of free surface flows are usually studied in the area of ocean engineering, which are examined for a wave train passing over a submerged obstacle [4], tsunami loads on coastal bridge deck [5], and extreme wave force acted on elevated coastal buildings [6], because the structures are required to be carefully designed in terms of safety considerations. However, a successful prediction of the free-surface flow passing rigid bodies highly relies on the advances of numerical schemes and algorithms.
Computational fluid dynamics (CFD), such as the finite difference method (FDM), finite volume method (FVM), and finite element method (FEM), have been well-established to calculate the Navier–Stokes equations with the primitive variables of the pressure-velocity, among which the FEM method is a more recently developed solver with the success for the simulation of the fluid flow acted on structures. An explicit Arbitrary Lagrangian–Eulerian FEM-based technique was developed to examine the impacts of large-scale surface oscillations on bridges and coastal decks [7,8]. Istrati and Buckle [9] calibrated and validated an implicit incompressible FEM-based scheme in which a Level Set method was employed to model the free-surface. This solver was used to predict the impact forces on structures caused by the dam-break flow and solitary wave and developed to investigate the 3D floods that interacted with elevated buildings in the coastal area [10].
Alternatively, the solution of the shallow water equations (SWEs) is a relatively simple approach, and a number of numerical techniques were developed for the free surface flow impacted on solid objects caused by dam-break [11,12,13,14,15,16,17]. In essence, for the SWEs, the 2D continuity and momentum equations were coupled with the velocity. However, the pressure is given as a source term, implemented using the distribution of hydrostatic pressure. The vanishing of the pressure constrains the momentum equations to satisfy the mass conservation. The discontinuities and non-linearity cause the coupled equations to be solved with more difficulty. Hence, the classical techniques of the conventional FDM are employed using the central difference discretization, which result in less accuracy and inefficiency for the shock-capturing abilities.
The phenomenon of a dam-break surface flow is frequently used to validate the performance of numerical models with different algorithms. Nujic [18] developed the modified Lax–Friedrich scheme. Savic and Holly [19] introduced the Godunov method [20] to contrive an approximation of the Riemann solver. Harten [21] presented a high-resolution total variation diminishing (TVD) scheme [22,23] for which the resulted dissipative and compressive effects were observed [24,25]. Wang et al. [26] introduced the finite difference TVD scheme combined with the first-order upwind and second-order Lax–Wendroff schemes to improve the accuracy for the simulation of the dam-break flows. The subject was subsequently modeled by Wang et al. [16] using a second-order finite volume TVD scheme with the optimum-selected limiter for the spatial discretization and two-step Runge–Kutta method for the temporal discretization. The essentially non-oscillatory (ENO) [27] and weighted essentially non-oscillatory (WENO) [28,29] schemes, categorized by the upwind schemes and central schemes [30], are particularly useful to achieve high resolutions for the discontinuity in the stencils. The upwind schemes employ a characteristic-wise structure to capture shocks associated with the extensive use of an eigensystem. The central scheme with the component-wise structure provides the required flexibility and simplicity because the minimum eigenvalues are needed. Recently, the CFD modelling of the fluid–structure interaction has been progressed using the mesh-free particle-based technique such as the discrete element method and the Smoothed Particle Hydrodynamics [31,32], as well as the coupled mesh-particle methods such as the coupled SPH-FEM method [33,34].
In this study, a fully hydrodynamic model is developed [35] using the DNS method with the second-order accuracy to simulate the 3D free-surface flow passing a single cylinder or aligned cylinders. To accurately predict the surface oscillations affected by the fixed boundary, the present model combines the VOF method and volume of solid-based (VOS-based) IB method [36,37] for which the govern equations are discretized by the FDM in time and space. The VOF method is capable of tracking the free-surface motions with severe deformations, while the VOS-based IB method is used to solve the boundary problem at the interface between the viscous fluid flow and the rigid body. The FDM is employed to discretize the velocity–pressure terms on a uniform Cartesian grid system and the solutions are computed using the decoupled numerical scheme. Accordingly, the operator splitting technique and Adams–Bashforth time-stepping method were established to solve the problem of 3D free-surface flow. To create the computational domain with the solid bodies immersed in the fluid, the geometries with VOS method were embedded in the Cartesian grids with the imposed interpolation treatments to ensure the accuracy of the solutions for the cut cells.
This study selects the case of the dam-break flow with the dam-break surge impacting on a single square and circular column and four aligned columns to examine the phenomena of interfacial flows with the existence of the air–liquid and liquid–solid phases. Comparisons between the modeling results and previously published solutions were made to demonstrate the robust and accuracy of the present fully non-hydrostatic hydrodynamic model. The complex free-surface motions generated by the slender bodies protruding the surface are illustrated using the cases of the numerical results simulated by the present model. Based on the non-hydrostatic pressure assumption, the hydrodynamic force of dam-break flow against different types of structures are effectively computed. The flow patterns gained in this study, particularly for the dynamic of the free-surface, are beneficial for understanding the 3D free-surface flow crossing the non-moving object. This is also helpful for the follow-on simulations for the fluid–structure interaction regarding the flow-induced vibrations.
The structure of this paper is as follows. Section 2 illustrates the numerical methods and procedure of computation. Section 3 describes the numerical results of 3D dam-break flows affected by the slender bodies with various configurations, and the impact forces caused by the flows with the conclusion remarks are made in Section 4.

2. Numerical Model

A fully non-hydrostatic hydrodynamic free-surface modeling is introduced in this section for the significant part of the numerical formulations and the VOF and VOF-based IB methods to investigate the dam-break surface waves passing the rigid structures.

2.1. Governing Equations

The Navier–Stokes equations consist of a mass and momentum conservation to describe an incompressible viscous surface flow passing the solid body with the computation domain enclosed by a piecewise boundary. The solution of this problem is to introduce a body force field F acted on the solid surface such that the distribution of a desired velocity V is assigned over a boundary S. The body force term is added to the Navier–Stokes equations to solve the V , with the continuity and momentum equations expressed as follows:
· V = 0
V t + ( V · ) V = 1 ρ P + 2 μ · E ( V ) + f g + φ F
where V denotes the velocity vector described as (u, v, w), where u , v , and w denote the velocities in the x , y , and z directions, P is the total pressure referring to the sum of static and dynamic pressure, ρ denotes the density, μ denotes the viscosity, E ( V ) = 1 2 ( V + V T ) denotes the strain rate tensor, f g = (0, 0, −g) is the gravity, F denotes the body force on solid, and φ denotes the solid volume fraction ( 0 < φ < 1 ).
Equations (1) and (2) correspond to the expression in the Cartesian coordinate for three dimensions given as:
u x + v y + w z = 0
u t + u u x + v u y + w u z = 1 ρ P x + μ 2 u + φ F x
v t + u v x + v v y + w v z = 1 ρ P y + μ 2 v + φ F y
w t + u w x + v w y + w w z = 1 ρ P z + μ 2 w g + φ F z
where F x ,   F y , and F z represent the body forces in x , y , and z directions, respectively.

2.2. Numerical Solution by FDM

A second-order Adams–Bashforth scheme based on the FDM was used to manipulate the multistep of the Navier–Stokes equations. To achieve overall high efficiency during the computation, the numerical scheme uses a split operating step to discretize Equations (4)–(6) expressed as follows,
u n + 1 u n Δ t + cx n + 1 ρ p n + 1 / 2 x = φ F x n + 1
v n + 1 v n Δ t + cy n + 1 ρ p n + 1 / 2 y = φ F y n + 1
w n + 1 w n Δ t + cz n + 1 ρ p n + 1 / 2 z = φ F z n + 1
where cx n , cy n , and cz n are written as:
cx n = 1.5 A n 0.5 A n 1
cy n = 1.5 B n 0.5 B n 1
cz n = 1.5 C n 0.5 C n 1
A = u u x + v u y + w u z μ 2 u
B = u v x + v v y + w v z μ 2 v
C = u w x + v w y + w w z μ 2 w + g
The projection method was introduced to solve the time-dependent momentum equations, originally proposed by Chorin [38], which decouple the velocity and pressure fields. The method is an effective means to obtain the solution for the incompressible viscous flow and make the divergence free via the orthogonal projection of the apparent velocity field. The pressure variable was evaluated after the velocity field was computed. It is noted that the non-slip condition on the walls was used for all case studies. The pressure Poisson equation is expressed as:
1 ρ 2 P n + 1 / 2 = 1 Δ t ( u n x + v n y + w n z ) ( cx n x + cy n y + cz n z )
The Neumann boundary condition for Poisson pressure equation is used and expressed as follows:
1 ρ δ x Δ x P n + 1 / 2 = - ( u n + 1 u n Δ t + cx n ) X = 0 , L 1 ρ δ y Δ y P n + 1 / 2 = - ( v n + 1 v n Δ t + cy n ) Y = 0 , W 1 ρ δ z Δ z P n + 1 / 2 = - ( w n + 1 w n Δ t + cz n ) Z = 0 , H
The high Reynolds numbers in the present case studies are observed, and therefore the time-step constraint is dominated by the CFL condition. Here, the explicit scheme is adopted to save the overhead cost of solving Poisson pressure equation at each time-step caused by a second-order Adams–Bashforth scheme. The equations are discretized on the main cell center, with the second-order central differences given as follows:
P i + 1 , j , k + P i 1 , j , k Δ x 2 + P i , j + 1 , k + P i , j 1 , k Δ y 2 + P i , j , k + 1 + P i , j , k 1 Δ z 2 2 P i , j , k ( 1 Δ x 2 + 1 Δ y 2 + 1 Δ z 2 ) = ρ D
D = δ x Δ x ( u n Δ t cx n ) + δ y Δ y ( v n Δ t cy n ) + δ z Δ z ( w n Δ t cz n )
where P i + 1 , j , k , P i 1 , j , k , P i , j + 1 , k , P i , j 1 , k , P i , j , k + 1 , and P i , j , k 1 denote the pressure at the east, west, north, south, top, and bottom. Figure 1 shows the cell in the vicinity of the free surface in which a correct boundary condition is applied. The distance in the x-direction between the cell centers (i, j, k) where the pressure is computed with unequal δ x at the left-hand side (fluid) and right-hand side (free-surface). Equation (18) is written to account for unequal leg lengths in the x , y , and z directions as
P i + 1 , j , k E Δ x + P i , j + 1 , k N Δ y + P i , j , k + 1 T Δ z + P i 1 , j , k W Δ x + P i , j 1 , k S Δ y + P i , j , k 1 B Δ z
P i , j , k ( 1 E Δ x + 1 E Δ x + 1 E Δ y + 1 E Δ y + 1 T Δ z + 1 B Δ z ) = ρ D
where Δ x , Δ y , and Δ z denote the grid sizes in the x , y , and z directions, respectively, and E , , S , W , N , , and B denote the leg length for the cell (i, j, k).

2.3. Numerical Solution with FDM and VOS-Based Immersed Boundary Method

The forcing function F x ,   F y , and F z in Equations (4)–(6) are solved using a VOS method, which is constructed to resolve the terms associated with the immersed boundary. When a flow passes an object with both the fluid and solid phase in the computational domain, it is necessary to take into account the force induced by the solid body on the fluid. The volume fraction of the solid phase φ is introduced to describe the cut cells occupied by the solid body. Three conditions of the φ values cause the variation of the virtual force for the object. When φ = 1, the grid cells locate fully inside the object. When φ = 0, the cells are in the fluid domain. When 0 < φ < 1 , the boundary places at the transition region between the fluid and solid phases. It is important to determine the precise values of φ for the cut cells throughout the entire immersed boundary. For simplicity, the regular points are allocated to the cut cells. Accordingly, each value of φ is computed by the number of the point inside the solid phase/total points in a cut cell. The corrected velocity in the Cartesian cut cell throughout the entire computational domain is obtained as follows:
V GC = ( 1 φ ) V n + 1 + φ V s
where V GC represents the corrected velocity, V n + 1 represents the velocity at fractional step, and V s represents the velocity of object. V s is identical to zero for the rigid object while V s is unequal to zero for a moving object. The corrected velocity V GC is equivalent to the V n + 1 with φ = 0 . The velocity is vanished with φ = 1 when the cells are entirely inside the solid phase. For the immersed boundary with 0 < φ < 1 , the corrected velocities are modified by imposing a body force F in cut cells to give the corrected velocity V GC as illustrated in the 2D simulation of Lo [37], who demonstrated the capability of the VOS method to predict a 3D free-surface flow. The forcing terms, F x ,   F y , and F z in the Navier–Stokes equations, are computed by substituting the corrected velocity V GC into Equations (7)–(9) to obtain the direct forcing function in the momentum equations.
A volume integral method was used to compute the force acted on the object expressed as
F = ( F x , F y , F z ) = i = 1 n f Δ v i
where Δ v i is the volume of ith cell, and n is the total number of cut-cells for the immersed object.

2.4. Volume Fraction Transport Equation

The conservation of the fluid phase for the arbitrary material fluid point is governed by the transport equation of the color-function given as:
DC f Dt = C f t + V · C f = 0
With the integration of Equation (21) over each cell and the integration the second term by parts, the divergence theorem is then applied to obtain:
t C f dv + C f V n ds = C f · V dv
where the term on the right-hand side is the dilation of dark volume that is equal to zero in an incompressible flow. The volume function is employed to replace the color-function as follows,
f t Δ Ω + F net = C f · V dv
where f denotes the volume fraction of fluid, Δ Ω denotes the cell volume, F net denotes the net flux of dark fluid out of Ω , and C f denotes the color-function.
Two steps were adopted to compute the volume fraction by solving Equation (23). The computed volume fraction field was used as the advection step in which the fluxes are evaluated in each time-step. For the requirements in the simulation of 3D flows, an efficient operator-split method was used to obtain the volume fraction f as referred to [39].

2.5. Solution Procedure

The hydrodynamic model for the 3D free-surface flow was presented using the velocity–pressure correction method, as illustrated in the previous sections. The equations were solved for the velocity field as given in Equations (7)–(9), whereas the pressure field and corrected velocity were obtained with the solutions of Equations (16) and (20), respectively, to ensure the conservation law. The free-surface position is tracked by Equation (23). As the nonlinear Navier–Stokes equations are coupled with the immersed solid boundaries, the following iterative procedure is employed to obtain the solutions.
  • Propose the initial and the boundary conditions for a given time-step and use the VOF reconstruction method via Equation (23) to compute a cell-center estimate of the volume fraction and free-surface position.
  • Solve the cx n , cy n , and cz n using Equations (10)–(12) via FDM.
  • Solve the right-hand side D of pressure Poisson equation (Equation 16) using iterative method to obtain the pressure, Pn+1/2 based on point-successive over relaxation iteration.
  • Solve the velocity, u, v, and w using Equations (7)–(9) via a split operating step FDM.
  • Using the V GC via Equation (20) to calculate the forcing function, F x n + 1 , F y n + 1 , and F z n + 1 in Equations (7)–(9) include the effect of immersed body.
  • In the fractional time-step, the values of velocities, forcing functions, and pressure variables calculated from the previous time-step were used to resolve the steps 1 to 5 to obtain new values. The above numerical procedure was reiterated until the prescribed time was reached.

3. Results and Discussion

The developed fully non-hydrostatic hydrodynamic model, using the approaches of VOF and VOS-based IB methods, was employed to investigate the dam-break caused by 3D free surface oscillations when the water flow passes the slender cylinders protruding the water surface. The phenomenon is analogous to the scenario of floods impacting on the downstream buildings and bridge piers. Three cases were selected to implement the simulations, which are the dam-break and partial dam-break flows passing a single square cylinder with various aspect ratios, a single circular cylinder, and four square and circular cylinders aligned in the traverse direction.
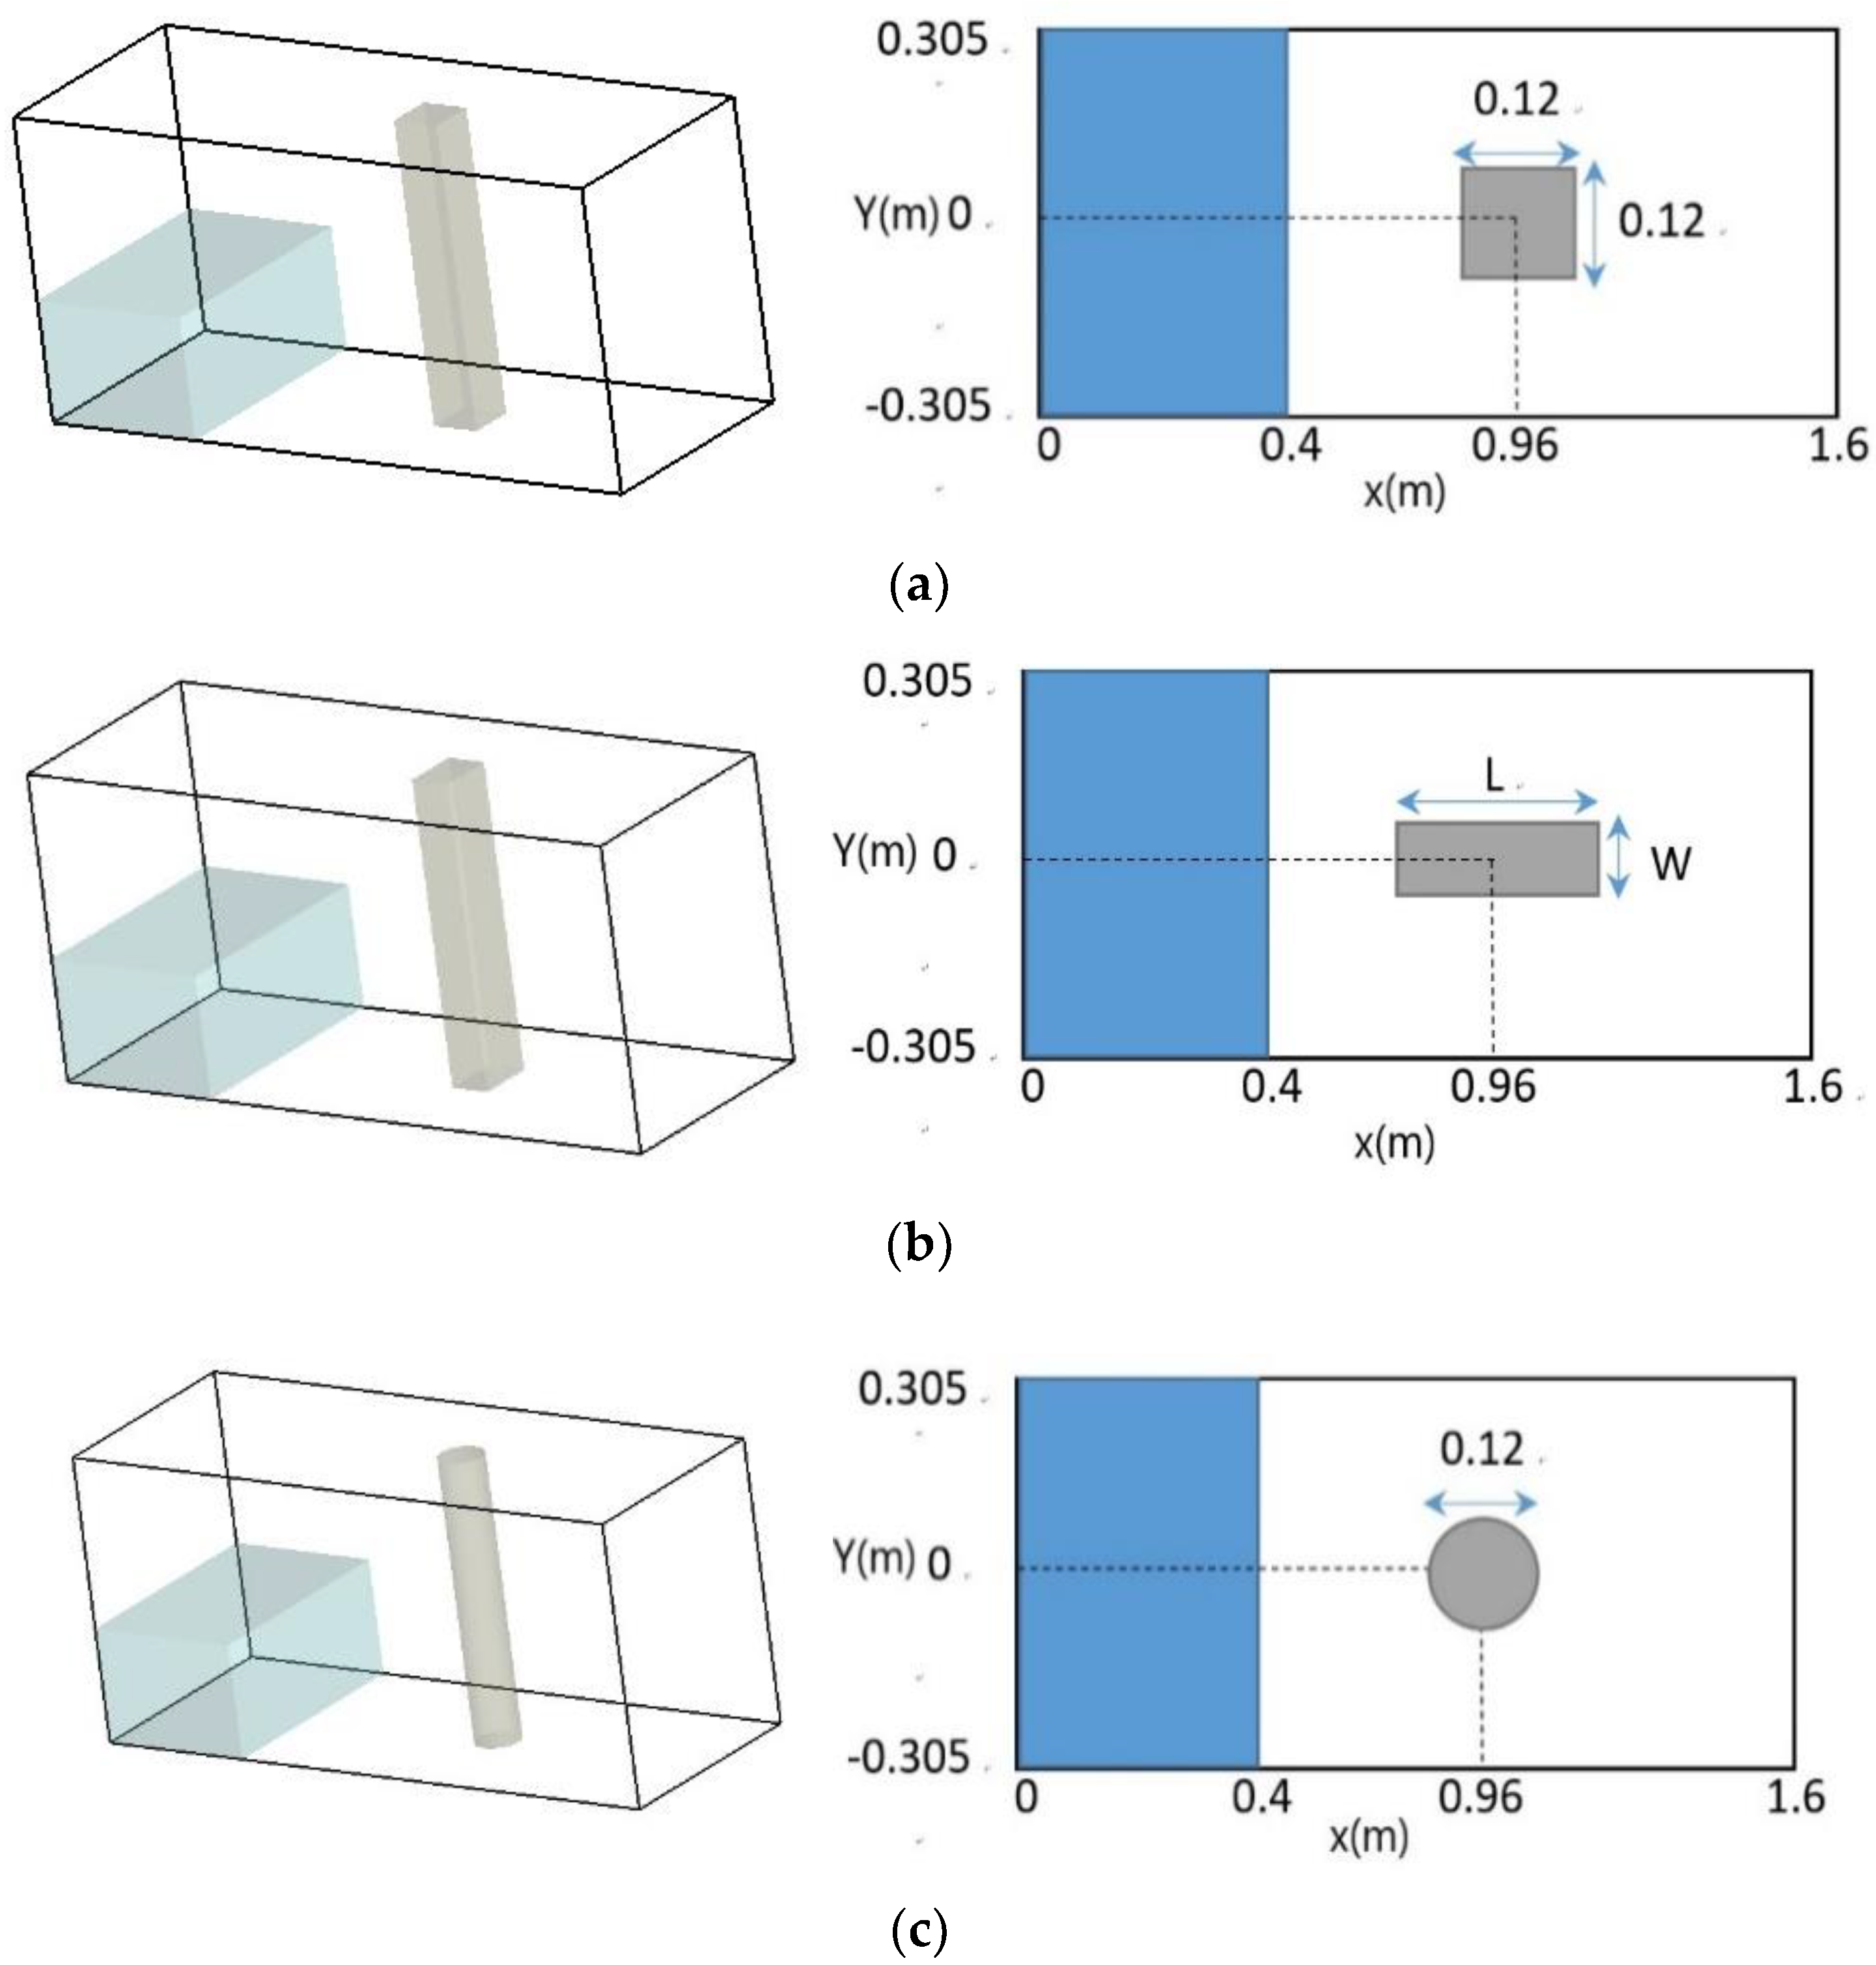
Figure 2 shows the schematic diagram of the 3D computational domain and the geometries of the cylinders. The size of the domain is 1.6   m × 0.61   m × 1   m (length × width × depth in the x, y, and z direction in the Cartesian coordinate). The cross-sections of the rectangular cylinders are described using the aspect ratio, α = W / L , where L represents the length and W represents the width. The initial condition is given by the standstill water column with the volume of 0.4   m × 0.61   m × 0.3   m behind the dam, as plotted in Figure 2. To validate the accuracy of the present model, the water column was designed to be identical to the study of Raad and Bidoae [40]. The protruding objects stand with respect to the downstream distance of 0.96 m at the geometric center.

3.1. Dam-Break Flow Passing a Cylinder

Raad and Bidoae [40] simulated the 3D free-surface elevations for the dam-break water flow, passing the square cylinder using the numerical technique of the Eulerian–Lagrangian marker and micro-cell method. Their results were compared with the laboratory experiment observed in a tank with the measurement of the velocities downstream and the force loadings on the tall object [40]. The experiment shown by Raad and Bidoae [40] was also used to evaluate the accuracy of the present model.
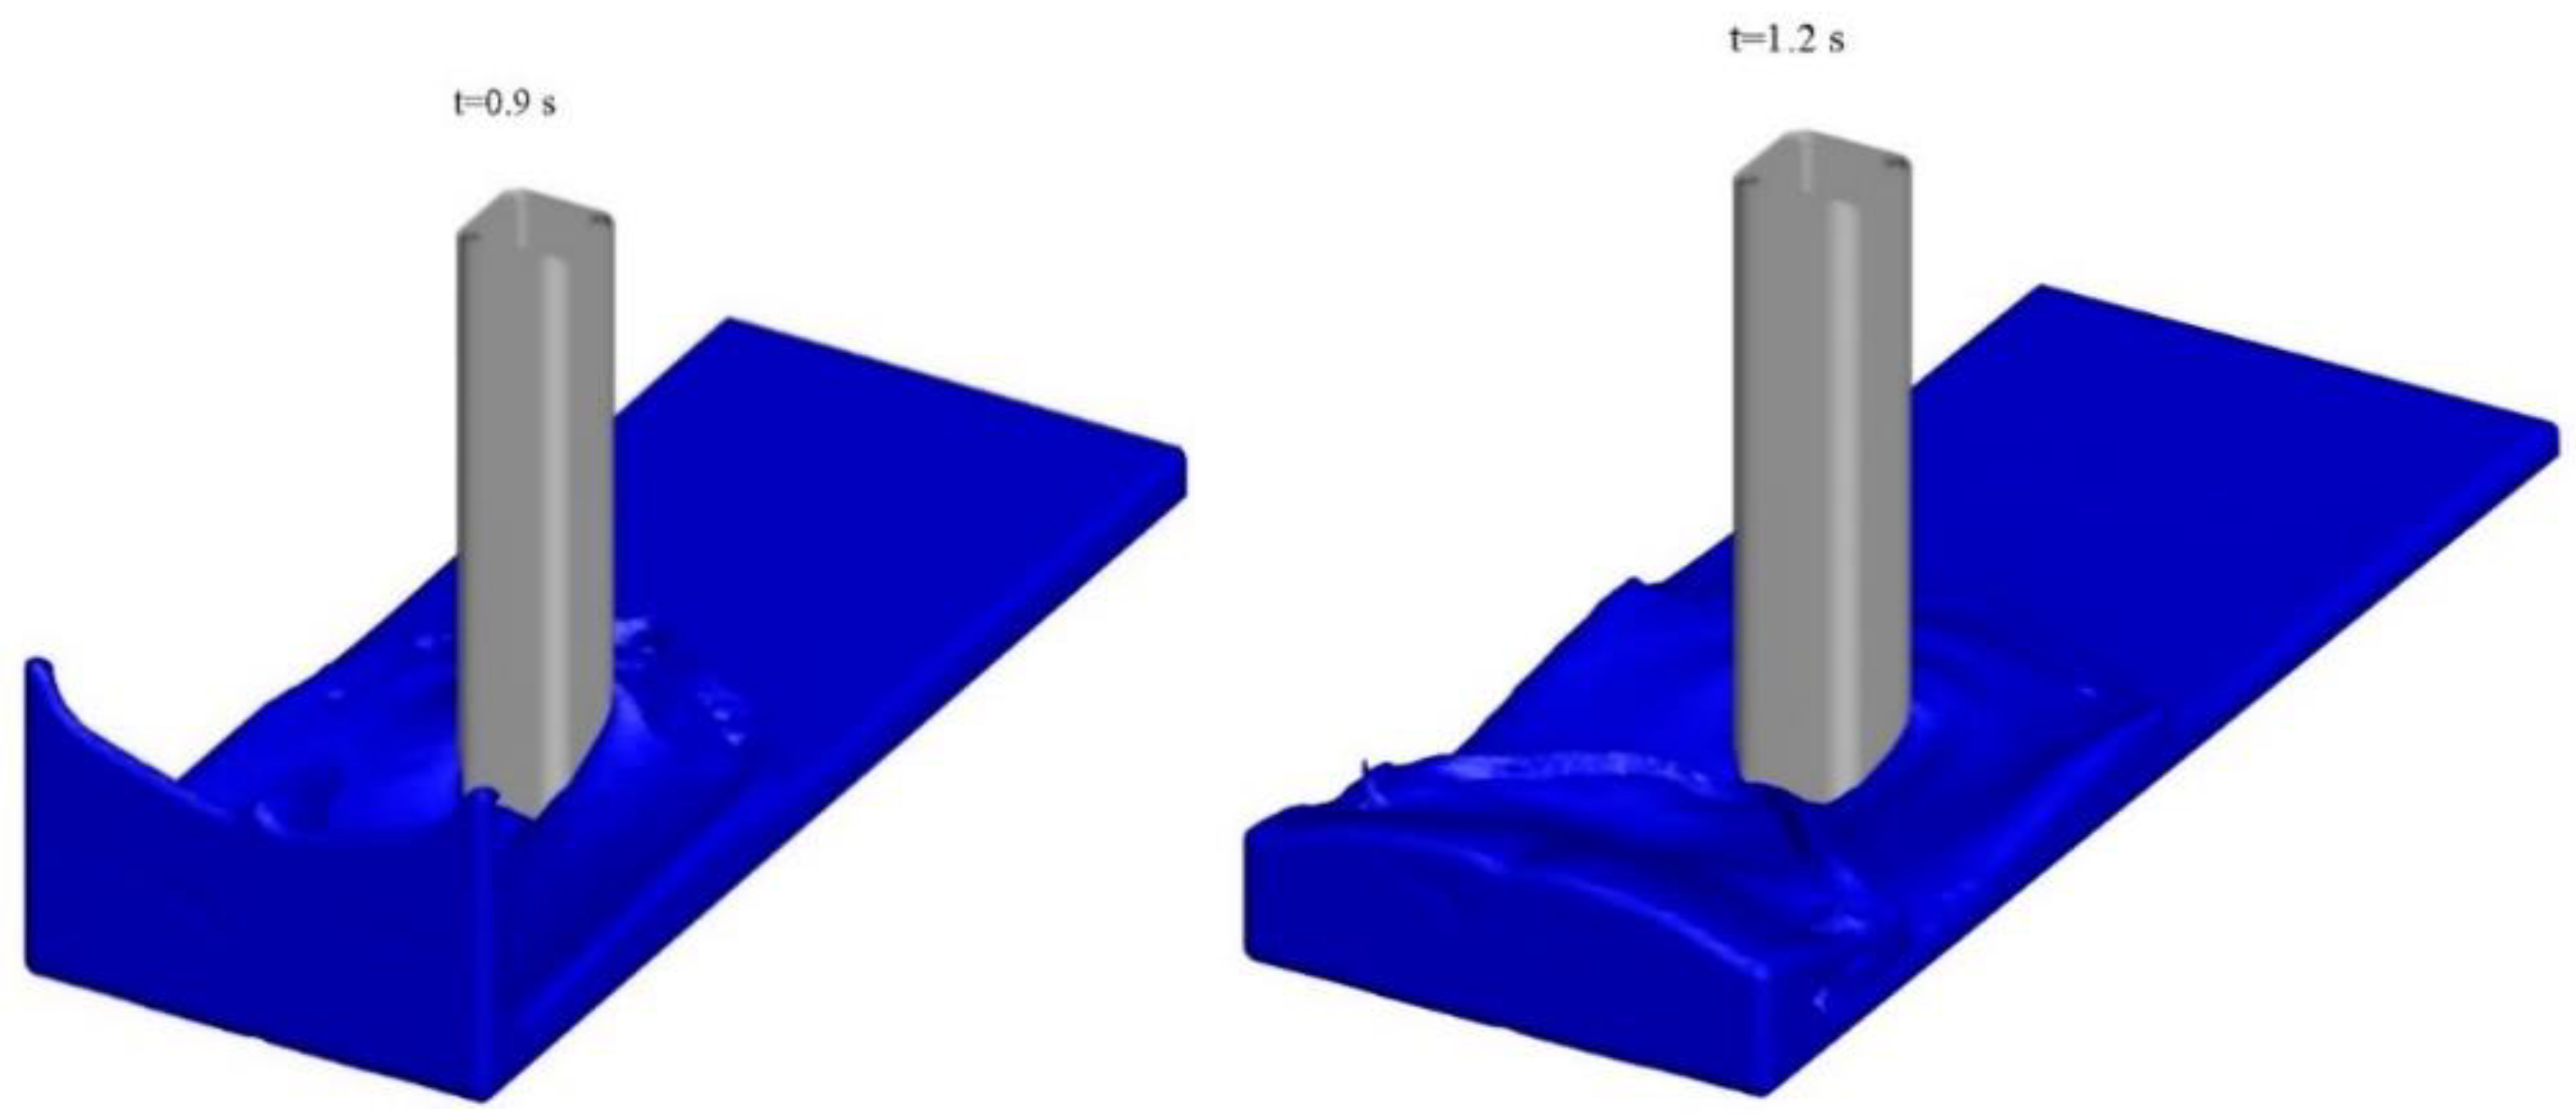
This case study uses the three uniform grid sizes of 0.01 m, 0.0075 m, and 0.005 m with Δx = Δy =Δz. The time-step, Δt, is given with three various time-steps of 0.001 s, 0.0005 s, and 0.00025 s, respectively. Table 1 shows the comparison of the CPU times for the time-steps and grid-sizes for the dam-break flow passing a square cylinder. Figure 3 demonstrates the simulation result with the temporal evolution of the dam break surface flow passing a single square cylinder. At the moment of time zero when the dam is suddenly removed, the water is accelerated by gravity and flows towards the rigid object. 3D surface waves are generated when the flow collides with the solid body. Subsequently, the flow crashes on the downstream wall, showing the significant run-up of the free surface, which then falls down, accompanied by the back flow, and causes a rougher surface. Figure 4 shows the variation of the horizontal velocity with time at the location of (0.754, 0, 0.026). The computation of the impact force on the structure using Equation (22) is displayed in Figure 5, demonstrating a dramatic increase of the force to form a peak after the water flow hits the object. The numerical results show the better agreement with the experimental observation for the finer grids of 0.0075 m and 0.005 m. Additionally, the analogous consequences among the three grid sizes indicate the consistency of the numerical technique.
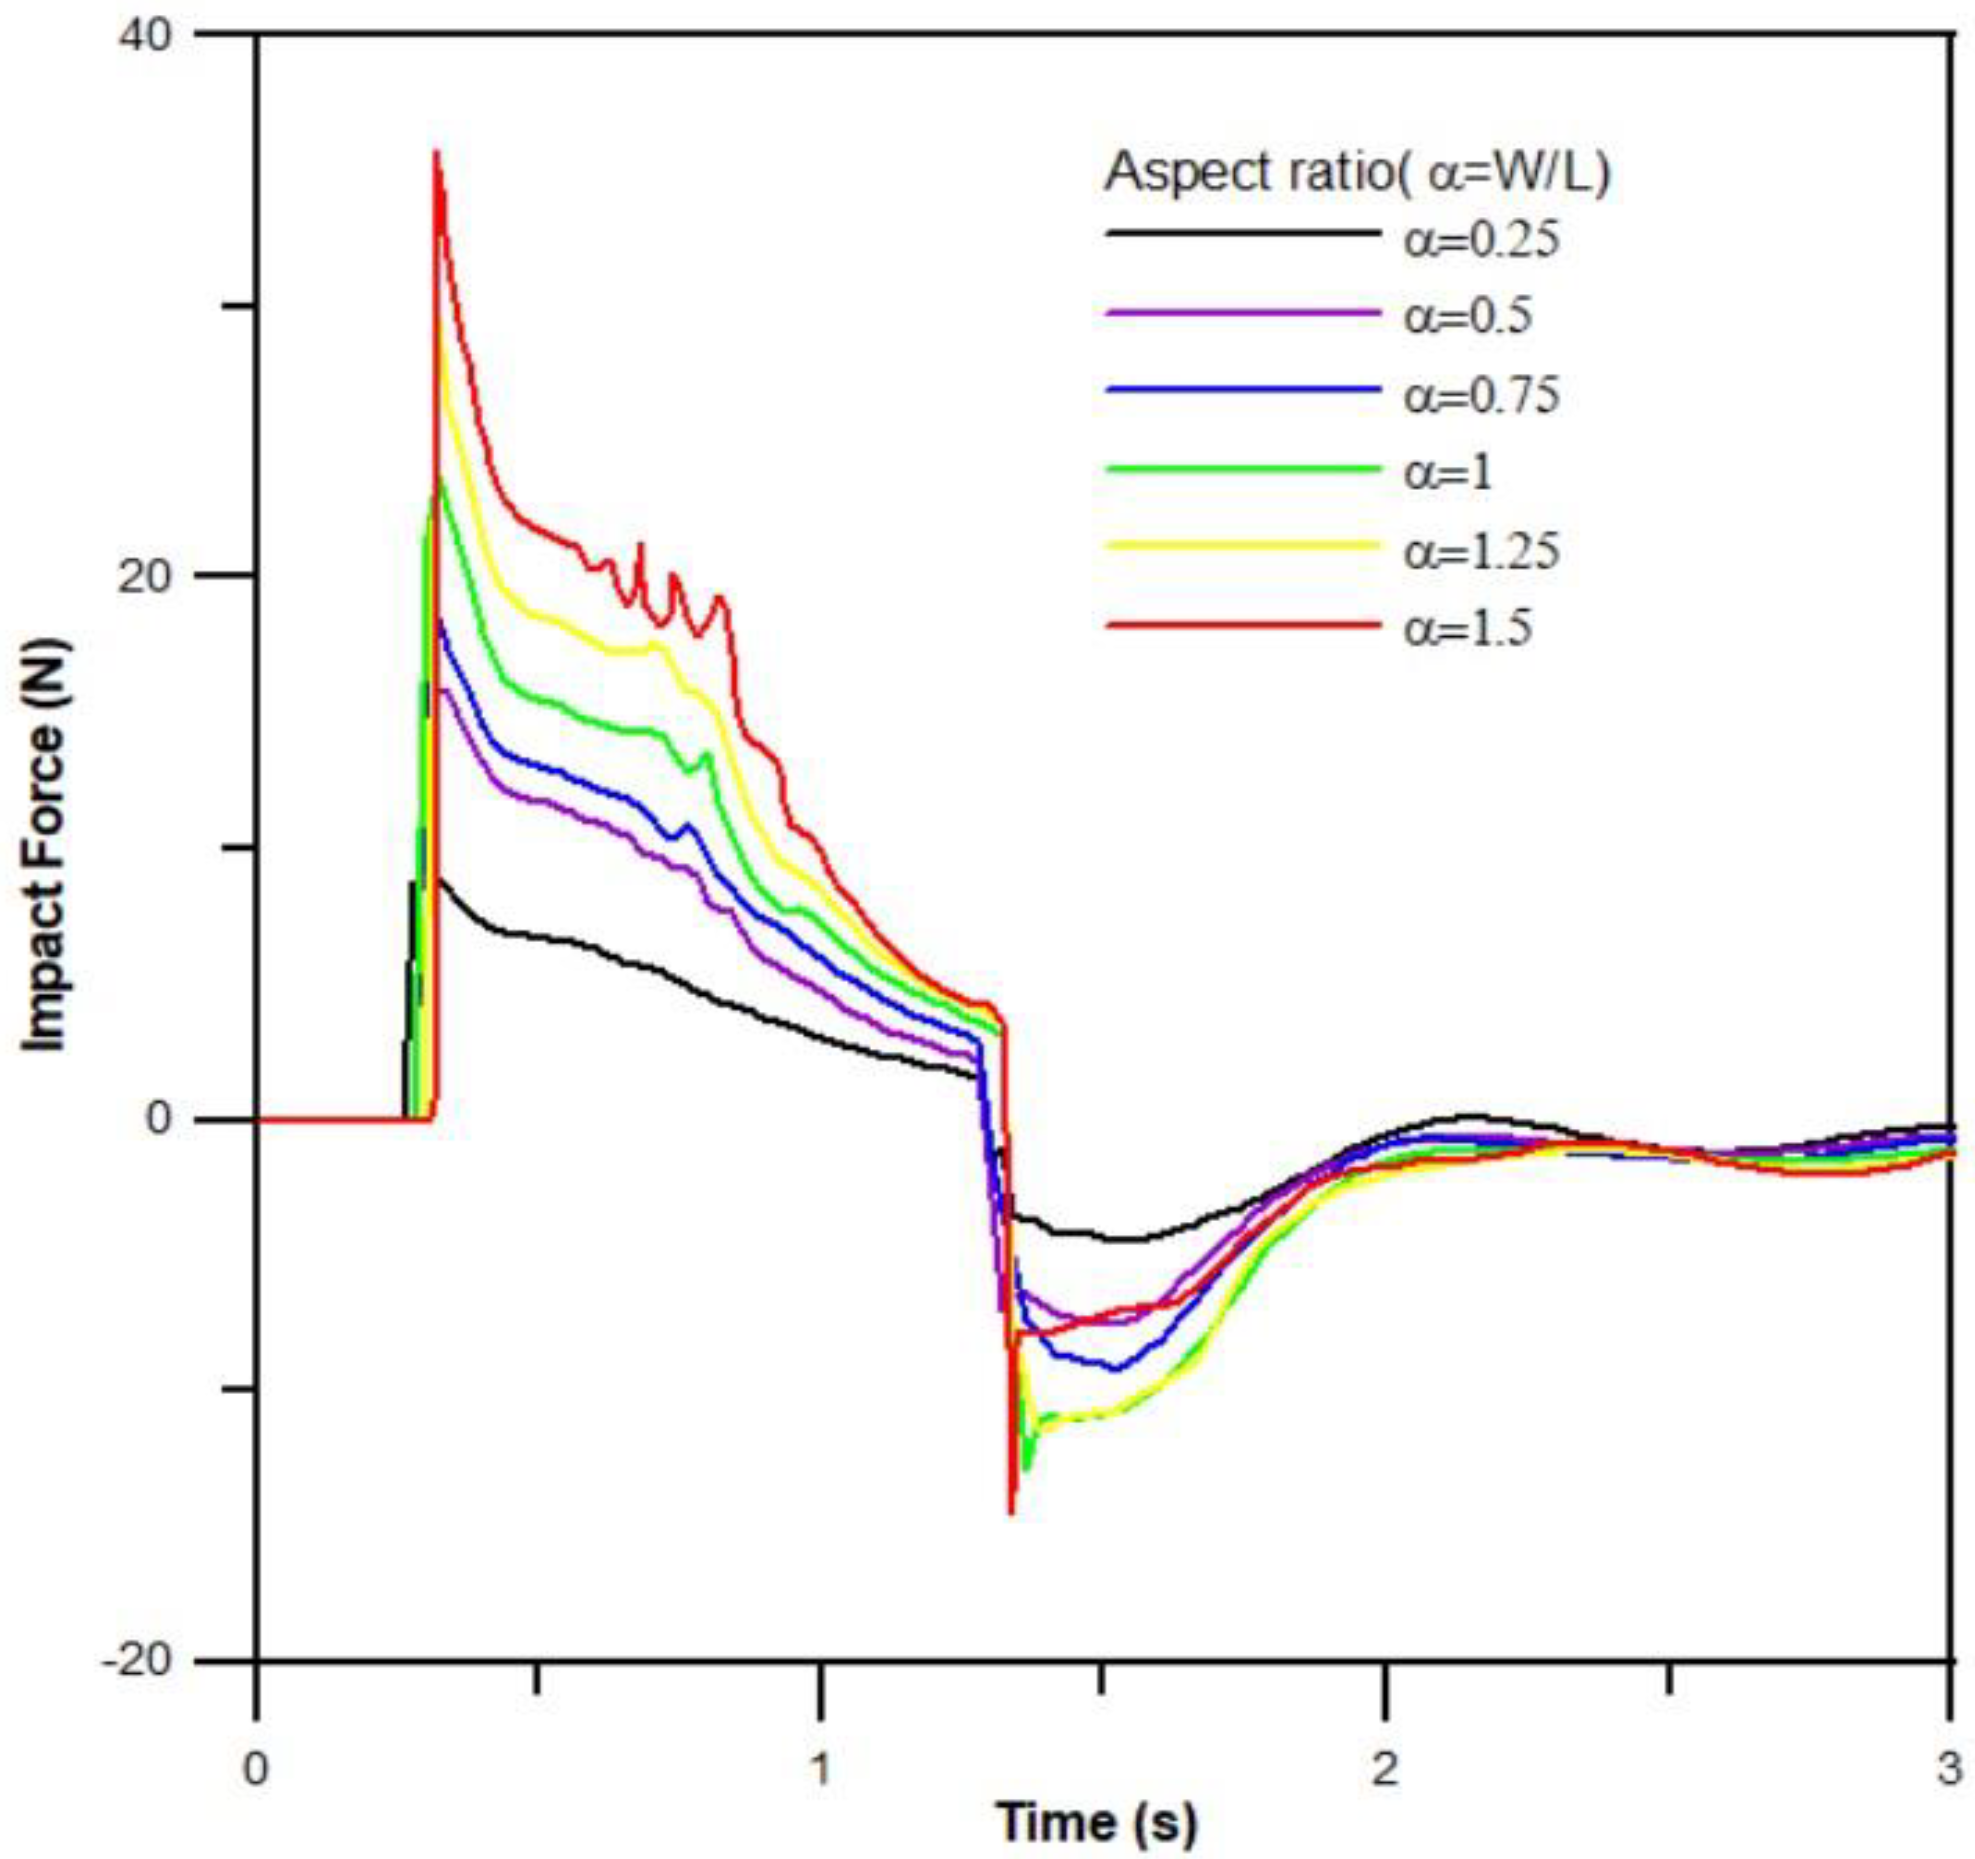
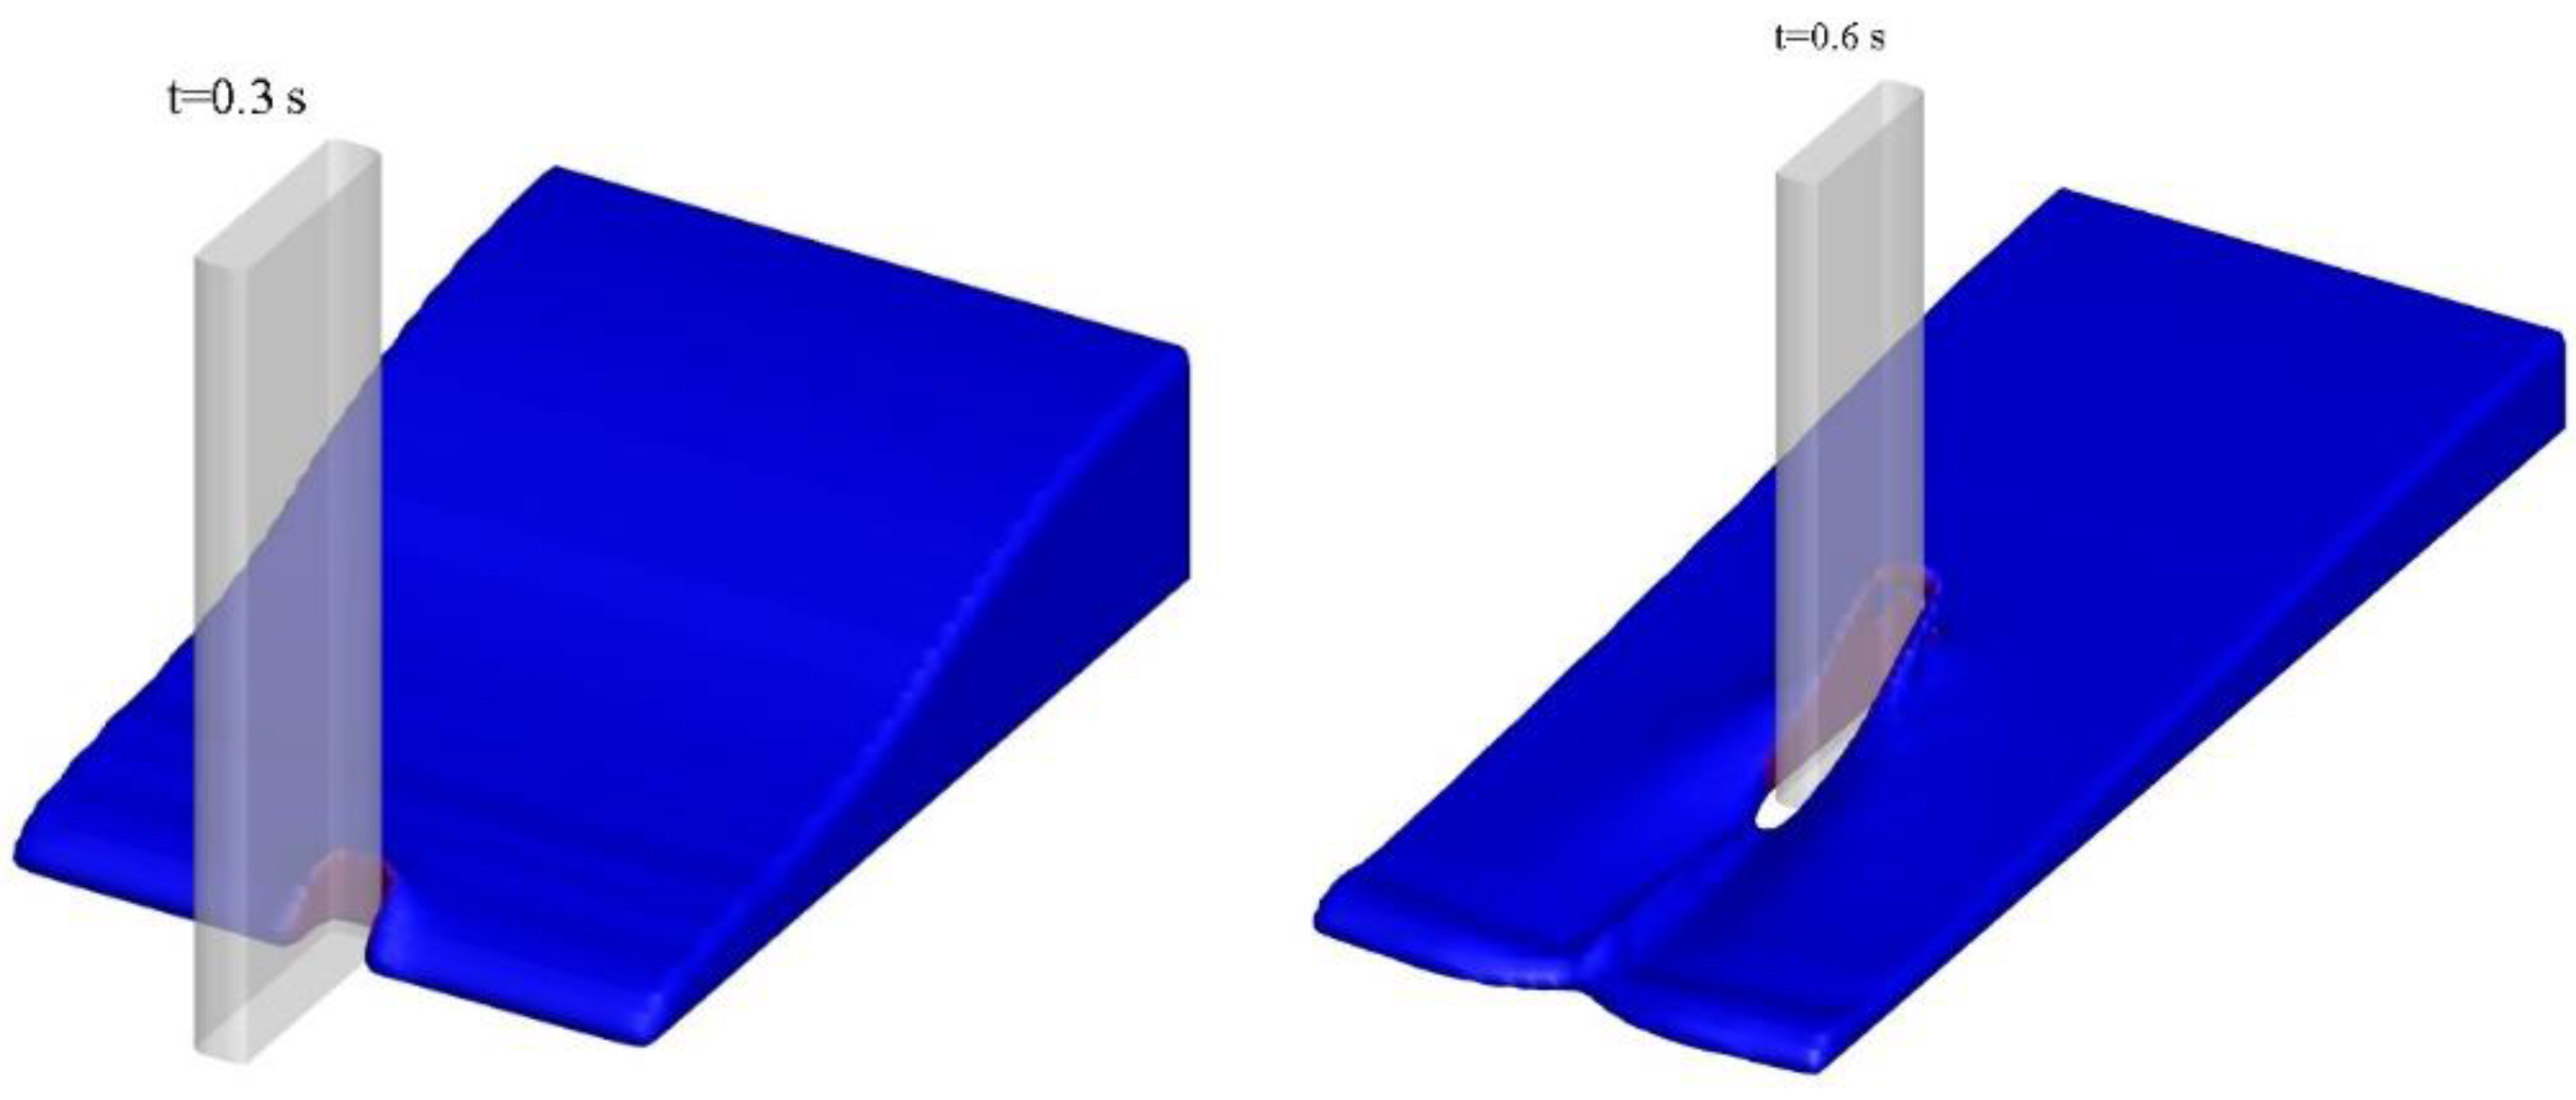
The time history of the impact forces acted on the rectangular cylinder with the aspect ratios between 0.25 and 1.5 are presented in Figure 6. The prediction shows that the force is dominated by the shape parameter expressed by the aspect ratio, which increases with the increase of the aspect ratio. The resistance caused by a thin obstacle is considerably less than the result caused by the blunt shape. The maximum value is given at the time of approximately 0.35 s. In contrast, the negative minimum force appears at the elapsed time of approximately 1.35 s. This indicates the backward flow passing the obstacle caused by the downstream wall. In general, the results reveal that the impact force is sensible to the change of the aspect ratio with the significance for the high value of the aspect ratio. Figure 7 and Figure 8 demonstrate the cases with α = 0.25 and α = 1.5 for the flow patterns of 3D dam-break flows travelling across the vertical rectangular cylinders. Recently, Xie et al. [41] simulated the three-dimensional dam-break flows over a cuboid, cylinder, and sphere, discussing the pressure distributions around structures and hydrodynamic loadings on the structures.
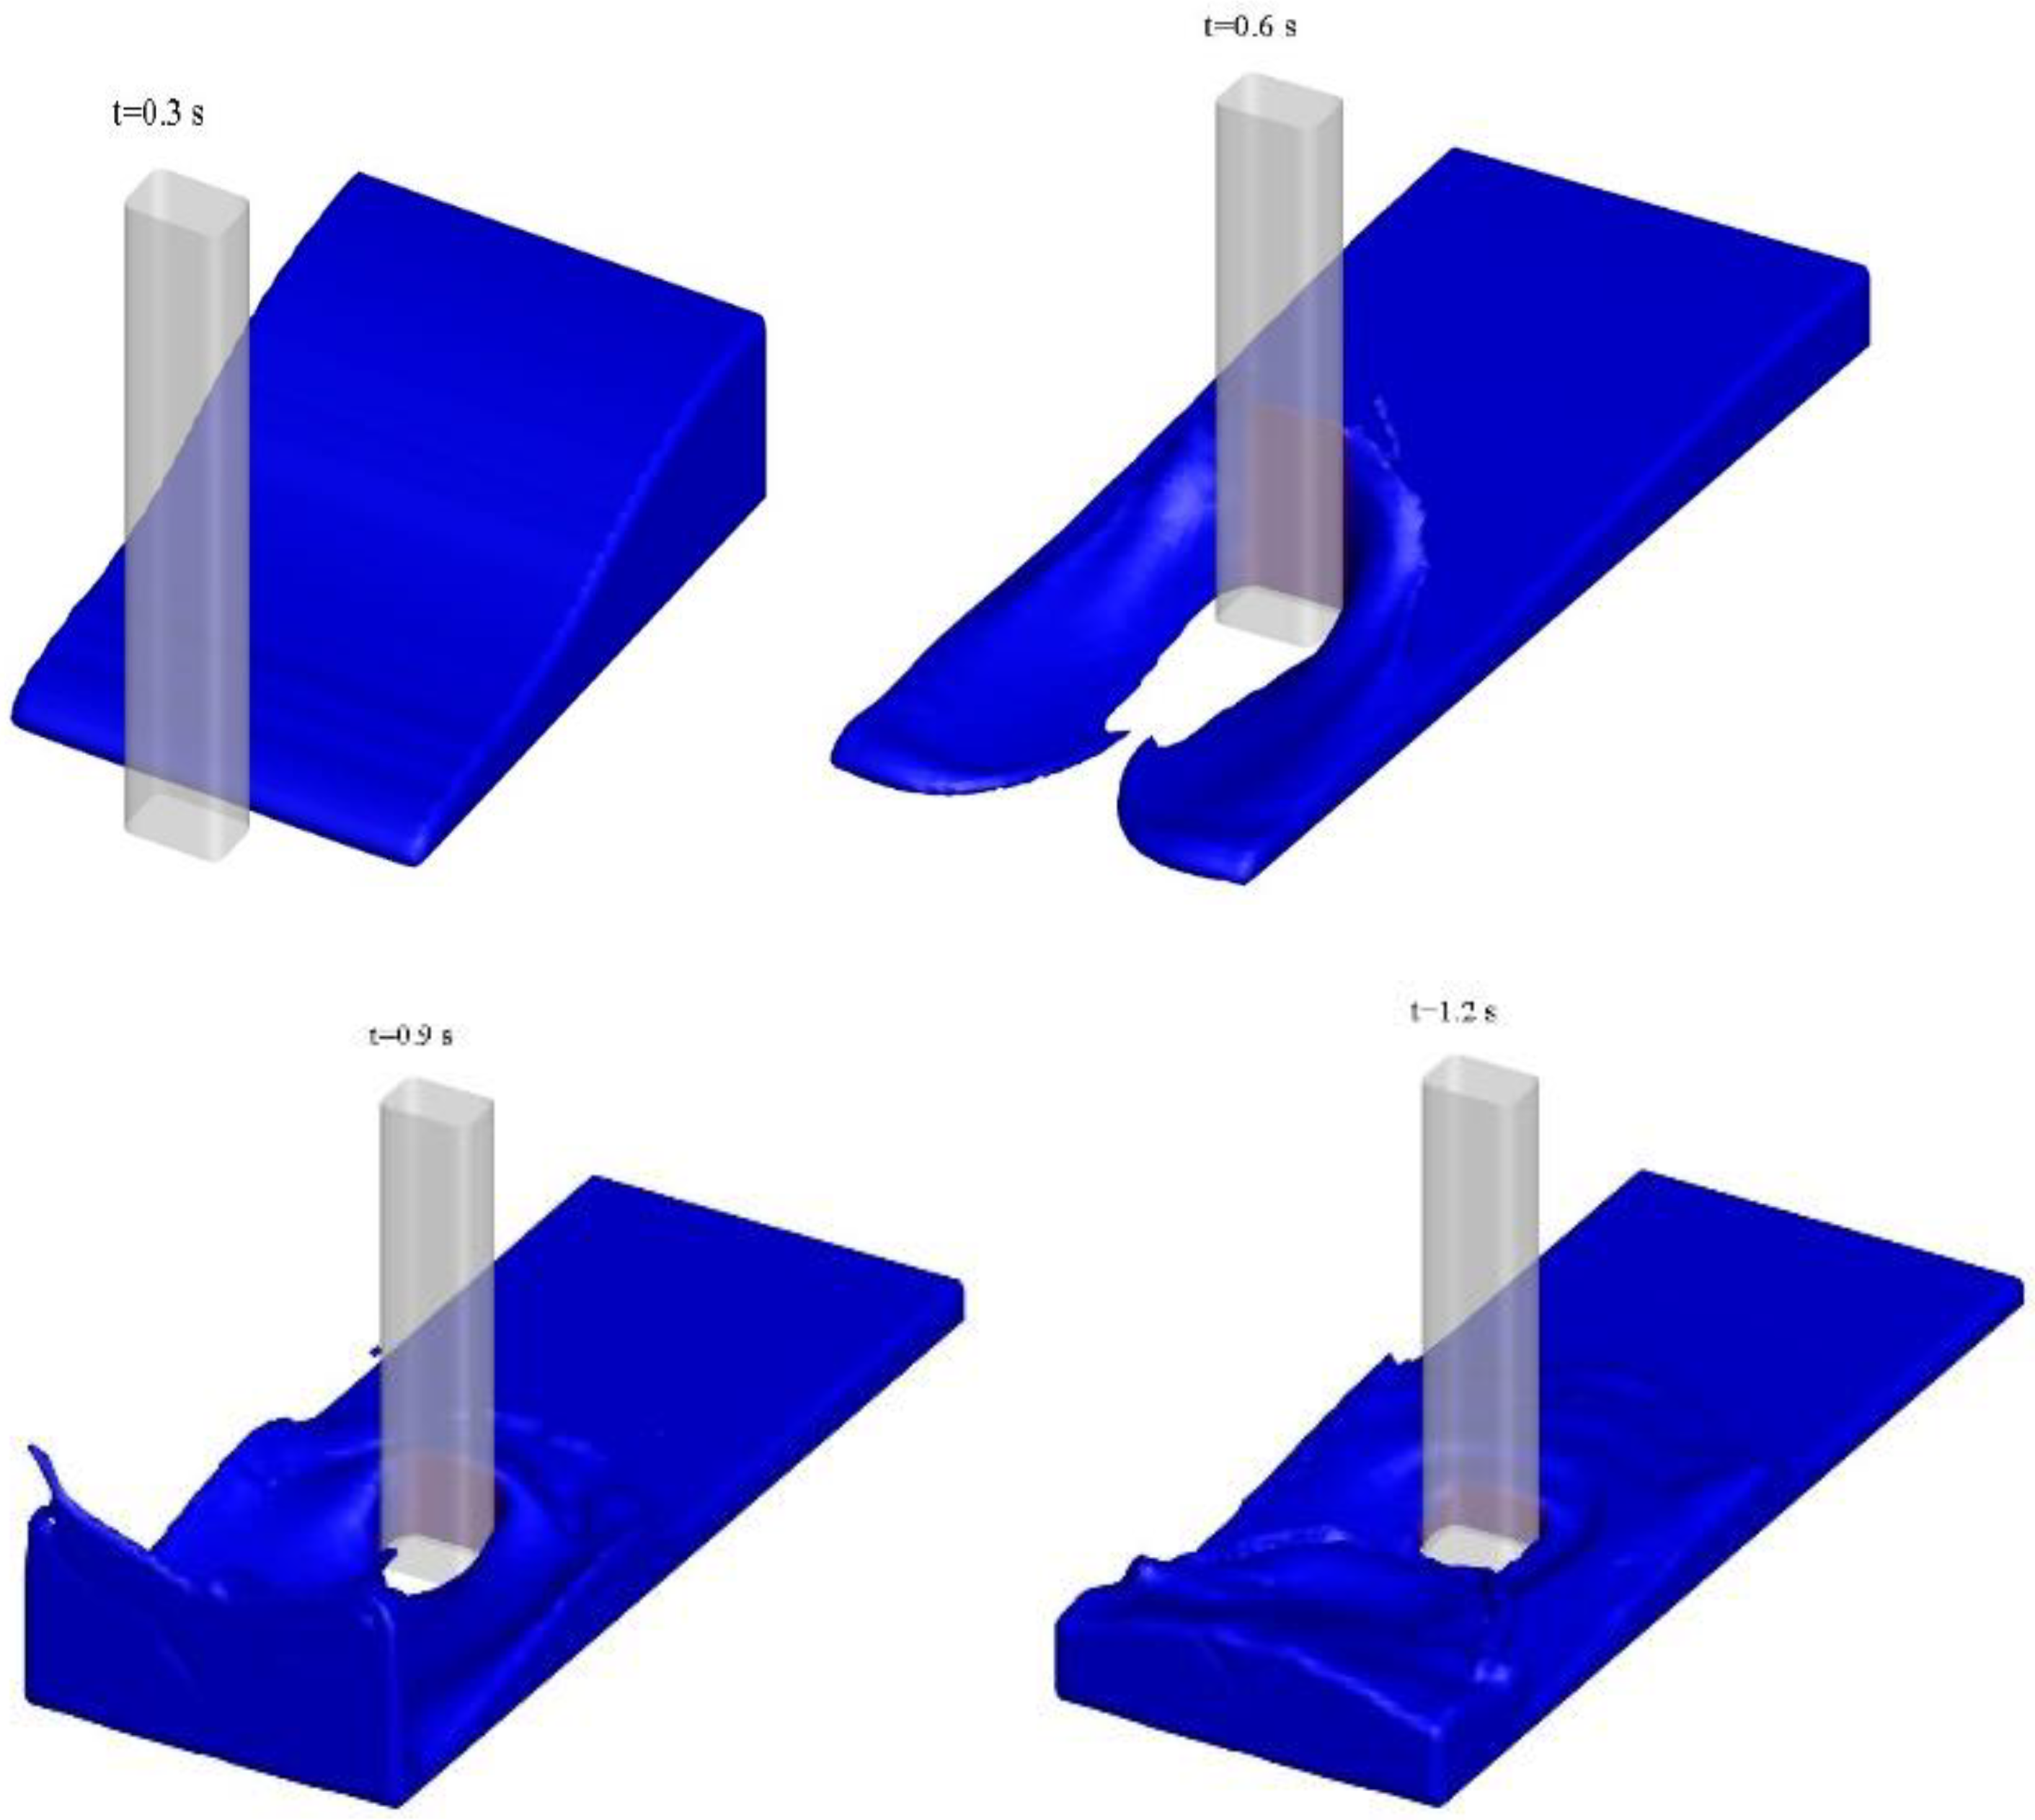
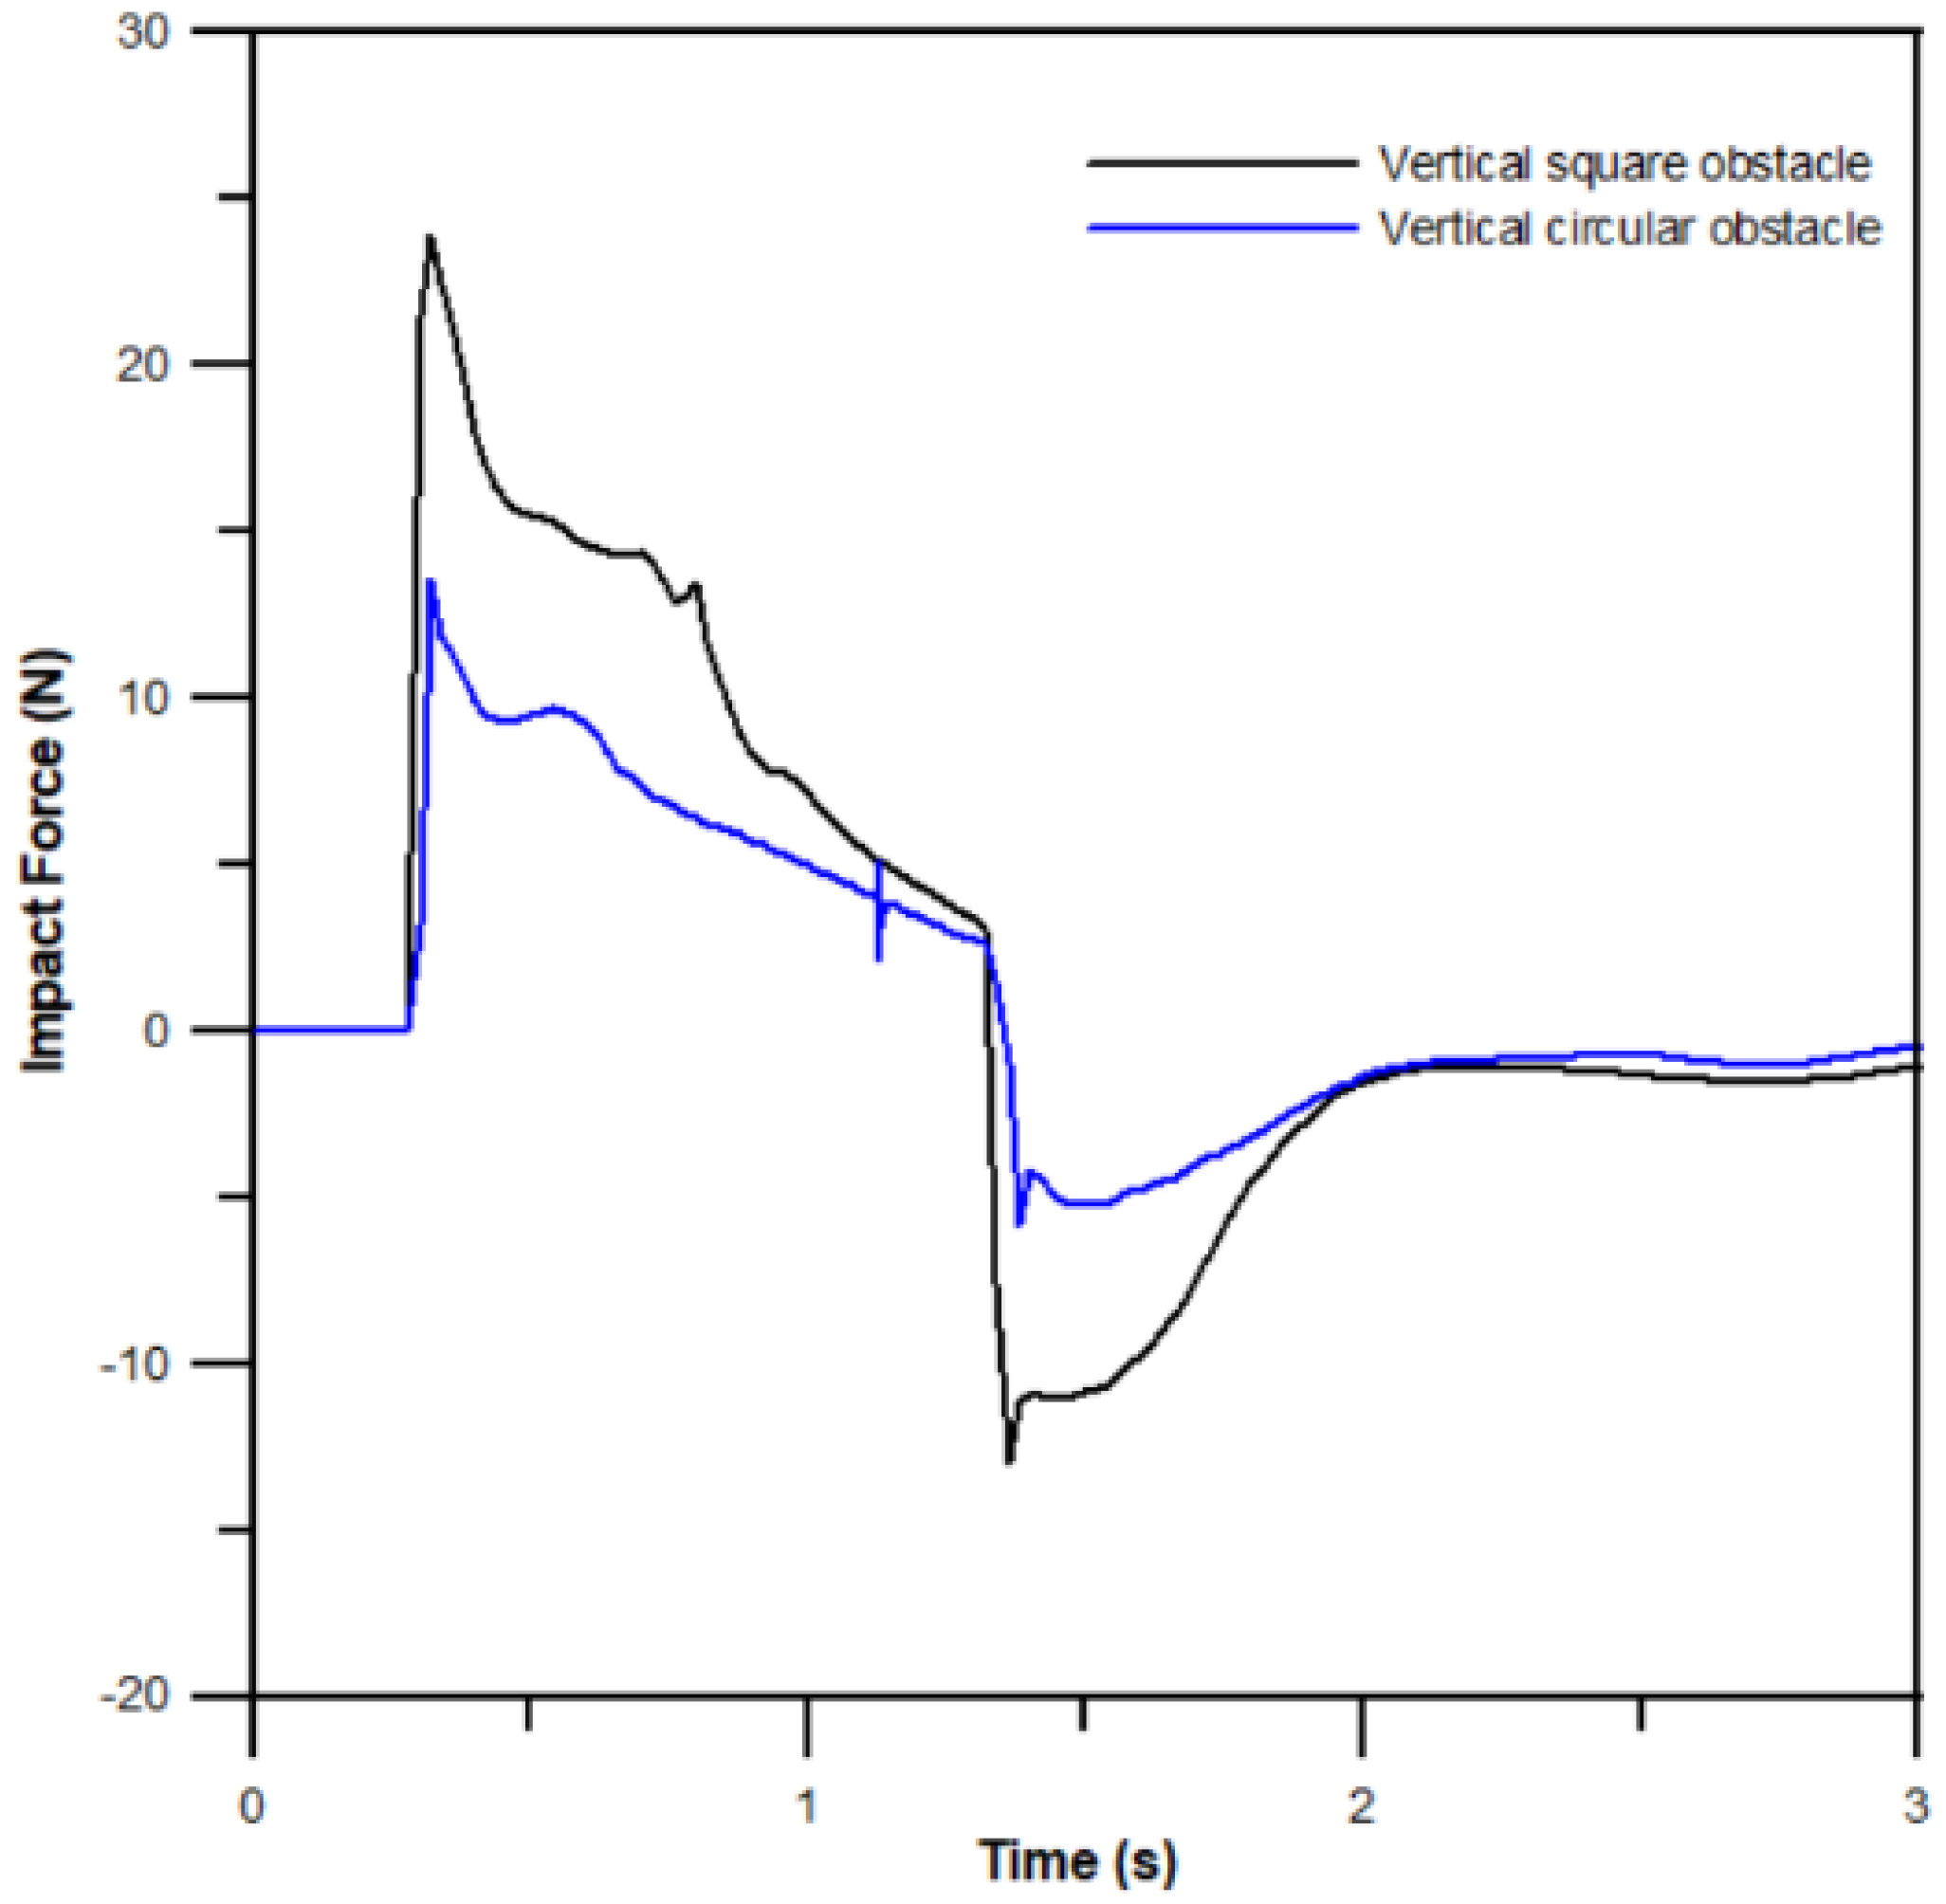
The comparison of the time history of impact forces between the square and circular obstacles is depicted in Figure 9, showing similar distributions. It is no doubt that when the free surface flows past the circular cylinder obstacle, the magnitude of the impact force is significant smaller than the square object due to the reduced drag associated with the aerodynamic shape. Figure 10 demonstrates the spatial variations of the free-surface elevations from t = 0.3 s to t = 1.2 s obtained from the present model. In comparison to the images between Figure 3 and Figure 10 at t = 0.6 s, it is clear that the larger impact fore given by the rectangular cylinder is due to the significant wakes behind the solid body.

3.2. Partial Dam-Break Flow

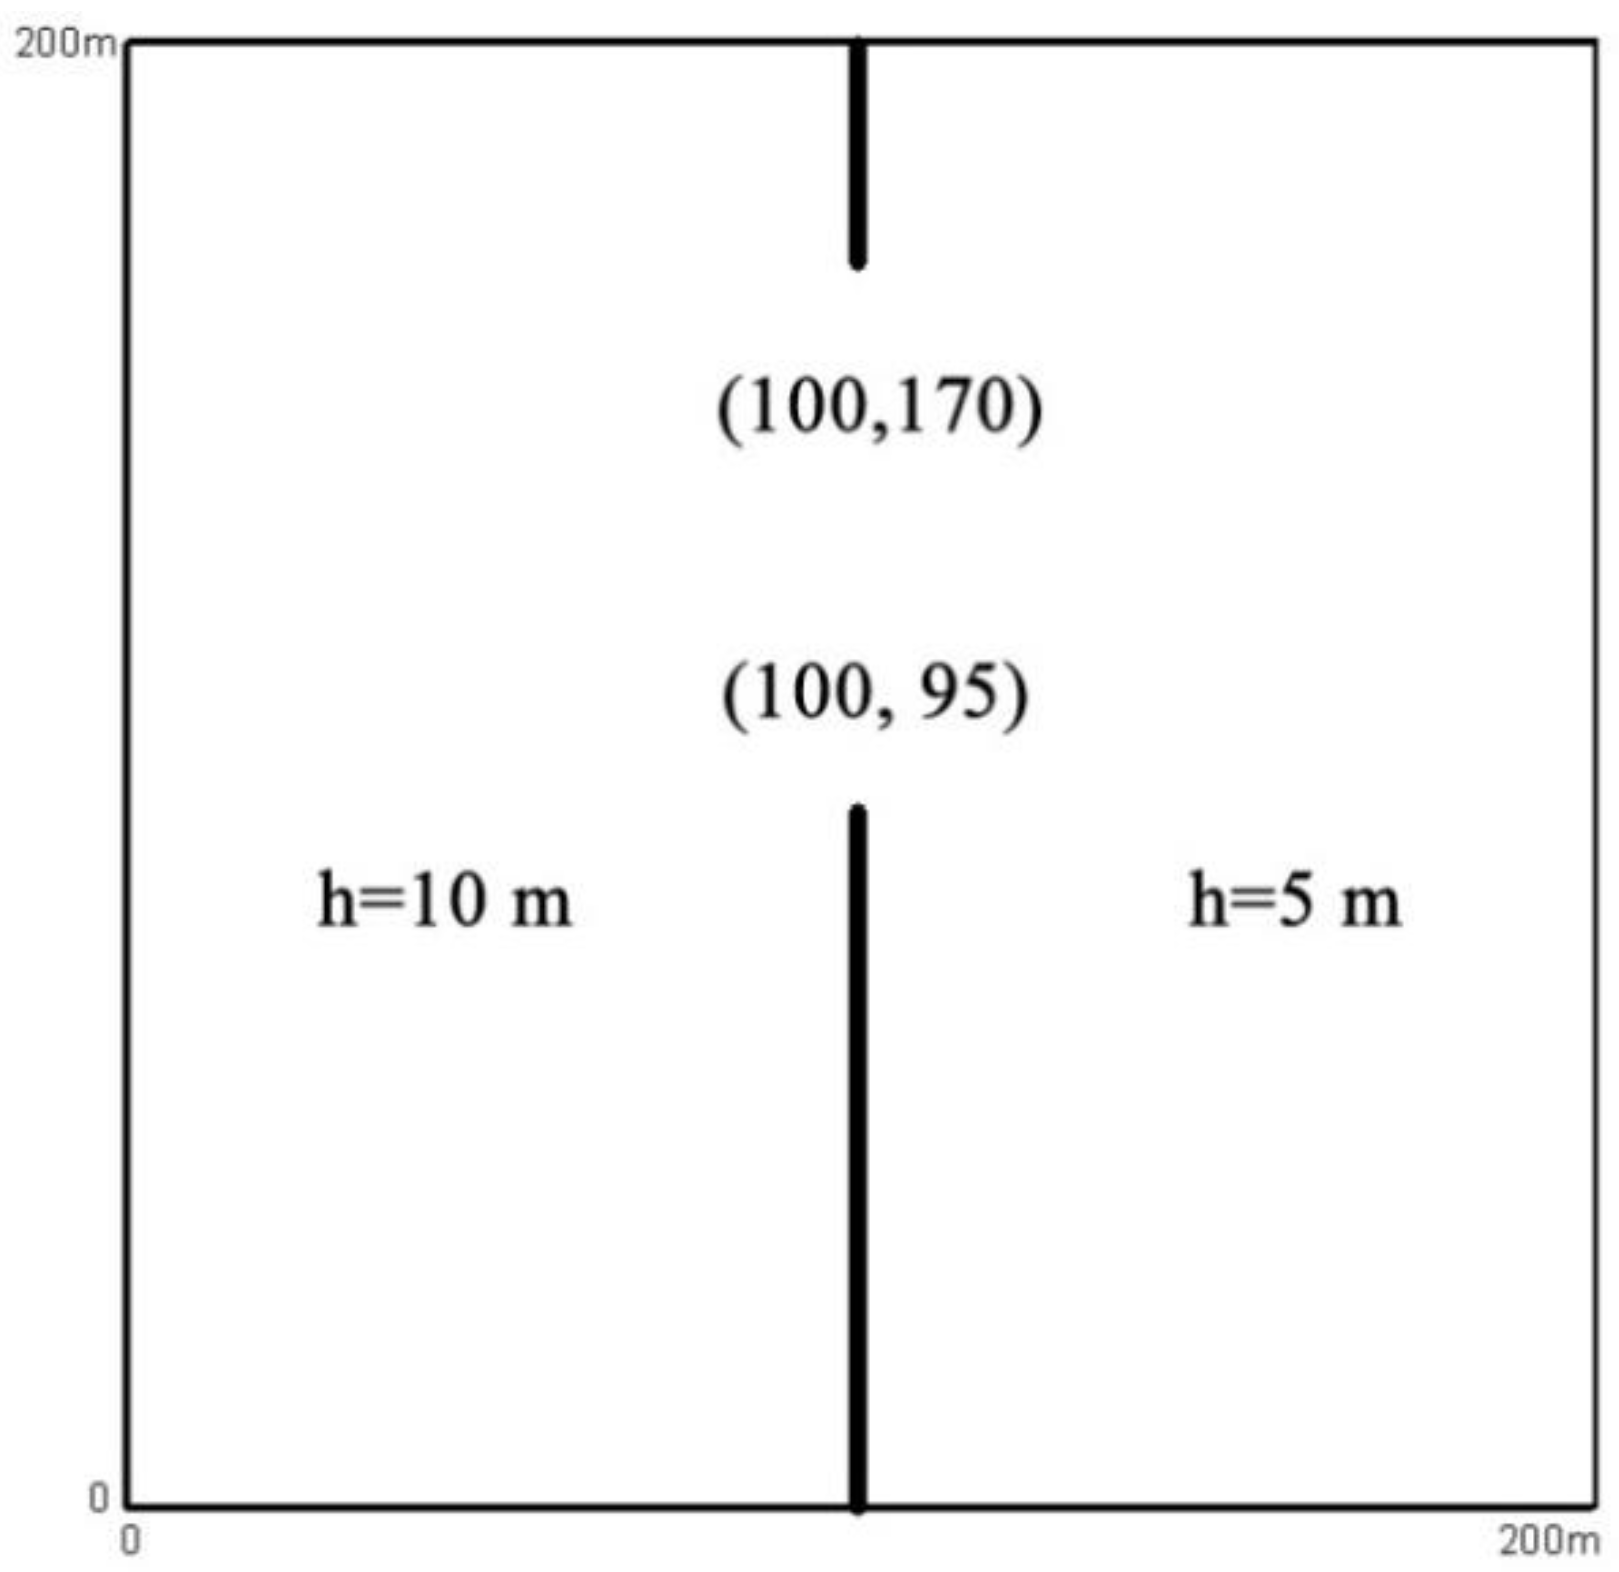
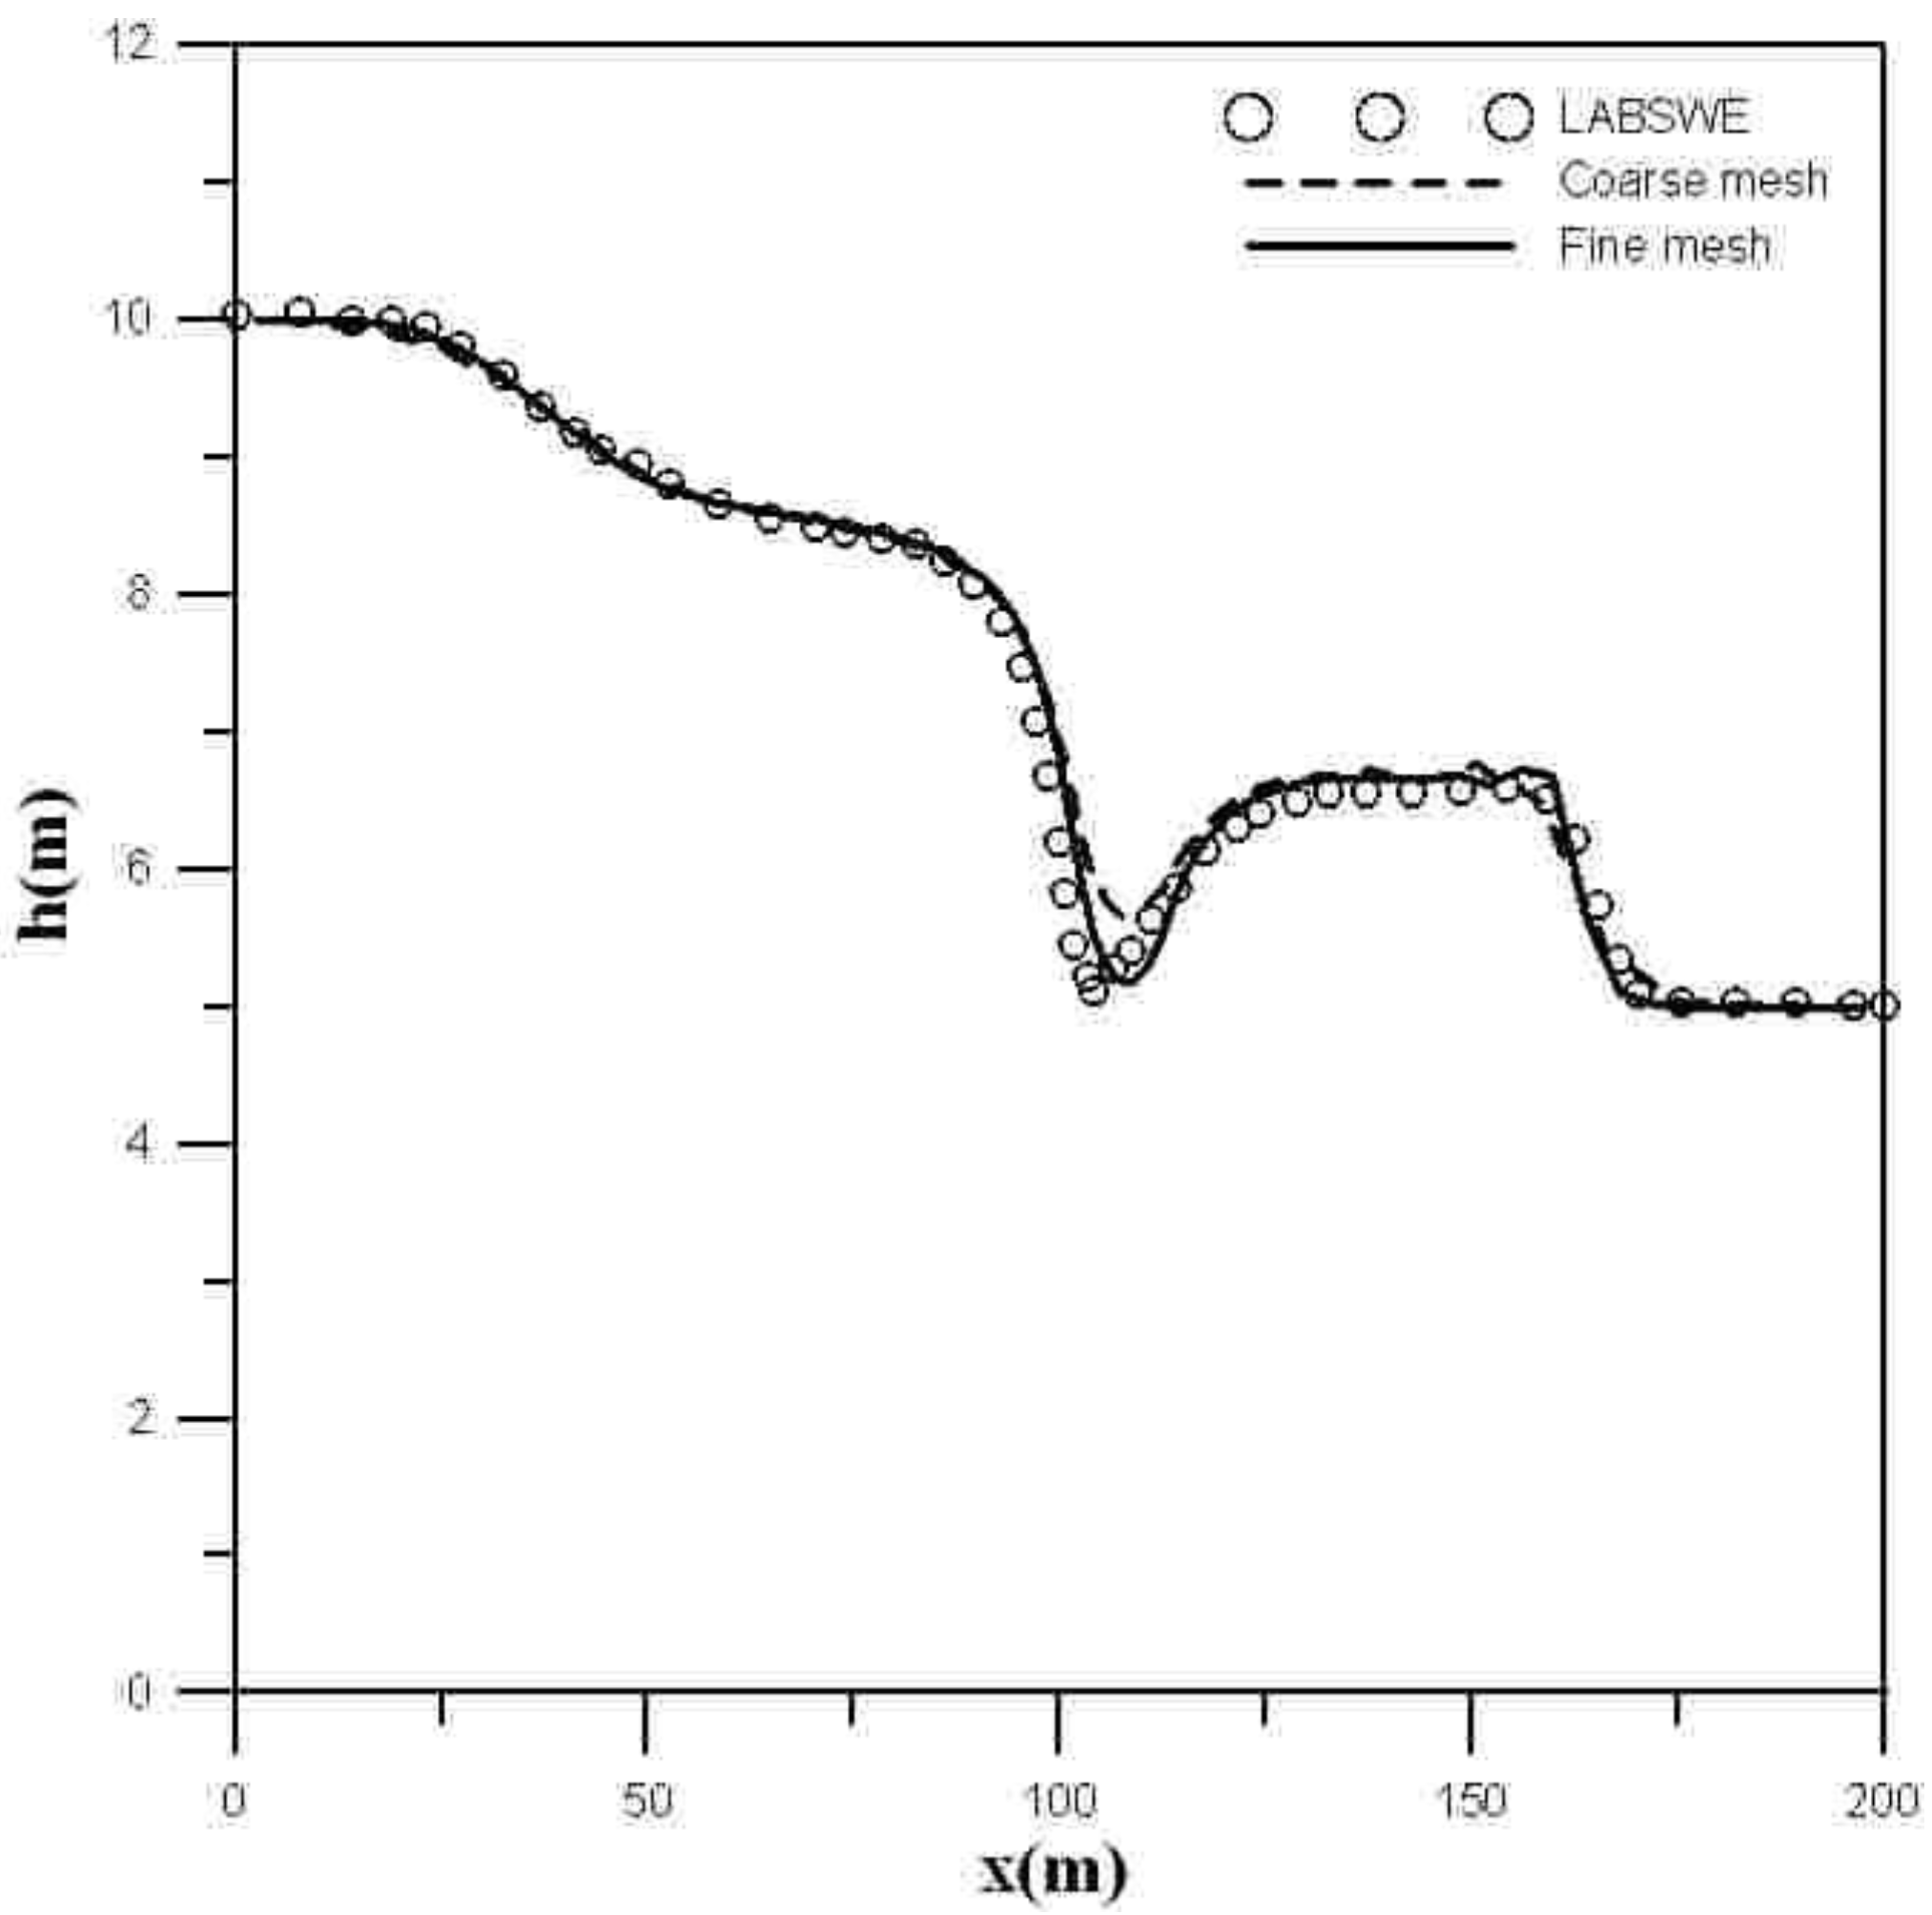
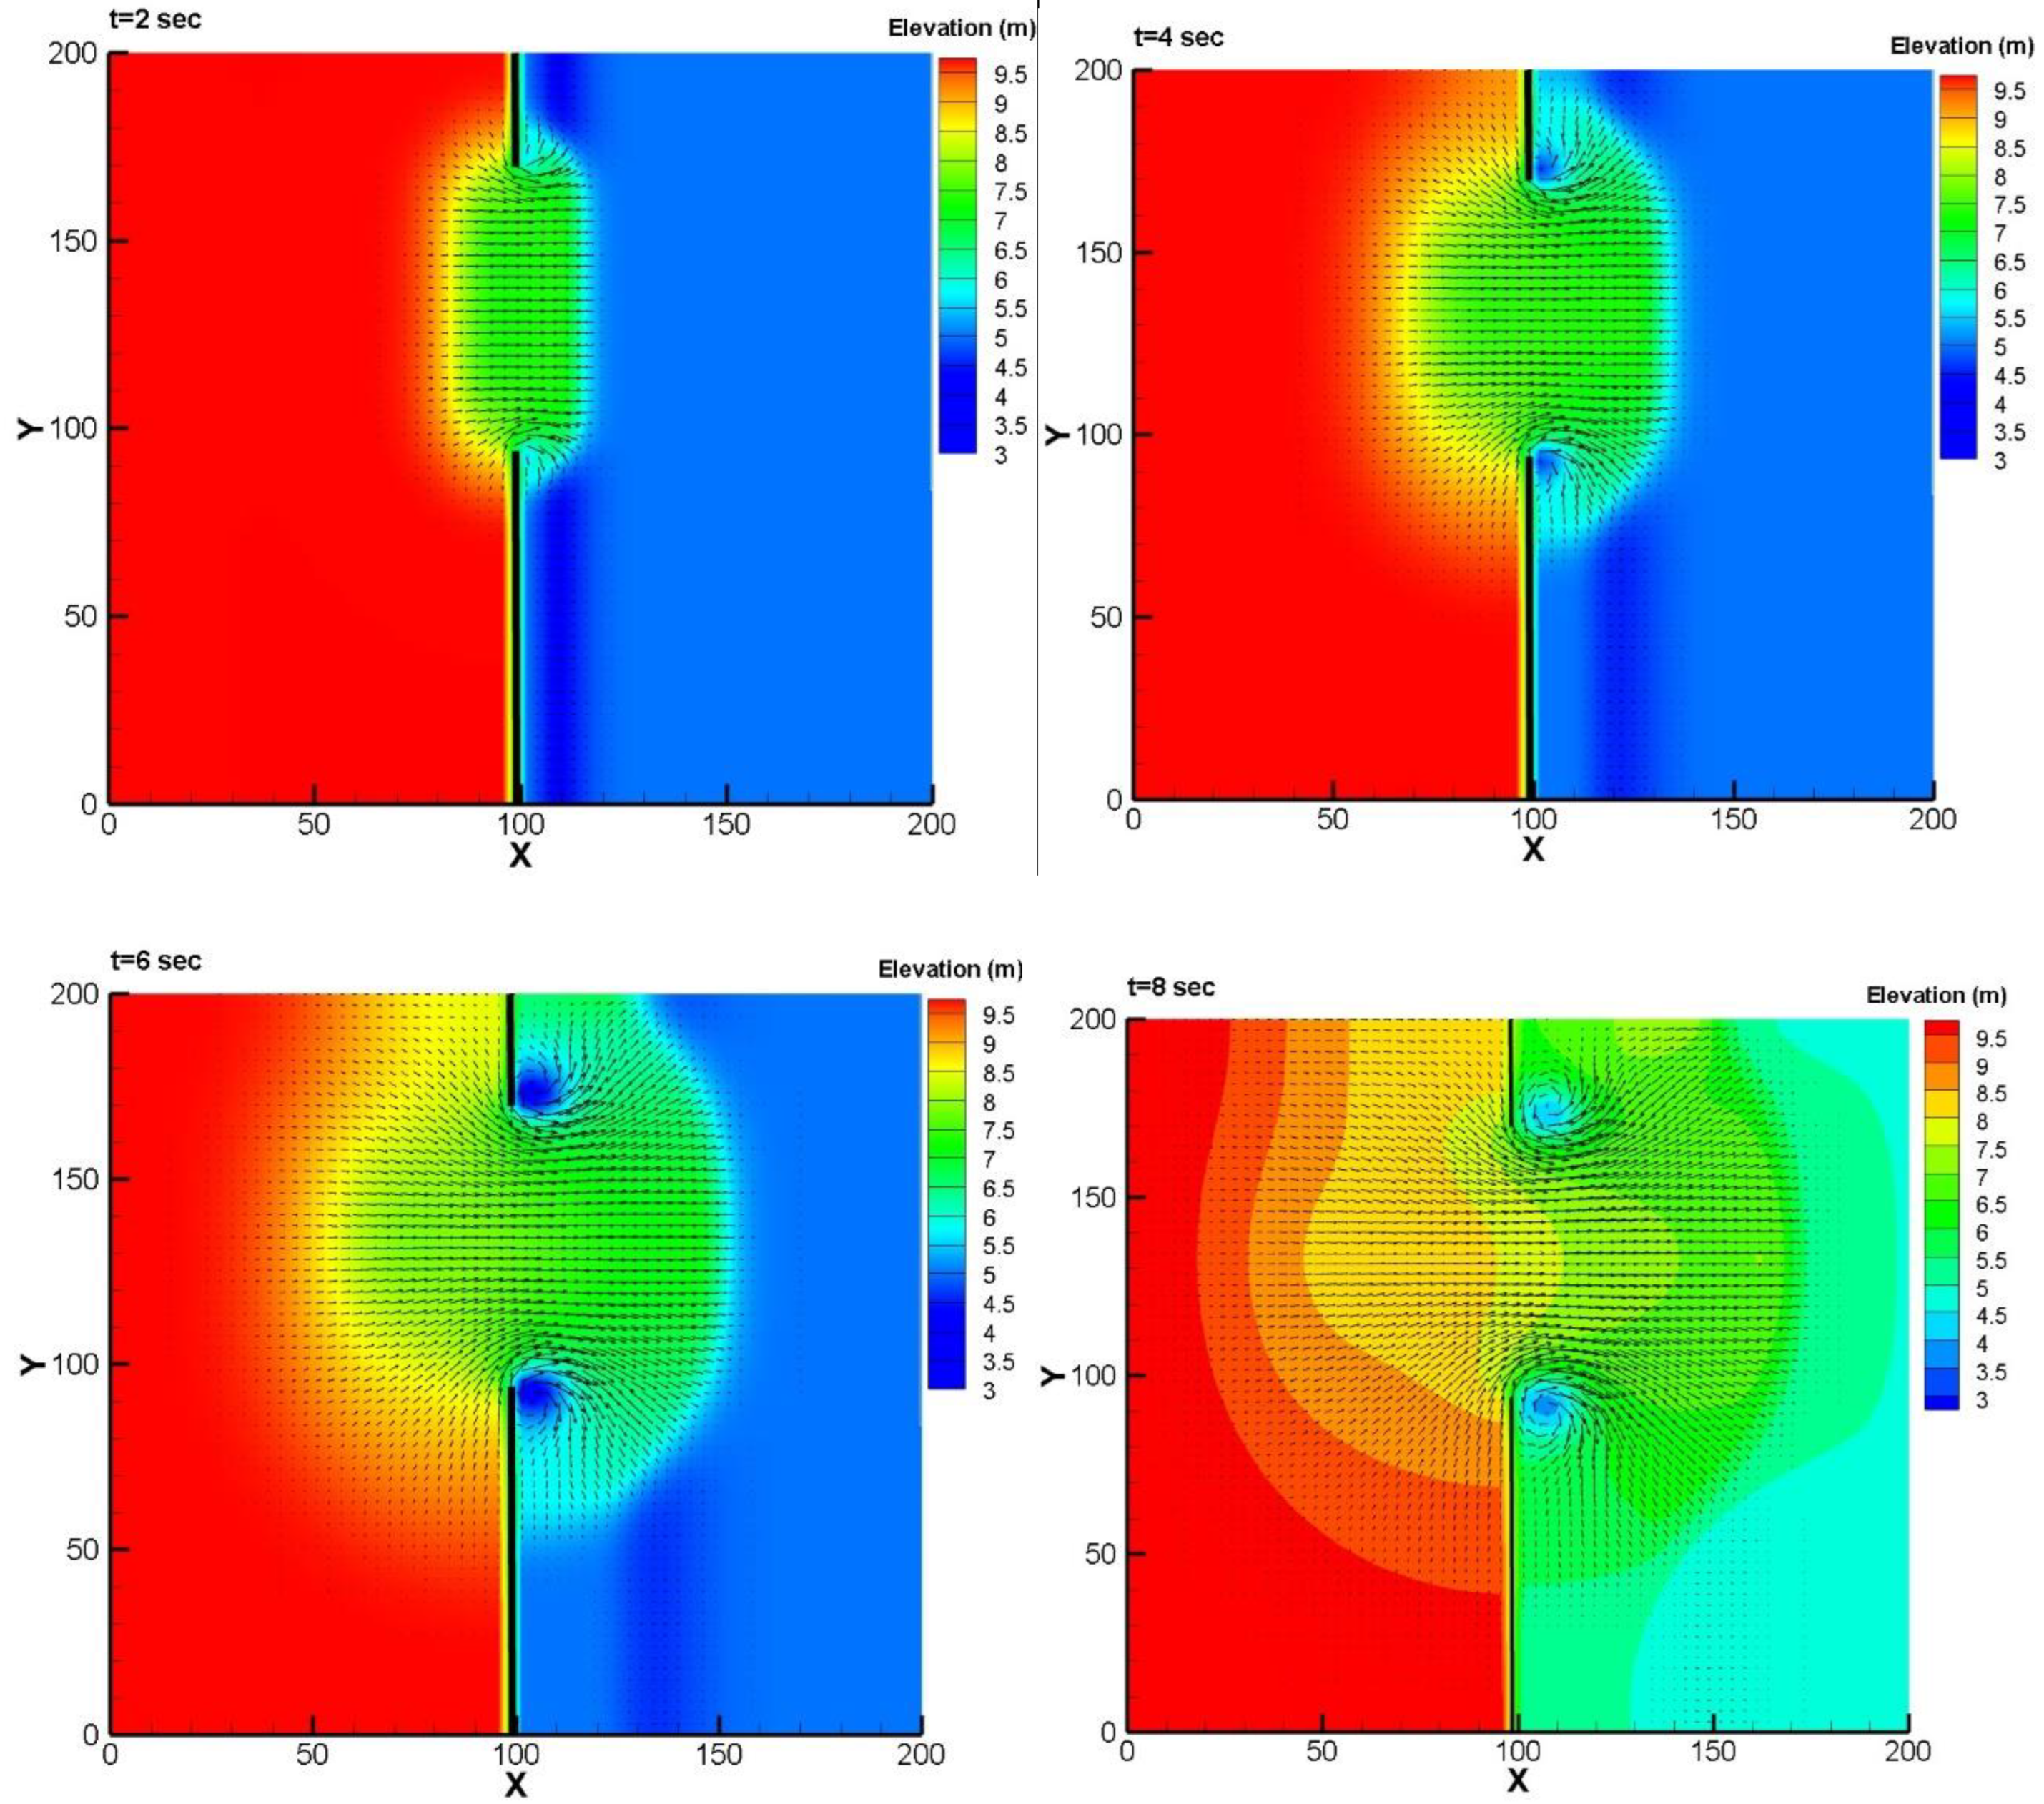
A benchmark study of a partial dam break flow was modeled by Fennema and Chaudhry (1990) [42] for the sudden failure of a dam or instantaneously opening a sluice gate. The wet conditions for the upstream and downstream of the gate are imposed with water depths of 10 m and 5 m, respectively. The lattice Boltzmann method for shallow water equations (LABSWE) were used to solve the two-dimensional shallow water equations, with a computational domain of the flume with 200 m × 200 m. For the present case study, the boundary condition was carefully established with the no-slip velocity at walls and periodic and zero-gradient conditions for inflow and outflow boundaries during the computational process. The dam broke at time t = 0 s with a breach width of 75 m, as sketched in Figure 11. The simulation of the resultant water depth along the central line, with respect to the downstream distance, was compared with the results obtained by the LABSWE [42], as shown in Figure 12. Two grid sizes with the cell numbers of 51 × 51 × 6 and 201 × 201 × 21 were employed to conduct the modeling. It is observed that the fine grid system shows a better agreement when compared with the computation using LABSWE [42], particularly for the sudden drop of the water surface at the downstream distance around x = 100 m. The evolution of the free-surface elevation and distribution of depth-averaged velocity vector are shown in Figure 13. Under the assumption of the incompressible fluid and non-hydrostatic pressure distribution, the present 3D solver improves the capability of predicting the fine flow structures shown by the flow separations with the clearly sequential development observed in Figure 13 at the edges downstream of the partial broken dam.

3.3. Dam-Break Surge Passing Four Aligned Square or Circular Cylinders

Frandsen [43] employed the lattice Boltzmann model to simulate a surge induced by the partial dam failure passing three surface-piercing square cylinders. A similar simulation was computed for a dam-break surge, passing the downstream obstacles of four aligned square or circular cylinders. Figure 14 exhibits the domain layouts and initial conditions. The bottom wall is given with the frictionless bed. The computational domain is composed of a 200 m × 200 m, with the dam located at x = 100 m and the cylinder centers positioned at (150, 40) m, (150, 80) m, (150, 120) m, and (150, 160) m, respectively. The length and diameter are 20 m for the four squares and circular cylinders. The water level in the domain is initially still with depths of 10 m and 5 m upstream and downstream of the dam. The edge length of these square cylinders and diameter of these circular cylinders are 10 m. The computation considers the bottom slope of Sx = 0.02 in the x direction in the area downstream of the dam. The same boundary conditions are used as described in Section 3.2. Figure 15 shows the time history of the impact force on each square and circular cylinder. As expected, the square and circular cylinders at the far side, marked as 1, reveal the smaller force loadings on the bodies, which monochromatically increases with the time between 0 to 10 s. The other three cylinders marked as 2 to 3 demonstrate analogous variations of the impact forces with time, with the appearance of the force peaks as depicted in Figure 15b–d.
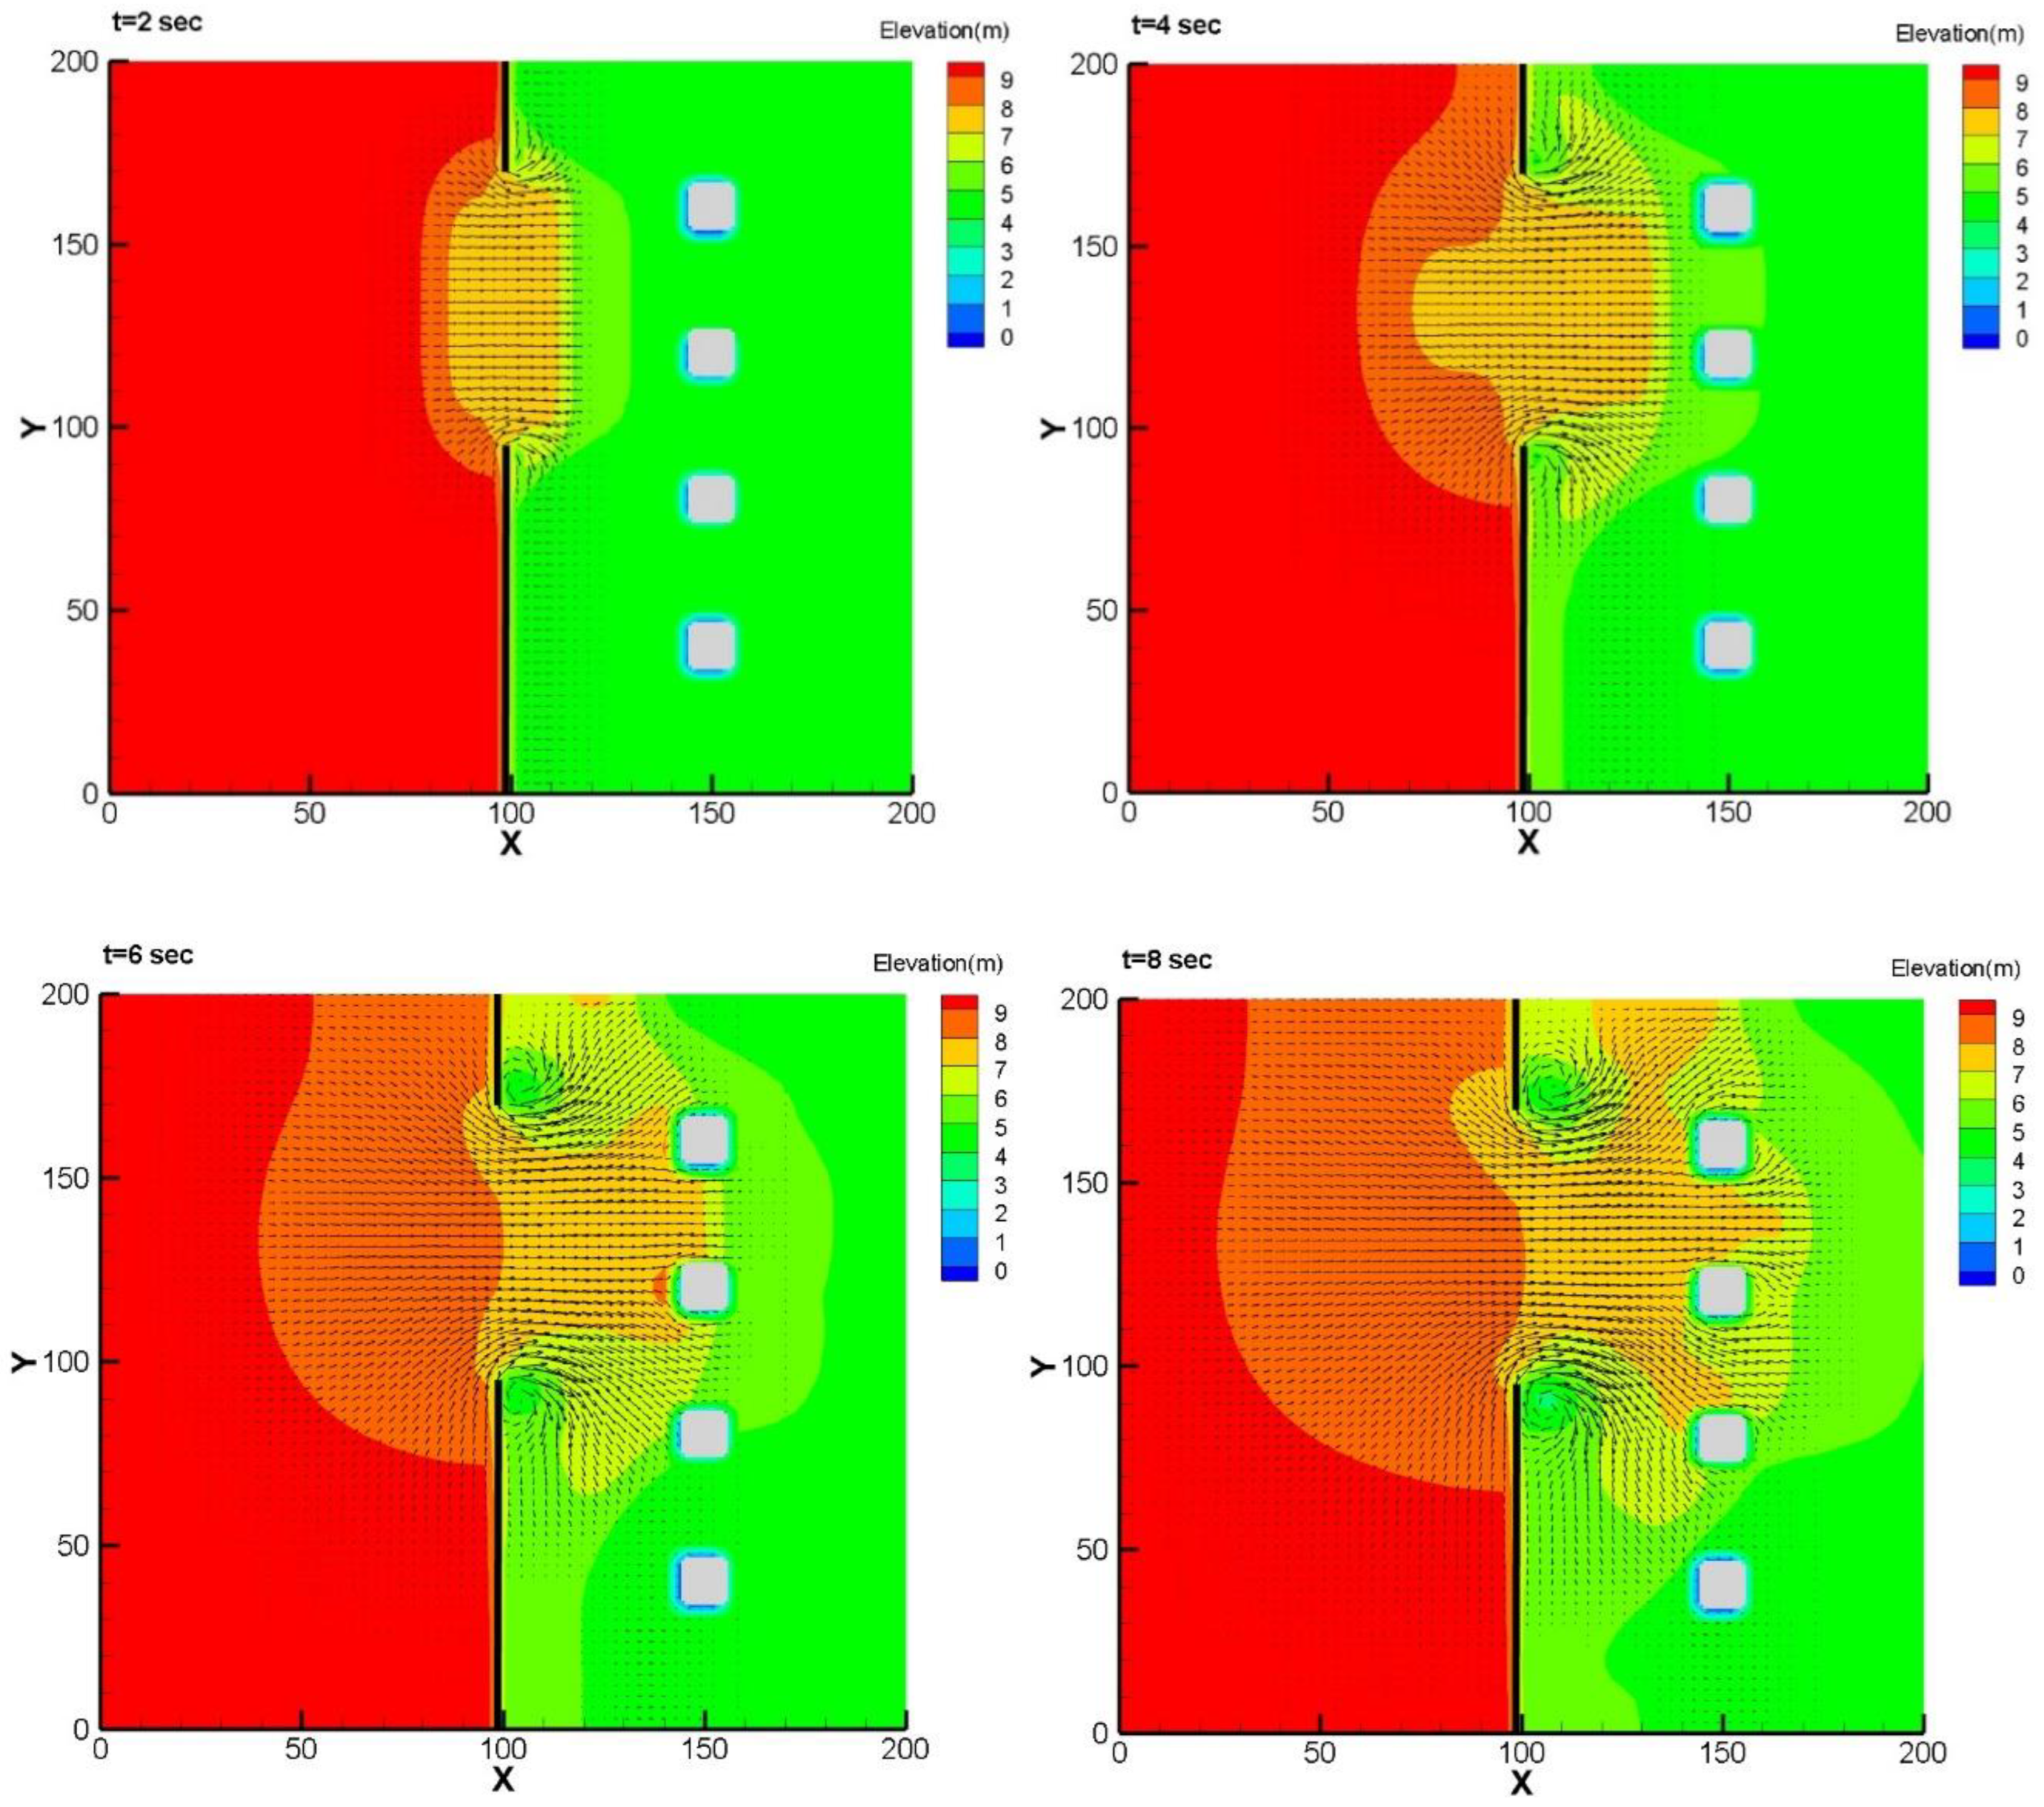
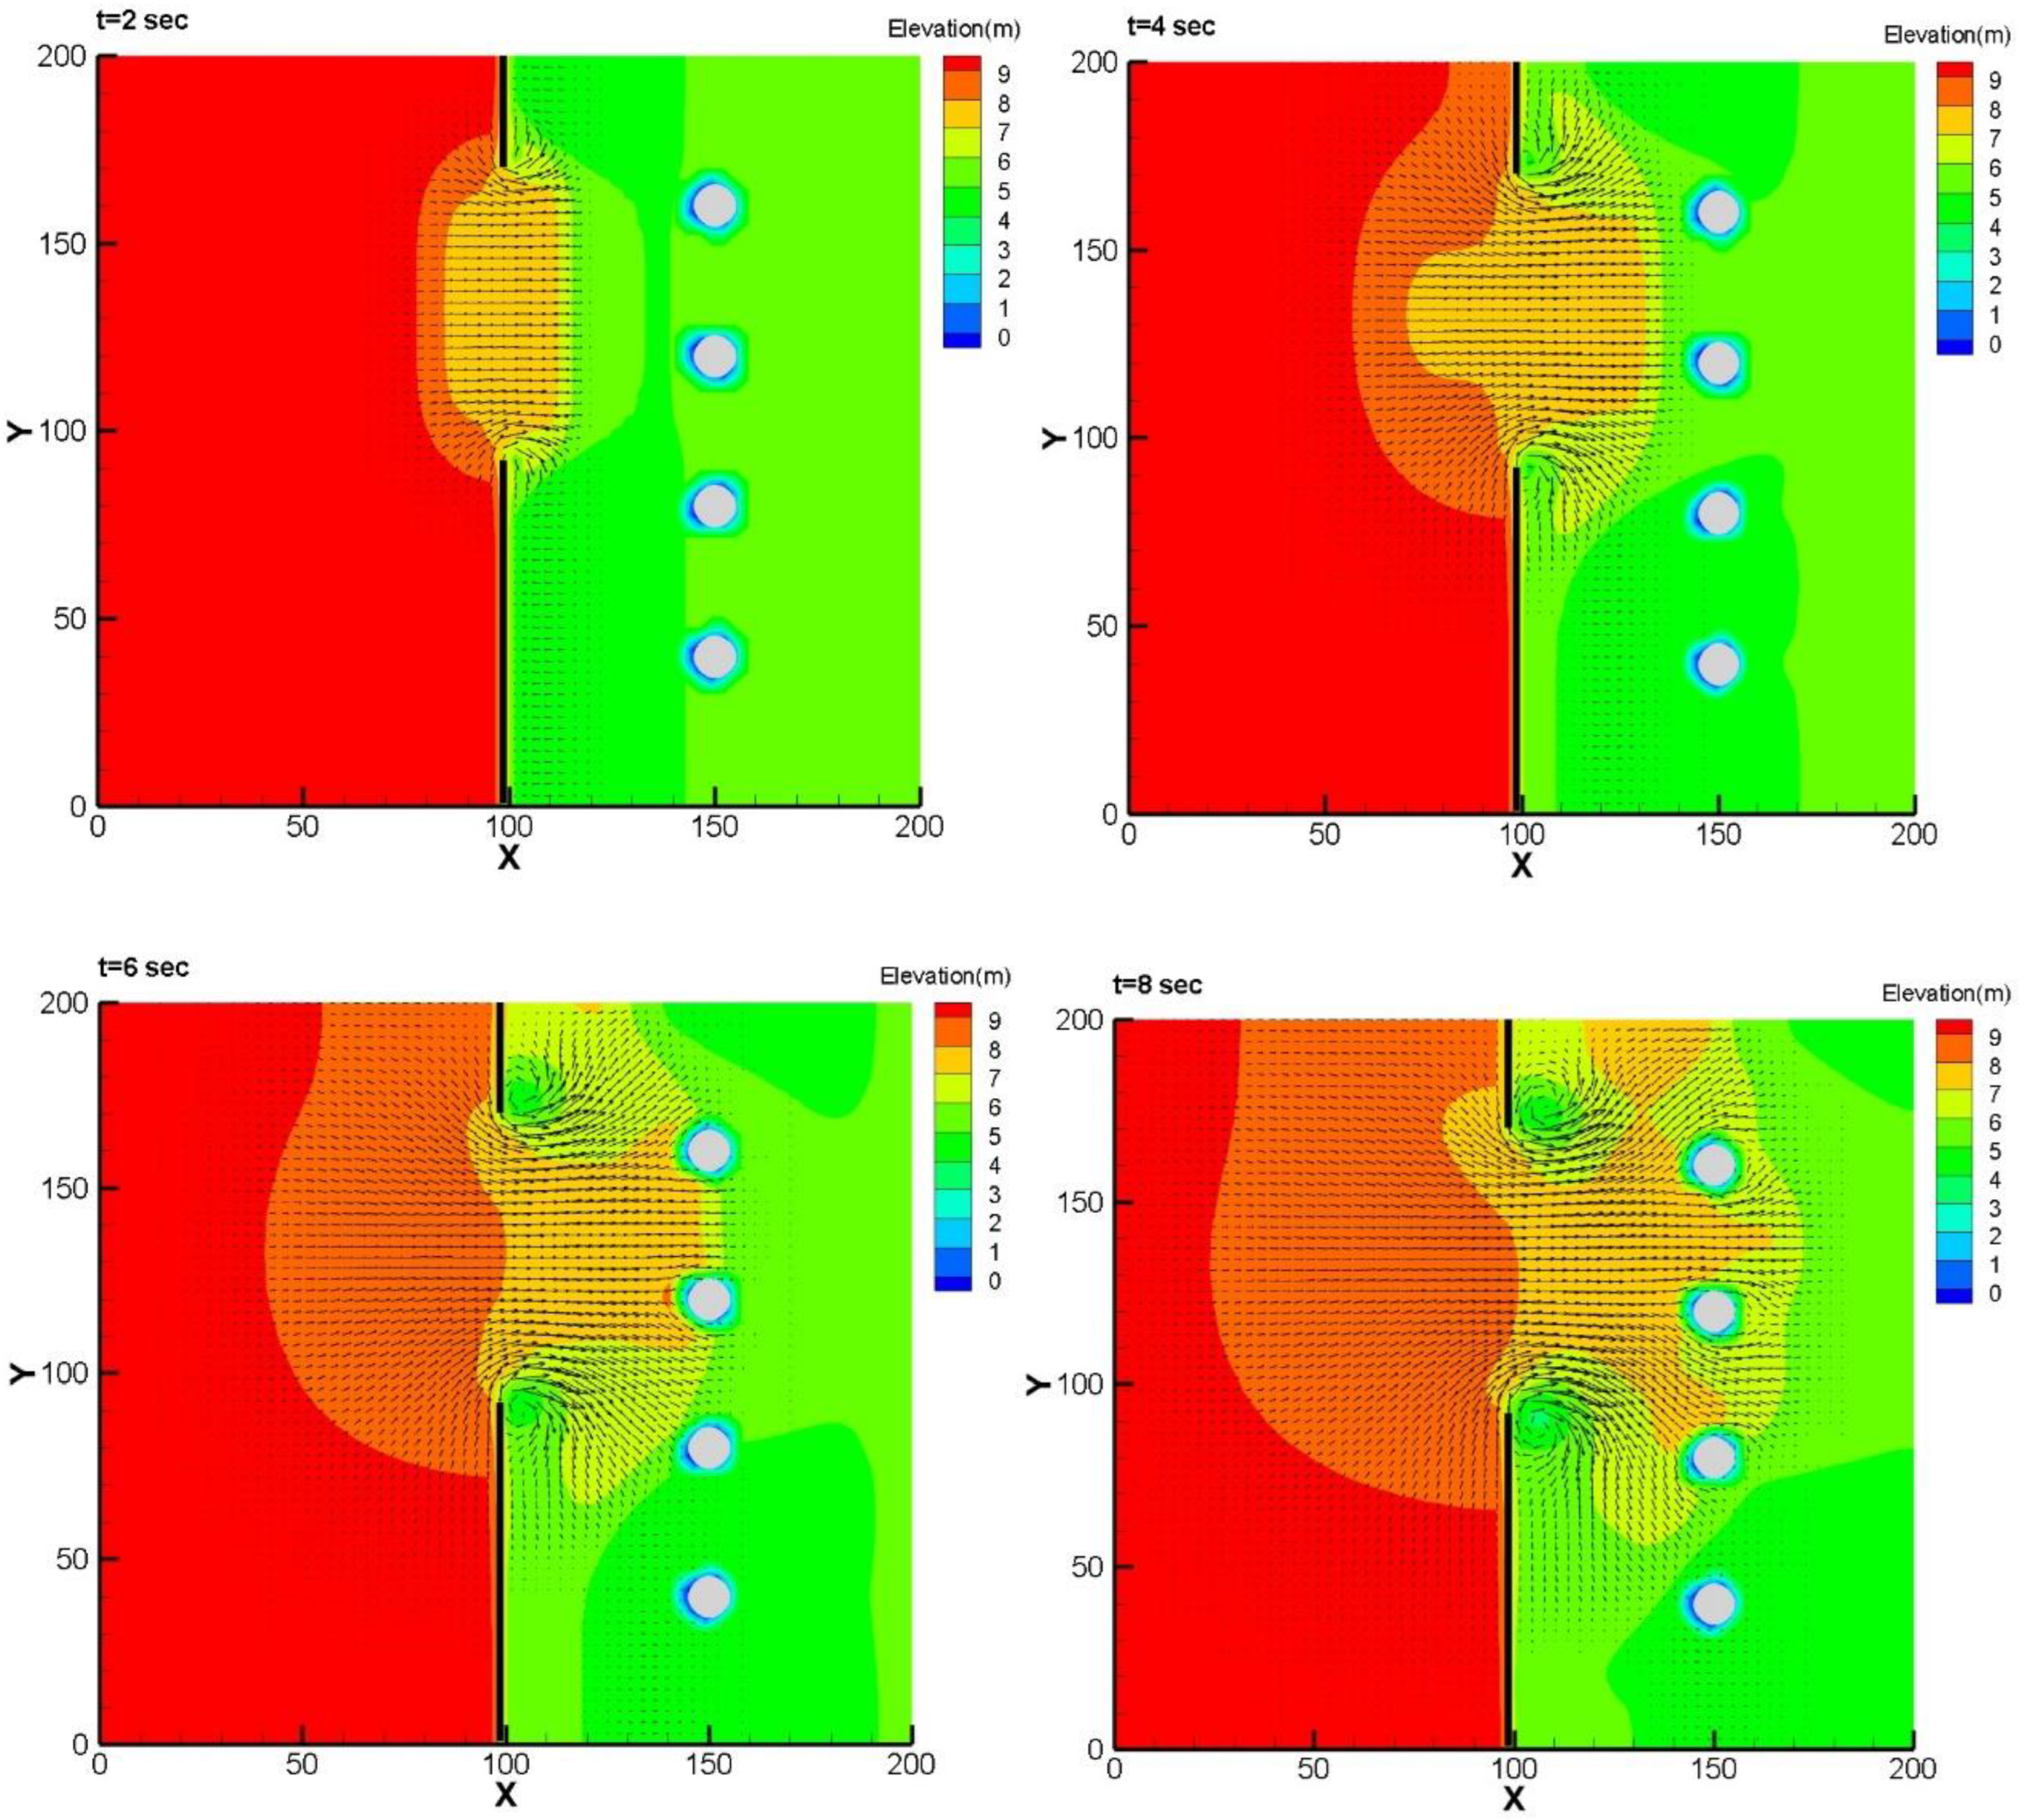
The predictions of the distributions of the water depth and depth-averaged velocity vector are demonstrated in Figure 16 and Figure 17 for the rectangular and circular cylinders, respectively. Once the dam broken, the water flow moves forwards and passes the gate, resulting in the free surface motions and spreading of the transverse waves downstream. When the waves reach the objects of aligned square and circular cylinders, complex surface patterns occur due to the caused reflection and diffraction. The results show that the present model is capable of modelling the complex free surface variations, demonstrating the discrepancies between the individual cylinders with different shape and location. A conspicuous vortex generated at the trailing edges of the broken dam is successfully simulated, indicating the very accurate of the present hydrodynamic water model.

4. Conclusions

A direct numerical simulation with combinations of VOF and VOS-based IB method is developed to solve the Navier–Stokes equations with the immersed boundaries on Cartesian grids. This method, taking advantage of the operator splitting technique and fractional time-stepping, provides a robust and effective scheme for solving 3D free-surface flow problems. The VOS-based immersed boundary can cut through the Cartesian mesh in an arbitrary manner to construct a boundary treatment for the numerical solver. The fully non-hydrostatic hydrodynamic model shows the predictions of the 3D dam break surface flow and the resultant impact force, which are validated using the experimental results. This study simulates the cases of dam break flow passing different configurations of the slender cylinders, the partial dam break flow, and a dam-break surge across the four aligned cylinders. The detailed features of the velocity vectors and water depth are demonstrated. The numerical scheme developed in this study is capable of investigating the 3D free-surface flow not only for the surface flow hitting a fixed single cylinder but also passing a group of columns, which are useful for the engineering design such as bridge piers and coastal structures. The combined schemes of VOF and IB methods to resolve 3D Navier–Stokes equations with a free-surface can process the complex immersed boundaries to obtain accurate prediction of the severe surface deformation.

Author Contributions

D.-C.L. and Y.-S.T. devised the numerical modelling and developed the code to complete this numerical experiment; D.-C.L. wrote the manuscript, and Y.-S.T. contributed to the revisions. All authors have read and agreed to the published version of the manuscript.

Funding

The present work was funded by the National of Science Council, Taiwan, funding number NSC 110-2221-E-992-081.

Data Availability Statement

The numerical data demonstrated in this study are available on request from the corresponding author.

Conflicts of Interest

The authors declare no conflict of interest.

References

  1. Biscarini, C.; Francesco, S.D.; Manciola, P. CFD modelling approach for dam break flow studies. Hydrol. Earth Syst. Sci. 2010, 14, 705–718. [Google Scholar] [CrossRef] [Green Version]
  2. Akoz, M.S.; Kirkgoz, M.S.; Oner, A.A. Experimental and numerical modeling of a sluice gate flow. J. Hydr. Res. 2009, 47, 161–176. [Google Scholar] [CrossRef]
  3. Istrati, D.; Hasanpour, A. Numerical investigation of dam break-induced extreme flooding of bridge superstructures. In Proceedings of the 3rd International Conference on Natural Hazards & Infrastructure, Athens, Greece, 5–7 July 2022. [Google Scholar]
  4. Tsai, Y.S.; Lo, D.C. A ghost-cell immersed boundary method for wave-structure interaction using a two-phase flow model. Water 2020, 12, 3346. [Google Scholar] [CrossRef]
  5. Xiang, T.; Istrati, D.; Yim, S.C.; Buckle, I.G. Tsunami loads on a representative coastal bridge deck: Experimental study and validation of design equations. J. Water Port Coast. Ocean Eng. 2020, 146, 04020022. [Google Scholar] [CrossRef]
  6. Hasanpour, A.; Istrati, D. Extreme storm wave impact on elevated coastal buildings. In Proceedings of the 3rd International Conference on Natural Hazards & Infrastructure, Athens, Greece, 5–7 July 2022. [Google Scholar]
  7. Azadbakht, M. Tsunami and hurricane wave loads on bridge superstructures. Ph.D. Thesis, Oregon State University, Corvallis, OR, USA, 2013. [Google Scholar]
  8. Xiang, T.; Istrati, D. Assessment of extreme wave impact on coastal decks with different geometries via the arbitrary Lagrangian-Eulerian method. J. Mar. Sci. Eng. 2021, 9, 1342. [Google Scholar] [CrossRef]
  9. Istrati, D.; Buckle, I.G. Tsunami Loads on Straight and Skewed Bridges—Part 2: Numerical Investigation and Design Recommendations; Oregon Department of Transportation: Salem, OR, USA, 2021. [Google Scholar]
  10. Hasanpour, A.; Istrati, D. Reducing extreme flooding loads on essential facilities via elevated structures. In Proceedings of the ASCE Lifelines Conference, Virtual, 31 January–11 February 2022. [Google Scholar]
  11. Elliot, R.C.; Chaudhry, M.H. A wave propagation model for two-dimensional dam-break flows. J. Hydr. Res. 1992, 30, 467–483. [Google Scholar] [CrossRef]
  12. Molls, T.; Chaudhry, M.H. Depth-averaged open-channel flow model. J. Hydr. Engrg. 1995, 121, 453–464. [Google Scholar] [CrossRef]
  13. Sanders, B.F. Non-reflecting boundary flux function for finite volume shallow-water models. Adv. Water Resour. 2001, 25, 195–202. [Google Scholar] [CrossRef]
  14. Rao, V.S.; Latha, G. A slope modification method for shallow water equations. Int. J. Numer. Meth. Fluids 1992, 14, 189–196. [Google Scholar] [CrossRef]
  15. Fraccarollo, L.; Toro, E.F. Experimental and numerical assessment of the shallow water model for two-dimensional dam-break type problems. J. Hydr. Res. 1995, 33, 843–864. [Google Scholar] [CrossRef]
  16. Wang, J.S.; He, Y.S.; Ni, H.G. Two-dimensional free surface flow in branch channels by a finite-volume TVD scheme. Adv. Water Resour. 2003, 26, 623–633. [Google Scholar] [CrossRef]
  17. Caleffi, V.; Valiani, A.; Bernini, A. High-order balanced CWENO scheme for movable bed shallow water equations. Adv. Water Resour. 2007, 30, 730–741. [Google Scholar] [CrossRef]
  18. Nujic, M. Efficient implementation of non-oscillatory schemes for the computation of free-surface flows. J. Hydr. Res. 1995, 3, 101–111. [Google Scholar] [CrossRef]
  19. Savic, L.J.; Holly, F.M., Jr. Dambreak flood waves computed by modified Godunov method. J. Hydr. Res. 1993, 1, 187–204. [Google Scholar] [CrossRef]
  20. Glaister, P. Approximate Rieman solutions of shallow water equations. J. Hydr. Res. 1988, 26, 293–306. [Google Scholar] [CrossRef]
  21. Harten, A. High resolution schemes for hyperbolic conservation laws. J. Comput. Phys. 1983, 49, 357–393. [Google Scholar] [CrossRef] [Green Version]
  22. Yang, J.Y.; Hsu, C.A.; Chang, S.H. Computations of free surface flows, part 2: 2D unsteady bore diffraction. J. Hydr. Res. 1993, 31, 403–412. [Google Scholar] [CrossRef]
  23. Yee, H.C. Construction of explicit and implicit symmetric TVD schemes and their applications. J. Comput. Phys. 1987, 68, 151–179. [Google Scholar] [CrossRef] [Green Version]
  24. Yang, H.Q.; Przekwas, A.J. A comparative study of advanced shock-capturing schemes applied to Burger’s equation. J. Comput. Phys. 1992, 102, 139–159. [Google Scholar] [CrossRef]
  25. Jeng, Y.N.; Payne, U.J. An adaptive TVD limiter. J. Comput. Phys. 1995, 118, 229–241. [Google Scholar] [CrossRef]
  26. Wang, J.S.; Ni, H.G.; He, Y.S. Finite-difference TVD scheme for computation of dam-break problems. J. Hydr. Engrg. ASCE 2000, 126, 253–262. [Google Scholar] [CrossRef]
  27. Harten, A.; Engquist, B.; Osher, S.; Chakravarthy, S.R. Uniformly high-order accurate essentially non-oscillatory schemes, III. J. Comput. Phys. 1987, 71, 231–275. [Google Scholar] [CrossRef]
  28. Liu, X.-D.; Osher, S.; Chan, T. Weighted essentially non-oscillatory schemes. J. Comput. Phys. 1994, 115, 200–212. [Google Scholar] [CrossRef] [Green Version]
  29. Jiang, G.-S.; Shu, C.-W. Efficient implementation of weighted ENO schemes. J. Comput. Phys. 1996, 126, 202–228. [Google Scholar] [CrossRef] [Green Version]
  30. Qiu, J.; Shu, C.-W. On the construction, comparison, and local characteristic decomposition for high-order central WENO schemes. J. Comput. Phys. 2002, 183, 187–209. [Google Scholar] [CrossRef] [Green Version]
  31. Wei, Z.; Dalrymple, R.A. Numerical study on mitigating tsunami force on bridges by an SPH model. J. Ocean Eng. Mar. Energy 2016, 2, 365–380. [Google Scholar] [CrossRef] [Green Version]
  32. Sarfaraz, M.; Pak, A. SPH numerical simulation of tsunami wave forces impinged on bridge superstructures. Coastal Eng. 2017, 121, 145–157. [Google Scholar] [CrossRef]
  33. Hasanpour, A.; Istrati, D.; Buckle, I. Coupled SPH–FEM modeling of tsunami-borne large debris flow and impact on coastal structures. J. Mar. Sci. Eng. 2021, 9, 1068. [Google Scholar] [CrossRef]
  34. Hasanpour, A.; Istrati, D.; Buckle, I.G. Multi-physics modeling of tsunami debris impact on bridge decks. In Proceedings of the 3rd International Conference on Natural Hazards & Infrastructure, Athens, Greece, 5–7 July 2022. [Google Scholar]
  35. Chen, X. A fully hydrodynamic model for three-dimensional, free-surface flows. Int. J. Numer. Meth. Fluids 2003, 42, 929–952. [Google Scholar] [CrossRef]
  36. Hirt, C.W.; Nichols, B.D. Volume of fluid (VOF) method for the dynamics of free boundaries. J. Comput. Phys. 1981, 39, 201–225. [Google Scholar] [CrossRef]
  37. Lo, D.C. A novel volume-of-solid-based immersed-boundary method for viscous flow with a moving rigid boundary. Numer. Heat Transf. B Fundam. 2015, 68, 115–140. [Google Scholar] [CrossRef]
  38. Chorin, A.J. A numerical method for solving incompressible viscous flow problem. J. Comput. Phys. 1967, 2, 12–26. [Google Scholar] [CrossRef]
  39. Weymouth, G.D.; Yue, D.K.-P. Conservative Volume-of-Fluid method for free-surface simulations on Cartesian-grids. J. Comput. Phys. 2010, 229, 2853–2865. [Google Scholar] [CrossRef]
  40. Raad, P.E.; Bidoae, R. The three-dimensional Eulerian–Lagrangian marker and micro cell method for the simulation of free surface flows. J. Comput. Phys. 2005, 203, 668–699. [Google Scholar] [CrossRef]
  41. Xie, Z.; Stoesser, T.; Xia, J. Simulation of three-dimensional free-surface dam-break flows over a cuboid, cylinder, and sphere. J. Hydraul. Eng. 2021, 147, 06021009. [Google Scholar] [CrossRef]
  42. Fennema, R.J.; Chaudhry, M.H. Explicit methods for two-dimensional unsteady free-surface flow. J. Hydr. Engrg. 1990, 116, 1013–1034. [Google Scholar] [CrossRef]
  43. Frandsen, J.B. Free-Surface Lattice Boltzmann Modeling in Single Phase Flows. In Advanced Numerical Models for Simulating Tsunami Waves and Runup; Liu, P., Yeh, H., Synolakis, C., Eds.; World Scientific: Singapore, 2008; Volume 10. [Google Scholar]
Figure 1. Points used for computing the pressure variables.
Water 14 03803 g001
Figure 2. Schematic diagram of 3D dam-break flows over a (a) vertical square cylinder, (b) vertical rectangular cylinder with a different aspect ratio ( α = W / L ), (c) vertical circular cylinder. The volume of water is 0.4 × 0.61 × 0.3 m3.
Water 14 03803 g002
Figure 3. Simulation of three-dimensional dam-break flows over a vertical square cylinder.
Water 14 03803 g003aWater 14 03803 g003b
Figure 4. Time history of the horizontal velocity upstream the square obstacle at the location (0.754, 0, 0.026).
Water 14 03803 g004
Figure 5. Time history of the impact force on the square obstacle.
Water 14 03803 g005
Figure 6. Variations of the impact forces with respect to time for the different aspect ratios of the vertical rectangular cylinder.
Water 14 03803 g006
Figure 7. Simulation of the 3D dam-break flows over a vertical rectangular obstacle ( α = 0.25 ).
Water 14 03803 g007aWater 14 03803 g007b
Figure 8. Simulation of the 3D dam-break flows over a vertical rectangular obstacle ( α = 1.5 ).
Water 14 03803 g008
Figure 9. Time variation of the impact force on the vertical square and circular obstacle.
Water 14 03803 g009
Figure 10. Simulation of the 3D dam-break flows over a vertical circular obstacle.
Water 14 03803 g010
Figure 11. Layout of the two-dimensional dam break simulation in the benchmark study of Fennema and Chaudhry [42].
Water 14 03803 g011
Figure 12. Surface elevation downstream the partial dam break simulated using the present model and compared with the predicted result of LABSWE [42].
Water 14 03803 g012
Figure 13. Temporal evolution of free surface elevations and velocity distribution. The flow separations downstream of the broken dam are predicted.
Water 14 03803 g013
Figure 14. Geometry of a dam break surge with four aligned square and circular cylinders downstream.
Water 14 03803 g014
Figure 15. Time variation of the impact force on the individual square and cylinder where the slope bed is equal to 0.02 at the downstream for four cylinders (a) cylinder 1; (b) cylinder 2; (c) cylinder 3; (d) cylinder 4.
Water 14 03803 g015
Figure 16. Evolutions of the free surface elevations and velocity distribution with four square cylinders where the Sx = 0.02 at the downstream.
Water 14 03803 g016
Figure 17. Evolution of free surface elevations and velocity distribution with four circular cylinders where the Sx = 0.02 at the downstream.
Water 14 03803 g017
Table 1. Comparisons between the CPU times (s) with different time-steps and grid-sizes for the case of the dam-break flow passing a square cylinder.
Δt (s) Grid Size (m)
0.020.010.005
0.00148156508
0.000575226711
0.00025105306938
Publisher’s Note: MDPI stays neutral with regard to jurisdictional claims in published maps and institutional affiliations.