Contrast Analysis of Flow-Discharge Measurement Methods in a Wide–Shallow River during Ice Periods
Abstract
:1. Introduction
2. Methods and Applications
2.1. Stream-Tube Method
- (1)
- Obtain the cross-sectional topography data of rivers, e.g., a double-frequency ground-penetrating radar [31] can be used to quickly obtain the ice thickness and flow-depth distribution along the cross-section.
- (2)
- Obtain the vertical-velocity distribution or depth-averaged velocity at a typical position; for example, the depth-averaged velocity can be obtained using the one-, two-, three-, or the six-point method. Point velocities are usually captured with a SonTek 3D Acoustic Doppler Velocimetry (ADV) or a current meter. The ADV utilizes the principle of acoustic Doppler and uses telemetry for less interference with the flow field at the measurement point. Characterized by high measurement accuracy and sampling frequency, automated data acquisition is possible.
- (3)
- Obtain the section-characteristic coefficient according to the survey-point position and calculate the unit discharge at a typical position based on the depth-averaged velocity and the flow depth at that position. Using Equation (4), we can obtain the relative-unit discharge distribution along the cross-section. Equation (6) can be used to calculate the unit discharge at other measuring points of the section, which can be combined with the flow depth to calculate the depth-averaged velocity. Combined with the deformation of Equation (4), the total-flow discharge can be calculated.
2.2. Characterization Method of the Depth-Averaged Velocity under Ice
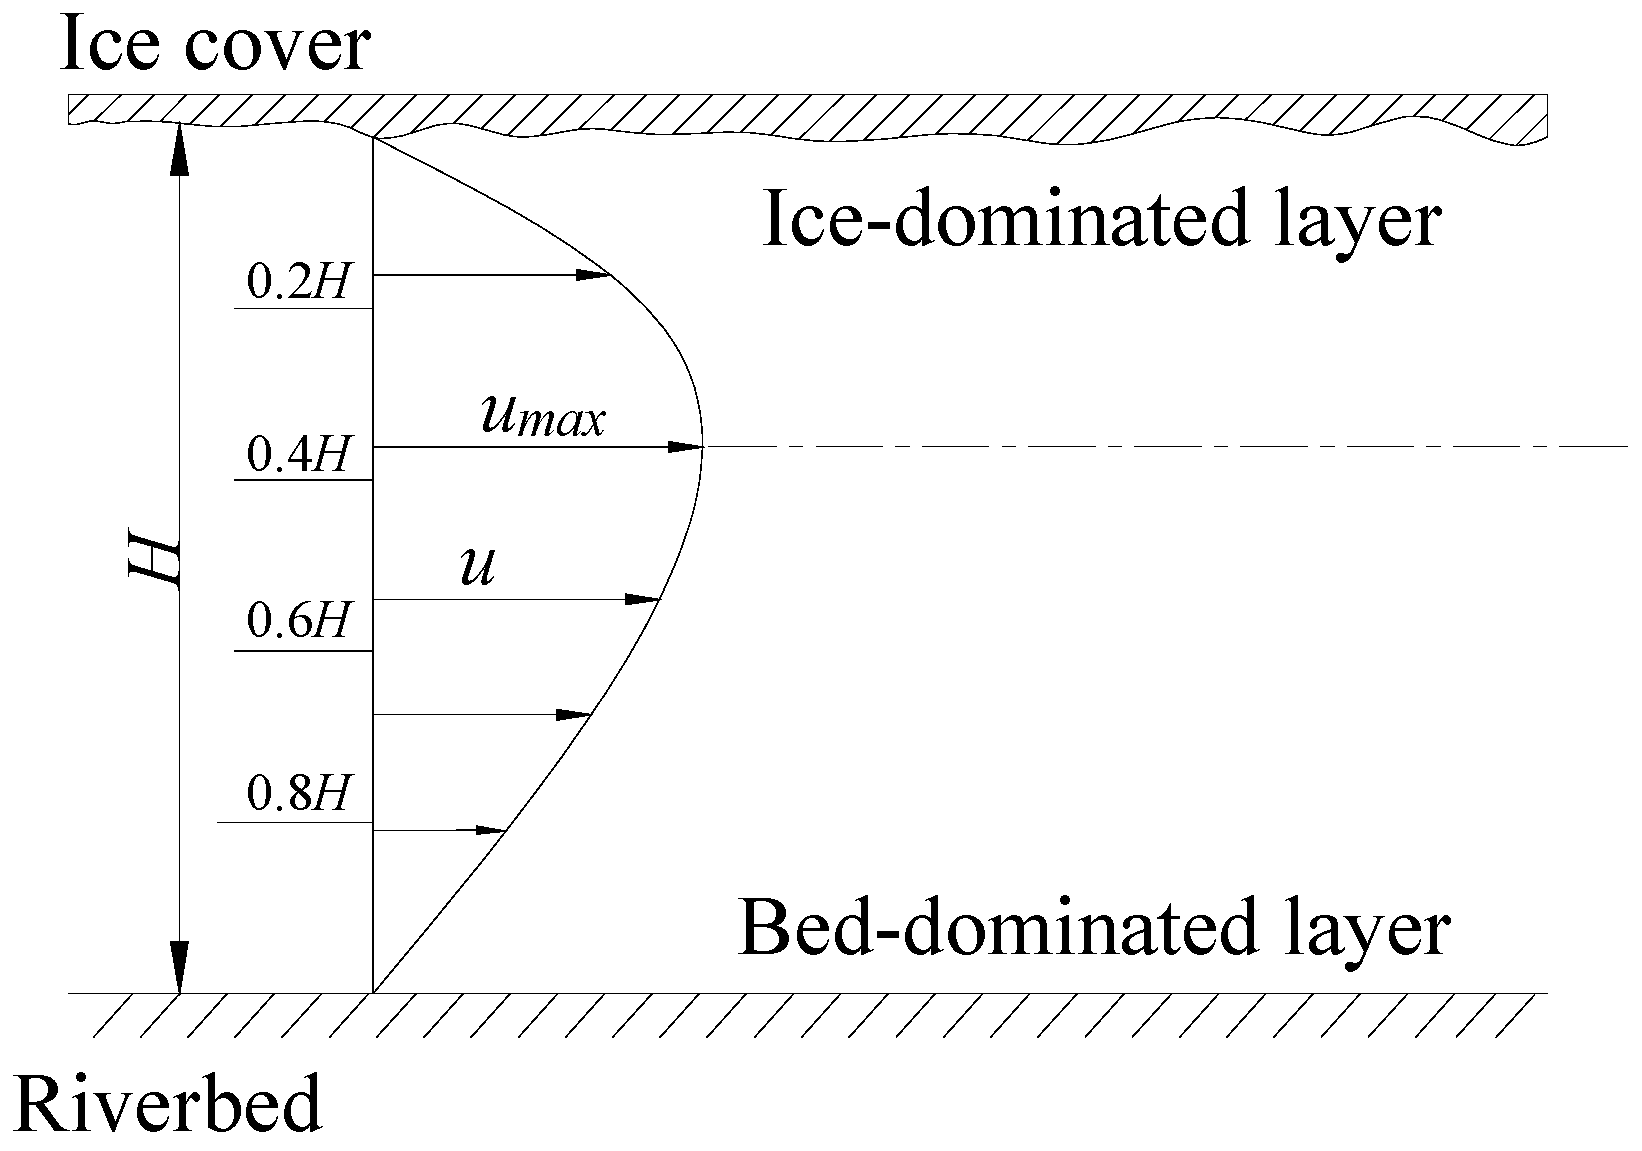
2.2.1. Comparison of Characterization Methods
2.2.2. Accuracy of Velocity Estimation of a Single Survey Point
3. Results and Discussion
3.1. Accuracy Analysis of Characterization Method of the Depth-Averaged Velocity
- a.
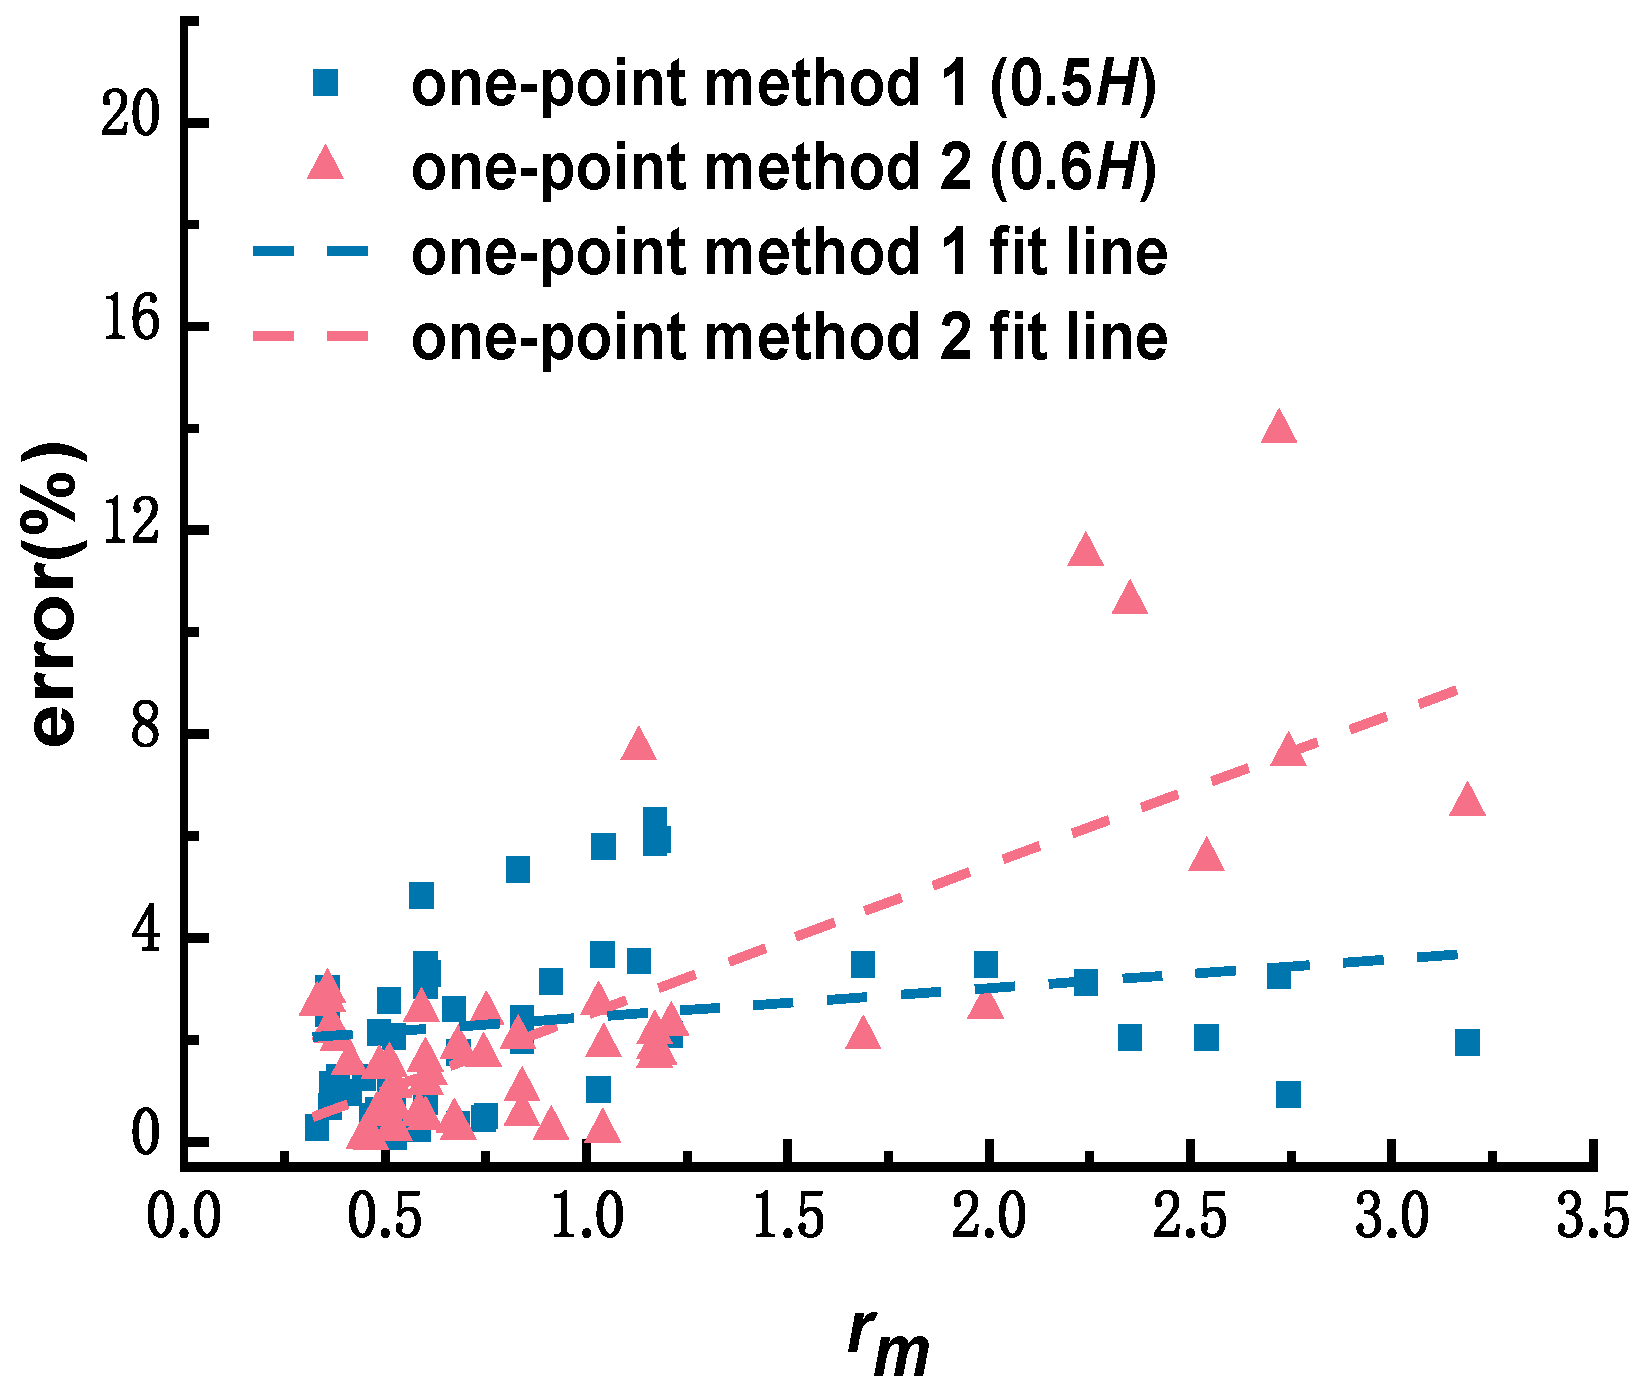
- Comparison of one-point–velocity-estimation methods
- b.
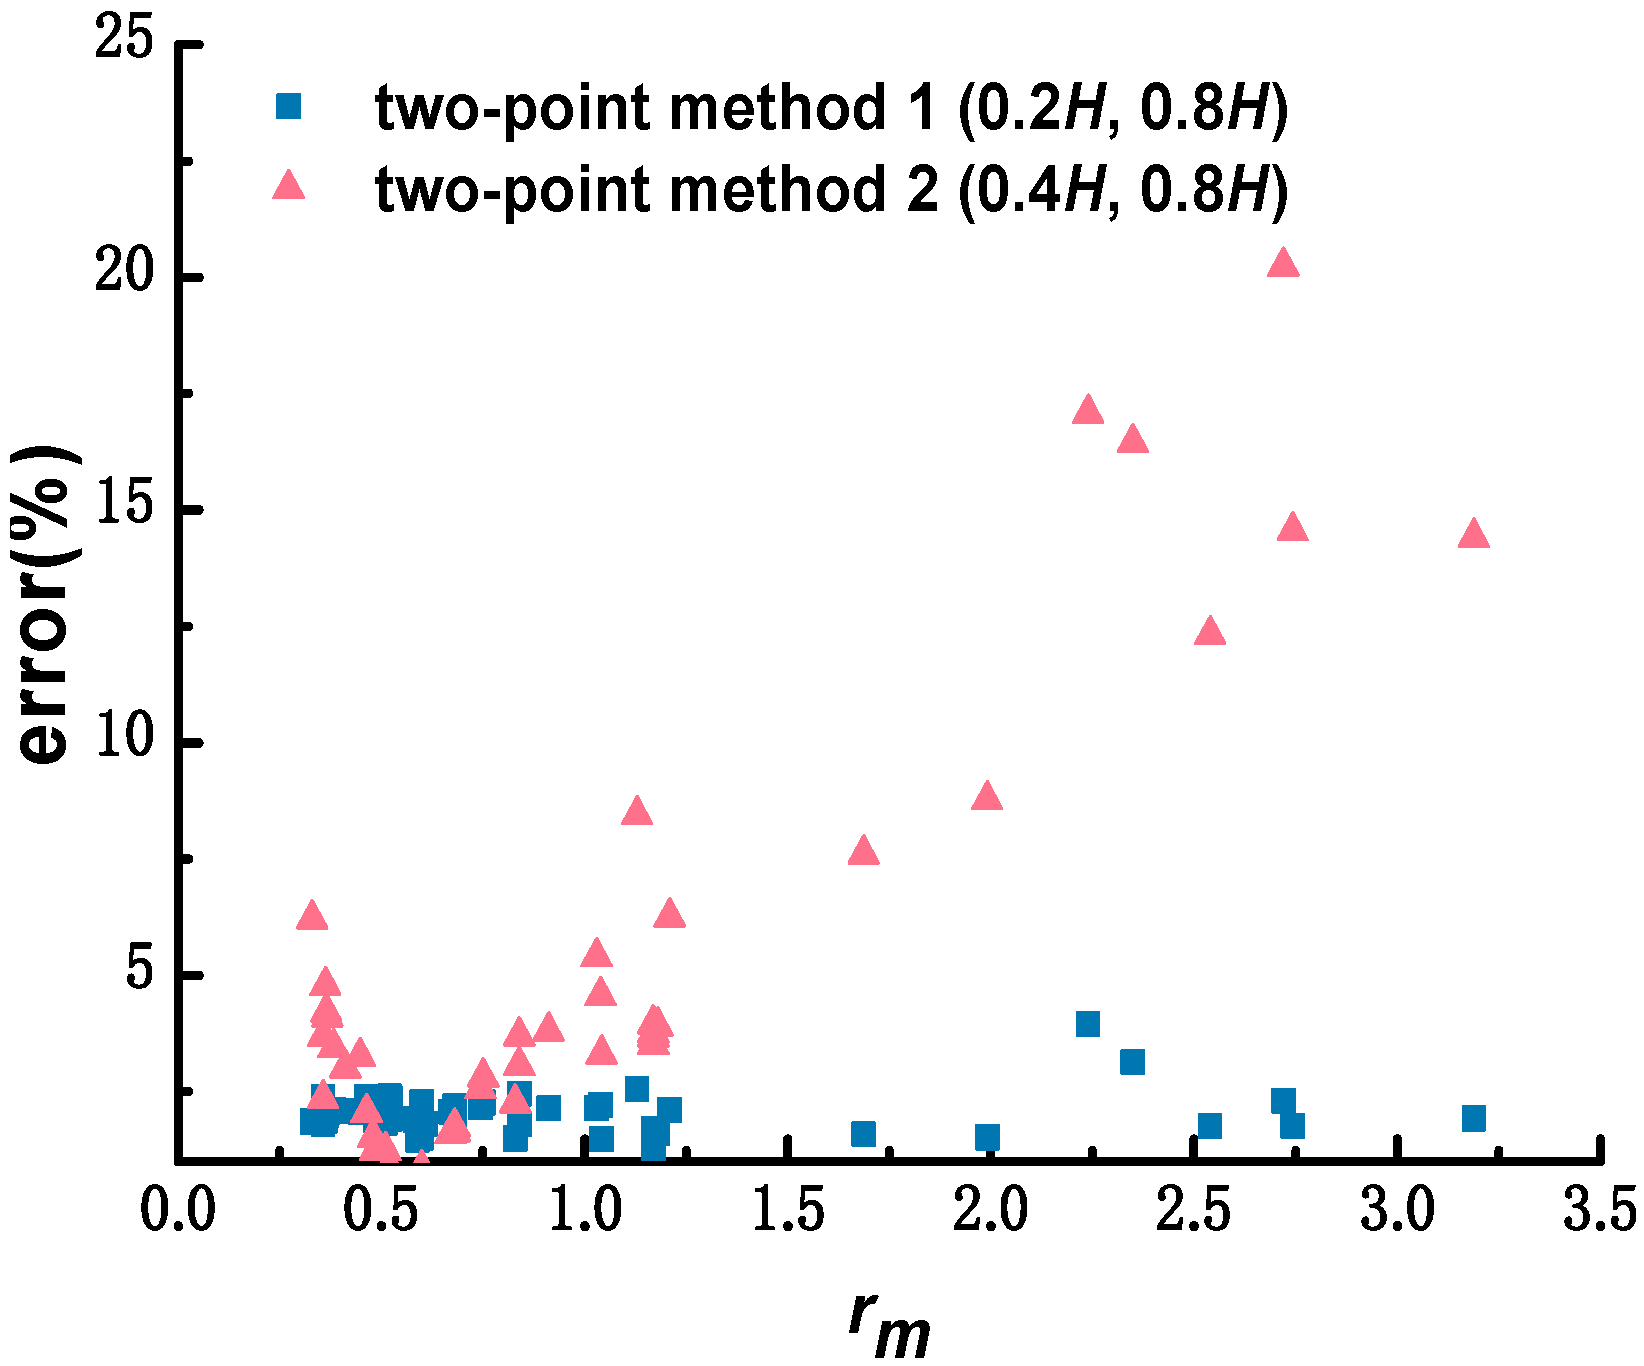
- Comparison of two-point–velocity-estimation methods
- c.
- Comparison of three-point–velocity-estimation methods
3.2. Analysis of Position Selection of the Typical Survey-Point
3.2.1. Relative Unit Discharge Distribution of Common River Cross-Sections
3.2.2. Influence of the Survey-Point Position on the Cross-Section Discharge Estimation Accuracy
4. Conclusions
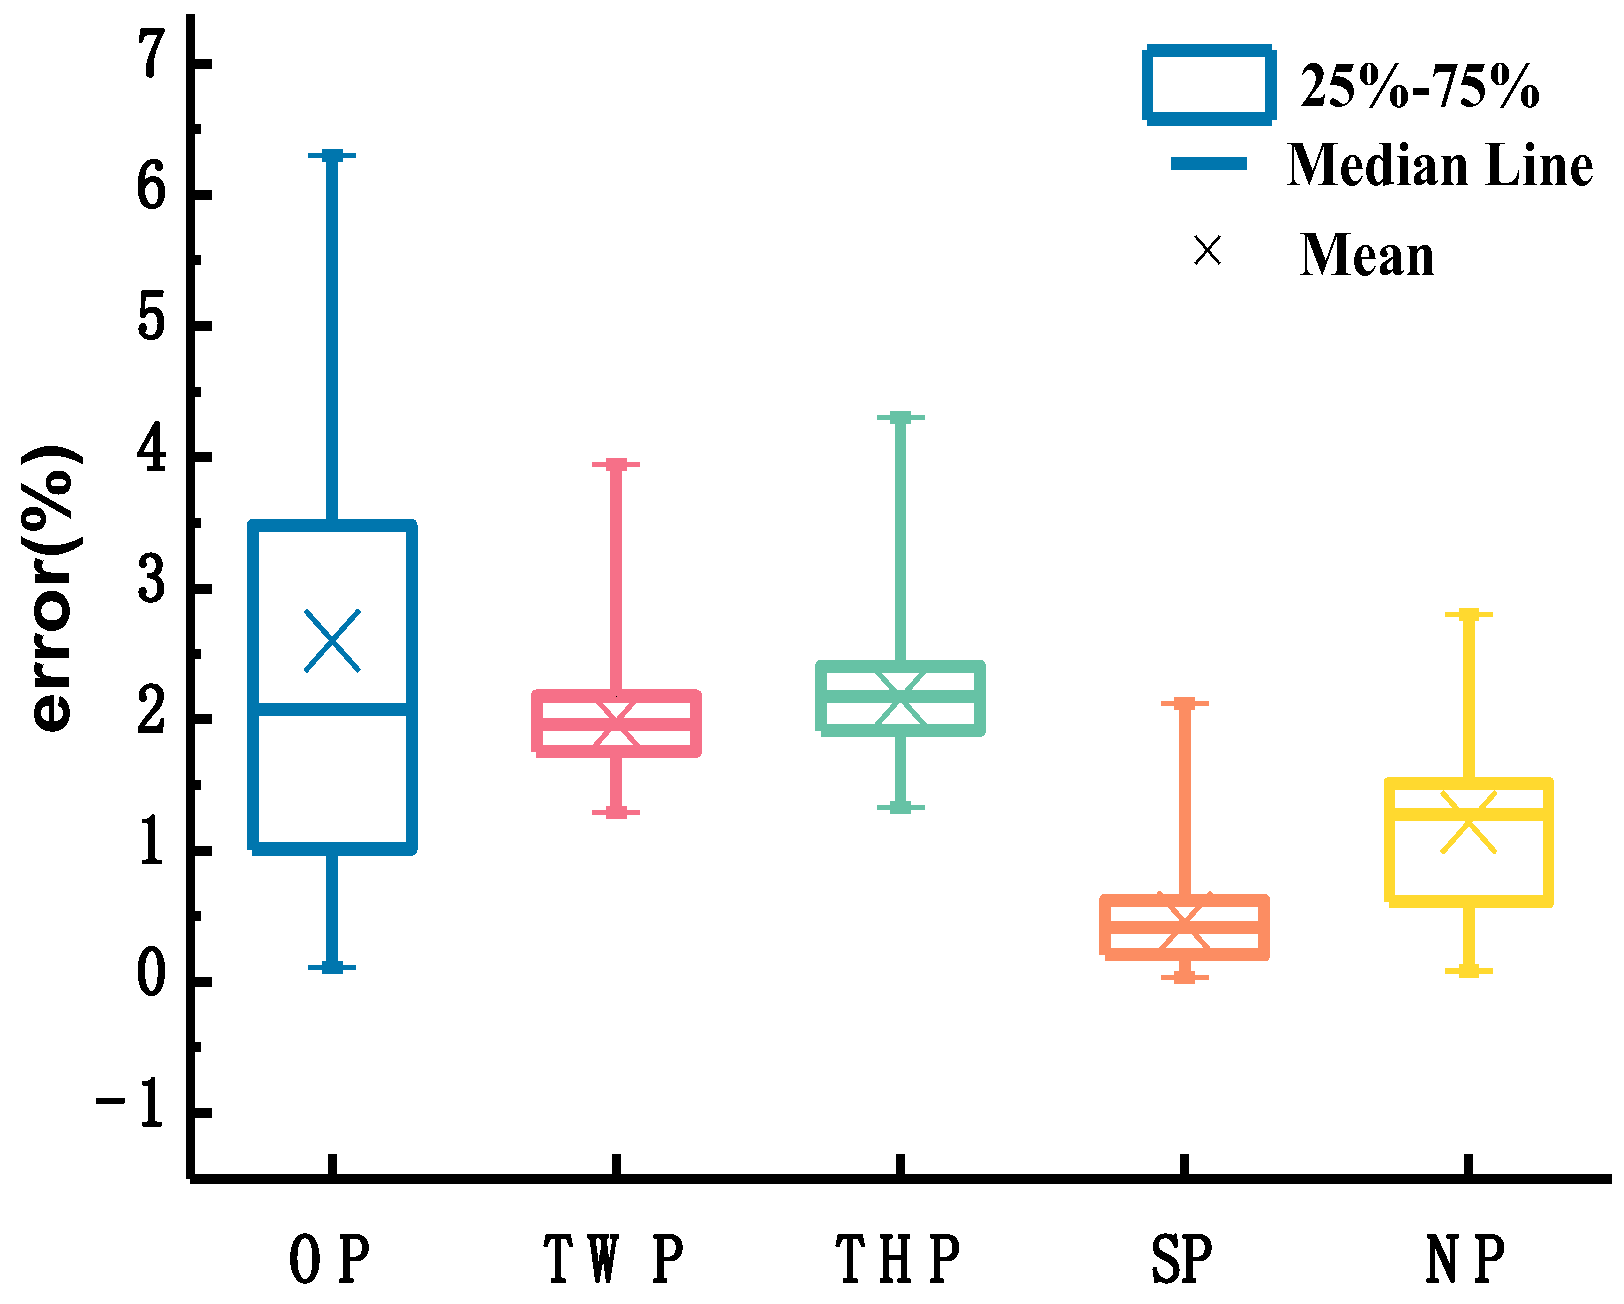
- Contrast analysis of commonly used estimation methods of depth-averaged velocity under ice cover. Based on the selected sixty sets of measured data, the depth-averaged velocity-estimation errors obtained by applying the one-point method at 0.5H, two-point method at 0.2H and 0.8H, three-point method proposed by Shan et al., and six-point method, were calculated as 2.60%, 1.98%, 1.22%, and 0.45%, respectively, and the corresponding standard deviations were 1.86, 0.44, 0.62, and 0.35, respectively. The one-point method at 0.5H is appropriate for estimating the depth-averaged velocity of a single line, depending on the workload. If the workload increases, the two-point method at 0.2H and 0.8H may be chosen. If the measurement conditions can meet the arrangement of three measuring points, depending on the measurement efficiency and accuracy, the new three-point method proposed by Shan et al. is recommended. The reasonable and accurate selection of the estimation methods of depth-averaged velocity under ice cover further reduces the workload in the application of the stream-tube method.
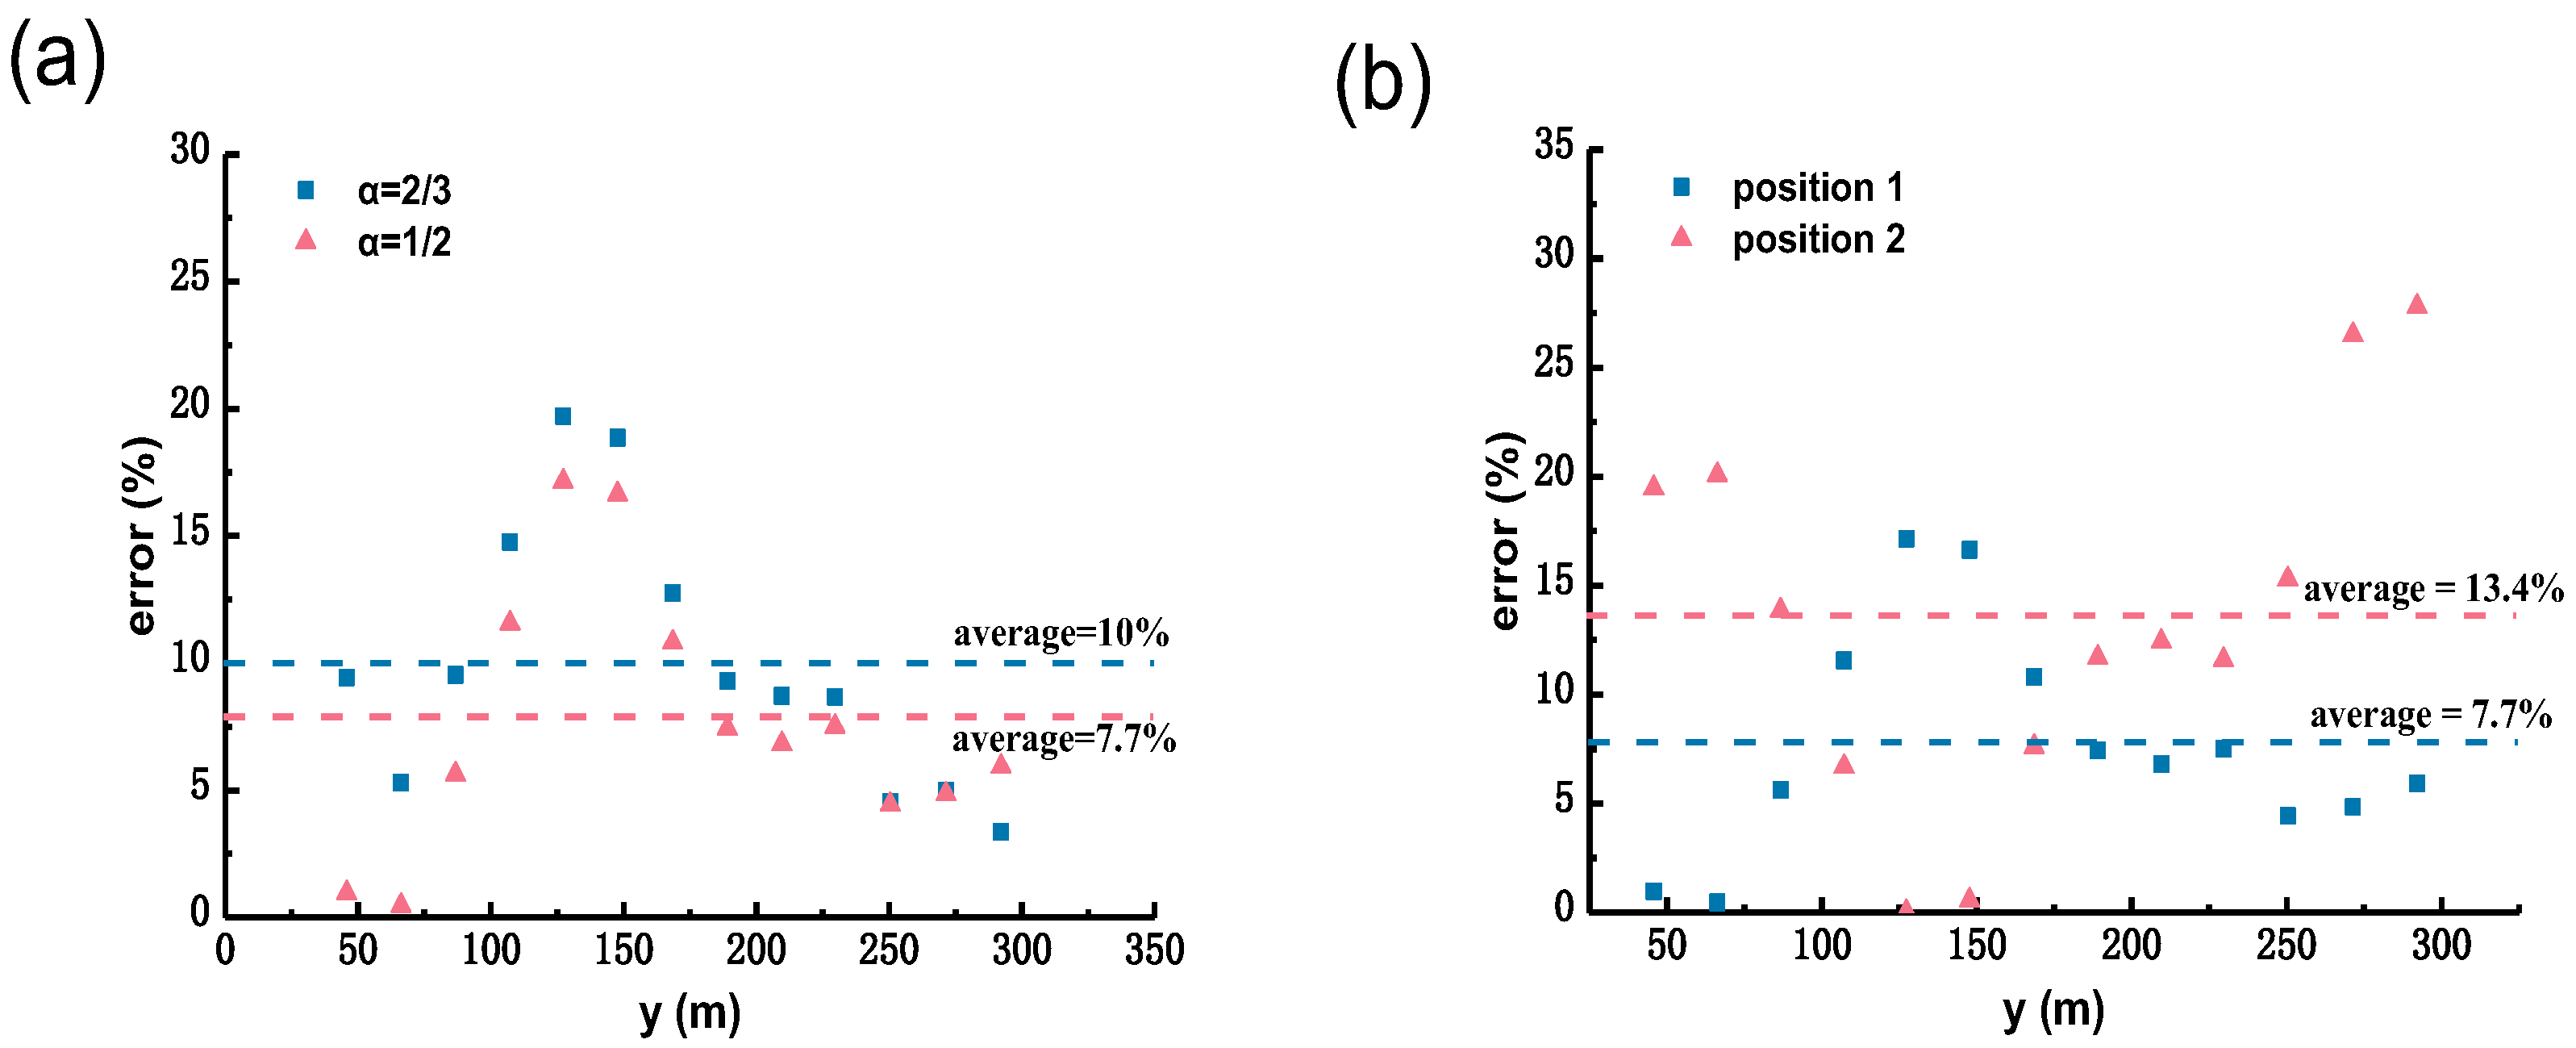
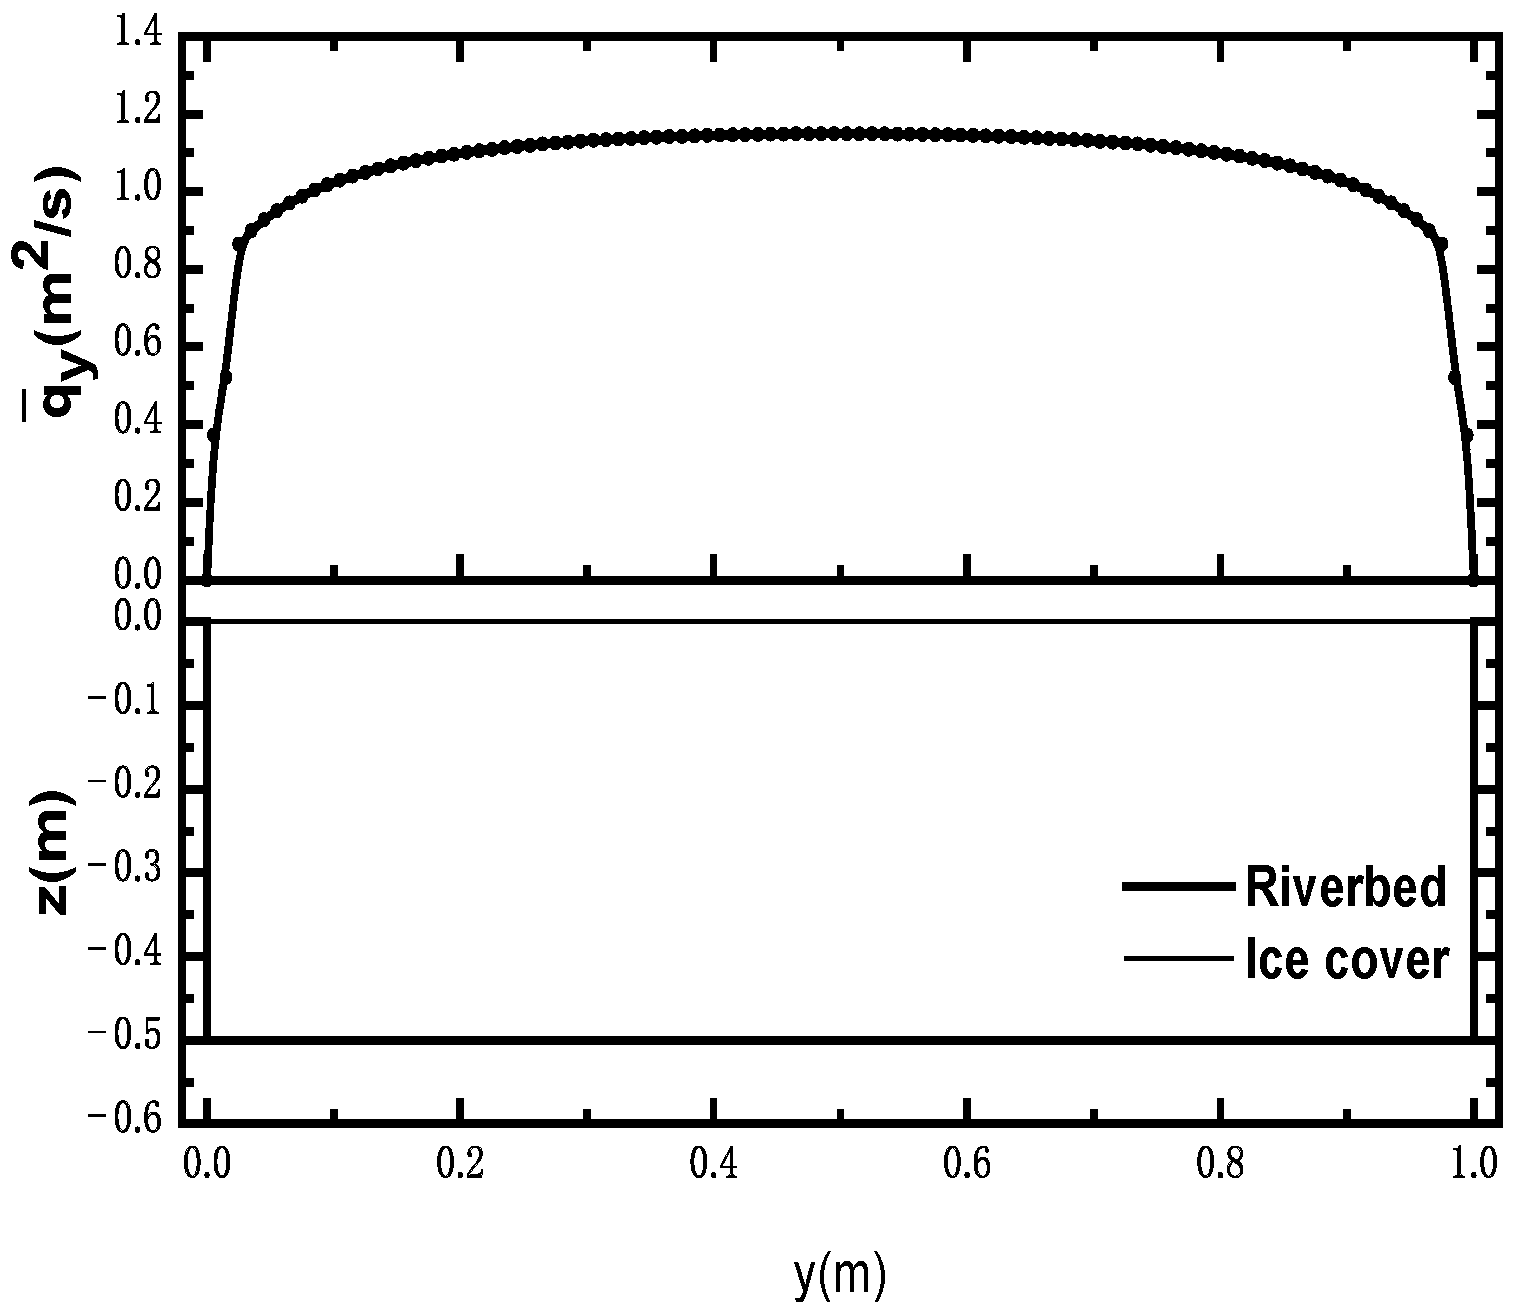
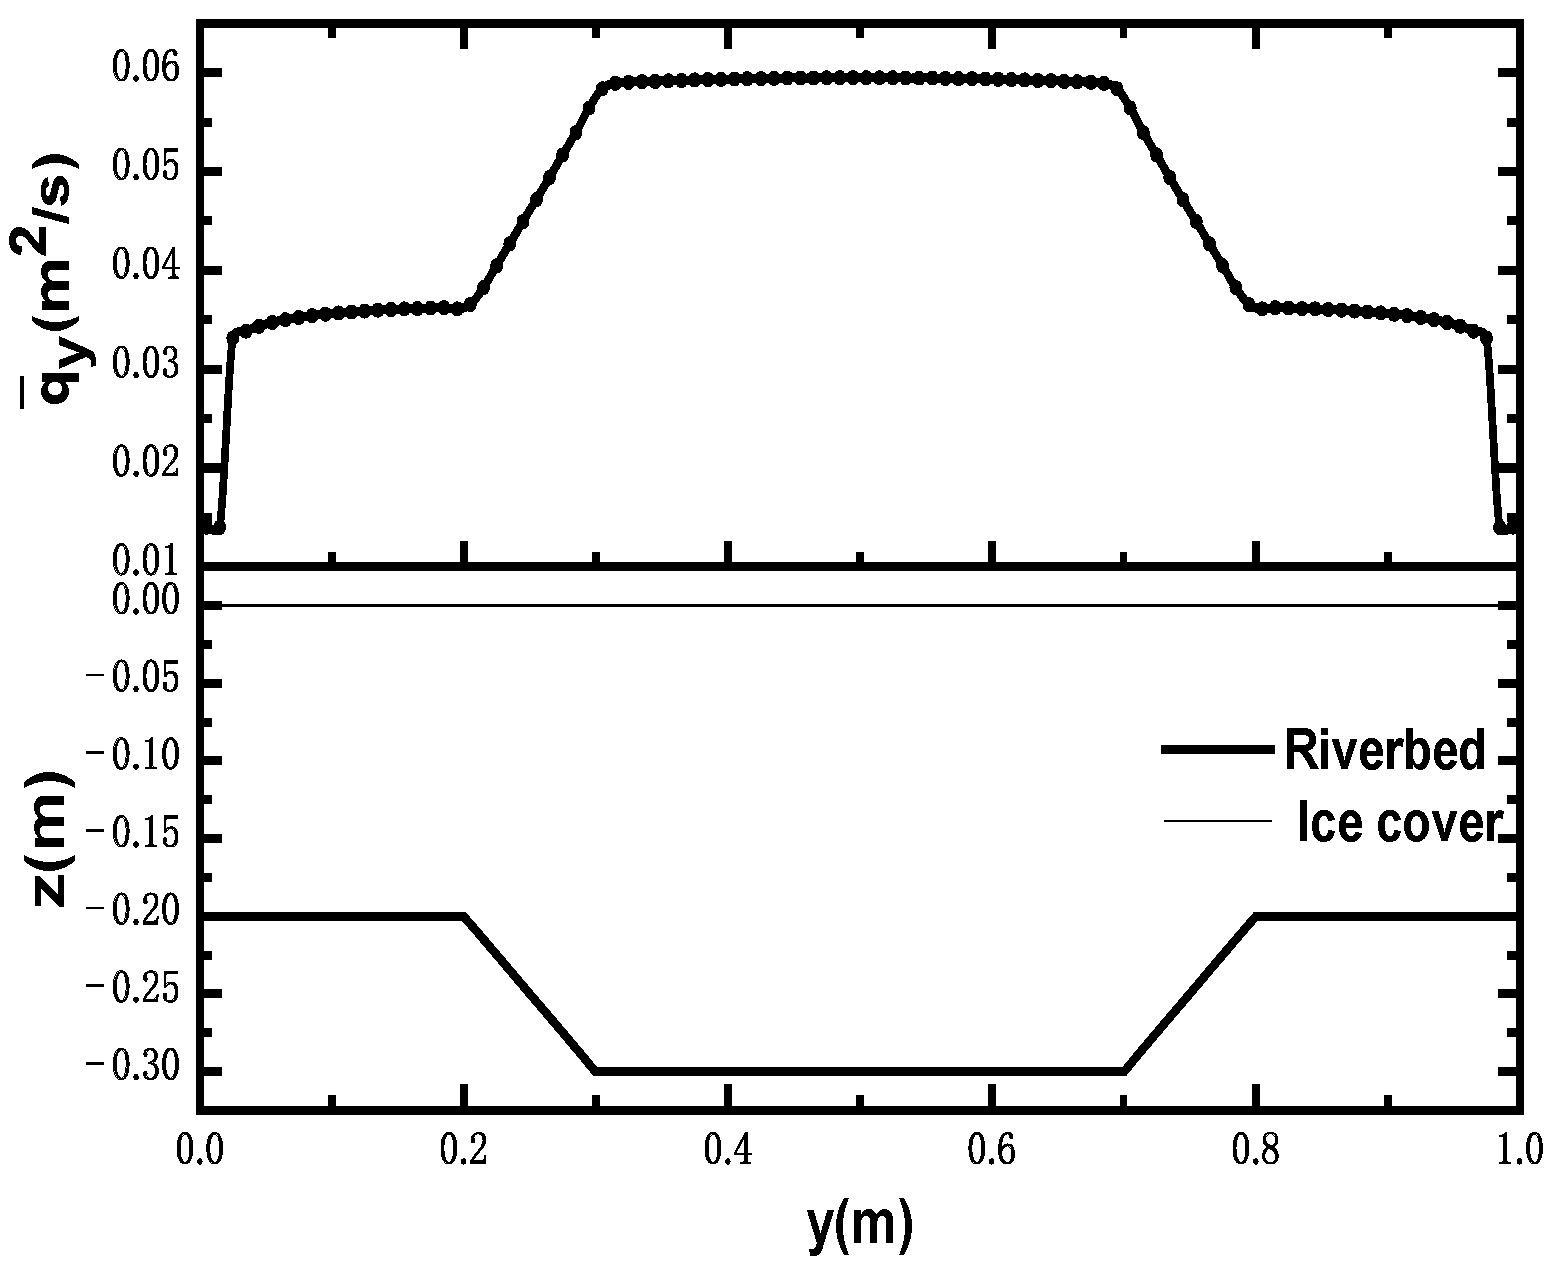
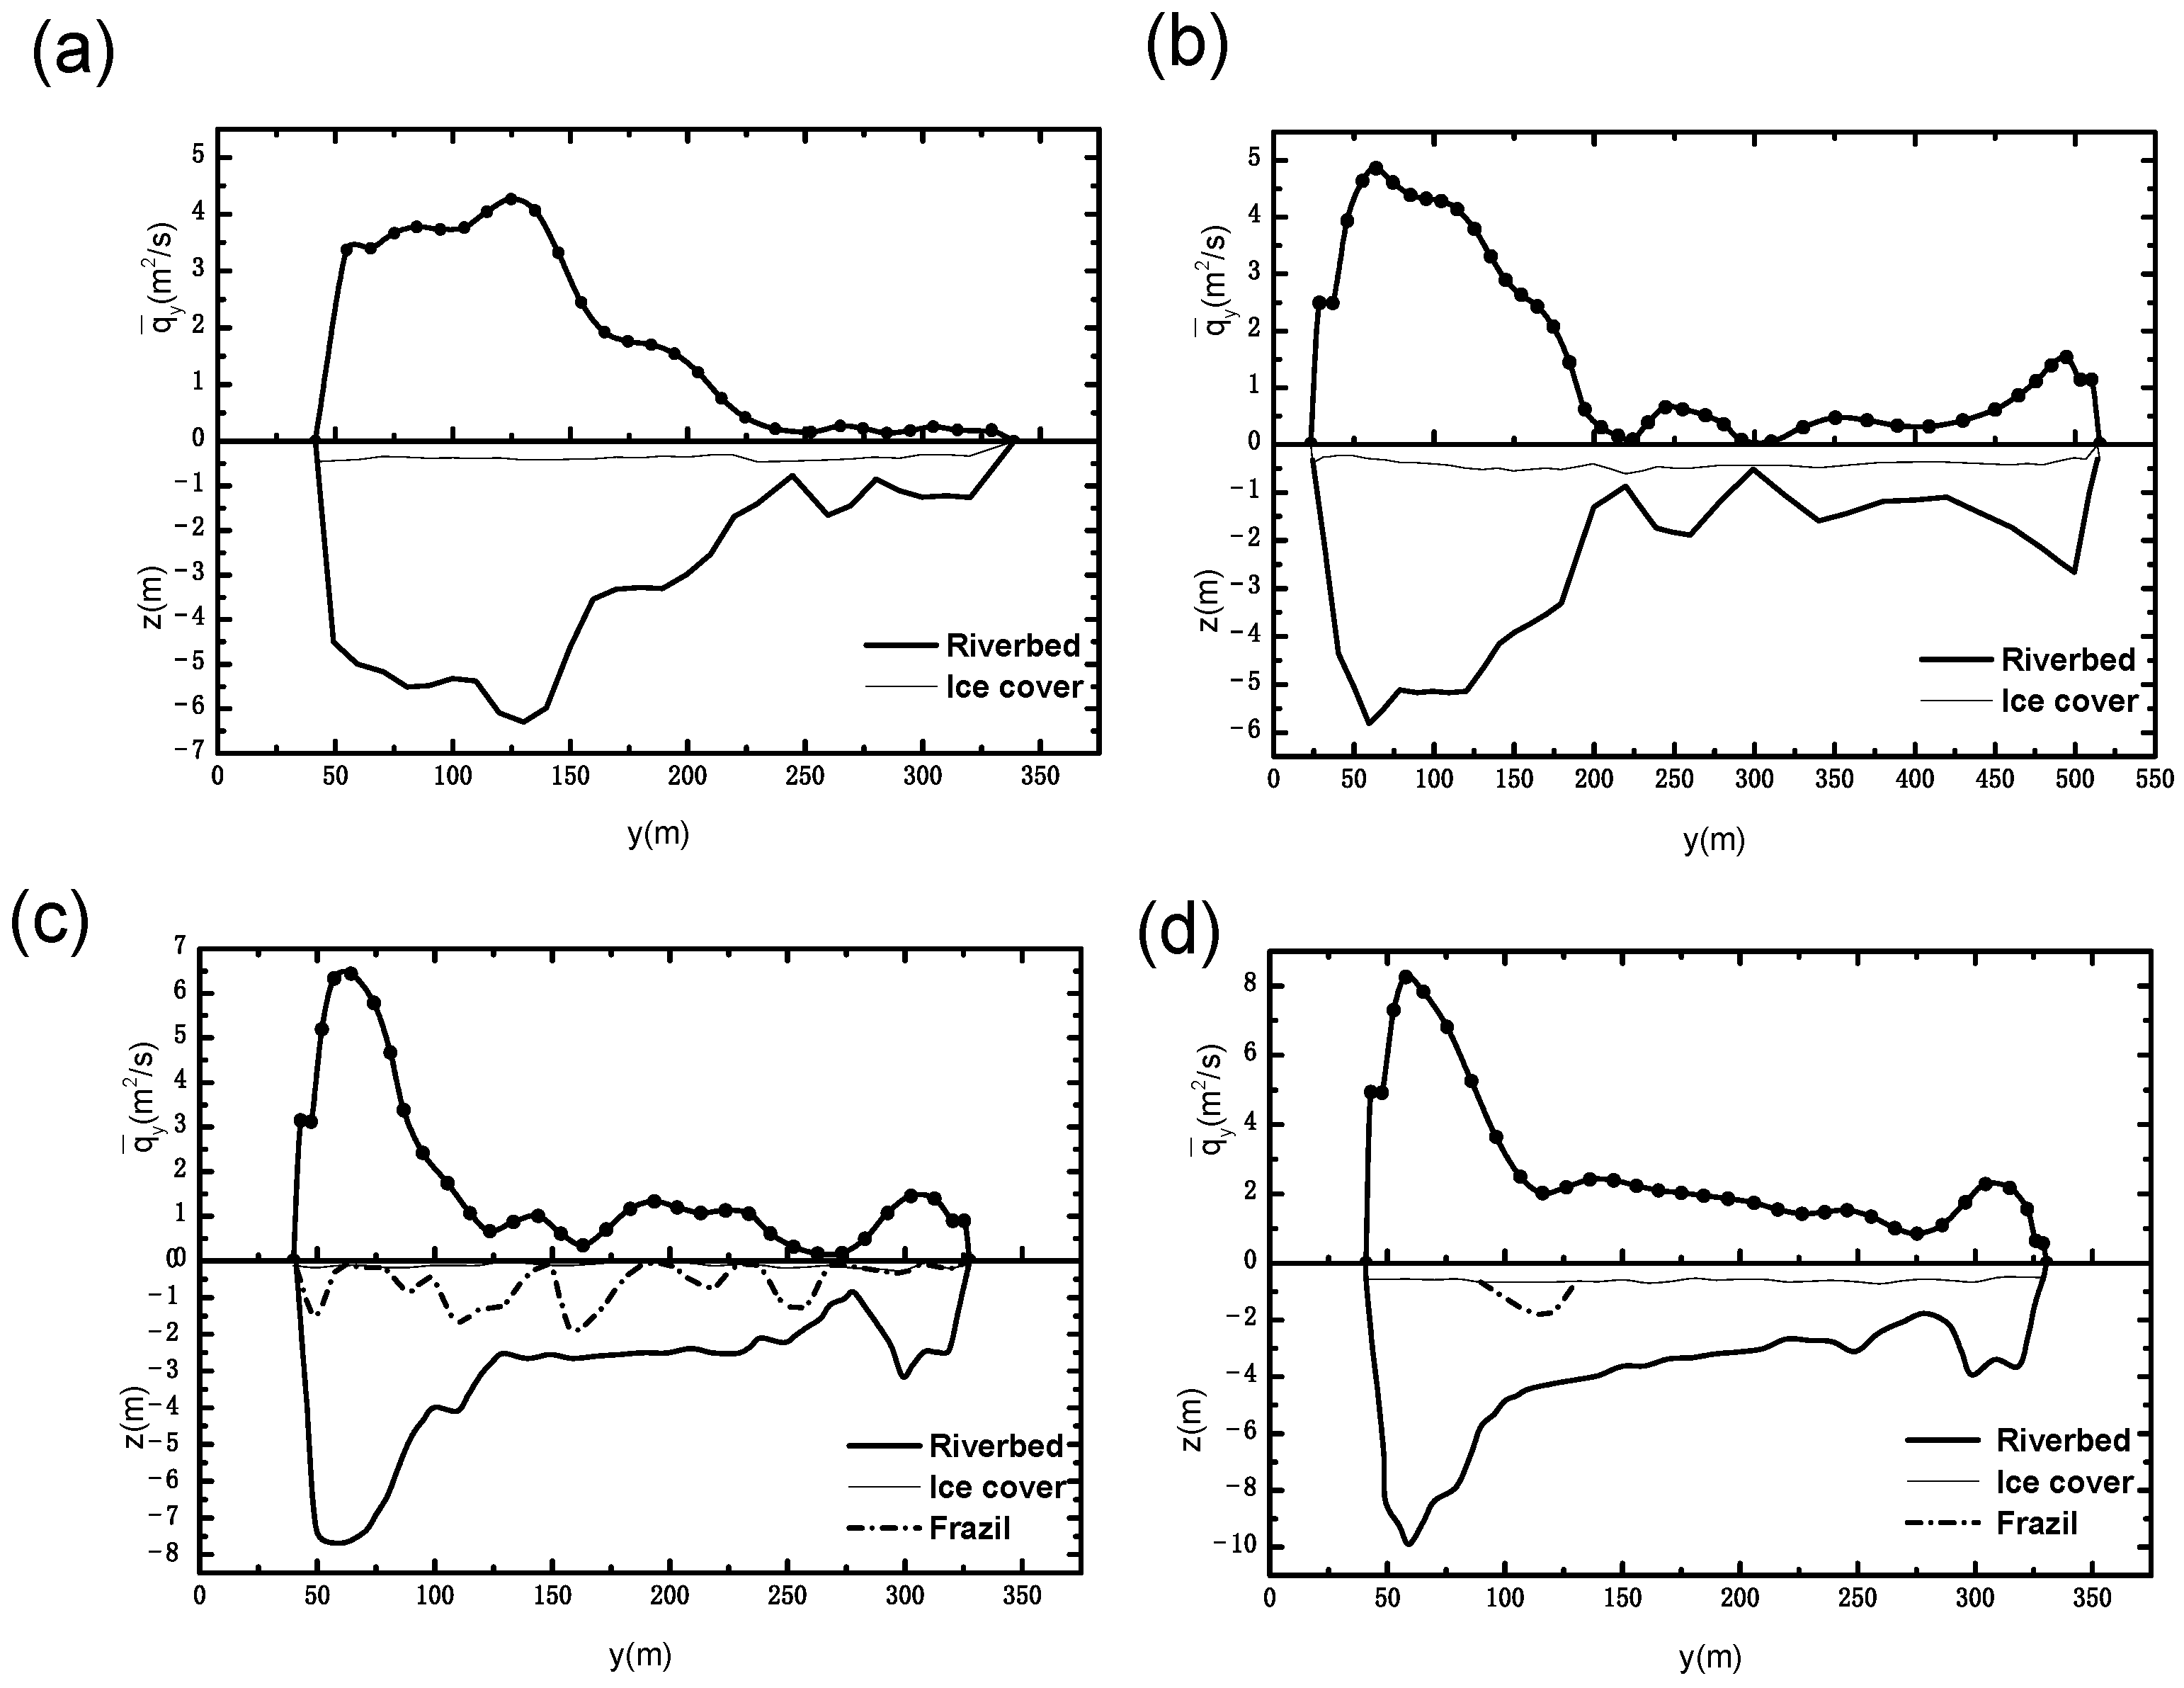
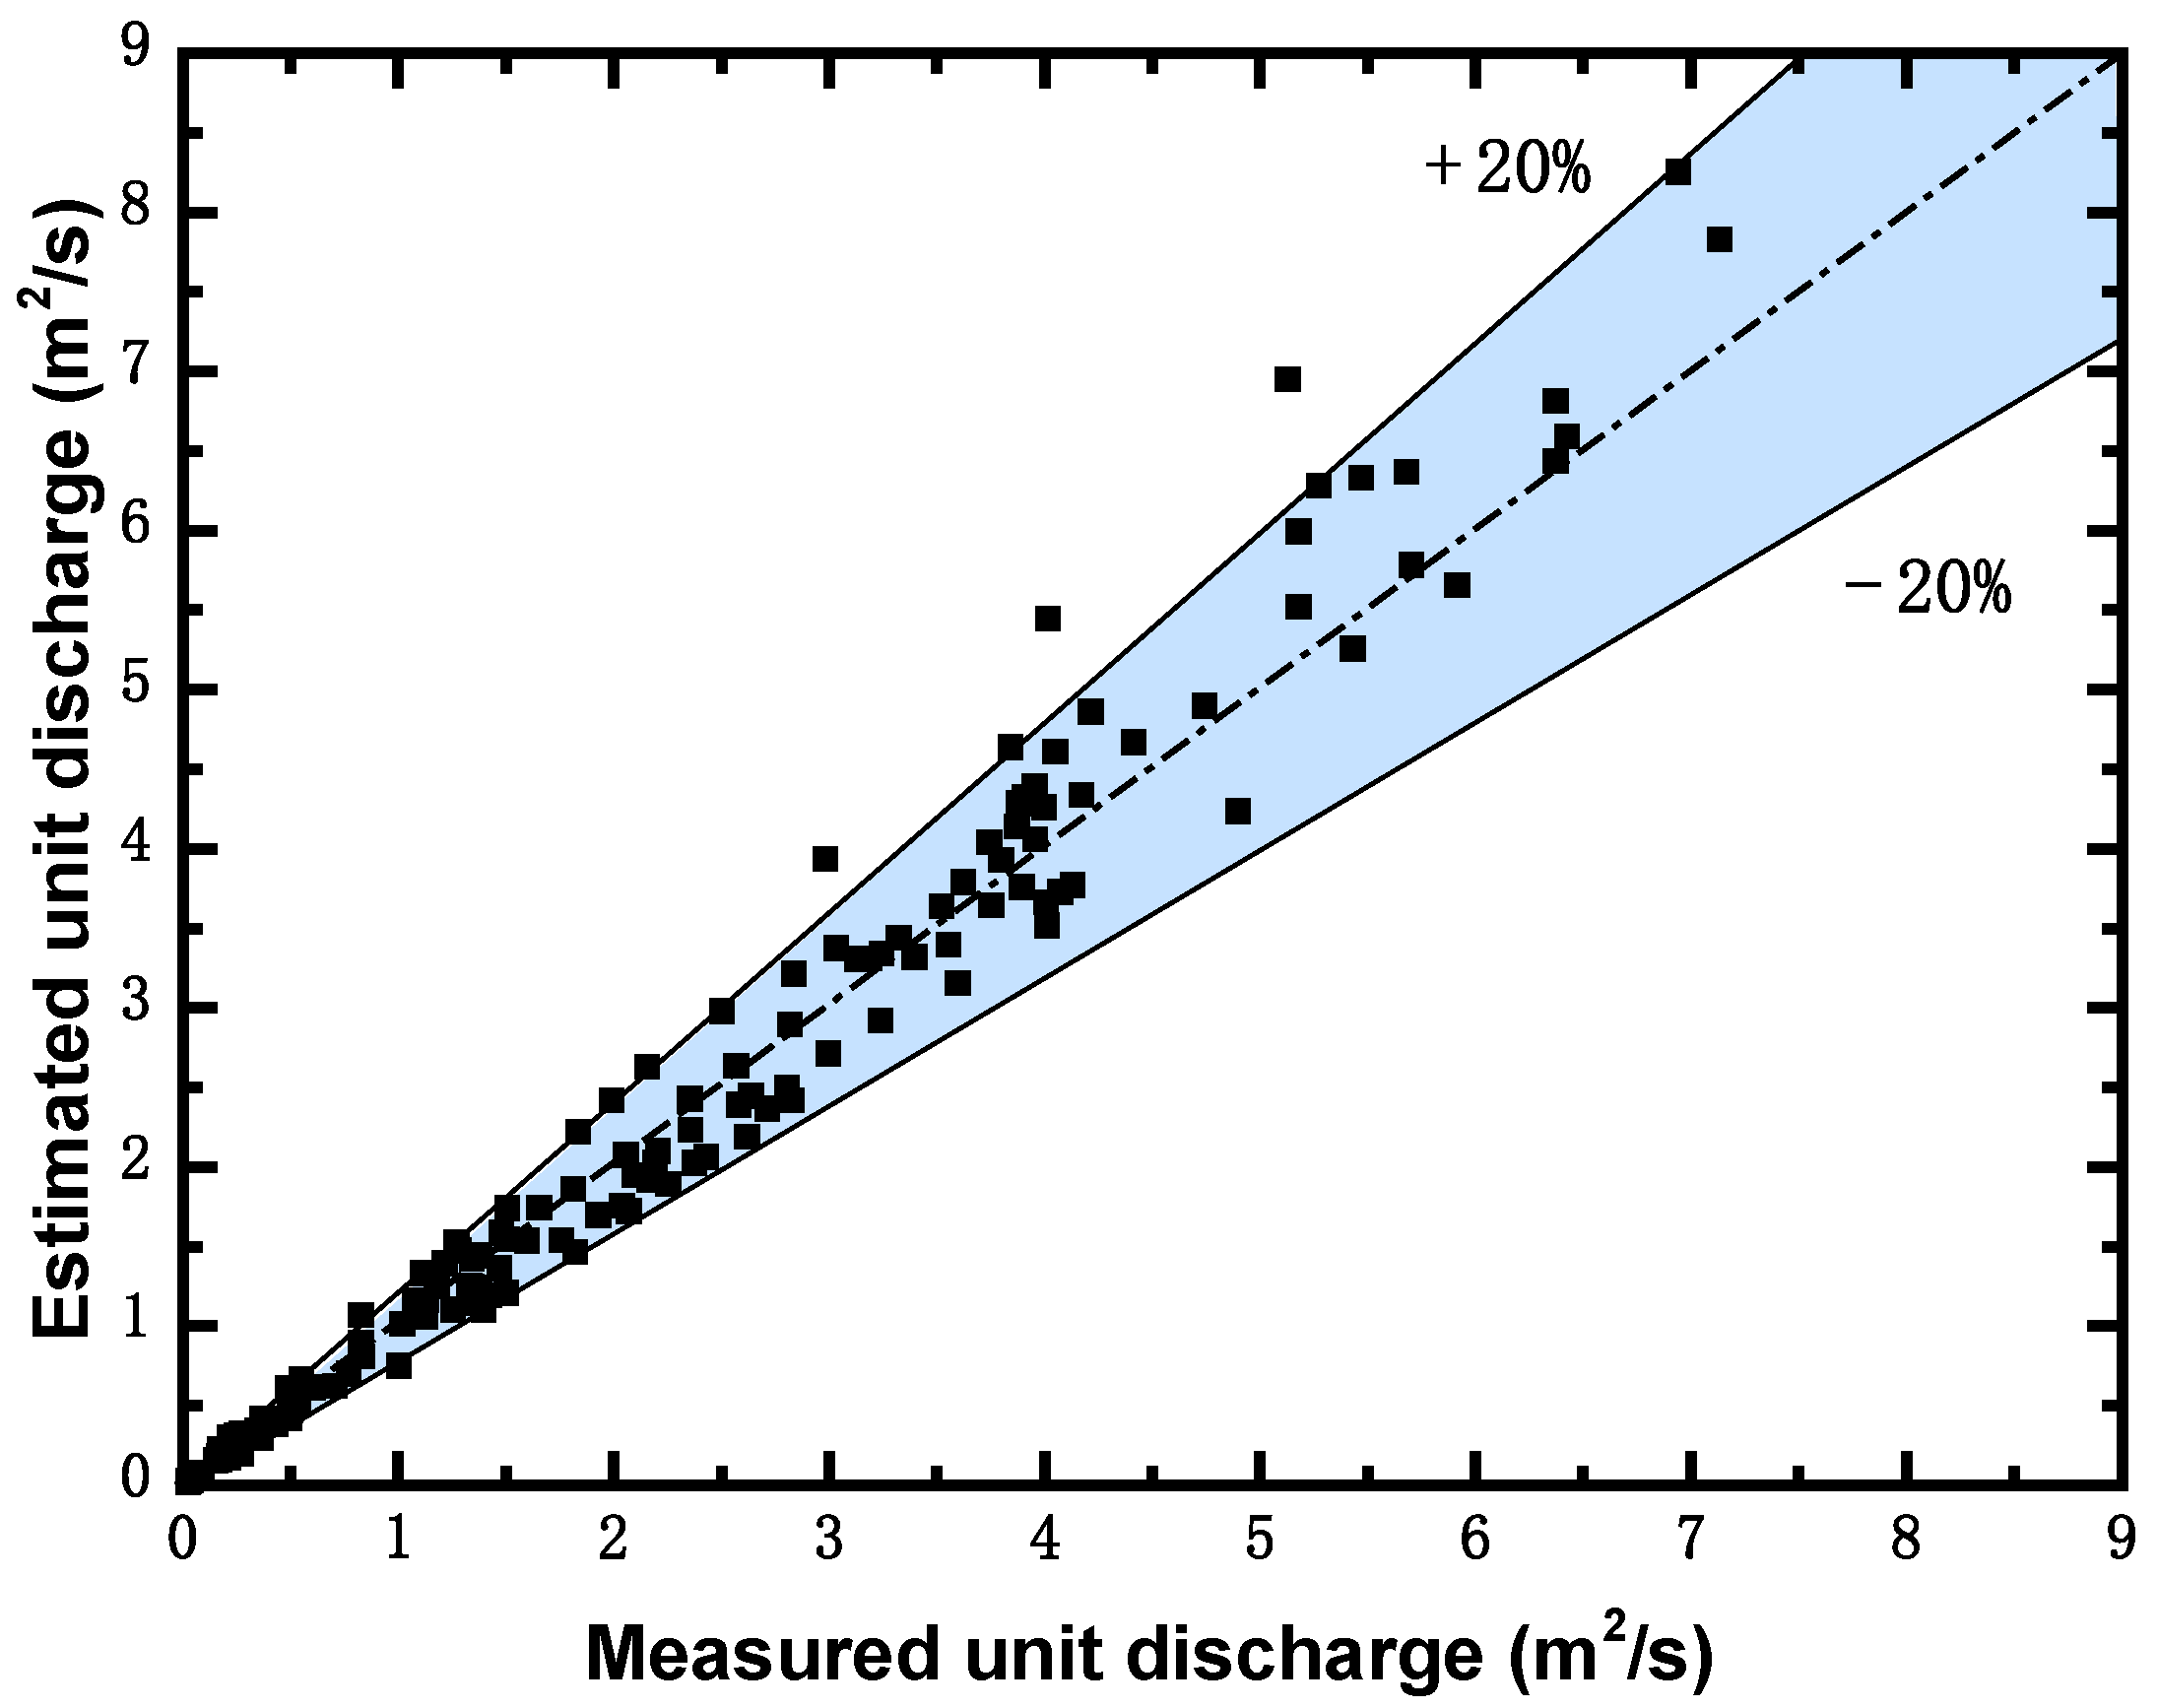
- By analyzing the parameter sensitivity of the flow-discharge measurement accuracy to the cross-section characteristic coefficient α and the typical survey-point position, the latter was found to have less influence on the flow-discharge measurement accuracy of the stream-tube method compared to the typical survey-point position. The cross-section characteristic coefficient was taken to be 0.5 and 0.25 for natural rivers and artificial channels, respectively. By analyzing the relationship between the relative unit discharge distributions of common river cross-sections and the cross-sectional flow-depth distributions, the survey point should be set at the thalweg of the section in the mainstream area. Using the proposed method at this suggested survey-point position, the percentage of measurement points with an estimated error of unit discharge less than 20% within the selected cross-section, including the laboratory flume model tests and natural-river data, reached 90.5% of all the measuring points.
Author Contributions
Funding
Data Availability Statement
Acknowledgments
Conflicts of Interest
Appendix A
| Data Source | Test | Discharge (m3/s) | Width Depth Ratio (B/H) | Resistance Parameter | ||
|---|---|---|---|---|---|---|
| mb | mi | rm | ||||
| Tatinclaux and Gogus [37] | Athabasca R., AL | 1850.00 | 85.00 | 5.73 | 2.44 | 2.35 |
| Athabasca R., AL | 1230.00 | 106.00 | 5.47 | 2.44 | 2.24 | |
| Athabasca R., AL | 850.00 | 121.00 | 5.04 | 1.85 | 2.72 | |
| Engmann [38] | 101 | 7.10 × 10⁻³ | 1.22 | 3.10 | 6.46 | 0.48 |
| 102 | 15.60 × 10⁻³ | 1.22 | 4.12 | 8.08 | 0.51 | |
| 103 | 12.70 × 10⁻³ | 1.22 | 4.60 | 7.54 | 0.61 | |
| 104 | 11.40 × 10⁻³ | 1.22 | 4.60 | 7.54 | 0.61 | |
| Parthasarathy and Muste [39] | R1 | 50.10 × 10⁻³ | 4.20 | 4.59 | 7.65 | 0.60 |
| R2 | 50.10 × 10⁻³ | 3.70 | 4.90 | 5.83 | 0.84 | |
| R3 | 50.10 × 10⁻³ | 3.10 | 4.70 | 4.56 | 1.03 | |
| Smith and Ettema [40] | S2 | 78.70 × 10⁻³ | 4.90 | 7.02 | 8.46 | 0.83 |
| M2 | 75.50 × 10⁻³ | 4.70 | 6.63 | 6.38 | 1.04 | |
| R2 | 75.40 × 10⁻³ | 4.40 | 5.73 | 4.74 | 1.21 | |
| S4 | 76.30 × 10⁻³ | 5.00 | 4.51 | 7.52 | 0.60 | |
| M4 | 75.30 × 10⁻³ | 4.80 | 4.79 | 5.70 | 0.84 | |
| R4 | 74.50 × 10⁻³ | 4.40 | 4.70 | 4.56 | 1.03 | |
| Wei and Huang [41] | Case 1 | 50.10 × 10⁻³ | 2.10 | 9.68 | 8.27 | 1.17 |
| Case 2 | 50.10 × 10⁻³ | 2.10 | 9.68 | 8.27 | 1.17 | |
| Case 3 | 50.10 × 10⁻³ | 2.10 | 9.68 | 8.27 | 1.17 | |
| Case 4 | 69.90 × 10⁻³ | 2.30 | 9.58 | 8.19 | 1.17 | |
| Case 5 | 60.00 × 10⁻³ | 2.50 | 9.48 | 8.10 | 1.17 | |
| Case 6 | 40.10 × 10⁻³ | 3.00 | 9.26 | 7.91 | 1.17 | |
| Case 7 | 30.30 × 10⁻³ | 3.50 | 9.26 | 7.91 | 1.17 | |
| Case 8 | 50.70 × 10⁻³ | 2.30 | 9.58 | 8.12 | 1.18 | |
| Case 10 | 50.00 × 10⁻³ | 2.60 | 8.00 | 3.15 | 2.54 | |
| Case 11 | 60.20 × 10⁻³ | 2.40 | 8.00 | 3.15 | 2.54 | |
| Case 12 | 50.20 × 10⁻³ | 2.50 | 8.00 | 3.15 | 2.54 | |
| Case 13 | 50.20 × 10⁻³ | 2.50 | 8.00 | 3.15 | 2.54 | |
| Case 15 | 50.70 × 10⁻³ | 2.10 | 3.45 | 3.05 | 1.13 | |
| Case 16 | 41.20 × 10⁻³ | 2.30 | 3.45 | 3.05 | 1.13 | |
| Attar and Li [33] | Salmon R., NB | 12.00 | 3.70 | 3.36 | 4.93 | 0.68 |
| S.W. Miramichi R., NB | 51.00 | 3.10 | 3.59 | 7.39 | 0.49 | |
| R. John, NS | 2.00 | 4.90 | 8.52 | 8.17 | 1.04 | |
| Kaministiquia R., ON | 43.00 | 4.70 | 4.10 | 6.01 | 0.68 | |
| Saugeen R., ON | 29.00 | 4.40 | 2.89 | 5.55 | 0.52 | |
| Nith R., ON | 1.50 | 5.00 | 4.54 | 6.76 | 0.67 | |
| Burnt R., ON | 10.00 | 4.80 | 3.20 | 5.48 | 0.58 | |
| Eels Cr.,ON | 1.94 | 4.40 | 3.78 | 5.08 | 0.74 | |
| Moira R., ON | 2.22 | 25.97 | 2.95 | 7.70 | 0.38 | |
| Salmon R., ON | 4.73 | 23.53 | 2.45 | 5.47 | 0.45 | |
| Upper Humber R., NF | 64.00 | 69.44 | 2.79 | 7.58 | 0.37 | |
| Terra Nova R., NF | 25.00 | 33.50 | 2.61 | 7.19 | 0.36 | |
| Groundhog R., ON | 86.00 | 51.03 | 3.50 | 4.66 | 0.75 | |
| Oldman R., AB | 2.33 | 136.00 | 2.94 | 7.14 | 0.41 | |
| Red Deer R., AB | 18.00 | 97.96 | 2.79 | 7.64 | 0.37 | |
| N.SaskatchewanR.,SK | 116.00 | 204.00 | 3.75 | 10.51 | 0.36 | |
| Ou’Appelle R., SA | 1.14 | 37.50 | 5.70 | 6.25 | 0.91 | |
| Beaver R., AB | 2.69 | 41.82 | 2.36 | 7.14 | 0.33 | |
| Pembina R., AB | 12.00 | 105.71 | 3.23 | 6.25 | 0.52 | |
| Halfway R., BC | 7.40 | 72.22 | 2.77 | 5.96 | 0.46 | |
| Litle Smoky R., AB | 11.50 | 97.50 | 3.22 | 9.02 | 0.36 | |
| Peace R., NWT | 1111.00 | 116.70 | 5.44 | 9.22 | 0.59 | |
| Yellowknife R., NWT | 24.00 | 24.00 | 3.55 | 5.92 | 0.60 | |
| Fraser R., BC | 32.00 | 73.08 | 3.25 | 6.37 | 0.51 | |
| Takhini R. YT | 14.00 | 32.86 | 3.12 | 5.96 | 0.52 | |
| Yukon R., YT | 246.00 | 58.00 | 3.69 | 7.06 | 0.52 | |
| Lu [34] | 2.1–2.3 floodplain | 0.05–0.09 | 4.50–9.00 | 7.28 | 2.66 | 2.74 |
| 3.1–3.3 floodplain | 0.05–0.09 | 4.50–9.00 | 9.08 | 2.85 | 3.19 | |
| 2.1–2.3 main channel | 0.05–0.09 | 3.00–5.00 | 7.62 | 4.52 | 1.69 | |
| 3.1–3.3 main channel | 0.05–0.09 | 3.00–5.00 | 8.25 | 4.14 | 1.99 | |
References
- Rokaya, P.; Budhathoki, S.; Lindenschmidt, K.E. Trends in the timing and magnitude of ice-jam floods in Canada. Sci. Rep. 2018, 8, 5834. [Google Scholar] [CrossRef] [PubMed] [Green Version]
- Ettema, R. Review of alluvial-channel responses to river ice. J. Cold Reg. Eng. 2002, 16, 191–217. [Google Scholar] [CrossRef]
- Lees, K.; Clark, S.P.; Malenchak, J.; Chanel, P. Characterizing ice cover formation during freeze-up on the regulated Upper Nelson River, Manitoba. J. Cold Reg. Eng. 2021, 35, 04021009. [Google Scholar] [CrossRef]
- Healy, D.; Hicks, F.E. Index velocity methods for winter discharge measurement. Can. J. Civil Eng. 2004, 31, 407–419. [Google Scholar] [CrossRef]
- Yang, K.L. Lateral distribution of depth-averaged velocities in ice-covered channels. J. Hydraul. Eng. 2015, 46, 291–297. (In Chinese) [Google Scholar]
- Peters, M.; Dow, K.; Clark, S.P.; Malenchak, J.; Danielson, D. Experimental investigation of the flow characteristics beneath partial ice covers. Cold Reg. Sci. Technol. 2017, 142, 69–78. [Google Scholar] [CrossRef]
- Kimiaghalam, N.; Clark, S.P.; Dow, K. Flow characteristics of a partially-covered trapezoidal channel. Cold Reg. Sci. Technol. 2018, 155, 280–288. [Google Scholar] [CrossRef]
- Wang, J.; Sui, J.Y.; Karney, B.W. Incipient motion of non-cohesive sediment under ice cover—An experimental study. J. Hydrodyn. 2008, 20, 117–124. [Google Scholar] [CrossRef]
- Wang, J.; He, L.; Chen, P.P.; Sui, J.Y. Numerical simulation of mechanical breakup of river ice-cover. J. Hydrodyn. 2013, 25, 415–421. [Google Scholar] [CrossRef]
- Alfredsen, K. An assessment of ice effects on indices for hydrological alteration in flow regimes. Water 2017, 9, 914. [Google Scholar] [CrossRef] [Green Version]
- Beltaos, S.; Burrell, B.C. Effects of river-ice breakup on sediment transport and implications to stream environments: A review. Water 2021, 13, 2541. [Google Scholar] [CrossRef]
- Hu, H.T.; Wang, J.; Cheng, T.J.; Hou, Z.X.; Sui, J.Y. Channel bed deformation and ice jam evolution around bridge piers. Water 2022, 14, 1766. [Google Scholar] [CrossRef]
- Fulton, J.W.; Henneberg, M.F.; Mills, T.J.; Kohn, M.S.; Epstein, B.; Hittle, E.A.; Damschen, W.C.; Laveau, C.D.; Lambrecht, J.M.; Farmer, W.H. Computing under-ice discharge: A proof-of-concept using hydro acoustics and the Probability Concept. J. Hydrol. 2018, 562, 733–748. [Google Scholar] [CrossRef]
- Lama, G.F.C.; Errico, A.; Pasquino, V.; Mirzaei, S.; Preti, F.; Chirico, G.B. Velocity uncertainty quantification based on riparian vegetation indices in open channels colonized by phragmites australis. J. Ecohydraulics 2022, 7, 71–76. [Google Scholar] [CrossRef]
- Lama, G.F.C.; Sadeghifar, T.; Azad, M.T.; Sihag, P.; Kisi, O. On the indirect estimation of wind wave heights over the southern coasts of caspian sea: A comparative analysis. Water 2022, 4, 843. [Google Scholar] [CrossRef]
- Khan, M.A.; Sharma, N.; Lama, G.F.C.; Hasan, M.; Garg, R.; Busico, G.; Alharbi, R.S. Three-Dimensional Hole Size (3DHS) approach for water flow turbulence analysis over emerging sand bars: Flume-scale experiments. Water 2022, 14, 1889. [Google Scholar] [CrossRef]
- Walker, J.F. Accuracy of selected techniques for estimating ice-affected streamflow. J Hydraul. Eng. 1991, 117, 697–712. [Google Scholar] [CrossRef]
- Shen, H.T.; Ackermann, N.L. Wintertime flow distribution in river channels. J. Hydraul. Div. 1980, 106, 805–817. [Google Scholar] [CrossRef]
- Pan, J.J.; Guo, X.L.; Wang, T.; Fu, H.; Li, J.Z.; Guo, Y.Y. A novel technique for flow discharge and depth-averaged streamwise velocity in ice periods based on stream tube methods. J. Hydraul. Eng. 2020, 51, 1536–1543. (In Chinese) [Google Scholar]
- Lau, Y.L. Velocity distributions under floating covers. Can. J. Civil Eng. 1982, 9, 76–83. [Google Scholar] [CrossRef]
- Mao, Z.Y.; Luo, S.; Zhao, S.W.; Xiang, P.; Yue, G.X. Study on the velocity distributions for ice-covered flow. Adv. Water Sci. 2006, 17, 209–215. (In Chinese) [Google Scholar]
- Shiono, K.; Knight, D.W. Turbulent open-channel flows with variable depth across the channel. J. Fluid Mech. 1991, 222, 617–646. [Google Scholar] [CrossRef]
- Odgaard, A.J. River-meander model. I: Development. J. Hydraul. Eng. 1989, 115, 1433–1450. [Google Scholar] [CrossRef]
- Tsai, W.F.; Ettema, R. Ice cover influence on transverse bed slopes in a curved alluvial channel. J. Hydraul. Res. 1994, 32, 561–581. [Google Scholar] [CrossRef]
- Walker, J.; Wang, D.F. Measurement of flow under ice covers in North America. J. Hydraul. Eng. 1997, 123, 1037–1040. [Google Scholar] [CrossRef]
- Walker, J.F. Methods for measuring discharge under ice cover. J. Hydraul. Eng. 1994, 120, 1327–1336. [Google Scholar] [CrossRef]
- Teal, M.; Ettema, R.J.; Walker, J.F. Estimation of mean flow velocity in ice-covered channels. J. Hydraul. Eng. 1994, 120, 1385–1400. [Google Scholar] [CrossRef]
- Shan, H.; Kerenyi, K.; Patel, N.; Guo, J. Laboratory test of second log-wake law for effects of ice cover and wind shear stress on river velocity distributions. J. Cold Reg. Eng. 2022, 36, 04022001. [Google Scholar] [CrossRef]
- ISO 9196; Liquid Flow Measurement in Open Channels Flow Measurements under Ice Conditions. International Organisation for Standardisation: Geneva, Switzerland, 1992.
- Einstein, H.A. Formulas for the transportation of bed-load. Trans. ASCE 1942, 107, 561–597. [Google Scholar] [CrossRef]
- Fu, H.; Liu, Z.P.; Guo, X.L.; Cui, H.T. Double-frequency ground penetrating radar for measurement of ice thickness and water depth in rivers and canals: Development, verification and application. Cold Reg. Sci. Technol. 2018, 154, 85–94. [Google Scholar] [CrossRef]
- Su, L.P. Study on the calculation method of vertical average velocity of cross section by three point method. Yangtze River 1982, 1, 76–80. (In Chinese) [Google Scholar]
- Attar, S.; Li, S.S. Data-fitted velocity profiles for ice-covered rivers. Can. J. Civil Eng. 2012, 39, 334–338. [Google Scholar] [CrossRef]
- Lu, J.Z. Theoretical and Experimental Study on the Mechanism of Ice River Coupling in Compound Open Channel. Master’s Thesis, China Institute of Water Resources and Hydropower Research, Beijing, China, 2020. (In Chinese). [Google Scholar]
- Wang, F.F.; Huai, W.X.; Liu, M.Y.; Fu, X.C. Modeling depth-averaged streamwise velocity in straight trapezoidal compound channels with ice cover. J. Hydrol. 2020, 585, 124336. [Google Scholar] [CrossRef]
- Wang, C.Q.; Wang, P.W.; Fan, M.H.; Chen, D.L.; Liu, J.F. Study on Temperature Prediction and Ice Condition Observation Technology in Inner Mongolia Reach of the Yellow River; China Water & Power Press: Beijing, China, 2017. [Google Scholar]
- Tatinclaux, J.C.; Gogus, M. Asymmetric plane flow with application to ice jams. J. Hydraul. Eng. 1983, 109, 1540–1554. [Google Scholar] [CrossRef]
- Engmann, E.O. Turbulent diffusion in channels with a surface cover. J. Hydraul. Res. 1977, 15, 327–335. [Google Scholar] [CrossRef]
- Parthasarathy, R.; Muste, M.N. Velocity measurements in asymmetric turbulent channel flows. J. Hydraul. Eng. 1994, 120, 1000–1020. [Google Scholar] [CrossRef]
- Smith, B.; Ettema, R.T. Flow resistance in ice-covered alluvial channels. J. Hydraul. Eng. 1997, 123, 592–599. [Google Scholar] [CrossRef]
- Wei, L.Y.; Huang, J.Z. Composite manning roughness coefficient of ice-covered flow. Engrg J. WHU 2002, 4, 1–8. (In Chinese) [Google Scholar]
- Chen, G.; Gu, S.X.; Li, B.; Zhou, M.; Huai, W.X. Physically based coefficient for streamflow estimation in ice-covered channels. J. Hydrol. 2018, 563, 470–479. [Google Scholar] [CrossRef]





| Method | Selection Point Position | Coefficient | |
| One-point method | one-point method 1 | 0.5H | 0.88 |
| one-point method 2 | 0.6H | 0.92 | |
| Two-point method | two-point method 1 | 0.2H, 0.8H | |
| two-point method 2 | 0.4H, 0.8H | 0.32, 0.68 | |
| Three-point method | three-point method 1 | 0.15H, 0.5H, 0.85H | |
| three-point method 2 | 0.2H, 0.6H, 0.8H | ||
| method proposed by Shan et al. | 0.2H, 0.5H, 0.8H | 0.67, −0.34, 0.67 | |
| Six-point method | six-point method | 0.03H, 0.2H, 0.4H, 0.6H, 0.8H, 0.95H [32] |
| Estimation Method | Estimation Error |
|---|---|
| One-point method 1 | |
| One-point method 2 | |
| Two-point method 1 | |
| Two-point method 2 | |
| Three-point method 1 | |
| Three-point method 2 | |
| Method proposed by Shan et al. | |
| Six-point method | |
Publisher’s Note: MDPI stays neutral with regard to jurisdictional claims in published maps and institutional affiliations. |
© 2022 by the authors. Licensee MDPI, Basel, Switzerland. This article is an open access article distributed under the terms and conditions of the Creative Commons Attribution (CC BY) license (https://creativecommons.org/licenses/by/4.0/).
Share and Cite
Lu, J.; Guo, X.; Pan, J.; Fu, H.; Wu, Y.; Mao, Z. Contrast Analysis of Flow-Discharge Measurement Methods in a Wide–Shallow River during Ice Periods. Water 2022, 14, 3996. https://doi.org/10.3390/w14243996
Lu J, Guo X, Pan J, Fu H, Wu Y, Mao Z. Contrast Analysis of Flow-Discharge Measurement Methods in a Wide–Shallow River during Ice Periods. Water. 2022; 14(24):3996. https://doi.org/10.3390/w14243996
Chicago/Turabian StyleLu, Jinzhi, Xinlei Guo, Jiajia Pan, Hui Fu, Yihong Wu, and Zeyu Mao. 2022. "Contrast Analysis of Flow-Discharge Measurement Methods in a Wide–Shallow River during Ice Periods" Water 14, no. 24: 3996. https://doi.org/10.3390/w14243996
APA StyleLu, J., Guo, X., Pan, J., Fu, H., Wu, Y., & Mao, Z. (2022). Contrast Analysis of Flow-Discharge Measurement Methods in a Wide–Shallow River during Ice Periods. Water, 14(24), 3996. https://doi.org/10.3390/w14243996


