Groundwater Quality and Potential Pollution in the Southern Shimabara Peninsula, Japan
Abstract
:1. Introduction
2. Materials and Methods
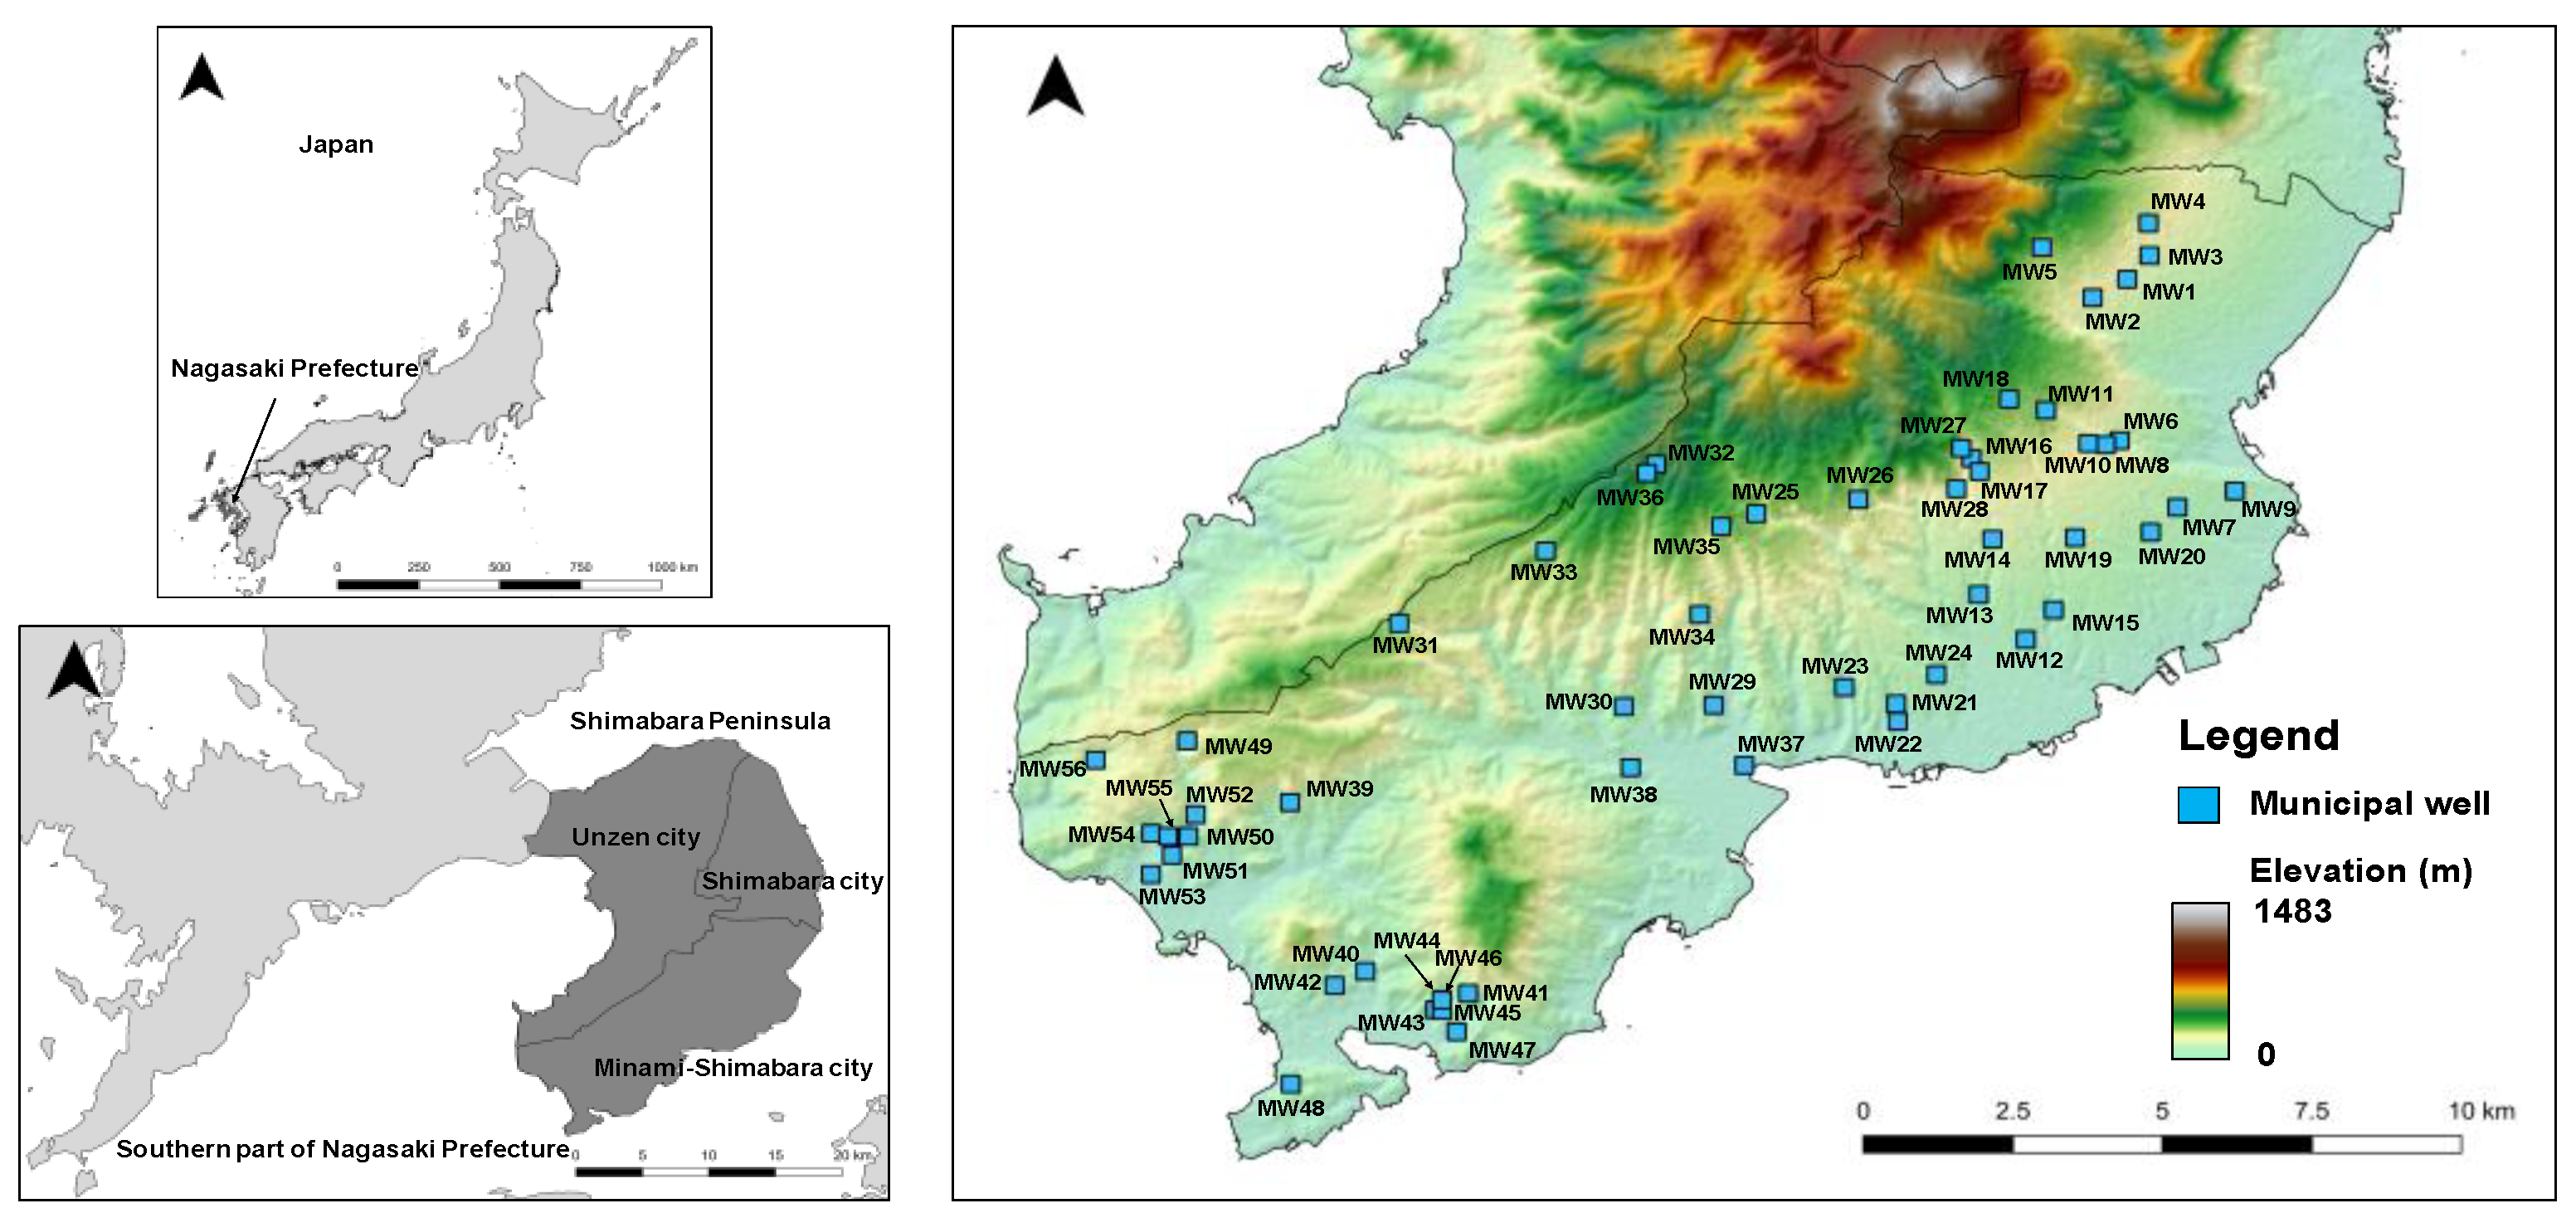
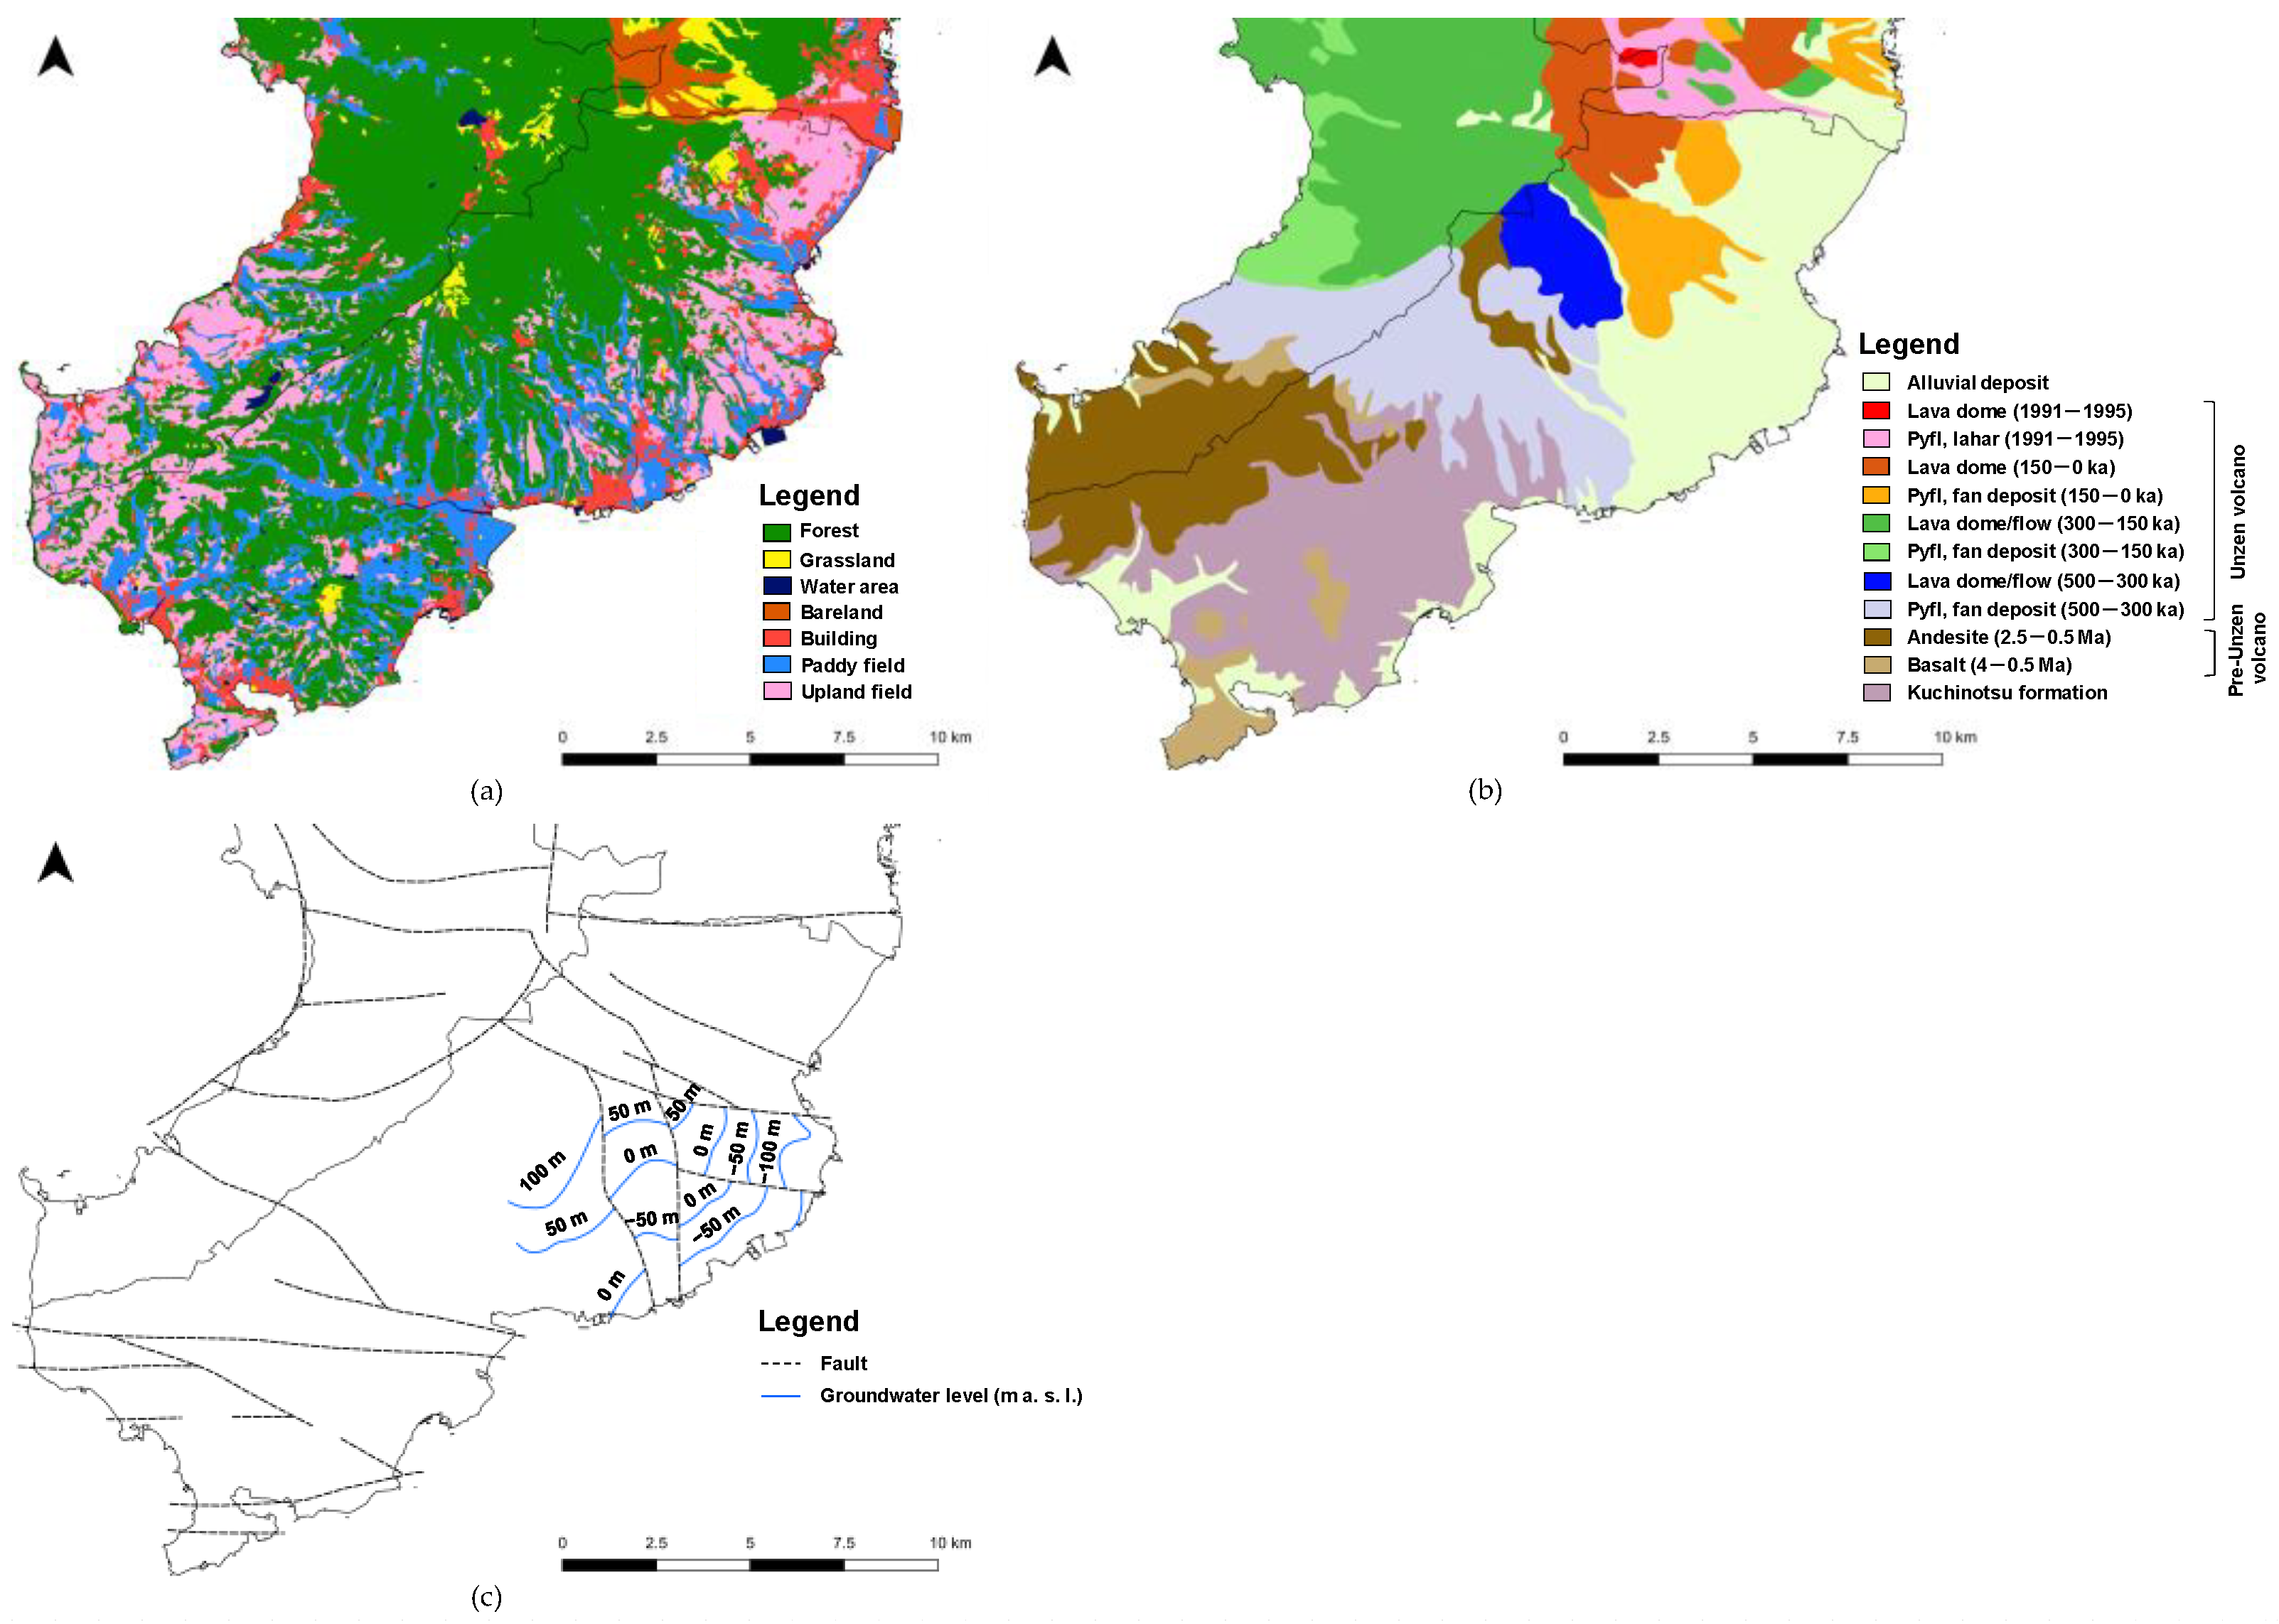
2.1. Study Area
2.2. Sampling and Analyses
3. Results and Discussion
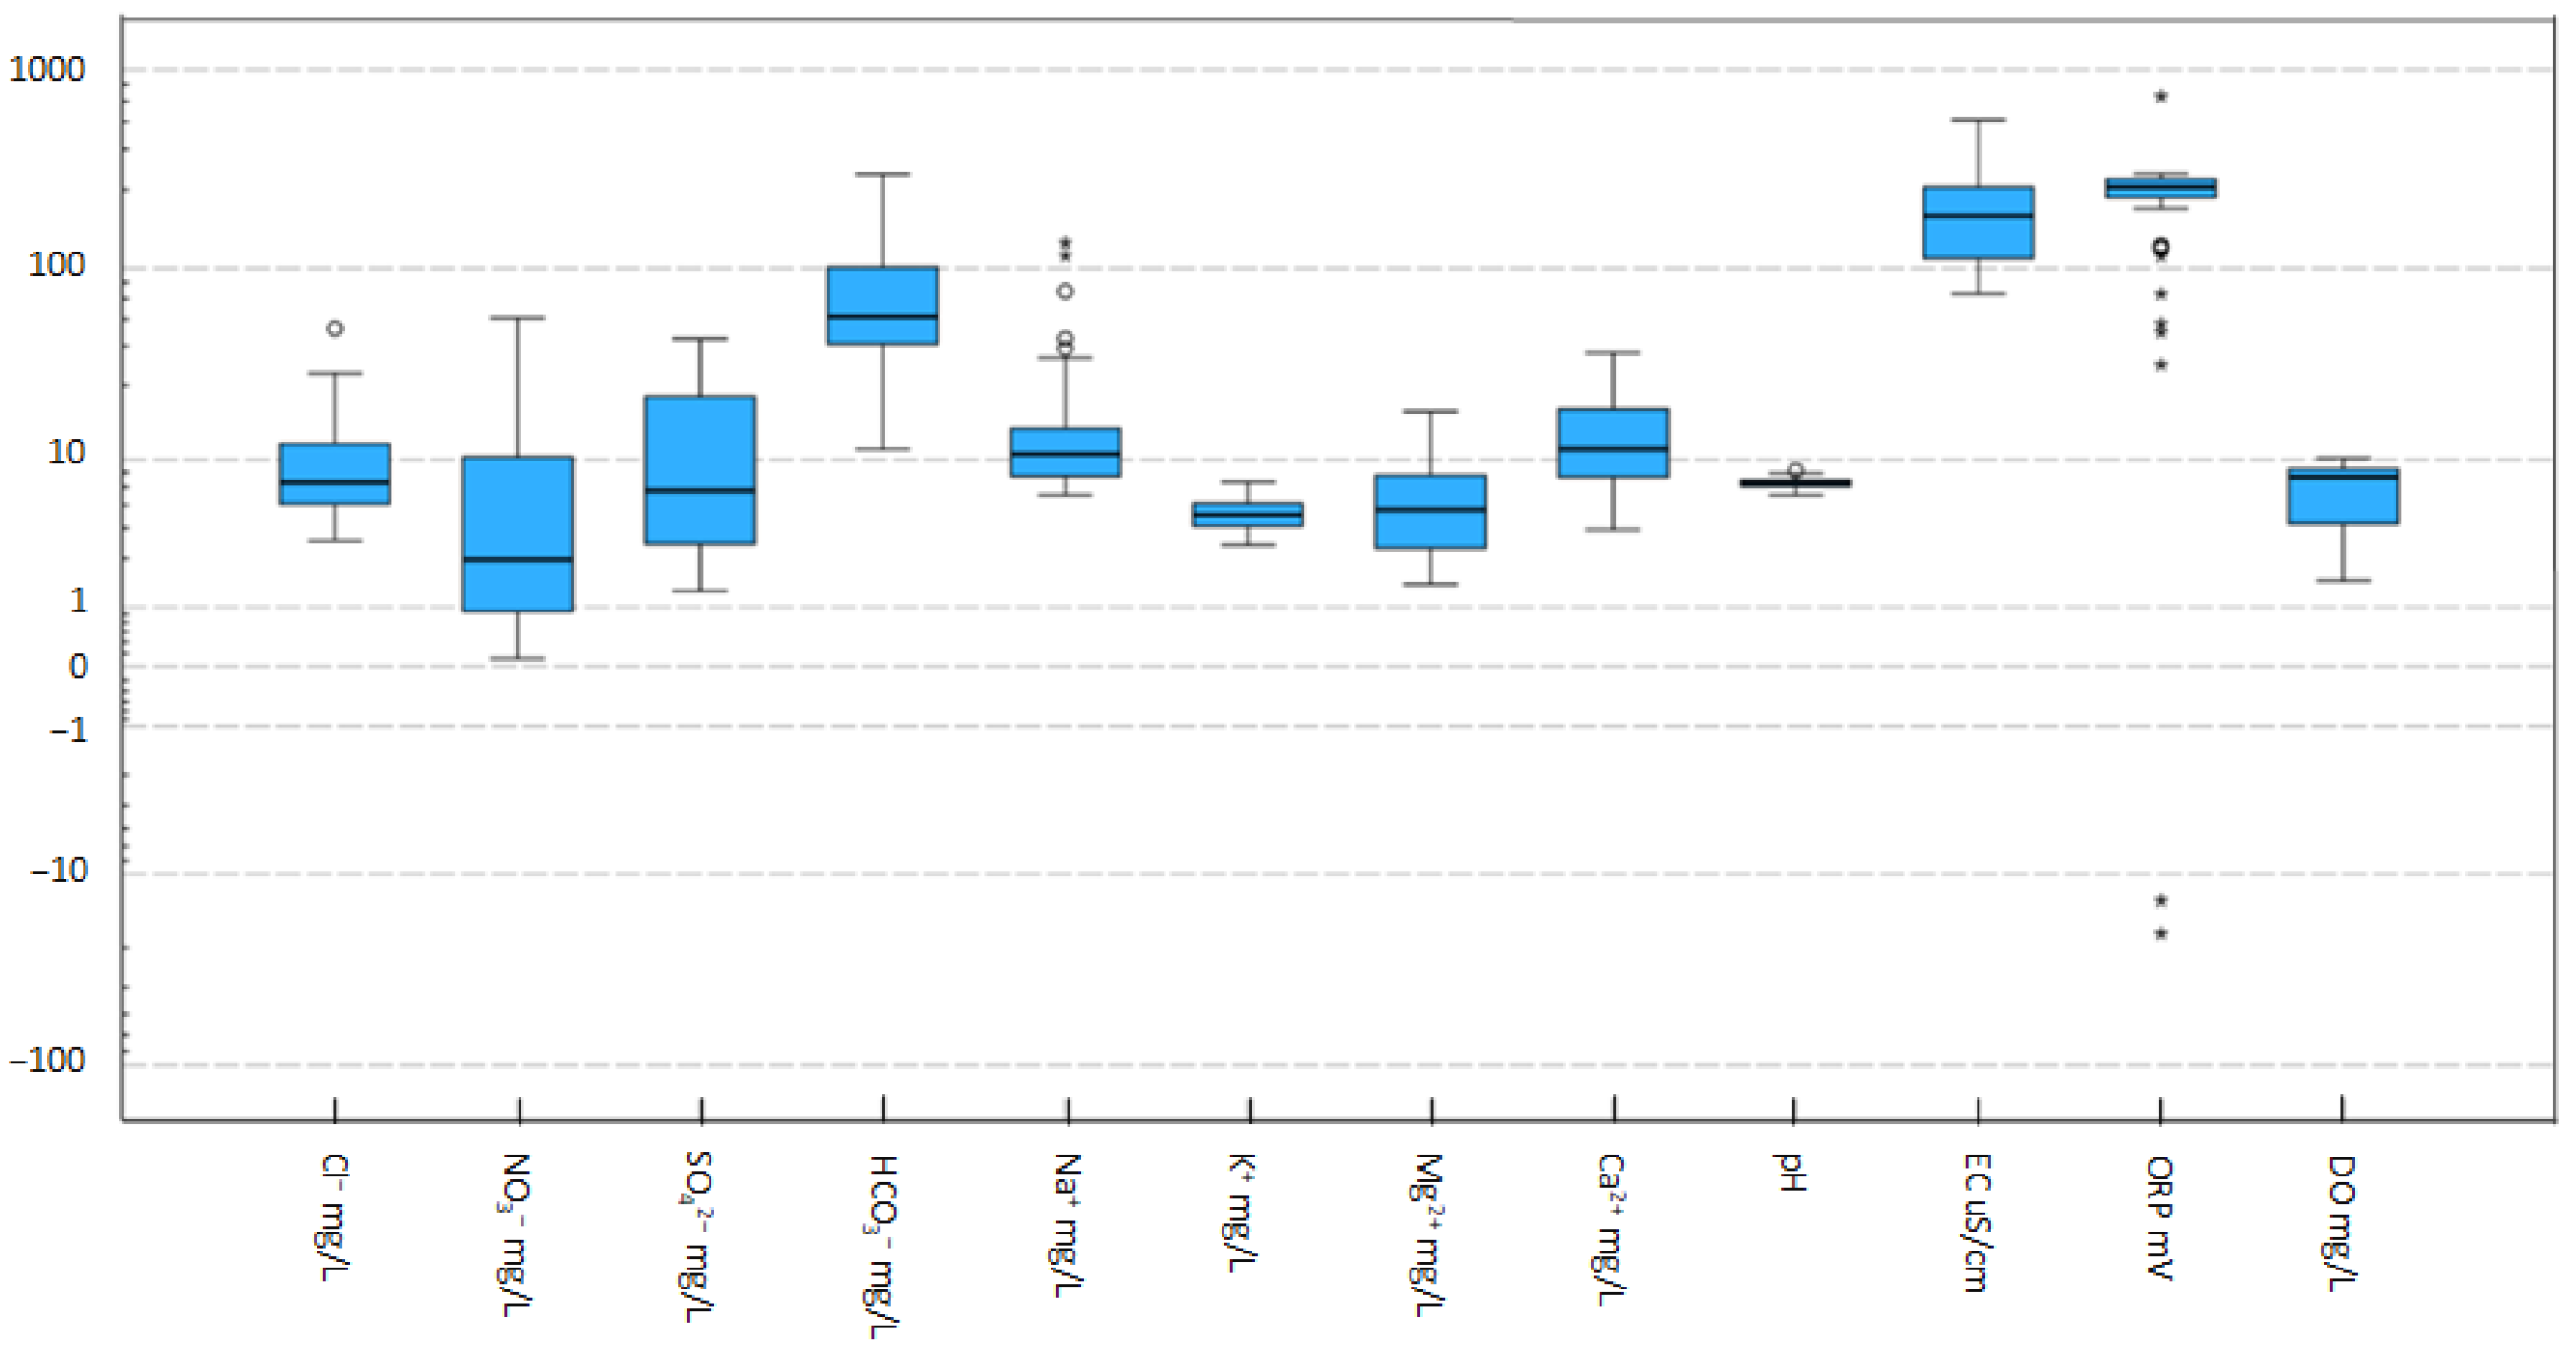
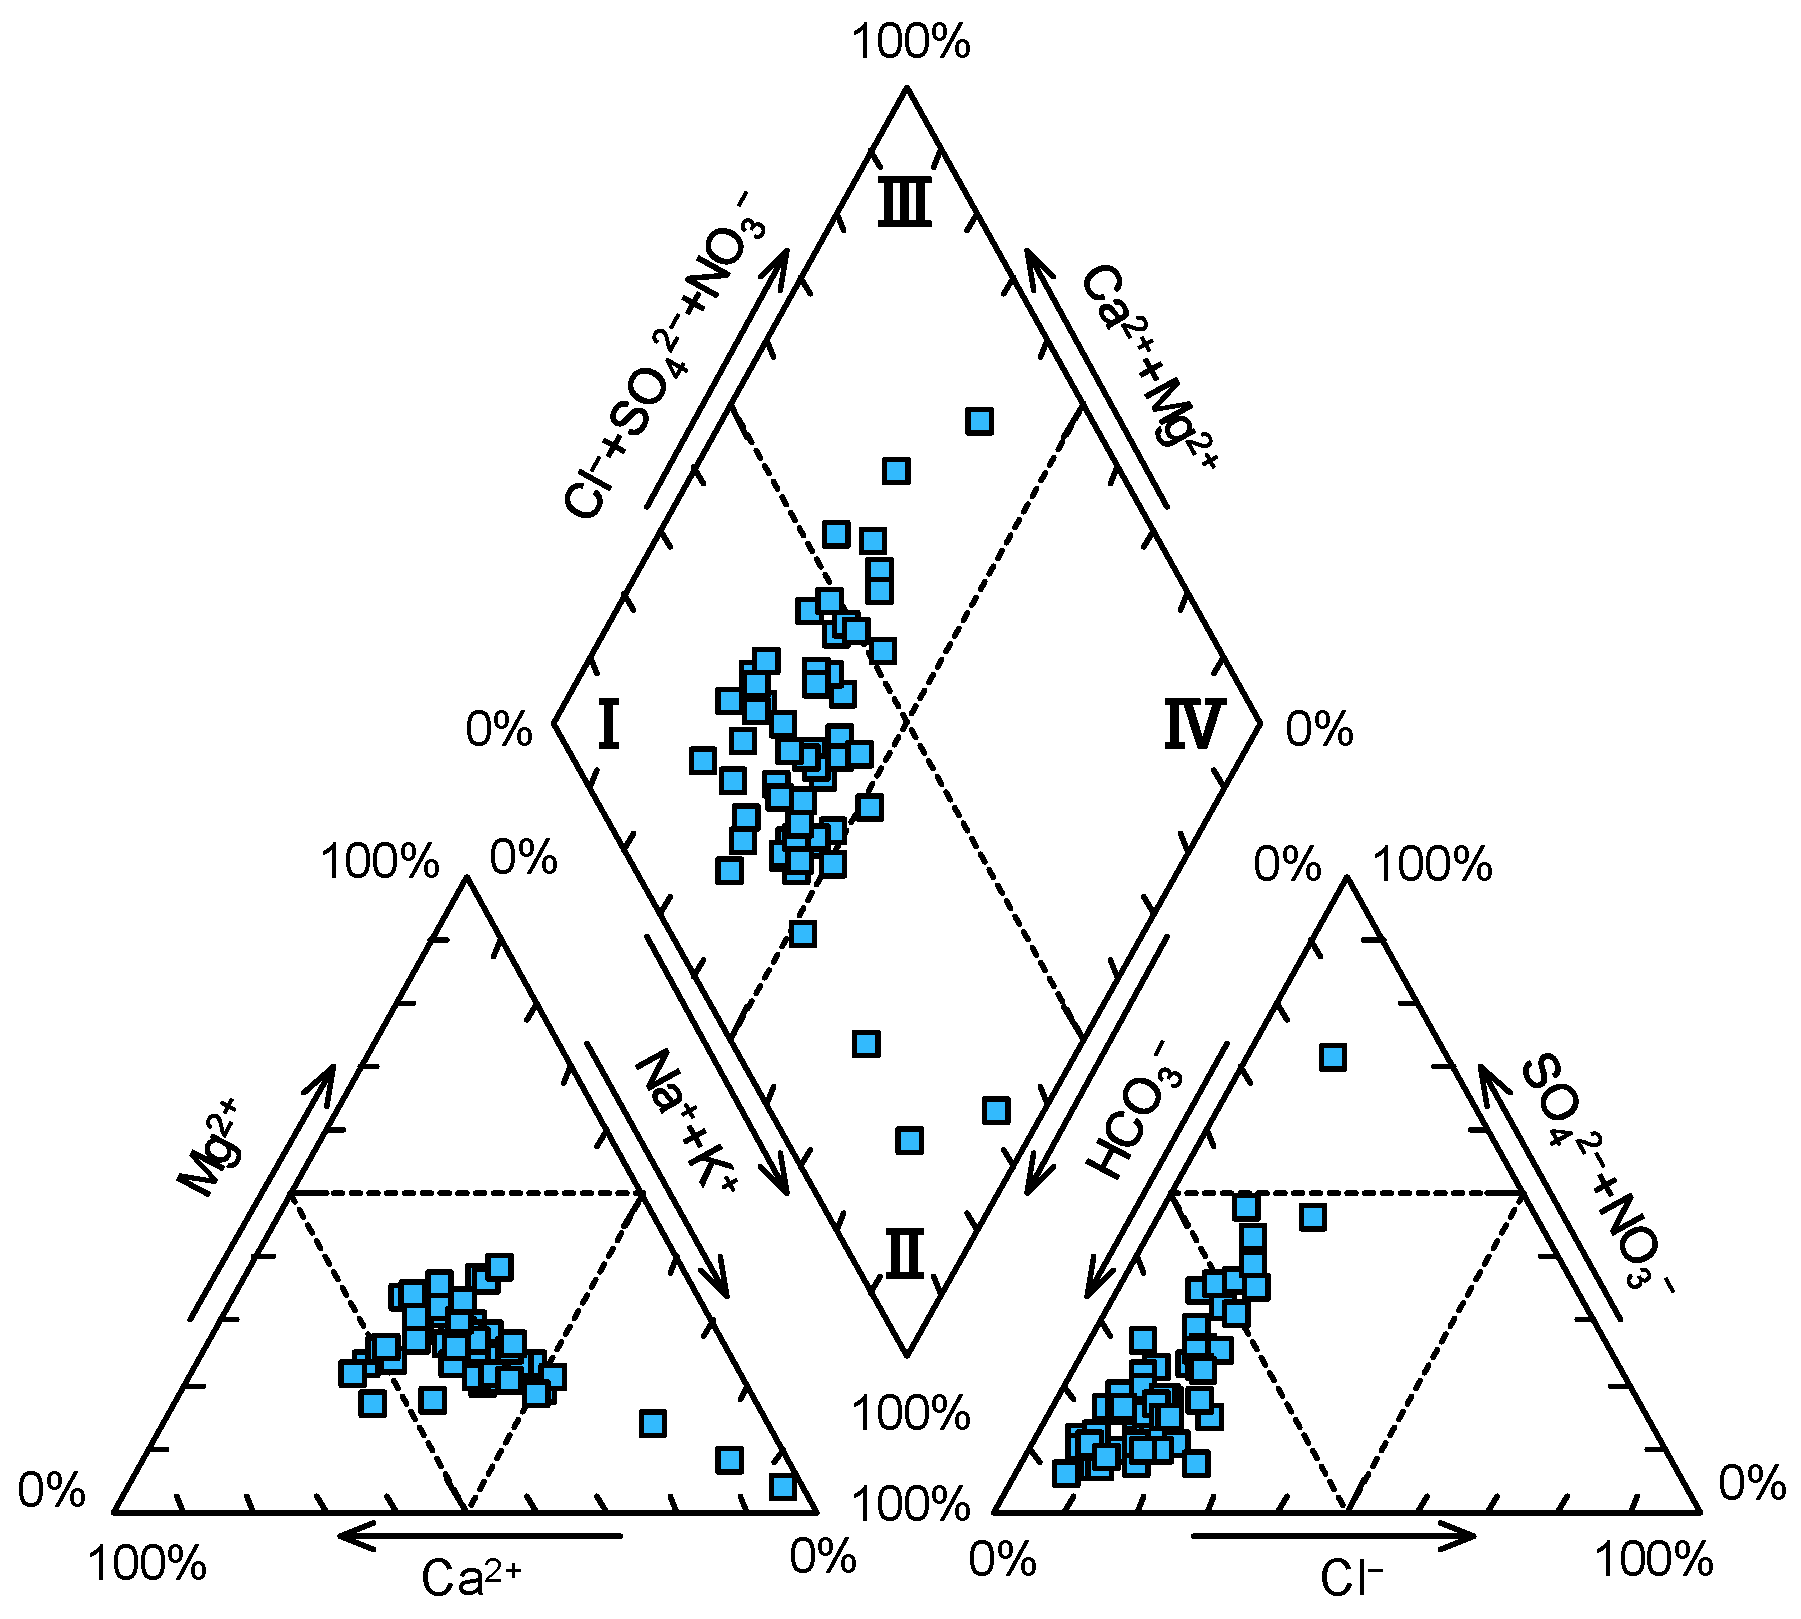
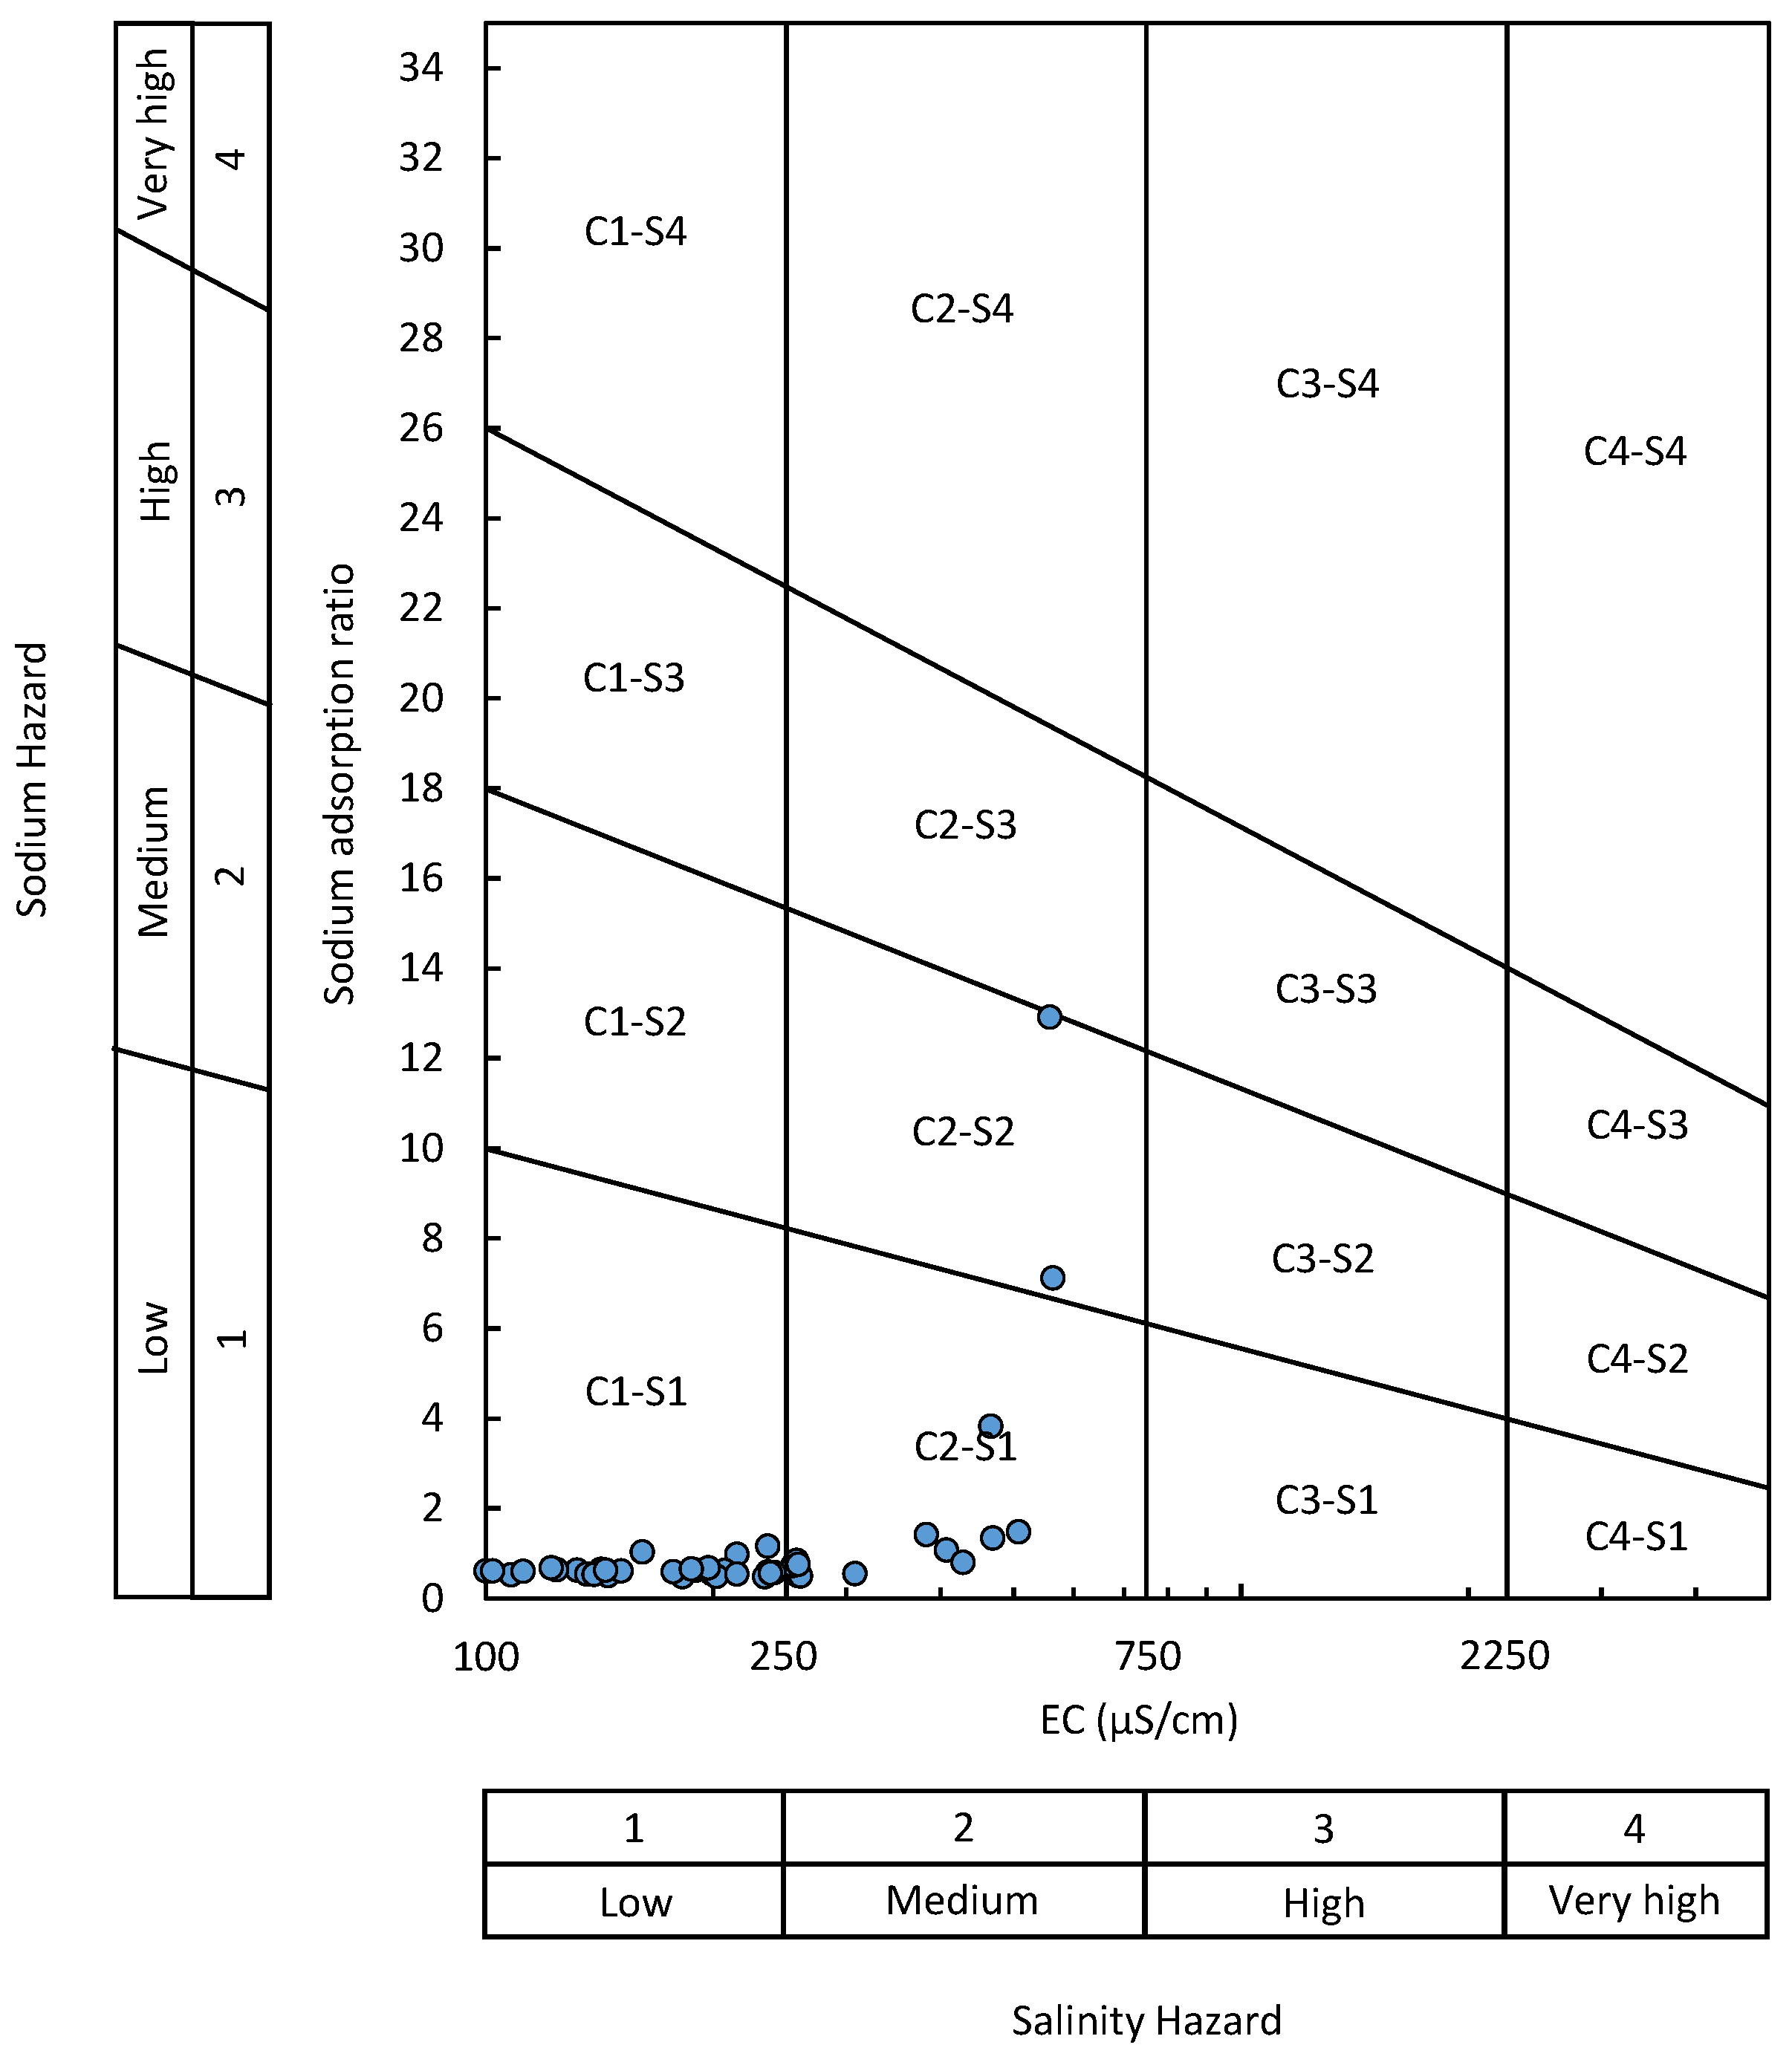
3.1. Water Chemistry
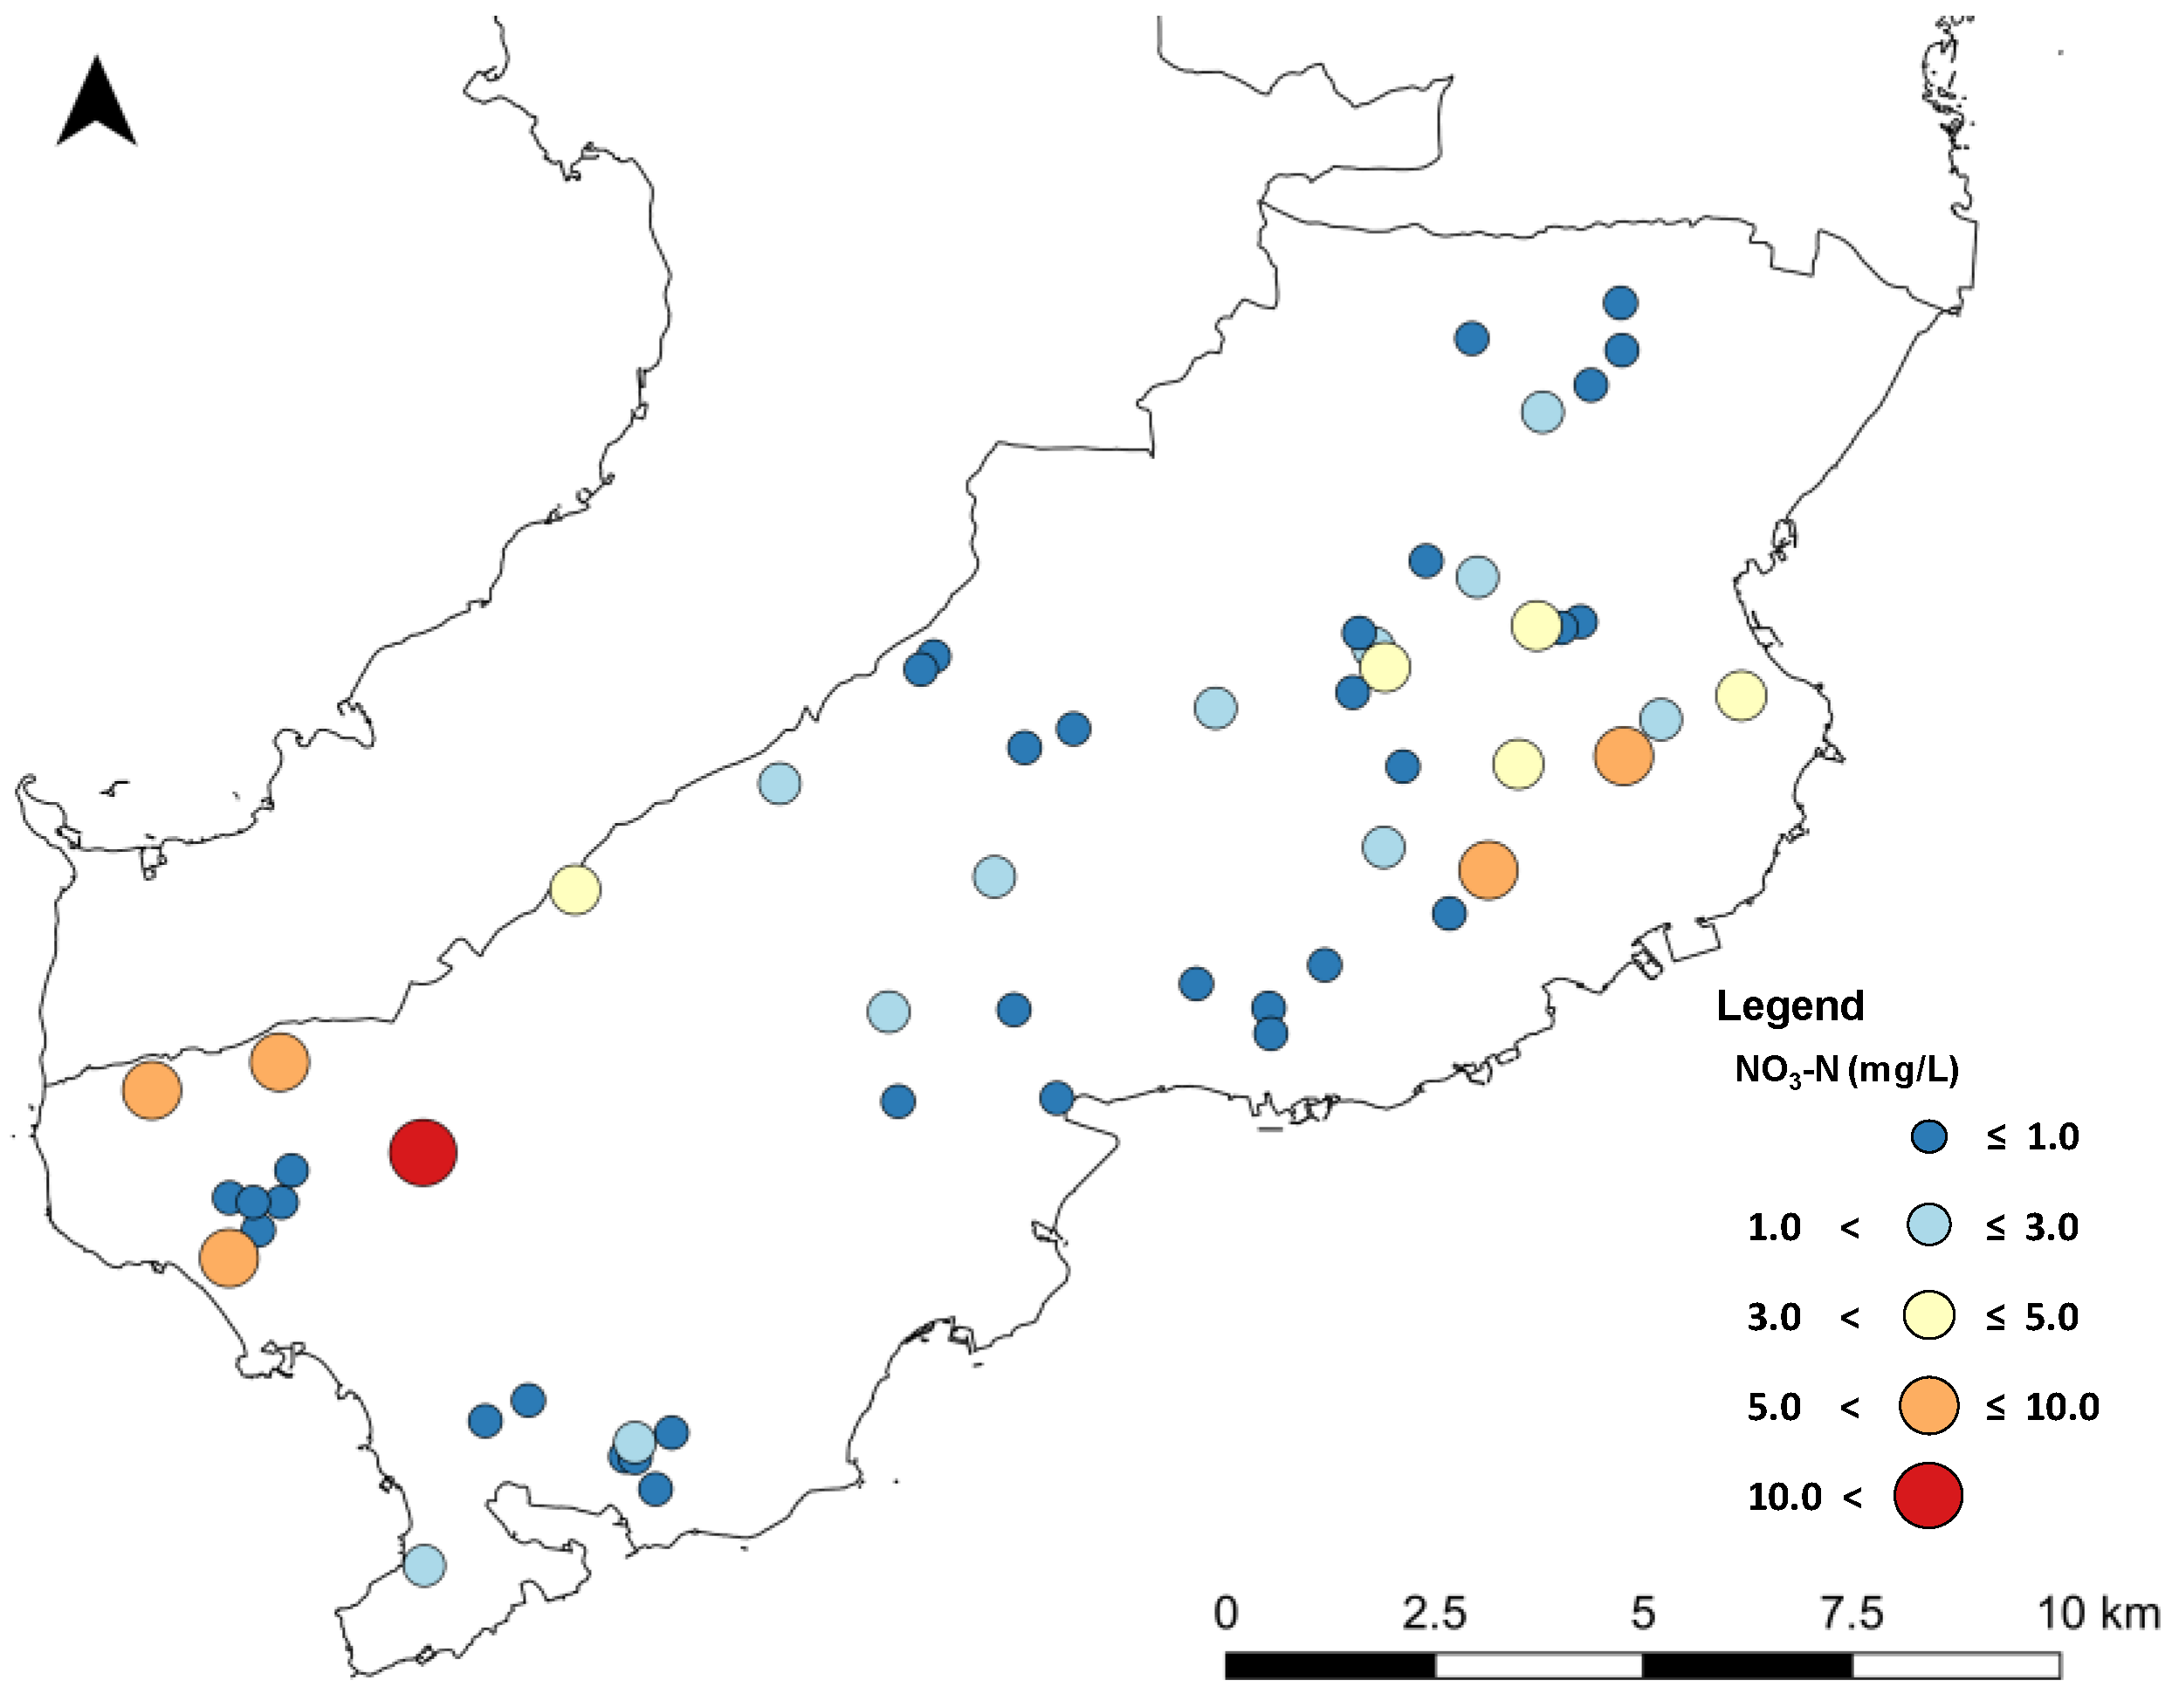
3.2. Nitrate Pollution
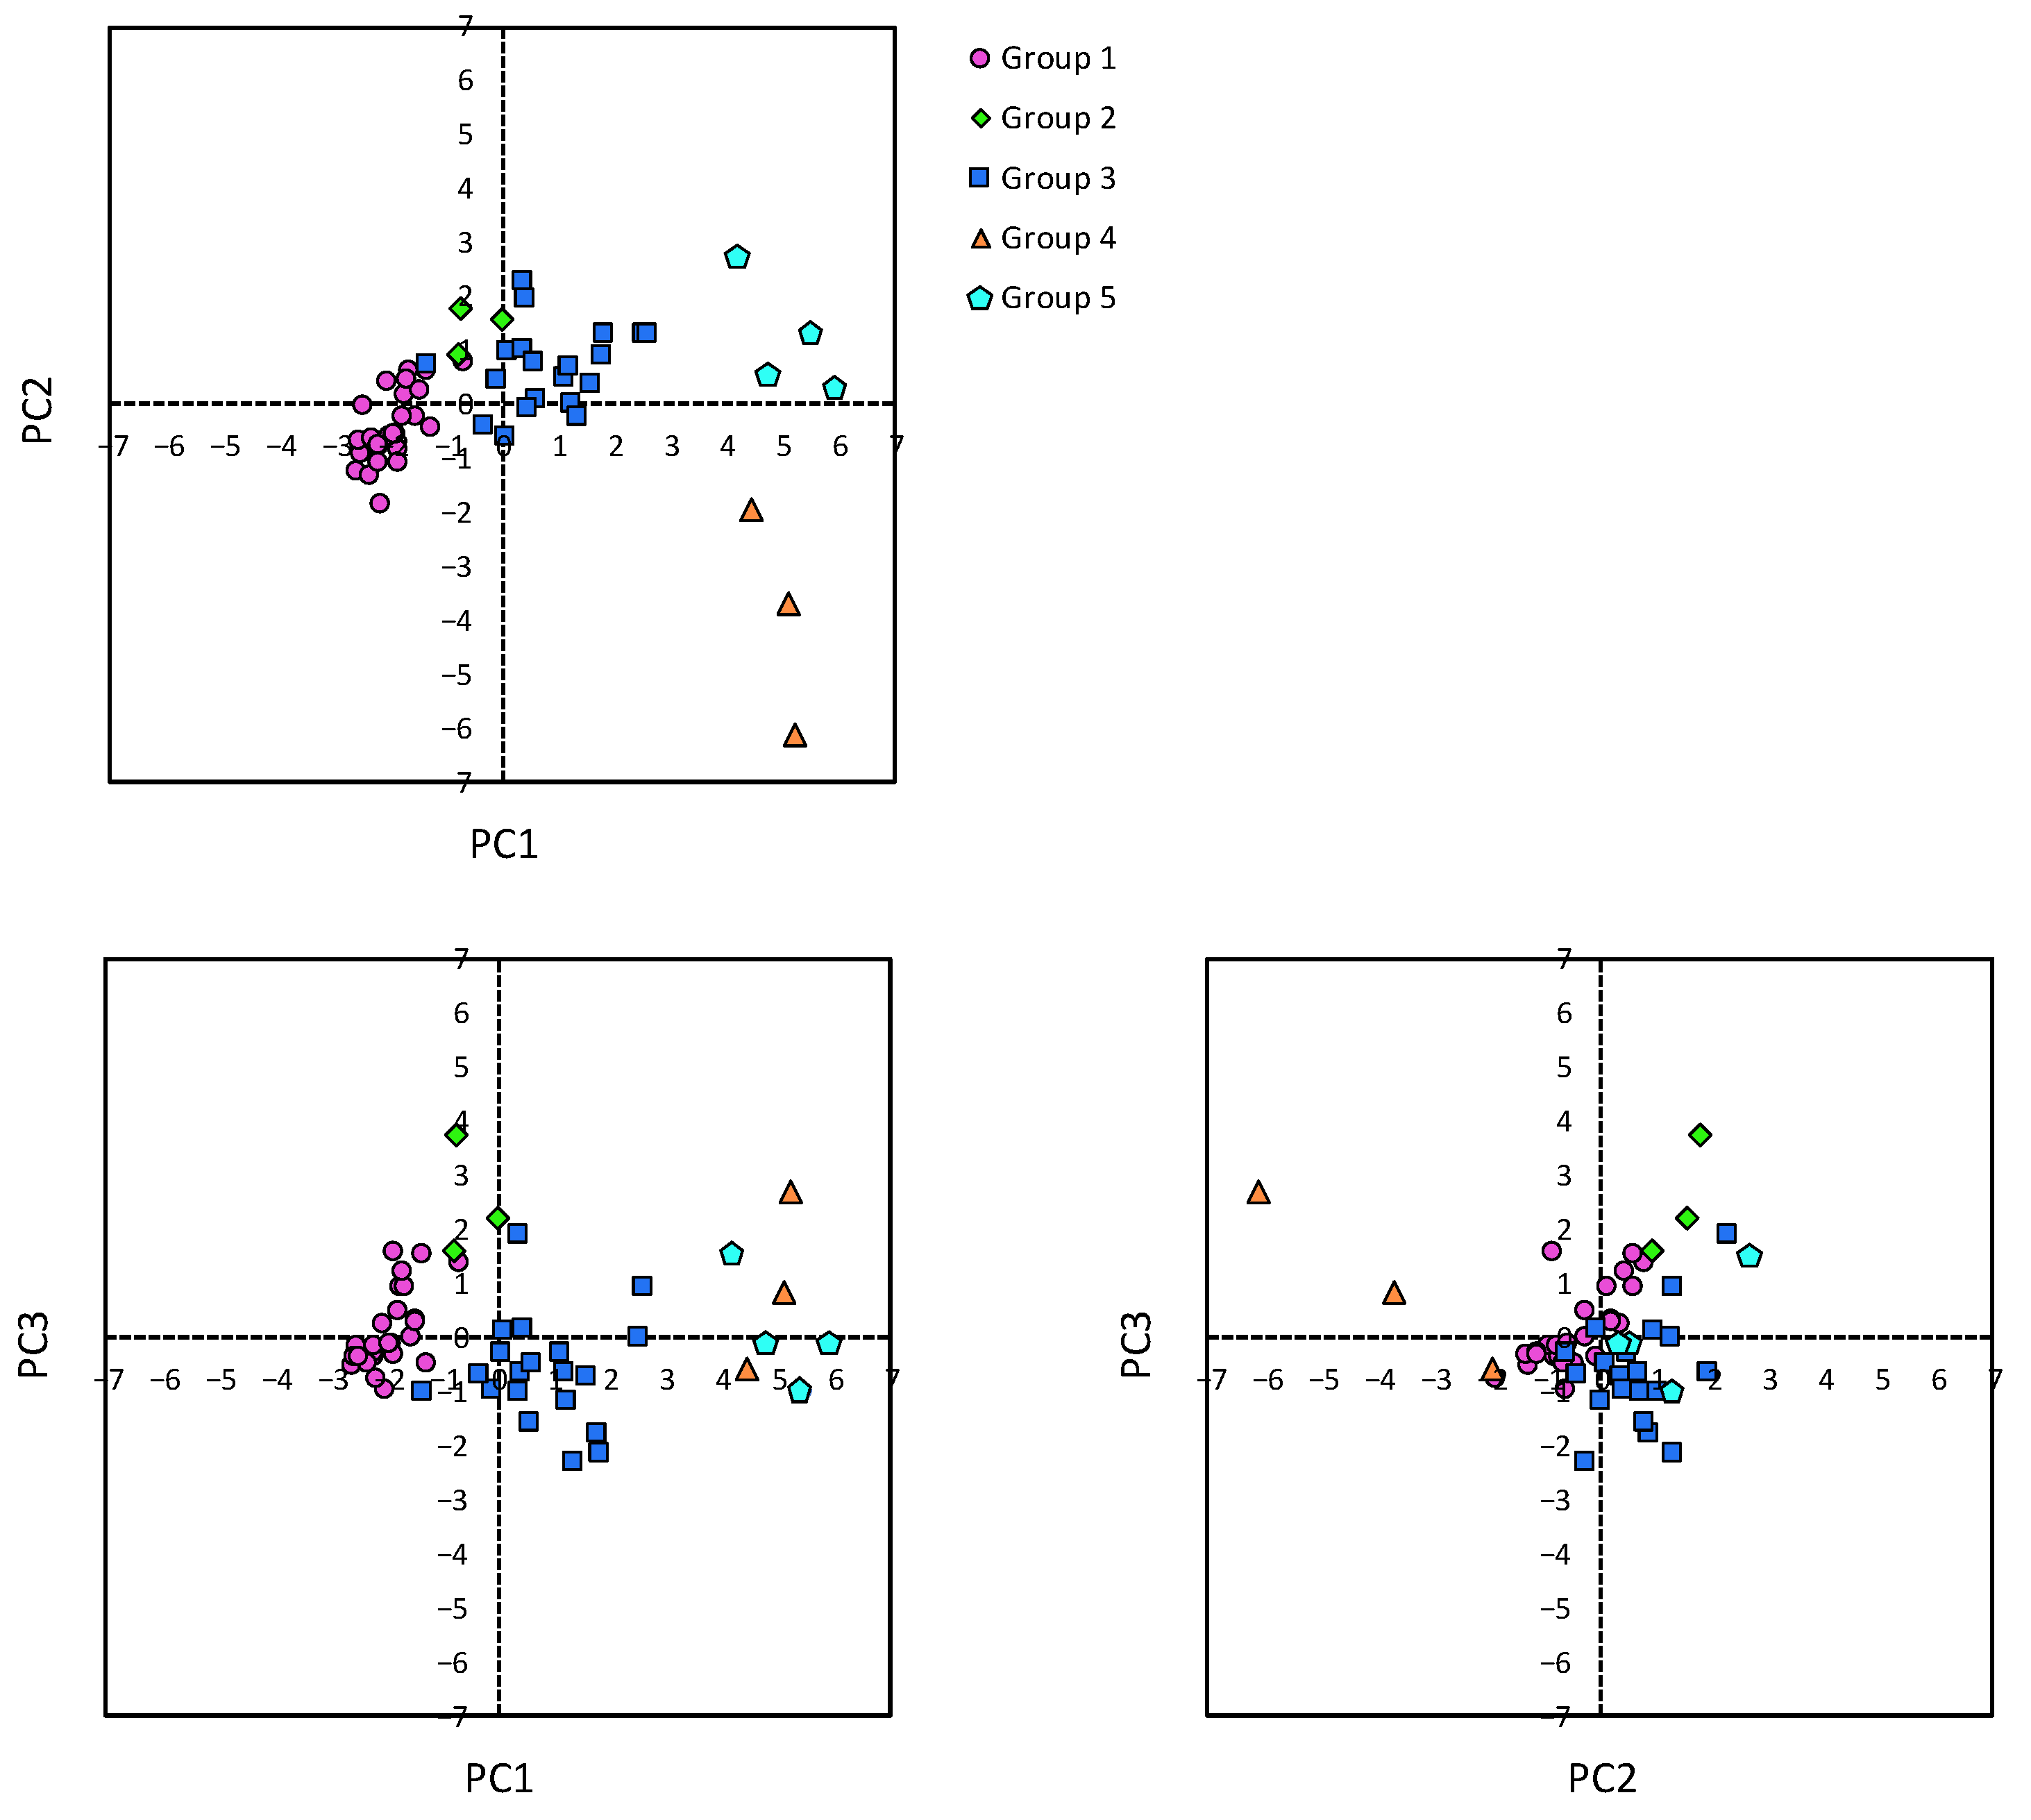
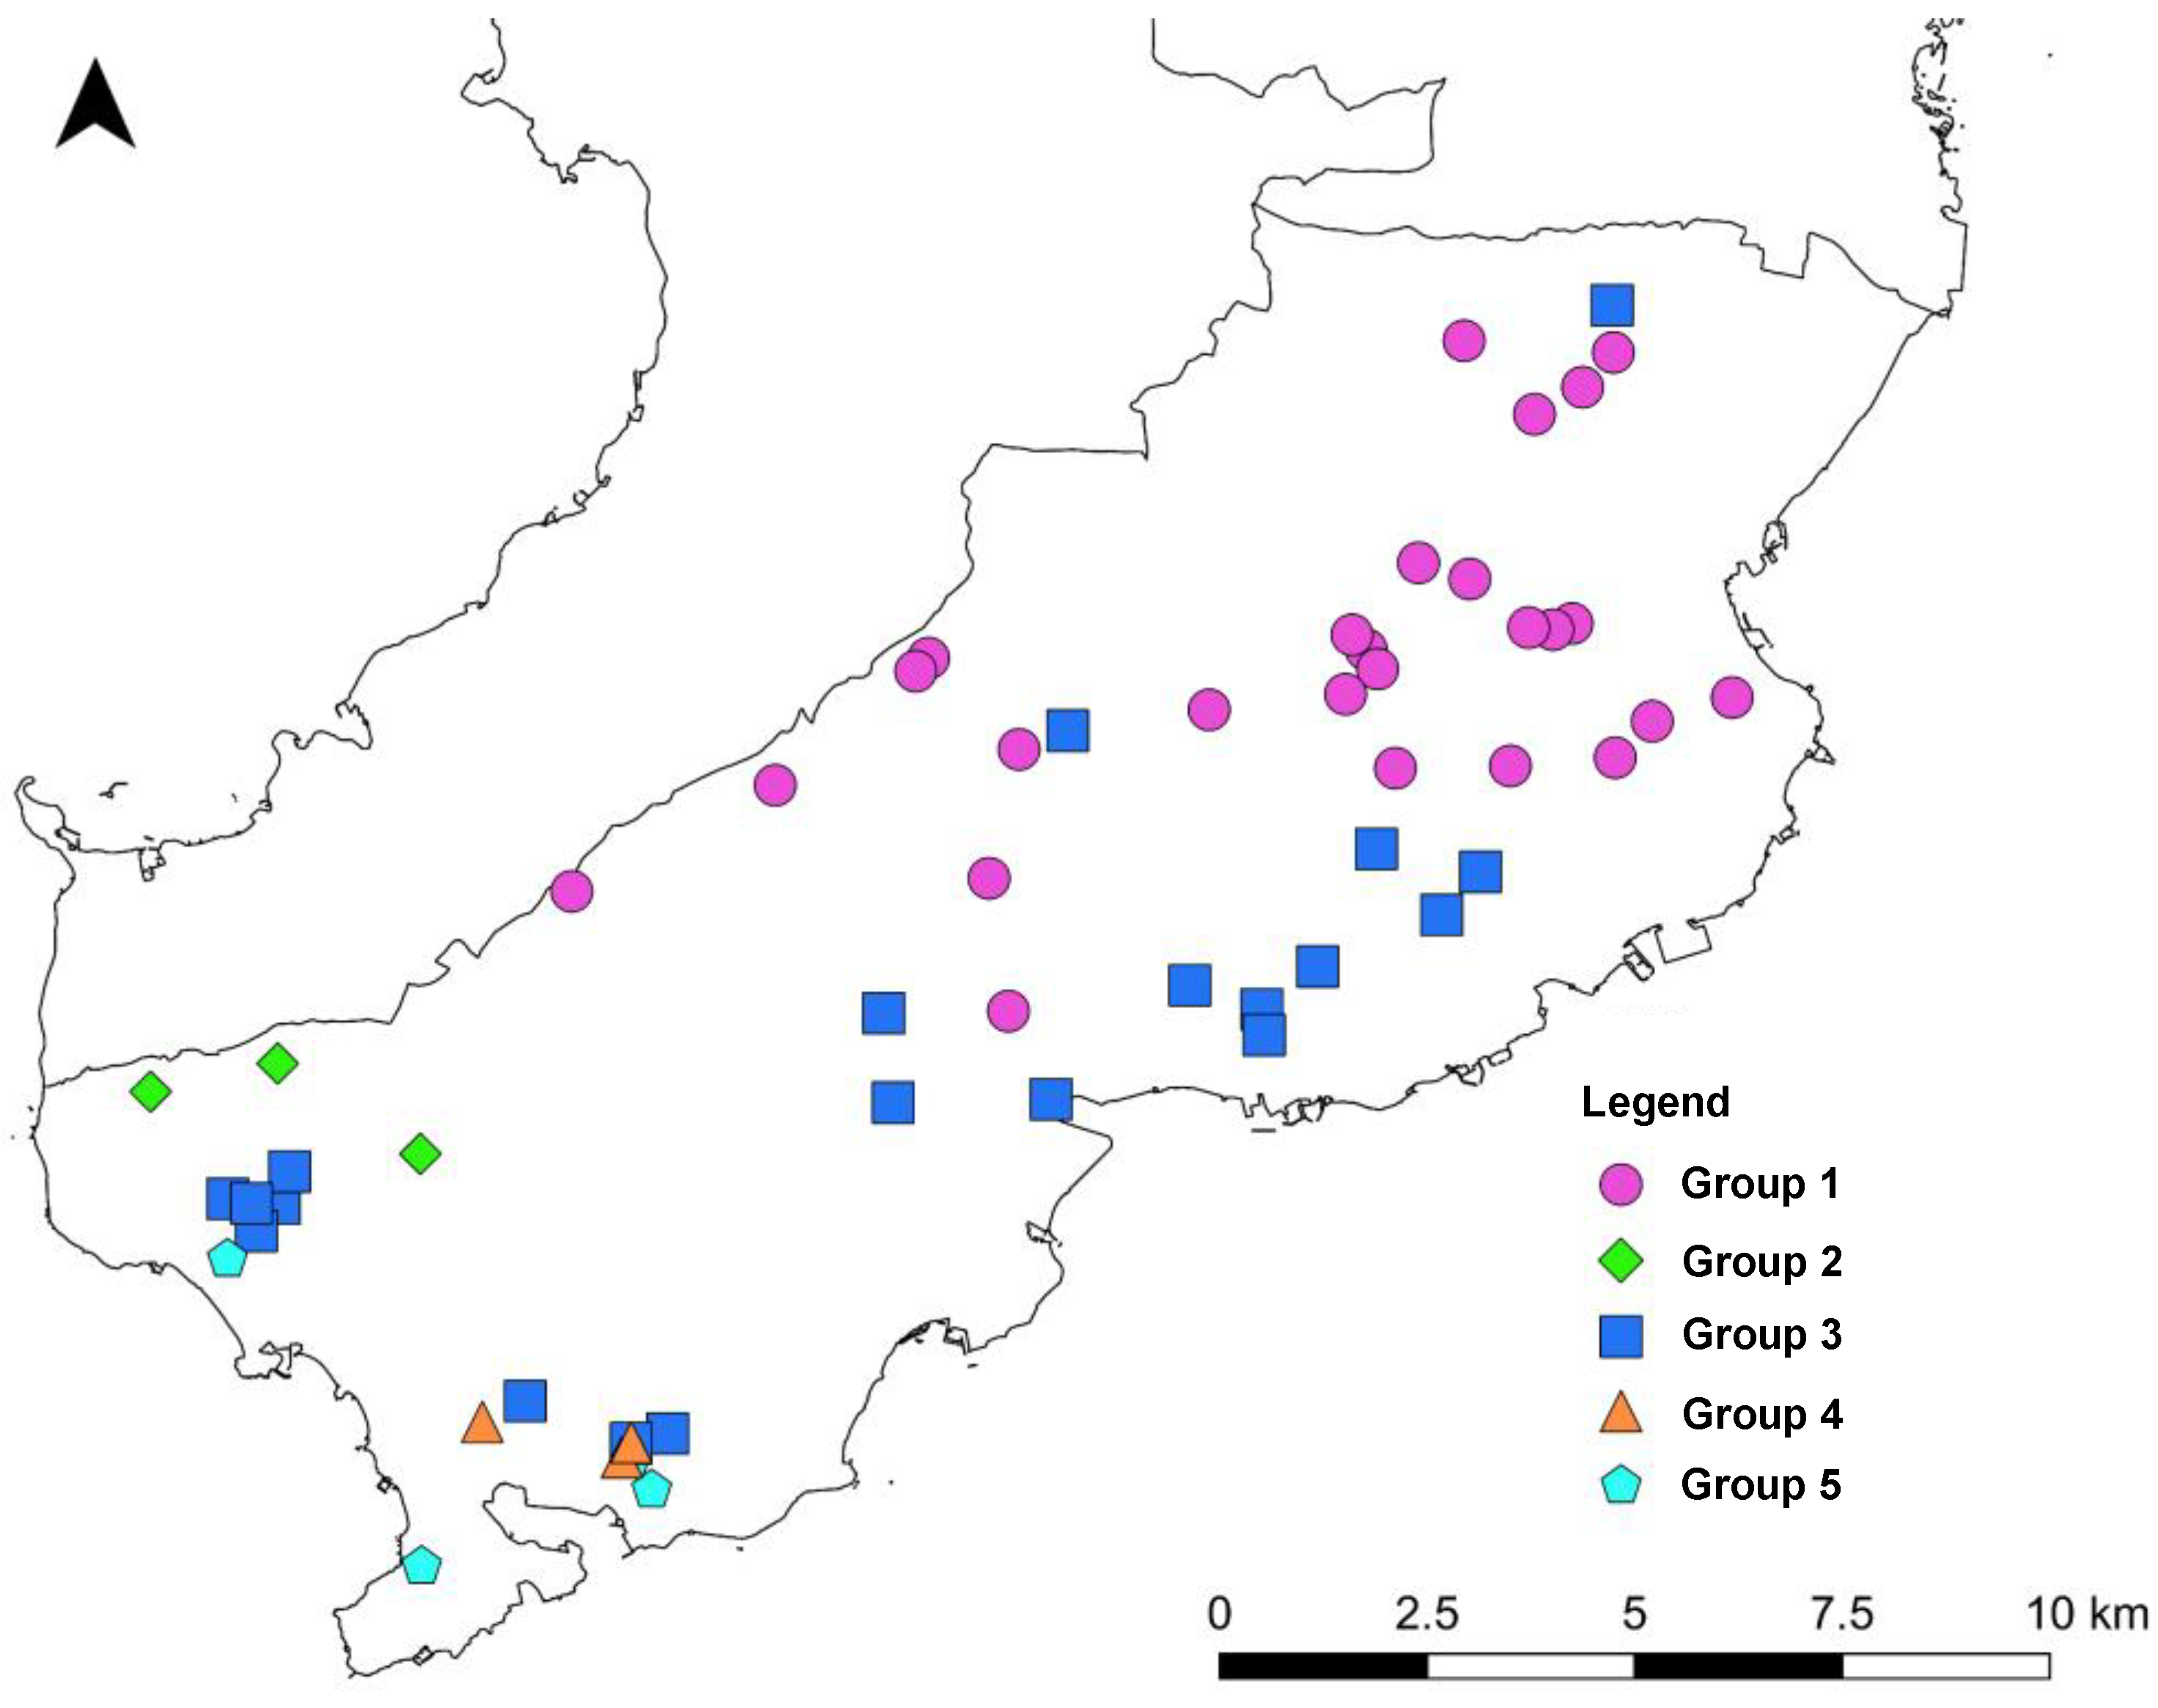
3.3. Multivariate Analysis
4. Conclusions
Author Contributions
Funding
Institutional Review Board Statement
Informed Consent Statement
Data Availability Statement
Acknowledgments
Conflicts of Interest
References
- Current Status of Groundwater Utilization. Available online: https://www.mlit.go.jp/mizukokudo/mizsei/mizukokudo_mizsei_tk1_000062.html (accessed on 12 October 2022).
- Groundwater Quality Measurement Results for FY2022. Available online: https://www.env.go.jp/water/report/r03-03/post_3.html (accessed on 12 October 2022).
- Kuroda, K.; Fukushi, T. Groundwater Contamination in Urban Areas. In Groundwater Management in Asian Cities; Takizawa, S., Ed.; Springer: Tokyo, Japan, 2008; pp. 125–149. [Google Scholar]
- Fuoco, I.; Marini, L.; De Rosa, R.; Figoli, A.; Gabriele, B.; Apollaro, C. Use of reaction path modelling to investigate the evolution of water chemistry in shallow to deep crystalline aquifers with a special focus on fluoride. Sci. Total Environ. 2022, 830, 154566. [Google Scholar] [CrossRef] [PubMed]
- Fuoco, I.; De Rosa, R.; Barca, D.; Figoli, A.; Gabriele, B.; Apollaro, C. Arsenic polluted waters: Application of geochemical modelling as a tool to understand the release and fate of the pollutant in crystalline aquifers. J. Environ. Manag. 2022, 301, 113796. [Google Scholar] [CrossRef] [PubMed]
- Shimabara Area Peninsula Development Plan. Available online: https://www.mlit.go.jp/common/001124224.pdf (accessed on 15 October 2022).
- The Second Term of Shimabara Peninsula Nitrate Load Reduction Project, Revised Edition in FY2020. Available online: https://www.pref.nagasaki.jp/shared/uploads/2021/04/1617338157.pdf (accessed on 12 October 2022).
- Nakagawa, K.; Amano, H.; Asakura, H.; Berndtsson, R. Spatial trends of nitrate pollution and groundwater chemistry in Shimabara, Nagasaki, Japan. Environ. Earth. Sci. 2016, 75, 234. [Google Scholar] [CrossRef] [Green Version]
- Amano, H.; Nakagawa, K.; Berndtsson, R. Groundwater geochemistry and nitrate-contaminated agricultural site. Environ. Earth. Sci. 2016, 75, 1145. [Google Scholar] [CrossRef] [Green Version]
- Nakagawa, K.; Amano, H.; Persson, M.; Berndtsson, R. Spatiotemporal variation of nitrate concentrations in soi and groundwater of an intensely polluted agricultural area. Sci. Rep. 2021, 11, 2598. [Google Scholar] [CrossRef] [PubMed]
- Nakagawa, K.; Amano, H.; Berndtsson, R. Spatiotemporal characteristics of groundwater chemistry in Unzen, Nagasaki, Japan. Water 2021, 13, 426. [Google Scholar] [CrossRef]
- Minami-Shimabara City Waterworks Business Management Strategy Development Outsourcing. Available online: https://www.city.minamishimabara.lg.jp/common/UploadFileOutput.ashx?c_id=3&id=6250&sub_id=6&flid=32496 (accessed on 15 October 2022).
- Vegetation Survey 1/25,000. Available online: http://gis.biodic.go.jp/webgis/sc-025.html?kind=vg67 (accessed on 17 October 2022).
- Agriculture, Forestry, and Fisheries in Graphs and Statistics. Available online: http://www.machimura.maff.go.jp/machi/contents/42/214/details.html (accessed on 15 October 2022).
- Seamless Digital Geological Map of Japan V2 1: 200,000. Available online: https://gbank.gsj.jp/seamless/ (accessed on 19 October 2022).
- Sugimoto, T. Geology and petrology at Shimabara Peninsula, Kyushu, Japan -From recent results-. J. Geotherm. Res. Soc. Jpn. 2006, 28, 347–360. [Google Scholar]
- Murakami, T. 1:50,000 Hydrogeological Maps of Japan Shimabara Peninsula, No.25; Geological Survey of Japan: Kawasaki, Japan, 1975; Available online: https://www.gsj.jp/Map/EN/environment.html (accessed on 31 October 2022). (In Japanese)
- Past Weather Data. Available online: https://www.data.jma.go.jp/obd/stats/etrn/index.php?prec_no=84&block_no=0922&year=&month=&day=&view= (accessed on 17 October 2022).
- Rahman, A.; Mondal, N.C.; Tiwari, K.K. Anthropogenic nitrate in groundwater and its health risks in the view of background concentration in a semi arid area of Rajasthan, India. Sci. Rep. 2021, 11, 9279. [Google Scholar] [CrossRef] [PubMed]
- Chotpantarat, S.; Parkchai, T.; Wisitthammasri, W. Multivariate statistical analysis of hydrochemical data and stable isotopes of groundwater contaminated with nitrate at Huay Sai royal development study center and adjacent areas in Phetchaburi province, Thailand. Water 2020, 12, 1127. [Google Scholar] [CrossRef] [Green Version]
- Zainol, N.F.M.; Zainuddin, A.H.; Looi, L.J.; Aris, A.Z.; Isa, N.M.; Sefie, A.; Yusof, K.M.K.K. Spatial Analysis of Groundwater Hydrochemistry through Integrated Multivariate Analysis: A Case Study in the Urbanized Langat Basin, Malaysia. Int. J. Environ. Public Health 2021, 18, 5733. [Google Scholar] [CrossRef] [PubMed]
- El-Kholy, R.A.; Zaghlool, E.; Isawi, H.; Soliman, E.A.; Khalil, M.M.H.; El-Aassar, A.-H.M.; Said, M.M. Groundwater quality assessment using water quality index and multivariate statistical analysis case study: East Matrouh, Northwestern coast, Egypt. Environ. Sci. Poll. Res. 2022, 29, 65699–65722. [Google Scholar] [CrossRef] [PubMed]
- Kanellopoulos, C.; Argyraki, A. Multivariate statistical assessment of groundwater in cases with ultramafic rocks and anthropogenic activities influence. Appl. Geochem. 2022, 141, 105292. [Google Scholar] [CrossRef]
- Wali, S.U.; Alias, N.B.; Harun, S.B.; Umar, K.J.; Gada, M.A.; Dankani, I.M.; Kaoje, I.U.; Usman, A.A. Water quality indices and multivariate statistical analysis of urban groundwater in semi-arid Sokoto Basin, Northwestern Nigeria. Groundw. Sustain. Dev. 2022, 18, 100779. [Google Scholar] [CrossRef]
- Oxidant/Reduction (Redox). Available online: https://www.usgs.gov/mission-areas/water-resources/science/oxidationreduction-redox (accessed on 28 October 2022).
- Gillham, R.W.; Cherry, J.A. Field Evidence of Denitrification in Shallow Groundwater Flow System. Water Qual. Res. J. 1978, 13, 53–72. [Google Scholar] [CrossRef]
- Evangelou, V.P. Environmental Soil and Water Chemistry: Principles and Applications; John Wiley and Sons: New York, NY, USA, 1998; pp. 80–82. [Google Scholar]
- Apollaro, C.; Tripodi, V.; Vespasiano, G.; De Rosa, R.; Dotsika, E.; Fuoco, I.; Critelli, S.; Muto, F. Chemical, isotopic and geotectonic relations of the warm and cold waters of the Galatro and Antonimina thermal areas, southern Calabria, Italy. Mar. Pet. Geol. 2019, 109, 469–483. [Google Scholar] [CrossRef]
- Gibbs, R.J. Mechanisms Controlling World Water Chemistry. Science 1970, 170, 1088–1090. [Google Scholar] [CrossRef] [PubMed]
- Elango, L.; Kannan, R. Rock–water interaction and its control on chemical composition of groundwater. Dev. Environ. Sci. 2007, 5, 229–243. [Google Scholar]
- Mohamed, A.; Asmoay, A.; Alshehri, F.; Abdelrady, A.; Othman, A. Hydro-Geochemical Applications and Multivariate Analysis to Assess the Water–Rock Interaction in Arid Environments. Water 2022, 12, 6340. [Google Scholar] [CrossRef]
- Giménez-Forcada, E. Dynamic of Sea Water Interface using Hydrochemical Facies Evolution Diagram. Groundwater 2010, 48, 212–216. [Google Scholar] [CrossRef] [PubMed]
- Giménez-Forcada, E.; Sánchez San Román, F.J. An Excel Macro to Plot the HFE-Diagram to Identify Sea Water Intrusion Phases. Groundwater 2015, 53, 819–824. [Google Scholar] [CrossRef] [PubMed]
- U.S. Salinity Laboratory Staff. Diagnosis and Improvement of Saline and Alkali Soils; Agricultural Handbook No.60.; U.S. Government Printing Office: Washington, DC, USA, 1954; 160p. [Google Scholar]
- Ayers, R.S.; Westcot, D.W. Water Quality for Agriculture; Food and Agriculture Organization of the United Nations: Rome, Italy, 1985; pp. 6–11. [Google Scholar]
- World Health Organization. Guidelines for Drinking-Water Quality; Fourth Edition Incorporating the First and Second Addenda; World Health Organization: Geneva, Switzerland, 2022; pp. 438–444. [Google Scholar]
- Dubrovsky, N.M.; Burow, K.R.; Clark, G.M.; Gronberg, J.M.; Hamilton, P.A.; Hitt, K.J.; Mueller, D.K.; Munn, M.D.; Nolan, B.T.; Puckett, L.J.; et al. The Quality of Our Nation’s Waters—Nutrients in the Nation’s Streams and Groundwater, 1992–2004; U.S. Geological Survey Circular 1350.; U.S. Geological Survey: Reston, VA, USA, 2010; 174p. [Google Scholar]
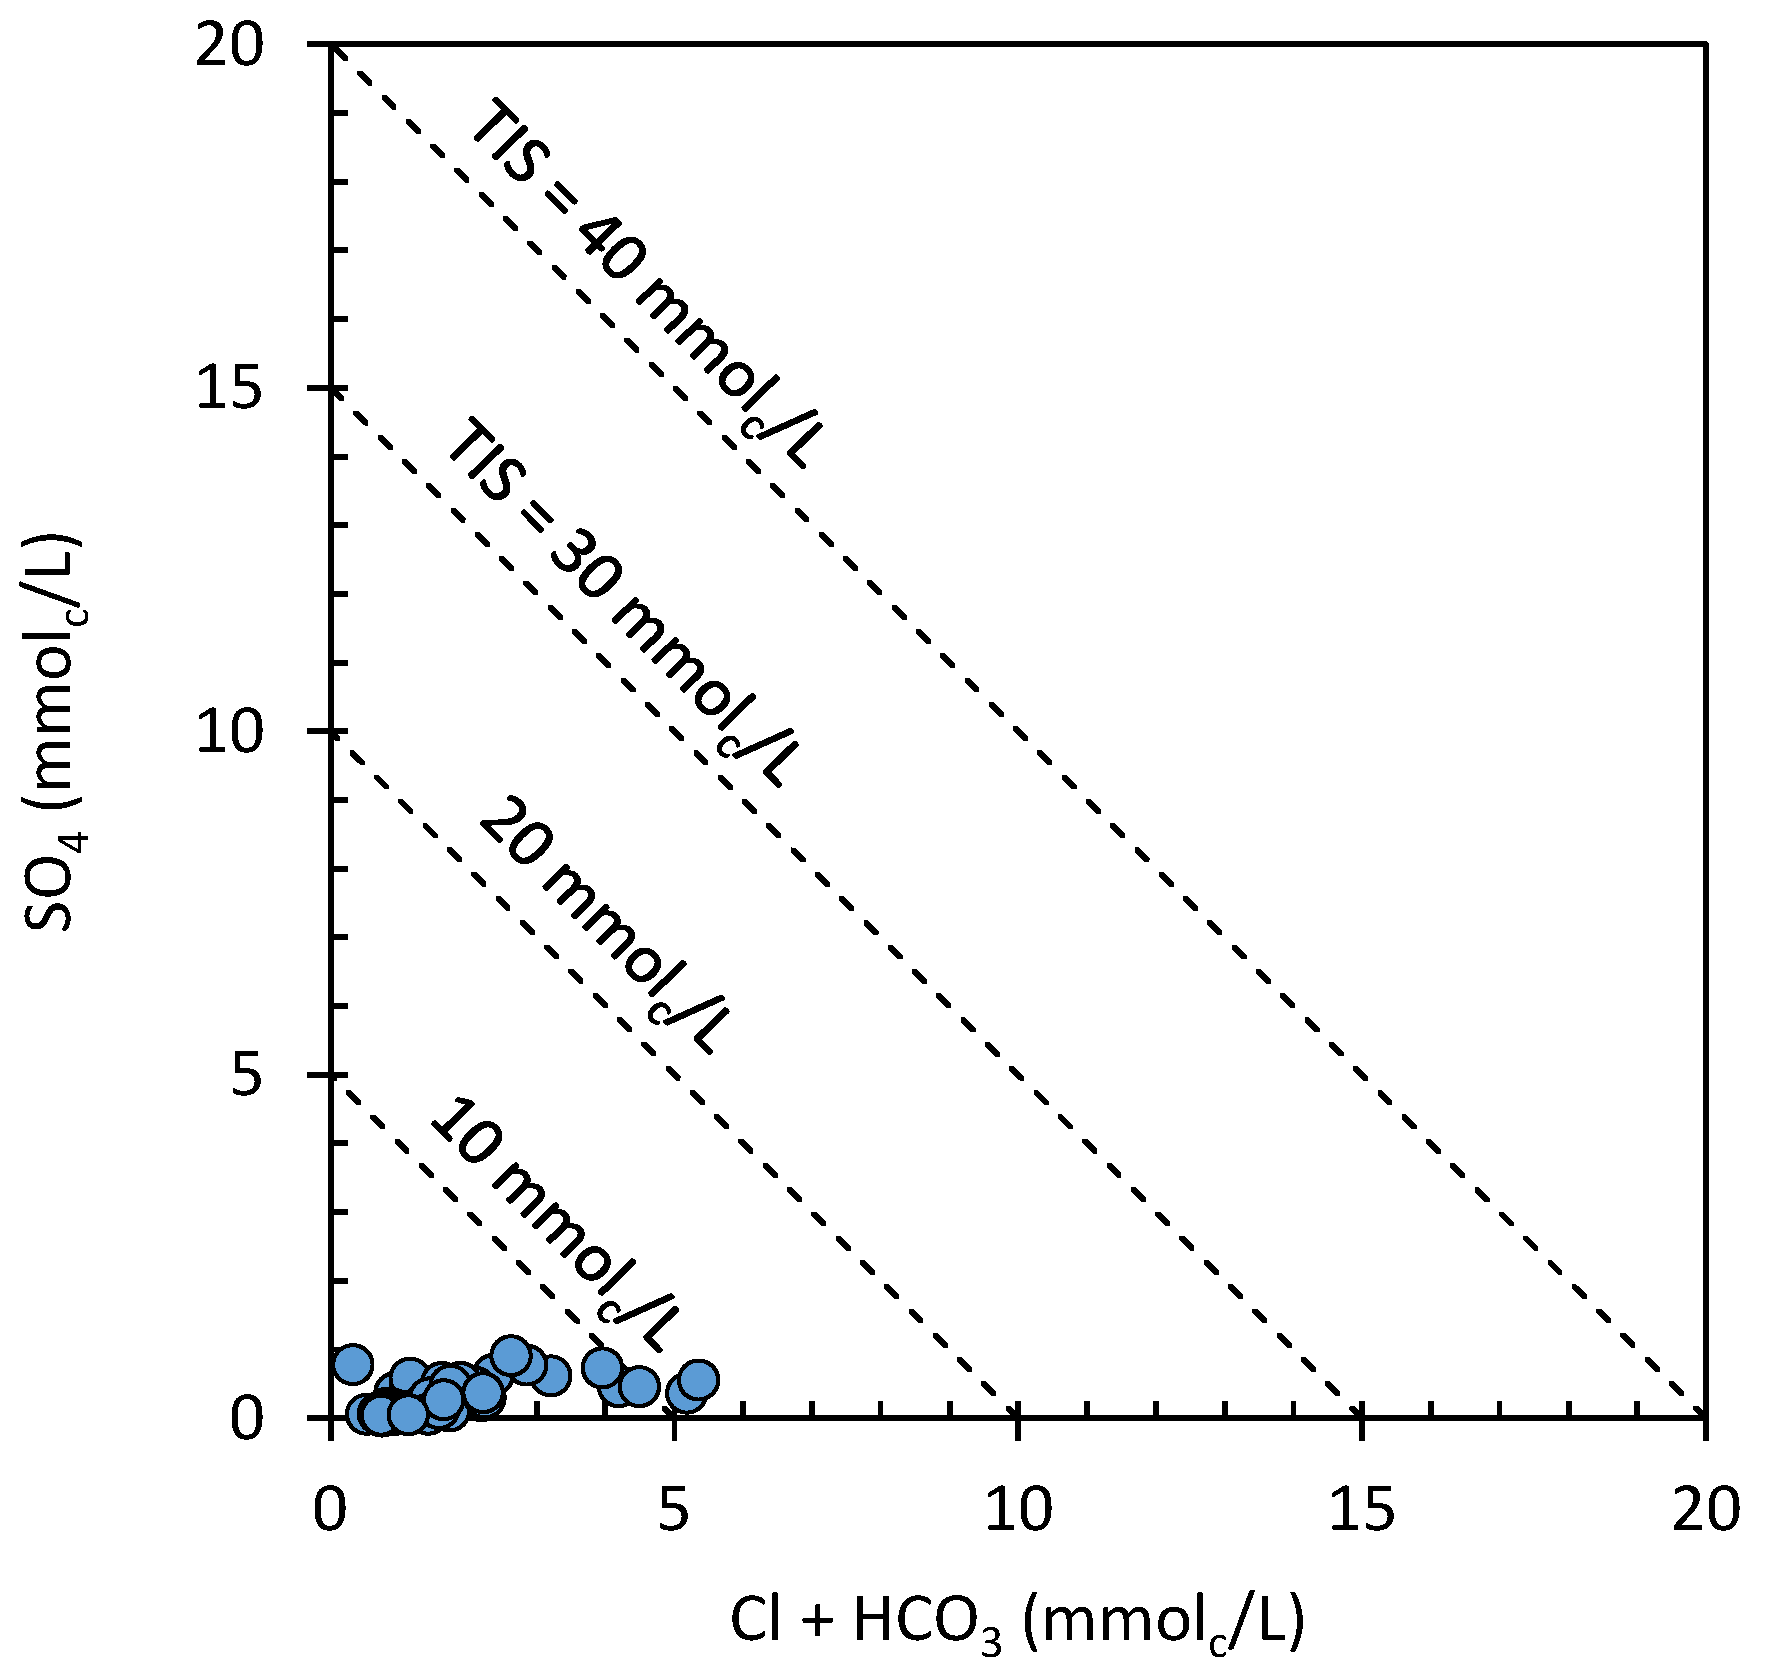
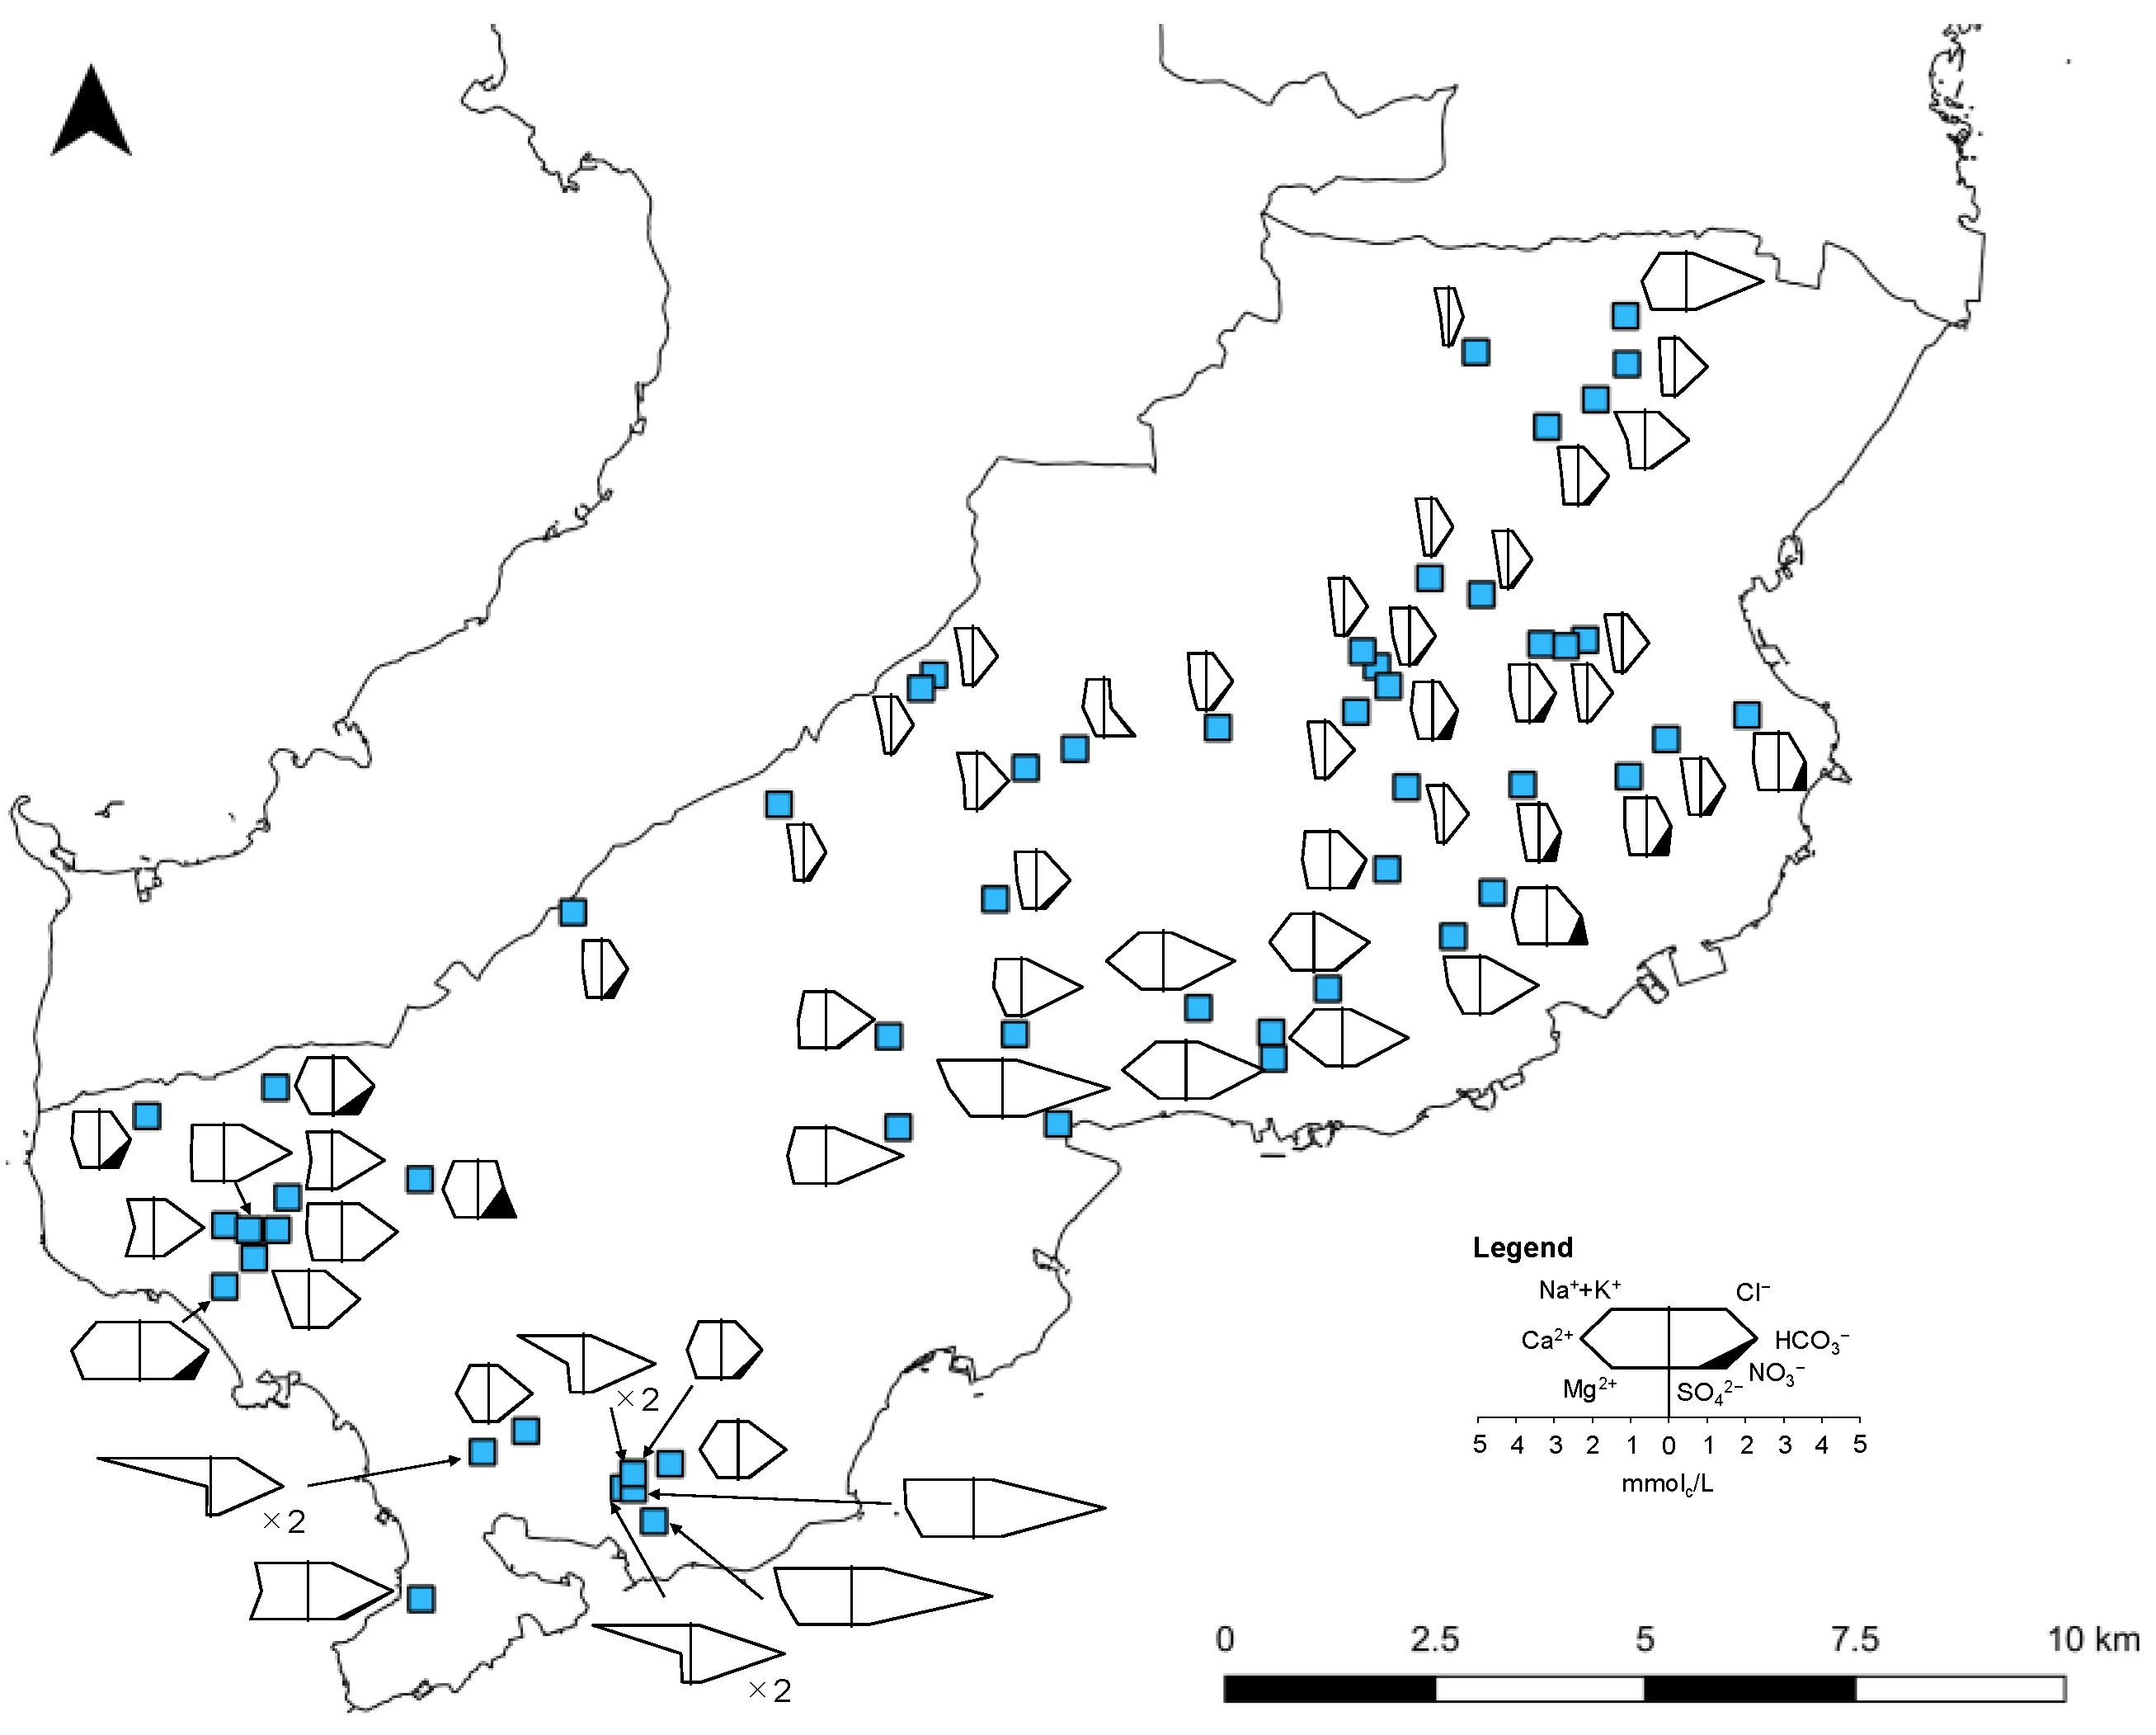
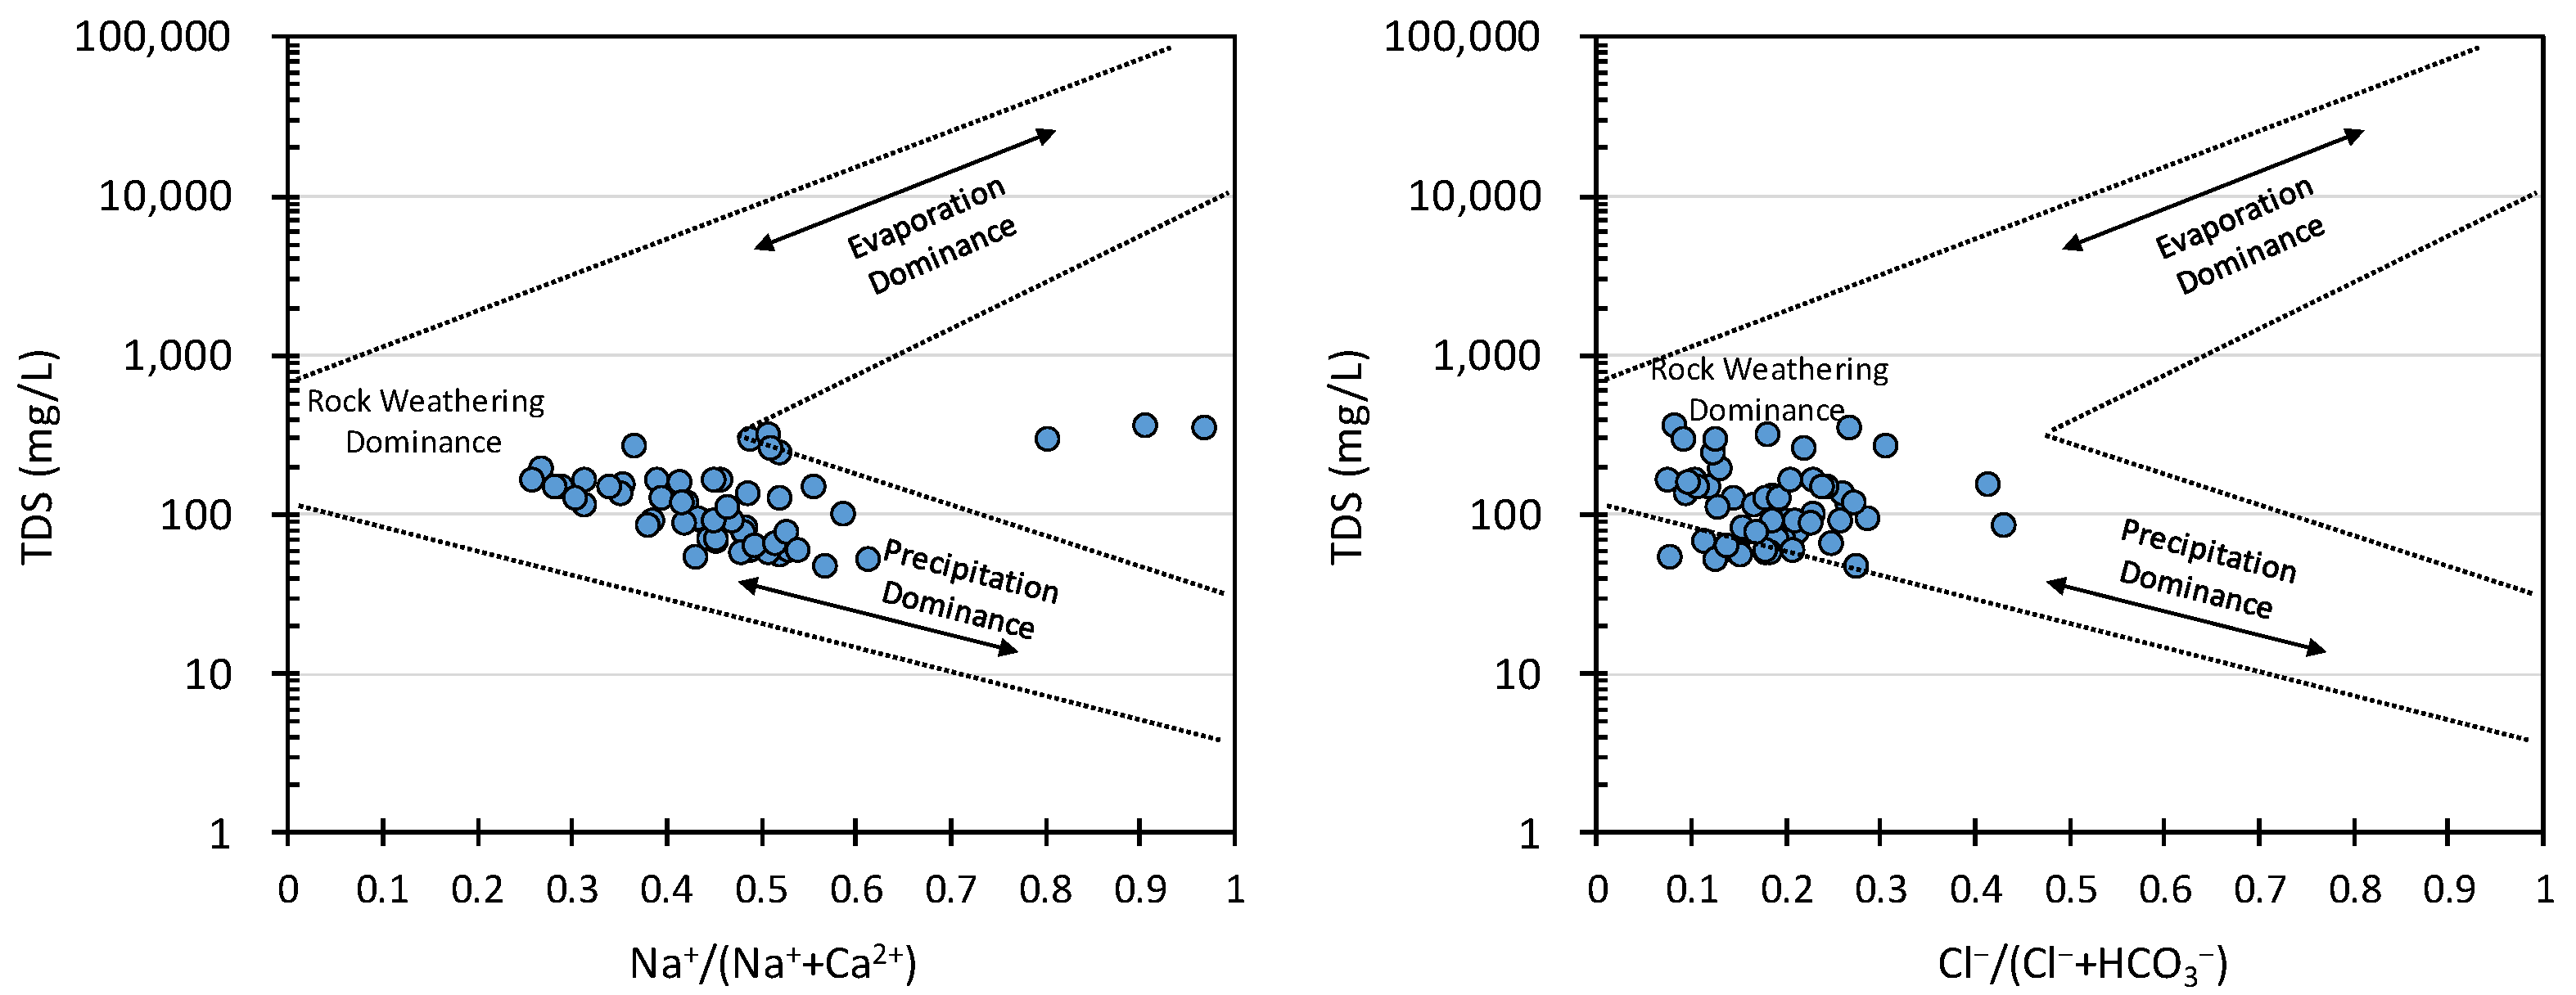
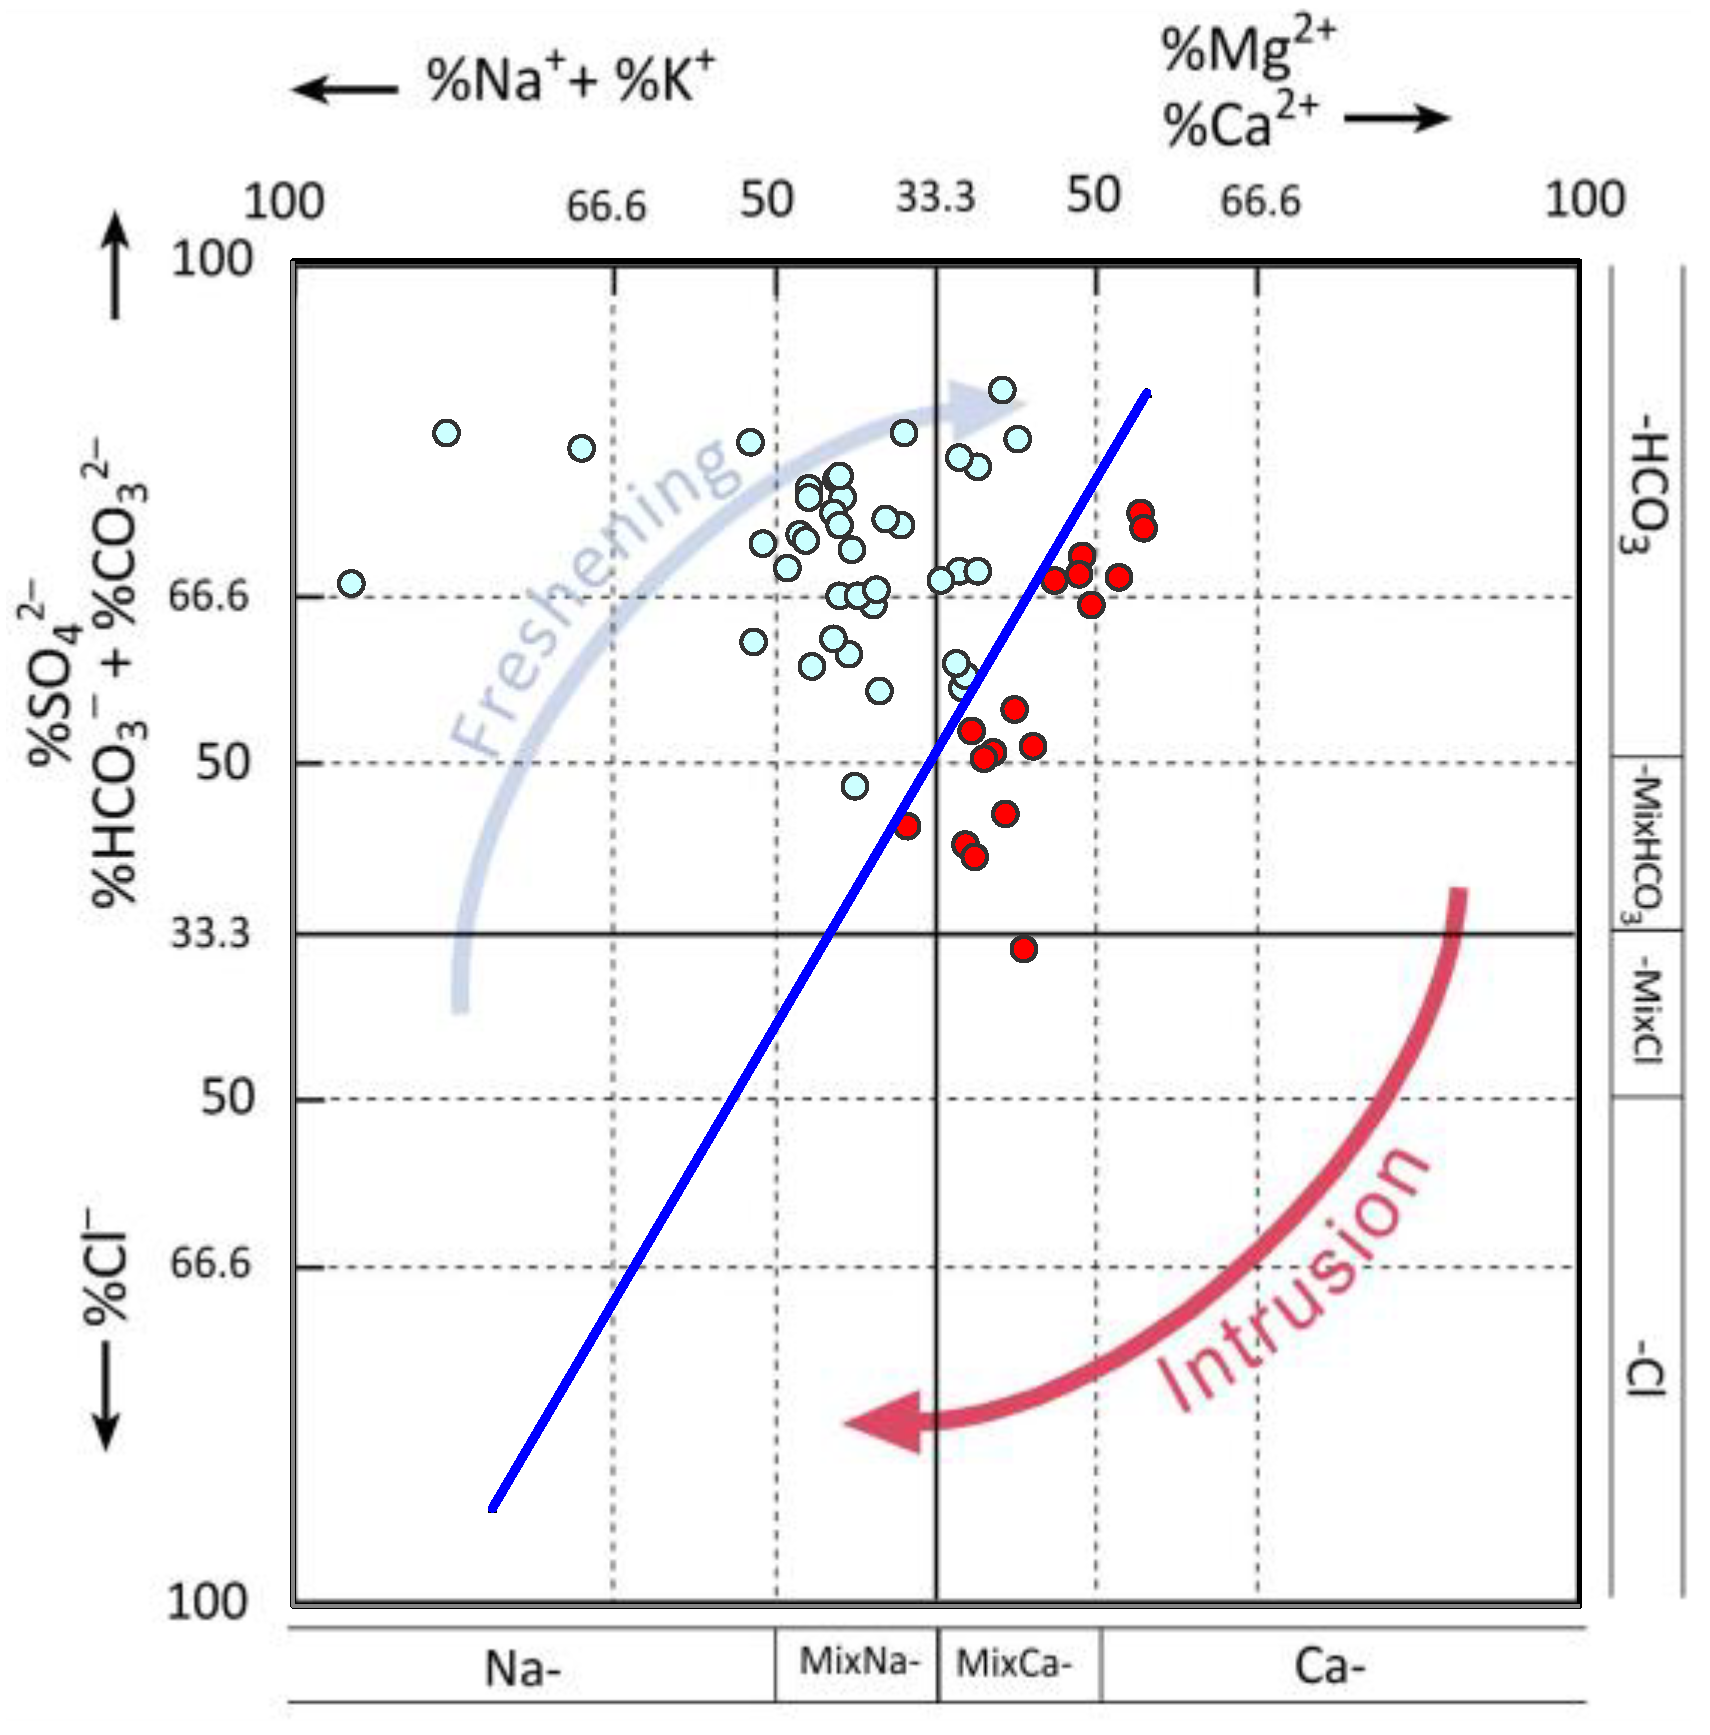

| Cl− | NO3− | SO42− | HCO3− | Na+ | K+ | Mg2+ | Ca2+ | pH | EC | ORP | DO | |
|---|---|---|---|---|---|---|---|---|---|---|---|---|
| mg/L | mg/L | mg/L | mg/L | mg/L | mg/L | mg/L | mg/L | µS/cm | mV | mg/L | ||
| Min | 3.3 | 0.1 | 1.4 | 11.4 | 6.3 | 3.1 | 1.6 | 3.9 | 6.3 | 74 | −21 | 1.7 |
| Max | 49.2 | 55.7 | 43.5 | 299.7 | 134.3 | 7.5 | 18.2 | 37.0 | 8.7 | 563 | 738 | 10.2 |
| Mean | 10.0 | 7.9 | 12.7 | 81.5 | 17.9 | 4.9 | 6.3 | 14.6 | 7.4 | 210 | 235 | 6.8 |
| S.D. 1 | 7.7 | 11.2 | 11.2 | 60.3 | 23.8 | 1.0 | 4.0 | 8.7 | 0.5 | 126 | 106 | 2.5 |
| Unit | Degree of Restriction on Use | |||
|---|---|---|---|---|
| None | Slight to Moderate | Severe | ||
| EC | dS/m | <0.7 | 0.7–3.0 | >3.0 |
| TDS | mg/L | <450 | 450–2000 | >2000 |
| Na (surface irrigation) | SAR | <3 | 3–9 | >9 |
| Na (sprinkler irrigation) | meq/L | <3 | >3 | |
| Cl (surface irrigation) | meq/L | <4 | 4–10 | >10 |
| Cl (sprinkler irrigation) | meq/L | <3 | >3 | |
| NO3-N | mg/L | <5 | 5–30 | >30 |
| HCO3 | meq/L | <1.5 | 1.5–8.5 | >8.5 |
| pH | Normal range 6.5–8.4 | |||
| Cl− | NO3− | SO42− | HCO3− | Na+ | K+ | Mg2+ | Ca2+ | |
|---|---|---|---|---|---|---|---|---|
| Cl− | 1.00 | 0.15 | 0.50 | 0.65 | 0.74 | −0.10 | 0.52 | 0.39 |
| NO3− | - | 1.00 | −0.05 | −0.26 | −0.13 | 0.24 | 0.14 | 0.10 |
| SO42− | - | - | 1.00 | 0.57 | 0.38 | 0.12 | 0.71 | 0.72 |
| HCO3− | - | - | - | 1.00 | 0.84 | 0.07 | 0.56 | 0.52 |
| Na+ | - | - | - | - | 1.00 | −0.10 | 0.19 | 0.10 |
| K+ | - | - | - | - | - | 1.00 | 0.20 | 0.32 |
| Mg2+ | - | - | - | - | - | - | 1.00 | 0.83 |
| Ca2+ | - | - | - | - | - | - | - | 1.00 |
| PC 1 | PC 2 | PC 3 | |
|---|---|---|---|
| Cl− | 0.770 | −0.213 | 0.337 |
| NO3− | −0.083 | 0.421 | 0.775 |
| SO42− | 0.793 | 0.278 | −0.093 |
| HCO3− | 0.903 | −0.267 | 0.006 |
| Na+ | 0.708 | −0.599 | 0.235 |
| K+ | 0.104 | 0.543 | 0.286 |
| Mg2+ | 0.716 | 0.548 | −0.002 |
| Ca2+ | 0.773 | 0.508 | −0.029 |
| pH | 0.430 | −0.560 | 0.227 |
| EC | 0.969 | −0.082 | 0.182 |
| ORP | −0.518 | −0.113 | 0.435 |
| DO | −0.755 | −0.084 | 0.447 |
| Eigenvalue | 5.64 | 1.92 | 1.33 |
| Explained variance % | 46.9 | 16.0 | 11.1 |
| Cumulative % of variance | 46.9 | 62.9 | 74.0 |
| Samples | Cl− | NO3− | SO42− | HCO3− | Na+ | K+ | Mg2+ | Ca2+ | NO3-N | pH | EC | ORP | DO | ||
|---|---|---|---|---|---|---|---|---|---|---|---|---|---|---|---|
| mg/L | mg/L | mg/L | mg/L | mg/L | mg/L | mg/L | mg/L | mg/L | µS/cm | mV | mg/L | ||||
| Group 1 | 26 | Min | 3.3 | 0.1 | 1.4 | 23.2 | 6.3 | 3.1 | 1.6 | 4.2 | 0.0 | 6.8 | 74 | 242 | 7.2 |
| Max | 12.1 | 26.1 | 17.9 | 97.5 | 15.6 | 6.1 | 6.4 | 14.7 | 5.9 | 7.9 | 190 | 738 | 10.1 | ||
| Mean | 5.9 | 7.4 | 4.3 | 44.4 | 8.7 | 4.7 | 3.5 | 8.2 | 1.7 | 7.3 | 116 | 287 | 8.8 | ||
| S.D. | 1.9 | 7.4 | 3.2 | 13.7 | 2.0 | 0.8 | 1.2 | 2.6 | 1.7 | 0.2 | 29 | 93 | 0.7 | ||
| Group 2 | 3 | Min | 10.9 | 28.6 | 2.2 | 41.3 | 11.6 | 5.1 | 5.7 | 14.2 | 6.5 | 7.0 | 187 | 201 | 7.3 |
| Max | 16.9 | 55.7 | 4.2 | 65.7 | 11.7 | 6.4 | 7.4 | 19.9 | 12.6 | 7.4 | 241 | 287 | 10.2 | ||
| Mean | 13.4 | 40.5 | 3.0 | 52.5 | 11.7 | 5.8 | 6.8 | 17.6 | 9.2 | 7.3 | 222 | 230 | 8.5 | ||
| S.D. | 3.1 | 13.8 | 1.0 | 12.3 | 0.1 | 0.7 | 1.0 | 3.0 | 3.1 | 0.2 | 30 | 49 | 1.5 | ||
| Group 3 | 20 | Min | 5.0 | 0.1 | 6.5 | 11.4 | 7.7 | 3.3 | 2.5 | 9.9 | 0.0 | 6.3 | 136 | −21 | 1.9 |
| Max | 16.1 | 28.9 | 37.3 | 171.8 | 34.7 | 7.5 | 11.0 | 33.3 | 6.5 | 8.0 | 383 | 302 | 9.0 | ||
| Mean | 9.6 | 3.8 | 19.3 | 90.4 | 14.1 | 5.3 | 7.6 | 19.3 | 0.9 | 7.3 | 234 | 204 | 5.1 | ||
| S.D. | 3.4 | 6.7 | 8.0 | 33.6 | 5.8 | 1.3 | 2.2 | 6.5 | 1.5 | 0.5 | 52 | 101 | 2.2 | ||
| Group 4 | 3 | Min | 13.8 | 1.9 | 17.3 | 231.3 | 76.3 | 3.4 | 2.6 | 3.9 | 0.4 | 8.1 | 466 | 74 | 1.7 |
| Max | 49.2 | 2.5 | 26.6 | 299.7 | 134.3 | 4.8 | 8.2 | 16.5 | 0.6 | 8.7 | 563 | 231 | 6.2 | ||
| Mean | 26.2 | 2.1 | 21.9 | 254.3 | 108.8 | 4.3 | 5.5 | 10.3 | 0.5 | 8.4 | 529 | 177 | 3.7 | ||
| S.D. | 19.9 | 0.3 | 4.7 | 39.3 | 29.6 | 0.8 | 2.8 | 6.3 | 0.1 | 0.3 | 55 | 89 | 2.3 | ||
| Group 5 | 4 | Min | 17.5 | 0.7 | 22.0 | 111.2 | 23.6 | 3.9 | 16.6 | 24.3 | 0.2 | 6.9 | 407 | 32 | 2.3 |
| Max | 28.9 | 32.1 | 43.5 | 224.2 | 43.7 | 5.2 | 18.2 | 37.0 | 7.3 | 8.3 | 507 | 207 | 6.2 | ||
| Mean | 24.2 | 11.2 | 34.5 | 170.6 | 33.8 | 4.6 | 17.5 | 33.2 | 2.5 | 7.7 | 453 | 104 | 3.9 | ||
| S.D. | 5.4 | 14.7 | 9.0 | 55.5 | 9.2 | 0.6 | 0.7 | 6.0 | 3.3 | 0.6 | 44 | 81 | 1.7 |
Publisher’s Note: MDPI stays neutral with regard to jurisdictional claims in published maps and institutional affiliations. |
© 2022 by the authors. Licensee MDPI, Basel, Switzerland. This article is an open access article distributed under the terms and conditions of the Creative Commons Attribution (CC BY) license (https://creativecommons.org/licenses/by/4.0/).
Share and Cite
Nakagawa, K.; Amano, H.; Yu, Z.-Q.; Berndtsson, R. Groundwater Quality and Potential Pollution in the Southern Shimabara Peninsula, Japan. Water 2022, 14, 4106. https://doi.org/10.3390/w14244106
Nakagawa K, Amano H, Yu Z-Q, Berndtsson R. Groundwater Quality and Potential Pollution in the Southern Shimabara Peninsula, Japan. Water. 2022; 14(24):4106. https://doi.org/10.3390/w14244106
Chicago/Turabian StyleNakagawa, Kei, Hiroki Amano, Zhi-Qiang Yu, and Ronny Berndtsson. 2022. "Groundwater Quality and Potential Pollution in the Southern Shimabara Peninsula, Japan" Water 14, no. 24: 4106. https://doi.org/10.3390/w14244106
APA StyleNakagawa, K., Amano, H., Yu, Z.-Q., & Berndtsson, R. (2022). Groundwater Quality and Potential Pollution in the Southern Shimabara Peninsula, Japan. Water, 14(24), 4106. https://doi.org/10.3390/w14244106


