Abstract
Despite efforts to protect the hydrosystems from increasing pollution, nitrate (NO3−) remains a major groundwater pollutant worldwide, and determining its origin is still crucial and challenging. To disentangle the origins and fate of high NO3− (>900 mg/L) in the Sidi Bouzid North basin (Tunisia), a numerical groundwater flow model (MODFLOW-2005) and an advective particle tracking (MODPATH) have been combined with geostatistical analyses on groundwater quality and hydrogeological characterization. Correlations between chemical elements and Principal Component Analysis (PCA) suggested that groundwater quality was primarily controlled by evaporite dissolution and subsequently driven by processes like dedolomitization and ion exchange. PCA indicated that NO3− origin is linked to anthropic (unconfined aquifer) and geogenic (semi-confined aquifer) sources. To suggest the geogenic origin of NO3− in the semi-confined aquifer, the multi-aquifer groundwater flow system and the forward and backward particle tracking was simulated. The observed and calculated hydraulic heads displayed a good correlation (R2 of 0.93). The residence time of groundwater with high NO3− concentrations was more significant than the timespan during which chemical fertilizers were used, and urban settlements expansion began. This confirmed the natural origin of NO3− associated with pre-Triassic embankment landscapes and located on domed geomorphic surfaces with a gypsum, phosphate, or clay cover.
1. Introduction
Groundwater is the main source of water supply worldwide, especially in arid and semi-arid regions, where it also plays a key role for their proper economic and social development [1,2]. Groundwater suitable for human consumption or crop irrigation must contain mineral salts in a well-balanced quantity. However, groundwater is most often subject to natural and/or anthropogenic constraints affecting its quality degradation. Globally, the main issue related to groundwater quality degradation is nutrients and/or chemical enrichment from a chemical such as nitrate (NO3−), which is recognized as the main water pollutant [3,4]. There are several sources of NO3− in groundwater, and anthropogenic activities are indeed the main ones. Diffuse agricultural pollution due to the development of intensive practices, new methods of cultivation and breeding characterized by a massive spreading of effluents and fertilizers, and urban and industrial discharges contribute to groundwater pollution and quality degradation [5,6,7,8]. Bioavailable nitrogen (N) deposition at the land surface constitutes a natural origin of NO3− [9,10]. The main source of N resides in the atmosphere in the molecular form (N2), representing approximately 78% of the atmospheric composition [11]. Another natural source of NO3−, is represented by the accumulations of NO3− rich salts which have also been found in regions with an arid climate and/or deserts, such as the Death Valley of the Mojave Desert, southern California [12]. Regardless of the NO3−’s origin, this ion has harmfully affected groundwater quality, biodiversity, and ecosystem functioning worldwide [13,14].
The Sidi Bouzid basin (Central Tunisia, North Africa) is an example of a semi-arid area that is characterized by an aquifer system with high concentrations of NO3−, which often exceed the standard of the World Health Organization for drinking water of 10 mg-N/L [15,16]. Previous research on this aquifer system has already focused on groundwater quality [13], groundwater vulnerability to NO3− pollution [17,18], and on the health risk assessment of NO3− in groundwater [9]. Additionally, some studies have used stable isotopes to assess groundwater recharge [19]. Nevertheless, none of the aforementioned studies focused on the origin of NO3− in groundwater. Numerous methods have been proposed to identify the NO3− sources around the world, including: (i) geophysical approaches [20], (ii) statistical techniques [21], (iii) and via stable isotopes [22,23,24,25]. Petelet-Giraud et al. [20] used detailed geological and geophysical profiles, such as electric tomography, to improve a local structural model. The authors in this case studied the heterogeneity of the hydrogeological system, where some compartments were disconnected from the general groundwater flow and explained the presence of young and old groundwater via NO3− concentrations and environmental tracers. Kendall and Aravena [26] defined the use of the stable N and O isotopes of NO3− molecules as tracers to evaluate the sources and processes that affect NO3− in groundwater. Widory et al. [27] investigated the viability of an isotopic multi-tracer approach (δ15N, δ11B, 87Sr/86Sr) to determine the source(s) of NO3− pollution in groundwater in the Arguenon watershed (France). Xuan et al. [25] in southern China also applied N isotope analyses to identify the source and transformations of NO3− in groundwater in a mixed land use watershed, but the studies of the isotopes are limited to knowing an area punctually. However, most of the previous studies did not explicitly model the retention time within the aquifer and possible different sources of NO3− except for small field sites [28,29,30]. One of the few exceptions is the study of Koh et al. [31] that modelled an aquifer system characterized by complex hydrogeology and mixing of groundwater with different ages via environmental tracers, but a single source of NO3− from fertilizers was employed. To the best of authors’ knowledge, no environmental studies have evaluated NO3− origins (anthropogenic versus geogenic) in an aquifer system in a semi-arid region using a combined approach of geostatistical analysis on hydrochemical data and numerical flow and advective modeling. Here, two popular codes, MODFLOW-2005 v.11 [32] and MODPATH v.7 [33], have been used for the Sidi Bouzid North basin in central Tunisia. The objectives of this study are: (1) to evaluate the spatial distribution of NO3− in the aquifer system of the Sidi Bouzid basin; and (2) to identify possible NO3− sources in groundwater.
2. Study Area
2.1. Geography and Climate
The study area, situated between longitudes 9°10′00″ E to 9°45′00″ E and latitudes 34°55′00″ N to 35°20′00″ N, constitutes the Sidi Bouzid North basin located in central Tunisia. It covers an area of approximately 1508 Km2 (Figure 1) and extends from Jebel Rakhmet, Jebel Hamra, and Jebel Mghila in the West to the North-South axis (NOSA) in the East, and from the Zawiya-Roua chain in the North to Jebel Kebar in the South. To the Southwest, it is limited by the Jebel Al Hfay. The study area is made of three sub-basins: (i) the Southern part: Sidi Bouzid, (ii) the Western part: Awled Asker, and (iii) the Eastern part: Oued El Hjal. The overall elevation of the area ranges between 238 m and 640 m above sea level (a.s.l.). This area belongs to a semi-arid Mediterranean climate with a mean annual precipitation of 223 mm and an average yearly temperature of 19 °C [34]. The average annual evapotranspiration is 180 mm.
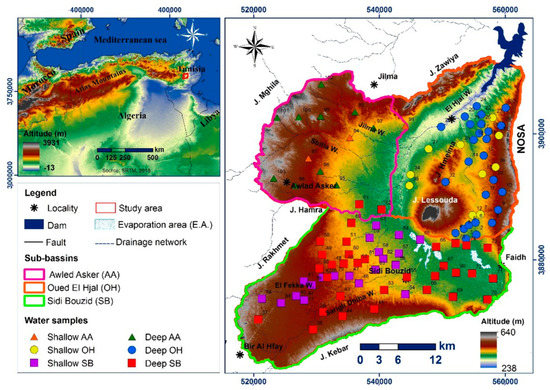
Figure 1.
Location of the study area: Sidi Bouzid basin.
2.2. Geology
The exposed geological units in the study area include: (i) Mesozoic (Triassic, Jurassic, and Cretaceous) and (ii) Cenozoic (Paleogene, Neogene, and Quaternary) aged rocks. The oldest rocks are Triassic and Jurassic in age and outcrop on raised structures bordering the study area. The Triassic strata consist of diapiric intrusions of a complex combination of gypsum, clays, and dolomites. Jurassic aged rocks are calcareous-dolomitic deposits of the Nara Formation. The Cretaceous aged rocks begin with clay and sandstone deposits and continue with a series of limestones, dolomites, clays, and gypsums (Figure 2). The Paleogene rocks in the study area include a succession of gypsum, marl, phosphate, and limestone [35,36]. The Neogene is characterized by a variety of continental and lagoon facies with red clayey silts, small calcareous concretions, and gypsum. Finally, the Quaternary strata constituting diversified fluvial deposits of sandy clays, silts, gypsum crust, sandy silts, and sands are distributed throughout the study area.
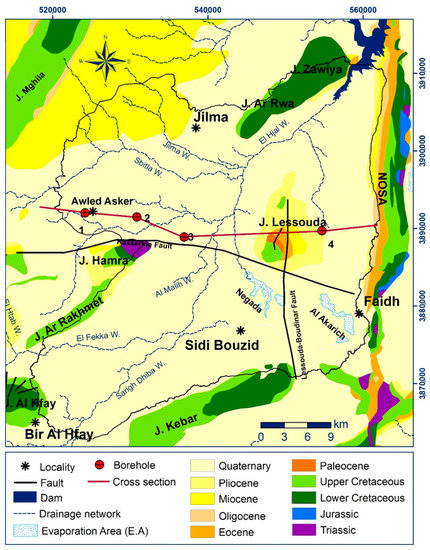
Figure 2.
Geological map of the study area (modified from the geological map of Tunisia at 1/500,000) [37].
2.3. Hydrogeology
The conceptual model of the Sidi Bouzid basin has been schematized and presented in Figure 3. The Sidi Bouzid basin is a detrital Mio-Plio-Quaternary complex hosting two aquifers. The borehole cross-section represents the superposition of three layers. The first layer, widely distributed throughout the study area, constitutes the shallow reservoir (with an average thickness of 40 m) made of sand with gravel and clayey intercalations. The second layer is an impermeable and sometimes semi-permeable aquitard with an average thickness of 45 m, while the third layer is the deeper aquifer with an average thickness of 25 m. Groundwater is recharged through atmospheric precipitation, supplemented by lateral runoff and irrigation return flow. Groundwater discharge occurs by lateral outflow, evapotranspiration, evaporation areas, and artificial extraction (for domestic and agricultural use). The groundwater flows from the mountainous boundary area to the northeast of the study area. Finally, it discharges to the evaporation area (Negada and Al Akarich) and El Hjal Wadi, for both aquifers shallow and deep [38]. Lastly, the communication between the aquifers is only downstream of the basin. The hydrodynamics of the water are influenced by the aquifer geometry and the tectonic structures. The groundwater flow converges from Miocene outcrops in two directions: (i) the main direction is from West to East, while (ii) the secondary flow is from NW to SE. The groundwater overexploitation is intense in the central and downstream parts, and it has experienced a constant increase during the last years [36].
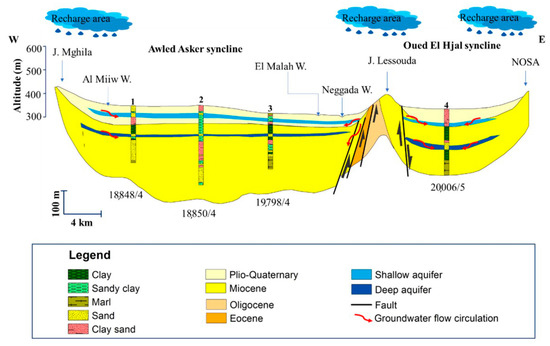
Figure 3.
Simplified cross section elaborated from lithostratigraphic sections of boreholes.
3. Materials and Methods
3.1. Groundwater Flow Simulation
Governing Equations and Groundwater Model Selection
The worldwide popular groundwater flow numerical model MODFLOW-2005 v.11, based on Darcy’s law and mass conservation concept has been used in this study. MODFLOW-2005 employs a three-dimensional simulation of groundwater flow circulation in porous media, for both aquifers, shallow and deep, which is represented by the mathematically following equation [32]:
where Kx, Ky, and Kz are the hydraulic conductivity values along the x, y, and z coordinate axes, which are assumed to be parallel to the major hydraulic conductivity axes, w is the volumetric flow per unit volume and represents the sources (negative values) and/or the sinks (positive values) of water per unit time, h is the hydraulic head, Ss is the specific storage of the porous material if the aquifer is confined or specific yield if the aquifer is unconfined, and t is the time.
Following the groundwater flow field calculated by MODFLOW-2005, an advective particle tracking numerical code MODPATH v.7 was employed to define the direction of solute particles’ migration and their retention time within the aquifers system.
3.2. Data Collection and Processing
In this study, a two-step approach was employed: (i) the first step aimed at identifying the relationship between NO3− and other chemical elements in groundwater, and (ii) the second step aimed at identifying the different NO3− origins developing a numerical model to simulate the groundwater flow and particle circulation (Figure 4). This approach was used to test two hypotheses to explain NO3− accumulation in groundwater. The first hypothesis describes a “top-down” mechanism where NO3− is thought to be of anthropogenic origin and infiltrated from the surface through stratified layers of sand and sandstone. In this hypothesis, the particles (nitrates in our case) reach the groundwater and migrate inside it according to the existing flow in a transient state. It is determined by the circulation time of the particles from surface to groundwater. The second hypothesis is a “bottom-up-laterally” mechanism where NO3− is deposited onto a stable soil surface through aerosol deposition and has concentrated in the subsoil over time. In this hypothesis, it is considered that the nitrates are of natural origin (linked to sedimentation) and are found in the subsurface. This mechanism has been used to explain NO3− reservoirs found in arid and semi-arid areas [39].
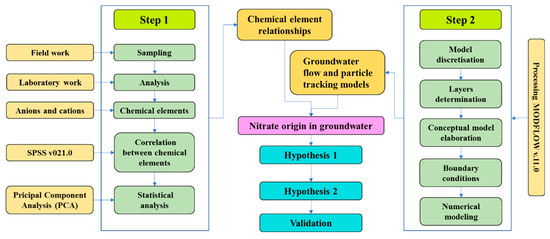
Figure 4.
Flowchart showing the methodology adopted for the determination of the NO3− origin in groundwater.
Temperature, pH, and electrical conductivity (EC) were measured in the field using a HI 99301 multiparameter analyzer. A total of 103 water samples were collected from 38 shallow wells and 65 deep wells to describe the physicochemical characteristics of groundwater in 2019. The samples were collected in sterilized bottles after purging at least 3 volumes from the well casing. Water samples were delivered to the Laboratory of Physico-chemical Analyses of Soil and Water of the Regional Commissariat of Agricultural Development of Sidi Bouzid for major ions analysis. NO3− concentrations were also measured directly in the field using a portable NO3− meter (LAQUAtwin B-743) after two-point calibration. The reliability of the results of the chemical analyzes was determined by the calculation of the ionic balance ()). The analysis is declared acceptable if −6 ≤ BI ≤ 6%.
The data used to develop the conceptual and numerical models of the groundwater flow circulation (piezometric and exploitation histories since 1990 and the hydrodynamic data of the aquifer) were collected from the Regional Commissariat for Agricultural Development (CRDA). Groundwater was exploited by 6970 wells for the shallow aquifer and 195 boreholes for the deep aquifer in 2020. The observation wells used are 53 and 39 wells for the phreatic and deep aquifer, respectively.
ArcGIS v.10.5 was used to prepare input data maps. The DEM to define the vadose zone thickness and ground elevation was obtained from STRM, while the digital geologic map and borehole cross-section were used to determine the distribution of rock and vadose zone types.
The statistical analysis was carried out by using SPSS v21.0. The Principal Component Analysis (PCA) with varimax rotation was conducted to assess the strength of relationships between variables (NO3− and other major ions) in the study area. Processing MODFLOW-2005 v11.0 [40] and MODPATH v.7 was used to simulate groundwater flow modeling and particle tracking, respectively.
4. Results and Discussion
4.1. Hydrochemical Characteristics
4.1.1. NO3− Concentrations in Groundwater
Figure 5, generated using distribution of NO3− concentrations in groundwater through Kriging interpolation technique, shows that the lowest NO3− concentrations are in the western area of the Sidi Bouzid North basin and in the Awled Asker sub-basin. While towards the East of the study area, NO3− concentrations become very high, often exceeding 300 mg/L in both the shallow (Figure 6a) and deep (Figure 6b) aquifers. In the south, NO3− concentrations vary from 30 mg/L to 120 mg/L. The highest levels of NO3− are around 930 mg/L and are recorded in the Oued El Hjal sub-basin. This differentiation of spatial concentration distributions of nitrate is due to the hydrodynamic functioning of the aquifer system which is also influenced by lithostratigraphic variations.
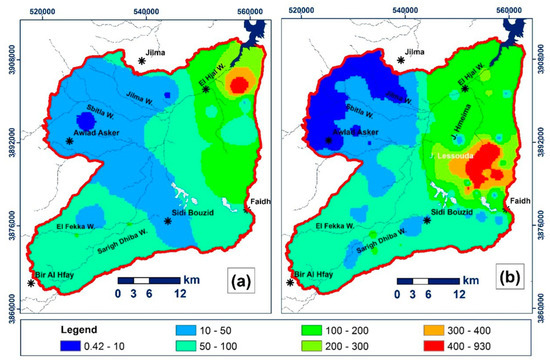
Figure 5.
Spatial distribution of NO3− concentrations in groundwater: (a) shallow aquifer and (b) deep aquifer.
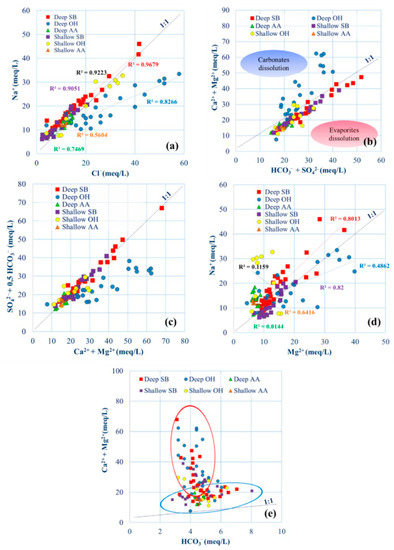
Figure 6.
Scatter plots of major ions in the deep and shallow aquifers.
4.1.2. Comparison Nitrate with Other Ions
The relationship between the nitrate concentration and chemical elements was investigated for geochemical characterization of groundwater and to trace the origin of NO3−. Cl− and Na+ in groundwater are often linked to halite dissolution (NaCl). The evolution of Na+ has been studied as a function of Cl−, which is considered a stable and conservative tracer of evaporites [41]. The graph in Figure 6a shows that several samples line up on the slope line 1:1, indicating coexistence of the two ions and possible NaCl dissolution. Other samples, especially from the deep aquifer of the Oued El Hjal sub-basin, have an excess of Cl− compared to Na+, this can also be explained by the dissolution of halite, but with subsequent sorption of Na+ via cation exchange. The role of carbonate and evaporite dissolution on groundwater composition was investigated through the scatter plots of (Ca2+ + Mg2+) versus (HCO3− + SO42−) as shown in Figure 6b. Most water samples are located near and below the slope line 1:1 on the side of HCO3− + SO42−, indicating no preferential dissolution of evaporitic or carbonate rocks as major hydrochemical process of the entire aquifer system of the study area. One exception is the deep aquifer of Oued El Hjal sub-basin, in which the excess of Ca2+ and Mg2+ could be due to cation exchange with Na+, as previously postulated.
The predominance of SO42− over HCO3− and the lack of a strong link between the species Ca2+, HCO3−, and SO42− indicate that other processes control the water chemistry, such as dedolomitization, which involves dissolution reactions with carbonate minerals and gypsum. Dedolomitization is often caused by gypsum-to-anhydrite conversion [42] accompanied by the dissolution of dolomite and the precipitation of calcite (CaMg(CO3)2 + Ca2+ ⬄ 2CaCO3 + Mg2+). The dissolution of gypsum consequently increased the concentration of Ca2+ by the same Ca2+/Mg2+ ratio. This ratio once greater than 0.5 thermodynamically causes dedolomitization [43]. All samples from the study area show a Ca2+/Mg2+ ratio greater than 0.5, thus explaining that the dedolomitization process seems to mark the water chemistry. The dissolution of dolomite consequently led to an increase in the concentration of Mg2+ in groundwater. This process, which includes the dissolution of gypsum, is highlighted through the correlation (Ca2+ + Mg2+) vs. (SO42− + 0.5HCO3−), where most of the samples are organized along the straight line 1:1 (Figure 6c), except the ones pertaining to the deep aquifer of the Oued El Hjal sub-basin, in which the excess of Ca2+ and Mg2+ could be due to cation exchange with Na+ which takes place within and on colloid particles. The overall reaction of the dedolomitization process can be written as follows:
CaMg(CO3)2(s) + CaSO4x2H2O(s) + H+ = CaCO3(s) + Ca2+ + Mg2+ + SO42− + HCO3− + 2H2O
To better discriminate all the cation exchange phenomena within the aquifers system, a plot of Na+ vs. Mg2+ is shown (Figure 6d). Cation exchange takes place with the colloids of organic matter and rich clay minerals present in the aquifer matrix, which release Na+ and adsorb Ca2+ and Mg2+, leading to an increase in Na+ concentrations in groundwater. Here, all samples show a slight abundance of Na+ with respect to Mg2+, except for the samples from the deep aquifers of Oued El Hjal, in which excess of Mg2+ is released in groundwater via dedolomitization which triggers Na+ adsorption. Finally, Figure 6e shows that the sum of Ca2+ and Mg2+ correlates very poorly with HCO3−, excluding simple dolomite dissolution mechanism as the main driver of the observed patterns.
4.1.3. Principal Component Analysis
The PCA was applied to the chemical elements (the variables) of groundwater in the study area for the three sub-basins, reducing the dimensions of the data to two main components (F1 and F2) (Table 1), which are visualized graphically in Figure 7. The correlations between the variables and the main axes show that the first two axes F1 and F2 express 69.6%, 69.6%, and 82.0% of the total variance for the sub-basins of Awled Asker, Oued El Hjal, and Sidi Bouzid, respectively.

Table 1.
The contribution of the factorial axes in the total values and the attributed eigenvalues of groundwater in the three sub-basins of the study area.
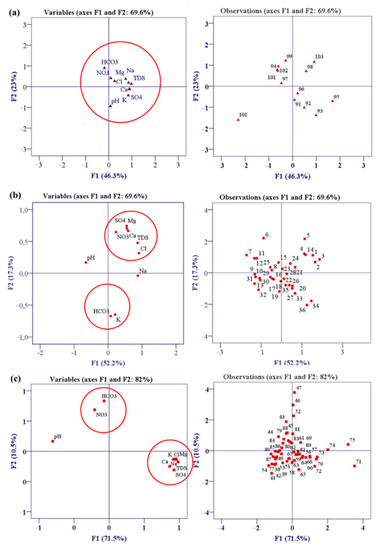
Figure 7.
Projection of observations and variables into the factorial plane (F1 × F2): (a) sub-basin of Awled Asker (13 samples), (b) sub-basin of Oued El Hjal (36 samples), and (c) sub-basin of Sidi Bouzid (57 samples).
The NO3− content in the Awled Asker and Oued El Hjal basins is found to be associated with other dissolved species, which explains a common origin between them, and thus a geogenic origin (Figure 7). While in the Sidi Bouzid, NO3− content is associated with HCO3− that is often related to an increase in inorganic carbon due to heterotrophic denitrification, thus suggesting fertilizer application is the source.
4.2. Model Discretization and Calibration
The numerical model domain covers an area of 1508 km2 (43 km × 41 km). The UTM global coordinate system has been used to create the model and the database. The modeling grid consists of a cell dimension of 500 m × 500 m and 4 layers (Figure 8), the shallow aquifer was subdivided into 2 layers to better represent the surface features, while layer 3 represented the confining unit and layer 4 the deep aquifer. The grid cells are designated as inactive outside the model domain and in the impermeable areas, and as active inside the model domain. The regional Shuttle Radar Topography Mission (STRM) Digital Elevation Model (DEM) with a spatial resolution of 20 m × 20 m cells was used and interpolated over the model grid to reproduce the basin topography. The hydraulic conductivity (K) of lithological units was obtained from pumping tests: 41 pumping tests were performed in the shallow aquifer and 30 in the deep aquifer. The resulting mean K values and the respective standard deviation were 5.35 × 10⁻⁴ ± 3.54 × 10⁻⁴ m/s for the shallow aquifer and 1.44 × 10⁻³ ± 7.73 × 10⁻⁴ m/s for the deep aquifer. Thus, the deep aquifer is more permeable than the shallow one, and both are characterized by relatively homogeneous K distributions. The confining unit was simulated with a K of 1.0 × 10⁻⁹ m/s to ensure sealing among the unconfined and confined aquifers to maintain the observed heads differences among the aquifers. The vertical anisotropy was set equal to 1:10 in all layers as suggested by the PM11 manual [40].
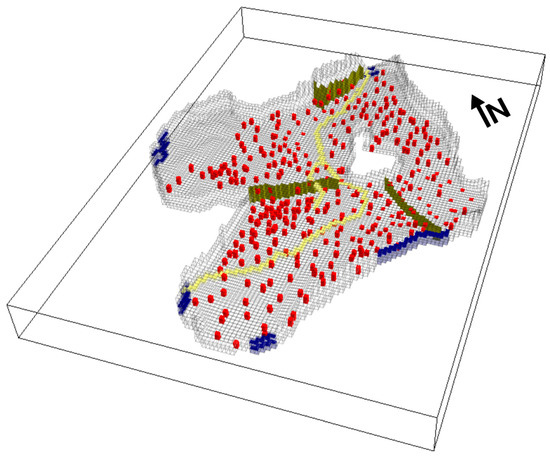
Figure 8.
3D discretization and boundary conditions of the Mio-Plio-Quaternary aquifer system: drain cells representing the Wadis (yellow), pumping wells (red), General Head Boundary representing the inflow and outflow from the basin (blue), and HFB representing the major faults (olive green). Vertical exaggeration is 1:20.
The boundary conditions are presented by assumed or known supplies and/or flows [33]. The lateral contribution from the nearby basins were determined based on the hydraulic potentials and were simulated via the General Head Boundary package (Figure 8), as well as the contribution of the Sidi Saad dam to the supply of the downstream part of the basin. To ensure a good connection with the aquifers, a very high value (0.1 m2/s) of water supply from Sidi Saad dam was set up. The Well package was employed to distribute an average pumping rate in more than 300 wells scattered throughout the model domain in both aquifers. Groundwater drainage from the beds of wadis (El Fekka, Sarigh Dhiba, Sbitla, and Jilma) was simulated with the Drain package (Figure 8), using a conductance of 0.001 m2/s to allow a good drainage from the nearby cells and setting the elevation of the drain 2 m below the topographic surface. Recharge was initially set to 43 mm/y (approximately 20% of precipitation) and multiplied by an altitude factor of 1.44 over 100 m. This factor was calculated comparing 12 meteorological stations ranging from 297 to 413 m a.s.l. to include the higher recharge from the mountain ranges that border the basin. The Evapotranspiration package was used to simulate the evapotranspiration from groundwater, using the mean value for the area from 1990 to 2010 [44] as maximum uptake rate (630 mm/y) and an average extinction depth of 3 m. The horizontal flow barrier (HFB) package was used to simulate the compressive faults, using a thickness of 1 m and an equivalent K of 1.0 × 10⁻⁹ m/s (Figure 8).
The model calibration was initially obtained manually by a trial-and-error approach, then employing PEST for an automated calibration and sensitivity analysis [45]. The vertical K were tied to the horizontal K parameters that were log transformed, and their minimum and maximum values were set using the observed ones (see Supplementary Information of K values in Table S3), while the recharge and evapotranspiration rates were calibrated as relative parameters. The observations used in the model calibration include the observed hydraulic heads in the 53 observation wells for the shallow aquifer and 38 observation wells for the deep aquifer. Quantitatively, the model calibration performance was evaluated by the criterion of the mean error (ME), the mean square error (MSE), and the determination coefficient (R2).
The model calibration was carried out by automatically tuning the K values and other parameters like maximum evapotranspiration rate, recharge rate, and drain conductance, reported in Table 2 with their composite sensitivities. The comparison between observed and simulated head for both the shallow and the deep aquifers is shown in Figure 9. The points are scattered along the 1:1 line, with no apparent pattern. However, there is a slight underestimation in the calculated heads as suggested by the mean error (ME) that denotes approximately −0.26 m of error, which is acceptable compared to the whole piezometric range simulated here (more than 150 m) with the R2 being higher than 0.9 (Figure 9). The relatively large MSE of calculated heads could have been due to local variability of hydraulic conductivity here not considered to maintain the simplicity of the model as much as possible.

Table 2.
Calibrated parameters values and their composite sensitivity via PEST.
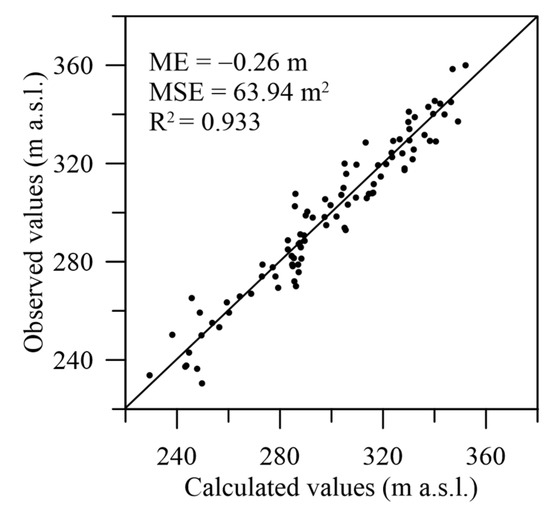
Figure 9.
Scatter diagram of the observed versus calculated head values (dots) for the simulated aquifers system.
The most sensitive parameter was the K of the first layer which was mostly unsaturated, followed by the K value of the deep aquifer indicating that the most uncertain parameters are the hydraulic conductivities of the aquifers.
For the shallow aquifer, the hydraulic head ranged between 350 and 260 m, and high values were observed in the western part of the Awled Asker sub-basin (Figure 10a). The main flow direction goes from the Southwest and the West draining Mghila and Al Rakhmet mountains to the discharge area in the evaporation areas and the El Hjal Wadi in the north and the Centre-East of the study area.
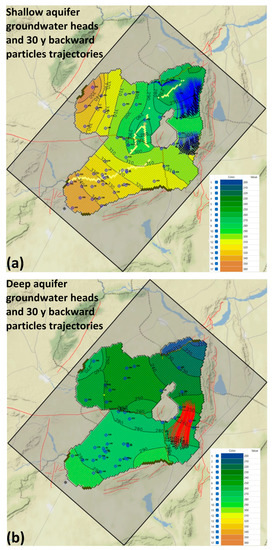
Figure 10.
Contours of the calculated groundwater heads for the shallow (a) and deep aquifers (b). The backward particle trajectories from the zones with high NO3− concentration for the period 1990–2020, in blue for the shallow aquifer and red for the deep aquifer; black points delineate the NO3− source zones in 1990.
For the deep aquifer, the hydraulic head map (Figure 10b) shows values between 270 m and 210 m, thus potentially draining the shallow aquifer. The flow direction is mostly from the West and Southwest towards Northeast. From the model, the flow converges in the south of Lessouda mountain (here simulated as no flow boundary and the center of the model). Then it is divided into two directions: (1) to the East of the study area where discharge is in the evaporation area of Al Akarich and Negada, and (2) to the North towards the El Hjal Wadi where the drainage takes place. This division of the flow in the two directions imposes the assumption of the existence of the deep faults of Lessouda Boudinar and Kassrine that act as horizontal flow barriers. Without using the HFB package, it was not possible to reach an acceptable calibration due to groundwater heads that were too low or too high with respect to the measured ones near faults.
In the Sidi Bouzid North basin, the groundwater budget, in the steady state condition, shows a good balance between input and output flows with a percent error equal to 0.16% and −0.35% for the shallow and deep aquifers, respectively (Table 3). The main input to the shallow aquifer is the recharge through porous deposits, which is estimated at 2.78 m3/s and constitutes 71.5% of the total inflow of the shallow aquifer and the 36% of the whole aquifers system. The contribution of the GHB estimated by the model are: (1) for the inputs, 1.106 m3/s and 3.59 m3/s for the shallow and deep aquifer, respectively; and (2) for the outputs, 8.55 × 10⁻² m3/s towards the Sidi Saad dam for the shallow aquifer and 0.80 m3/s for the deep aquifer towards the basin located in the north of the study area. For the vertical groundwater leakage between the aquifers, the input from the shallow to the deep aquifer is estimated at 0.300 m3/s. The main outflow of the aquifers system is divided into exploitation by wells (1.01 m3/s from the shallow aquifer and 3.1 m3/s from the deep aquifer), drainage towards the wadis, and evapotranspiration which is found only in the shallow aquifer with estimated values of 2.34 m3/s and 0.157 m3/s, respectively. It can be noticed that the actual overexploitation from wells is not sustainable by the recharge occurring in the study area; in fact, a water table drawdown (approximately 20 m) has been experienced by both the shallow and the deep aquifer in the last decades.

Table 3.
Groundwater balance of the shallow and deep aquifers: GHB (Head Dependent flux Boundaries).
4.3. Particle Tracking Results
The results of MODPATH via forward particle transport highlighted that it was not possible to bypass the thick aquitard between the shallow and deep aquifer since the beginning of urban settlement growth and use of synthetic fertilizers since the early 1970s. Moreover, it must be stressed that the choice of a steady state model is a conservative option, since the overexploitation of the aquifer experienced a dramatic increase in the last 30 years.
The simulation shown in Figure 10 backtracked particles from the NO3− enriched zones (see Figure 5 for location) towards their possible origin before the overexploitation of the aquifer system for a period of 30 years (from 1990 to 2020). This approach allows the interpretation of flow directions and travel times and possibly reconstructs the location of the source zones. The flow paths of advective transport in the shallow aquifer differ from those obtained in the deep aquifer. While the shallow aquifer has the NO3− source zones located near the contaminated zones and within agricultural areas, the source zone for the deep aquifer is located approximately 10 to 15 m upgradient and southward to Oued El Hjal sub-basin (between Jebel Lessouda and Jebel Faidh), where no agricultural fields are present, since the small valley is a former Sabkha.
In the Sidi Bouzid basin, the NO3− accumulations are associated with pre-Triassic embankment landscapes and occur on domed geomorphic surfaces with a gypsum, phosphate or clay cover. The rough surfaces of surficial materials trap fine textured aeolian sediments rich in organic matter, which are then washed under or over the sides of the syncline during intense episodic rainfall events. For thousands of years, the eolian deposits accumulated and raised a fine mosaic of an alluvial embankment to form a desert stone pavement. These deposits stabilized over time, decreasing infiltration, increasing surface runoff, and allowing soluble salts to accumulate below the surface. Heaton [40] suggested that the high NO3− concentrations in groundwater result from N fixation by cyanobacteria and subsequent mineralization and nitrification of the organic matter over time. However, the first hypothesis could not be confirmed with the available data. The hydrochemical data and Figure 10 indicate that the NO3− in the deep aquifer of Oued El Hjal is likely to have come from natural sources and could not have been derived from anthropogenic sources.
As reported by Kaplan et al. [46], according to the logic of nature, the accumulation of contaminants that comes from the surface takes place in the unconfined aquifer, which is not the case of this study where the highest NO3− concentrations were found in the deep aquifer. Also, the examination of the land cover map shows that the areas with the highest NO3− concentrations coincide with bare land or olive trees that do not require excessive use of N fertilizers. Thus, the above-mentioned features suggest that the first hypothesis is far from being accepted. Nevertheless, new data on groundwater ages and environmental tracers should be collected in future studies to independently confirm or reject this conceptual model.
5. Conclusions
In this study, NO3− origin in groundwater of the Mio-Plio-Quaternary aquifer of Sidi Bouzid North basin was assessed. To evaluate the origin of extremely high NO3− concentrations in deep groundwater samples, hydrochemical investigations and groundwater flow modeling were employed. Geostatistical analyses were used for hydrochemistry assessment, and the correlation among solute species showed that groundwater is affected by evaporite dissolution and water quality changes in the whole studied area. PCA showed that NO3− in most samples have origins associated with other chemical elements related to evaporitic salts dissolution. Groundwater flow modeling highlighted that recharge was the most important groundwater inflow into the aquifer system, while exploitation by wells is the most important outflow. Moreover, the particle tracking simulation showed that leakage of NO3− through the aquitard between the shallow unconfined aquifer and the deep aquifer was negligible, which further suggested that the NO3− origin in the deep aquifer is geogenic. On the contrary, the NO3− origin in the shallow aquifer is anthropogenic and mainly due to fertilizers leaching.
The approach developed in this study can be a valuable decision support tool for groundwater resource managers in the Sidi Bouzid North basin, and the approach can be replicated in similar environmental settings. However, to make the implemented model a more robust tool for integrated water resources management in the study area, future simulations must be applied using transient state models based on several scenarios and new data on groundwater age and origin must confirm the proposed conceptual model.
Supplementary Materials
The following supporting information can be downloaded at: https://www.mdpi.com/article/10.3390/w14244124/s1, Table S1: Factor Loadings, Table S2: Hydrochemical data, Table S3: Transmissivity thickness and K.
Author Contributions
N.C. and M.M. conceived and designed the study; K.N. performed field activities; K.N. and G.B. elaborated the data in GIS; K.N. elaborated the hydrochemical data with the supervision of N.C., R.H. and Y.H.; N.C. developed the numerical model; K.N. wrote the draft of the paper. K.S. improved the conceptual model and revised the manuscript along with all the other authors. All authors have read and agreed to the published version of the manuscript.
Funding
This research received no external funding.
Data Availability Statement
Data will be made available by the authors upon request.
Conflicts of Interest
The authors declare no conflict of interest.
References
- Guermazi, E.; Milano, M.; Reynard, E.; Zairi, M. Impact of climate change and anthropogenic pressure on the groundwater resources in arid environment. Mitig. Adapt. Strateg. Glob. Chang. 2019, 24, 73–92. [Google Scholar] [CrossRef]
- Nadiri, A.A.; Moghaddam, A.A.; Tsai, F.T.; Fijani, E. Hydrogeochemical analysis for Tasuj plain aquifer, Iran. J. Earth Syst. Sci. 2013, 122, 1091–1105. [Google Scholar] [CrossRef]
- Hamed, Y.; Awad, S.; Ben Sâad, A. Nitrate contamination in groundwater in the Sidi Aïch–Gafsa oases region, Southern Tunisia. Environ. Earth Sci. 2013, 70, 2335–2348. [Google Scholar] [CrossRef]
- Nadiri, A.A.; Aghdam, F.S.; Khatibi, R.; Moghaddam, A.A. The problem of identifying arsenic anomalies in the basin of Sahand dam through risk-based ‘soft modelling’. Sci. Total Environ. 2018, 613, 693–706. [Google Scholar] [CrossRef] [PubMed]
- Busico, G.; Alessandrino, L.; Mastrocicco, M. Denitrification in intrinsic and specific groundwater vulnerability assessment: A review. Appl. Sci. 2021, 11, 10657. [Google Scholar] [CrossRef]
- Nadiri, A.A.; Aghdam, F.S.; Razzagh, S.; Barzegar, R.; Jabraili-Andaryan, N.; Senapathi, V. Using a soft computing OSPRC risk framework to analyze multiple contaminants from multiple sources; a case study from Khoy Plain, NW Iran. Chemosphere 2022, 308, 136527. [Google Scholar] [CrossRef]
- Nadiri, A.A.; Sadeghfam, S.; Gharekhani, M.; Khatibi, R.; Akbari, E. Introducing the risk aggregation problem to aquifers exposed to impacts of anthropogenic and geogenic origins on a modular basis using ‘risk cells’. J. Environ. Manag. 2018, 217, 654–667. [Google Scholar] [CrossRef]
- Hamed, Y.; Hadji, R.; Ncibi, K.; Hamad, A.; Ben Saad, A.; Melki, A.; Khelifi, F.; Mokadem, N.; Mustafa, E. Modelling of potential groundwater artificial recharge in the transboundary Algero-Tunisian Basin (Tebessa-Gafsa): The application of stable isotopes and hydroinformatics tools. Irrig. Drain. 2022, 71, 137–156. [Google Scholar] [CrossRef]
- Ascott, M.J.; Gooddy, D.C.; Wang, L.; Stuart, M.E.; Lewis, M.A.; Ward, R.S.; Binley, A.M. Global patterns of nitrate storage in the vadose zone. Nat. Commun. 2017, 8, 1416. [Google Scholar] [CrossRef]
- Nadiri, A.A.; Sedghi, Z.; Khatibi, R. Qualitative risk aggregation problems for the safety of multiple aquifers exposed to nitrate, fluoride and arsenic contaminants by a ‘Total Information Management’ framework. J. Hydrol. 2021, 595, 126011. [Google Scholar] [CrossRef]
- Cox, A.N. Allen’s Astrophysical Quantities, 4th ed.; AIP Press: New York, NY, USA, 2000; ISBN 0-387-98746-0. [Google Scholar]
- Walvoord, M.A.; Phillips, F.M.; Stonestrom, D.A.; Evans, R.D.; Hartsough, P.C.; Newman, B.D.; Striegl, R.G. A reservoir of nitrate beneath desert soils. Science 2003, 302, 1021–1024. [Google Scholar] [CrossRef] [PubMed]
- Ncibi, K.; Hadji, R.; Hamdi, M.; Mokadem, N.; Abbes, M.; Khelifi, F.; Zighmi, K.; Hamed, Y. Application of the analytic hierarchy process to weight the criteria used to determine the Water Quality Index of groundwater in the northeastern basin of the Sidi Bouzid region, Central Tunisia. Euro-Mediterr. J. Environ. Integr. 2020, 5, 19. [Google Scholar] [CrossRef]
- Valiente, N.; Gil-Márquez, J.M.; Gómez-Alday, J.J.; Andreo, B. Unraveling groundwater functioning and nitrate attenuation in evaporitic karst systems from southern Spain: An isotopic approach. Appl. Geochem. 2020, 123, 104820. [Google Scholar] [CrossRef]
- World Health Organization’s (WHO). Guidelines for Drinking-Water Quality: Fourth Edition Incorporating the First and second Addenda; WHO: Geneva, Switzerland, 2022; p. 614. ISBN 978-92-4-004506-4. [Google Scholar]
- Razzagh, S.; Nadiri, A.A.; Khatibi, R.; Sadeghfam, S.; Senapathi, V.; Sekar, S. An investigation to human health risks from multiple contaminants and multiple origins by introducing ‘Total Information Management’. Environ. Sci. Pollut. Res. 2021, 28, 18702–18724. [Google Scholar] [CrossRef] [PubMed]
- Ncibi, K.; Mosbahi, M.; Gaaloul, N. Assessment of groundwater risk to Plio-quaternary aquifer’s contamination: Semi-arid climate case (central Tunisia). Desalin. Water Treat. 2018, 124, 211–222. [Google Scholar] [CrossRef]
- Ncibi, K.; Hadji, R.; Hajji, S.; Besser, H.; Hajlaoui, H.; Hamad, A.; Mokadem, N.; Ben Saad, A.; Hamdi, M.; Hamed, Y. Spatial variation of groundwater vulnerability to nitrate pollution under excessive fertilization using Index Overlay Method in Central Tunisia. Irrig. Drain. 2021, 70, 1209–1226. [Google Scholar] [CrossRef]
- Yangui, H.; Zouari, K.; Trabelsi, R. Recharge mode and mineralization of groundwater in a semi-arid region: Sidi Bouzid plain (central Tunisia). Environ. Earth Sci. 2011, 63, 969–979. [Google Scholar] [CrossRef]
- Petelet-Giraud, E.; Baran, N.; Vergnaud-Ayraud, V.; Portal, A.; Michel, C.; Joulian, C.; Lucassou, F. Elucidating heterogeneous nitrate contamination in a small basement aquifer. A multidisciplinary approach: NO3 isotopes, CFCs-SF6, microbiological activity, geophysics and hydrogeology. J. Contam. Hydrol. 2021, 241, 103813. [Google Scholar] [CrossRef]
- Busico, G.; Cuoco, E.; Kazakis, N.; Colombani, N.; Mastrocicco, M.; Tedesco, D.; Voudouris, K. Multivariate statistical analysis to characterize/discriminate between anthropogenic and geogenic trace elements occurrence in the Campania Plain, Southern Italy. Environ. Pollut. 2018, 234, 260–269. [Google Scholar] [CrossRef]
- Hosono, T.; Tokunaga, T.; Kagabu, M.; Nakata, H.; Orishikida, T.; Lin, I.T.; Shimada, J. The use of δ15N and δ18O tracers with an understanding of groundwater flow dynamics for evaluating the origins and attenuation mechanisms of nitrate pollution. Water Res. 2013, 47, 2661–2675. [Google Scholar] [CrossRef]
- Xue, Y.; Song, J.; Zhang, Y.; Kong, F.; Wen, M.; Zhang, G. Nitrate pollution and preliminary source identification of surface water in a semi-arid river basin, using isotopic and hydrochemical approaches. Water 2016, 8, 328. [Google Scholar] [CrossRef]
- Lorette, G.; Sebilo, M.; Buquet, D.; Lastennet, R.; Denis, A.; Peyraube, N.; Charriere, V.; Studer, J.C. Tracing sources and fate of nitrate in multilayered karstic hydrogeological catchments using natural stable isotopic composition (δ15N-NO3− and δ18O-NO3−). Application to the Toulon karst system (Dordogne, France). J. Hydrol. 2022, 610, 127972. [Google Scholar] [CrossRef]
- Xuan, Y.; Liu, G.; Zhang, Y.; Cao, Y. Factor affecting nitrate in a mixed land-use watershed of southern China based on dual nitrate isotopes, sources or transformations? J. Hydrol. 2022, 4, 127220. [Google Scholar] [CrossRef]
- Kendall, C.; Aravena, R. Nitrate Isotopes in Groundwater Systems. In Environmental Tracers in Subsurface Hydrology; Cook, P.G., Herczeg, A.L., Eds.; Springer: Boston, MA, USA, 2000. [Google Scholar] [CrossRef]
- Widory, D.; Kloppmann, W.; Chery, L.; Bonnin, J.; Rochdi, H.; Guinamant, J.L. Nitrate in groundwater: An isotopic multi-tracer approach. J. Contam. Hydrol. 2004, 72, 165–188. [Google Scholar] [CrossRef] [PubMed]
- Levy, Y.; Shapira, R.H.; Chefetz, B.; Kurtzman, D. Modeling nitrate from land surface to wells’ perforations under agricultural land: Success, failure, and future scenarios in a Mediterranean case study. Hydrol. Earth Syst. Sci. 2017, 21, 3811–3825. [Google Scholar] [CrossRef]
- Mastrocicco, M.; Colombani, N.; Castaldelli, G.; Jovanovic, N. Monitoring and modeling nitrate persistence in a shallow aquifer. Water Air Soil Pollut. 2011, 217, 83–93. [Google Scholar] [CrossRef]
- Pulido-Velazquez, M.; Peña-Haro, S.; García-Prats, A.; Mocholi-Almudever, A.F.; Henríquez-Dole, L.; Macian-Sorribes, H.; Lopez-Nicolas, A. Integrated assessment of the impact of climate and land use changes on groundwater quantity and quality in the Mancha Oriental system (Spain). Hydrol. Earth Syst. Sci. 2015, 19, 1677–1693. [Google Scholar] [CrossRef]
- Koh, E.H.; Lee, E.; Kaown, D.; Green, C.T.; Koh, D.C.; Lee, K.K.; Lee, S.H. Comparison of groundwater age models for assessing nitrate loading, transport pathways, and management options in a complex aquifer system. Hydrol. Process. 2018, 32, 923–938. [Google Scholar] [CrossRef]
- Harbaugh, A.W.; Langevin, C.D.; Hughes, J.D.; Niswonger, R.N.; Konikow, L.F. MODFLOW-2005, Version 1.12.00; The U.S. Geological Survey Modular Groundwater Model: U.S. Geological Survey Software Release, 3 February 2017; USGS: Reston, VA, USA, 2017. [CrossRef]
- Pollock, D.W. MODPATH, v7.2.01; A Particle-Tracking Model for MODFLOW: U.S. Geological Survey Software Release, 15 December 2017; USGS: Reston, VA, USA, 2017. [CrossRef]
- Missaoui, R.; Abdelkarim, B.; Ncibi, K.; Hamed, Y.; Choura, A.; Essalami, L. Assessment of Groundwater Vulnerability to Nitrate Contamination Using an Improved Model in the Regueb Basin, Central Tunisia. Water Air Soil Pollut. 2022, 233, 320. [Google Scholar] [CrossRef]
- Hamdi, M.; Louati, D.; Rajouene, M.; Abida, H. Impact of spate irrigation of floodwaters on agricultural drought and groundwater recharge: Case of Sidi Bouzid plain, Central Tunisia. Arab. J. Geosci. 2016, 9, 653. [Google Scholar] [CrossRef]
- Kocsis, L.; Ounis, A.; Baumgartner, C.; Pirkenseer, C.; Harding, I.C.; Adatte, T.; Chaabani, F.; Neili, S.M. Paleocene-Eocene palaeoenvironmental conditions of the main phosphorite deposits (Chouabine Formation) in the Gafsa Basin, Tunisia. J. African Earth Sci. 2014, 100, 586–597. [Google Scholar] [CrossRef]
- National Mining Office. Geological Map of Tunisie; National Mining Office: Tunis, Tunisia, 1987. [Google Scholar]
- Gaiolini, M.; Colombani, N.; Busico, G.; Rama, F.; Mastrocicco, M. Impact of Boundary Conditions Dynamics on Groundwater Budget in the Campania Region (Italy). Water 2022, 14, 2462. [Google Scholar] [CrossRef]
- Graham, R.C.; Hirmas, D.R.; Wood, Y.A.; Amrhein, C. Large near-surface nitrate pools in soils capped by desert pavement in the Mojave Desert, California. Geology 2008, 36, 259–262. [Google Scholar] [CrossRef]
- Chiang, E. Processing Modflow, Version 11.0.3; A Graphical User Interface for MODFLOW, GSFLOW, MODPATH, MT3D, PEST, SEAWAT, and ZoneBudget, Simcore Software, Irvine, California; 4 July 2022. Available online: https://www.simcore.com/wp/processing-modflow-11/ (accessed on 1 December 2022).
- Hallenberger, M.; Reuning, L.; Schoenherr, J. Dedolomitization Potential of Fluids from Gypsum-to-Anhydrite Conversion: Mass Balance Constraints from the Late Permian Zechstein-2-Carbonates in NW Germany. Geofluids 2018, 2018, 1784821. [Google Scholar] [CrossRef]
- Besser, H.; Dhaouadi, L.; Hadji, R.; Hamed, Y.; Jemmali, H. Ecologic and economic perspectives for sustainable irrigated agriculture under arid climate conditions: An analysis based on environmental indicators for southern Tunisia. J. Afr. Earth Sci. 2021, 177, 104134. [Google Scholar] [CrossRef]
- Schoenherr, J.; Reuning, L.; Hallenberger, M.; Lüders, V.; Lemmens, L.; Biehl, B.C.; Lewin, A.; Leupold, M.; Wimmers, K.; Strohmenger, C.J. Dedolomitization: Review and case study of uncommon mesogenetic formation conditions. Earth-Sci. Rev. 2018, 185, 780–805. [Google Scholar] [CrossRef]
- Aschonitis, V.G.; Papamichail, D.; Demertzi, K.; Colombani, N.; Mastrocicco, M.; Ghirardini, A.; Castaldelli, G.; Fano, E.A. High-resolution global grids of revised Priestley–Taylor and Hargreaves–Samani coefficients for assessing ASCE-standardized reference crop evapotranspiration and solar radiation. Earth Syst. Sci. Data 2017, 9, 615–638. [Google Scholar] [CrossRef]
- Doherty, J. PEST-Model-Independent Parameter Estimation, Version 12; Watermark Computing: Corinda, Australia, 2010. Available online: http://www.pesthomepage.org/ (accessed on 1 November 2022).
- Kaplan, D.I.; Bertsch, P.M.; Adriano, D.C.; Miller, W.P. Soil-borne mobile colloids as influenced by water flow and organic carbon. Environ. Sci. Technol. 1993, 27, 1193–1200. [Google Scholar] [CrossRef]
Publisher’s Note: MDPI stays neutral with regard to jurisdictional claims in published maps and institutional affiliations. |
© 2022 by the authors. Licensee MDPI, Basel, Switzerland. This article is an open access article distributed under the terms and conditions of the Creative Commons Attribution (CC BY) license (https://creativecommons.org/licenses/by/4.0/).