Article

The Stability Analysis of Tension-Leg Platforms under Marine Environmental Loads via Altering the Connection Angle of Tension Legs

1
School of Mechanics and Engineering Science, Shanghai University, Shanghai 200444, China
2
Shanghai Institute of Applied Mathematics and Mechanics, Shanghai University, Shanghai 200444, China
*
Author to whom correspondence should be addressed.
Water 2022, 14(3), 283; https://doi.org/10.3390/w14030283
Submission received: 3 December 2021 / Revised: 7 January 2022 / Accepted: 15 January 2022 / Published: 18 January 2022
(This article belongs to the Section Hydraulics and Hydrodynamics)

Abstract

:
Tension-leg platforms have attracted increasing attention due to their smaller motion responses in platform planes among various offshore floating platforms. To better utilize wind energy sources, this paper carried out an improved modelling calculation for tension-leg floating foundations. A comparative study was conducted on the dynamic responses under environmental loading conditions via altering the tension legs’ connection angle. Based on potential flow theory and the Morison formulation, this paper established a complex system of tension-leg platforms under coupled nonlinear loads. After considering tension legs with different angles under the same or different environmental loads, numerical simulations were performed using AQWA for motion responses. Following this, the restraining effect on the platform motion responses and the tension changes of the tension legs are further discussed. The results indicate that compared with the existing tension-leg connection mode, this paper’s model could effectively reduce the dynamic responses in surge and pitch and improve the stability and safety of tension-leg platforms.

1. Introduction

The offshore floating wind turbine was first proposed by William E Heronemus, a professor at the University of Massachusetts Amherst, in 1972 [1]. The continuously broader applications of offshore floating wind turbines are employed in marine engineering, which many scholars have investigated extensively in recent decades. From a practical point of view, mature industrial technology makes structural styles gradually more complicated and diverse. Wind energy from the far seas has the advantage of high continuity and stability and abundant potential energy for wind velocity. Further, offshore floating wind turbines do not occupy land resources and are not susceptible to residents, birds, electromagnetics, and other interference. Low sea level friction contributes to prolonging the life of wind turbines [2]. At present, the research on offshore floating wind turbines has been regarded as a new trend in energy utilization and exploitation [3].
Considering various foundation styles, three types of offshore floating wind turbines, column foundations, semi-submersible foundations, and tension-leg foundations, can be observed. According to the differences between floating platforms, tension-leg platforms (TLP), semi-submersible platforms (Semisub), spar platforms (Spar), and floating production storage offloading (FPSO) are distinguished by design and construction. To provide an important numerical basis for the operation, design, and service life of offshore platforms, Goupee et al. [4] performed model tests on TLPs, Semisubs, and Spars at the Maritime Research Institute Netherlands (MARIN) and compared their advantages and disadvantages. The results showed that a stiffer foundation, such as a TLP, provided a lower bending frequency of the turbine tower than a Spar-buoy or a Semisub. They also indicate that steady wind substantially increased the pitch damping of Spar-buoys and Semisubs. Keeping the wind load constant, Tang et al. [5] studied the influence of wave load on the dynamic responses of structural foundations in the frequency domain by establishing a three-dimensional (3D) model of a Semisub floating turbine. Gueydon et al. [6] established a scale model of a Semisub and carried out a static water test to analyze its dynamic responses under the action of a single wave load. This model could better exhibit surge behaviour under stable wind conditions, but the results of the combined action of wind and waves did not match. Sethuraman et al. [7] experimentally investigated the Spar’s dynamic responses under the action of regular waves and irregular waves, respectively, which verified the superiority of a new mooring model. Wang et al. [8] set up an experimental model of a TLP floating foundation under marine environmental conditions in the South China Sea and concluded that improving the damping of yaw could suppress its motion. Among the basic floating platform structures, the Spar’s base draft is so large that its centre of gravity is below the centre of buoyancy and has a large restoring force to bring it back to its equilibrium position. The Semisub’s design is relatively simple but greatly affected by load. Due to the TLP’s small motion responses under an environmental load and good stability, this paper selected the TLP as the basic research object.
The studies of floating wind turbines based on theoretical, experimental, and numerical research yielded richness concerning underlying fluid dynamics. Firstly, fluid-structure-interaction (FSI) has been a hot subject for dynamic response research and stability analysis of offshore structures. Moreover, knowledge of this problem can also reveal significant features of hydrodynamics [9]. Anagnostopoulos [10] pointed out the main difficulties of offshore platforms’ dynamic response analyses under extreme wave loadings. Their findings demonstrated that with a correct increase of viscous damping, analyses of fixed offshore structures neglecting relative motion were justified, which provided an essential reference for the follow-up study of the interaction between waves and structures. Choi et al. [11] established a 3D numerical model to study breaking wave impact forces on vertical and inclined piles. They put forward a method based on CFD and the Duhamel integral to reproduce the forces and found that the 3D model could accurately simulate the wave-breaking phenomenon. Meanwhile, scholars have established complex dynamic response equations to study the offshore structures’ dynamic responses. Mercier et al. [12] proposed the basic formula for the force on the platform in the heave direction. Mekha et al. [13] carried out a computational analysis that assumed the tension leg was a massless spring model. They discussed the effect of calculating the wave kinematics up to the mean water level or the actual free surface by using various extrapolation or stretching techniques. Taking the coupling effect of the platform and tension legs into account, Kim et al. [14] studied the nonlinear response caused by nonlinear environmental loads and the interaction between the platform and cable reinforcements. On a theoretical basis, Jain et al. [15] proposed a deterministic first-order wave force to analyze the dynamic responses of TLPs and conducted a comprehensive campaign to characterize the nonlinear tension variation and hydrodynamic influence with the coupling of six degrees of freedom (6-DoFs). They found that large fluctuations in the tension of the TLP’s tethers could be due to a possible resonance effect on heave frequency since the TLP’s heave period was normally close to frequently occurring wave periods. Due to the offshore floating wind turbine being a complex system under the interaction of nonlinear loads, Zeng et al. [16] demonstrated the influence of various nonlinear factors on the dynamic responses of TLPs. They derived a nonlinear motion equation with six DoFs and found that slack was sensitive to the mass of the TLP and obtained the critical curved surfaces for the increase of mass. Horoub et al. [17] presented a triangle mooring line configuration and investigated the effect of changing the mooring line stiffness and pretension on the dynamic behaviour of the TLP. Further, increasing the mooring line stiffness or decreasing the pretension reduced the amplitudes of the platform displacement, velocity, and acceleration.
Apart from the investigations mentioned above, there have been numerical studies on floating wind turbines. Pakozdi et al. [18] used the commercial CFD tool Star-CCM+ to determine the feasibility of numerical reconstruction of a long-crested breaking wave and its impact on the structure. Their model successfully solved the potential flow equations with a fully nonlinear free surface condition using the linear finite element method (FEM) and mixed Eulerian–Lagrangian time updating. Xiang et al. [19] adopted an arbitrary Lagrangian–Eulerian (ALE) numerical method with a multi-phase compressible formulation to develop three-dimensional hydrodynamic models, and the ALE method captured the wave profiles with reasonable accuracy. Pan et al. [20] investigated the interaction between large waves and floating offshore structures using the weakly compressible smoothed particle hydrodynamics (SPH) method. The SPH framework implemented was able to reproduce the experimental results accurately. Furthermore, Canelas et al. [21] presented a unified discretization of rigid solids and fluids that allowed for detailed and resolved simulations of the fluid–solid phases within the SPH framework, and they coupled DEM and SPH methodologies to resolve solid–fluid interaction in a broad range of scales.
Meanwhile, commercial software based on numerical methods, such as FAST, ADAMS, SIMO, and SESAM, was gradually developed. This software mainly covers the pneumatic module (BEM/GDW + DS), hydrodynamic module (Airy + ME), and mooring module (QSCE, UDFD, and FEM) [22]. The National Renewable Energy Laboratory (NREL) developed the time–domain coupling program, FAST, for relative analysis in the aerodynamic module, AeroDyn. Shen et al. [23] used FAST to simulate the aerodynamic–hydrodynamic tension-leg coupling dynamic responses of TLPs and reported that the high-frequency response had a remarkable influence on the motions of the platform. Li et al. [24] used MATLAB to develop the aerodynamic–hydrodynamic coupling module program to study the responses of the semi-submersible floating wind turbine. Uzunoglu and Soares [25] designed a hydrodynamics calculation system for TLPs to quickly test new concepts with high accuracy, demonstrated through an example tension leg platform. The process included mass matrix estimation, hydrostatic calculation, mooring system design, and dynamic analysis, and used solvers of potential flow to obtain wave-induced responses in the frequency domain and evaluate the platform’s performance. Cheng et al. [26] established a fully coupled aerodynamic model of a floating offshore wind turbine using OpenFOAM. They studied the coupled responses of an NREL-5 MW wind turbine installed on a semi-submersible platform. The aerodynamic responses, including unsteady aerodynamic force and thrust and hydrodynamic responses such as 6-DoF motions and mooring tensions of the floating platform, could be obtained by numerical simulations. Mohammad et al. [27] conceptually discussed the high nonlinearity of TLPs and obtained the dynamic responses of TLPs in regular waves via MATLAB and the improved Euler method (MEM). Luo et al. [28] conducted a wave flume test to simulate a freak wave on the platform and measured the wave shape evolution during impact, the impact pressure of waves on the platform deck, and the platform’s motion responses and tethered forces to systematically discuss the wave mechanics and structural responses of the platform. Saeed et al. [29] proposed the Takagi–Sugeno (T-S) model as the system controller. They successfully used linear matrix inequalities (LMI) to obtain the feedback efficiency required by the fuzzy controller, and the system was simulated in the Simulink-MATLAB environment to make the controller design much more straightforward. The experimental test of a TLP floating wind turbine at 1:60 scale in wind and waves with a pitch-regulated 10 MW wind turbine was presented by Madsen et al. [30]. The tested floating wind turbine was in three different control configurations, with two closed-loop controllers and one open-loop controller. Chow et al. [31] validated an experiment on a tension-leg platform with the strongly coupled and partitioned 6-DoF rigid body motion solver (Chow and Ng, 2016). After determining the tension legs stiffness, damping coefficients, and other unknown variables by decay tests, the system ran with the coupled fluid-motion numerical solver, which accurately estimated the natural frequencies and damping ratios. Yang et al. [32] investigated the wind–wave coupling effects on the fatigue damage of tendons that connected multiple bodies of a novel floating platform (TELWIND) supporting a 10 MW wind turbine. By incorporating AeroDyn with AQWA through a user-defined dynamic library link (DLL), they carried out simulations of the floating wind turbine subjected to wind, wave, and current loads. Compared with results calculated by FAST, the accuracy of the AQWA–AeroDyn coupling framework in predicting coupled responses of the floating wind turbine was further tested and verified. An efficient pole residue method operating in the Laplace domain to compute transient responses of floating structures to irregular waves was developed by Sun et al. [33]. The numerical results showed that the proposed method was more efficient and accurate than the traditional time-domain method. Dai et al. [34] numerically attempted to integrate the input wind, blade (wind turbine rotor), shaft, generator, converter, grid, and controller models in the Simulink environment pitch and floating platform models. The simulation results could be used to assess the floating wind turbines’ running load and motion characteristics.
To optimize the performance of TLPs, great strides have been made in understanding their structural innovation. Rao et al. [35] proposed a tension-leg platform with a tension-base and analyzed its hydrodynamic performance. The results showed that it could reduce the platform’s in-plane motion responses by connecting the base in series on the tension legs. Adam et al. [36] proposed a new type of TLP, the GICON®-Tension-Leg Platform (TLP), and conducted a model test in the MARIN Pool in the Netherlands. Han et al. [37] proposed an underwater tension-leg platform (STLP) for an offshore wind turbine in medium water depth (70~150 m). During the operation stage, the platform was submerged in water with a small surface area, which typically improved the hydrodynamic performance of the platform. Ma et al. [38] studied the multi-body dynamic coupling responses of a new-type buoy TLP platform by using AQWA and experiments. Ren et al. [39] brought forward a novel concept by combining a tension-leg platform (TLP) type floating wind turbine and a heave-type wave energy converter, i.e., the TLP-WT-WEC-Combination (TWWC) system. By the time-domain numerical simulations and scale model tests (1:50), the dynamic responses of the TWWC system under operational sea cases (in the South China Sea) were also observed.
During the past few decades, scholars primarily focused on the position and size of the buoy when analyzing the dynamic responses of the new-type tension-leg platform. It is noteworthy that as an essential part of the platform, the mooring’s pretension was paid more attention. Less research concentrated on the performance optimization that different connection forms might provide. Furthermore, little work has been devoted to measuring the effect of the mooring connection angle, and its influence on the dynamic responses of the platform remains to be studied. Based on potential flow theory combined with the finite element software, AQWA, the dynamic responses of the TLP are simulated by changing the mooring connection angle under the same environmental loads and initial conditions. This paper only considers the general situation of the wave action direction and ignores the influence of the included angle between the wave and the normal structure on the platform [40,41]. This paper aims to provide a theoretical reference for the selection and design of the foundation of floating wind turbines in the field of practical engineering.
The structure of this paper is organized as follows. The simulation model and relative calculation equations are given in Section 2. In Section 3, the influence of the mooring connection angle and performance of tendon tension under different combinations of environmental loads are further discussed. Finally, a few concluding remarks are listed in Section 4.

2. Model Establishment and Calculation

Due to its light weight, the tension-leg platform does not require an active ballast. By presetting the tension legs’ tension and connecting the tension legs to the seabed’s fixed foundation, the platform’s movements outside the plane are limited, including roll, pitch, and heave. These smaller dynamic responses are achieved in waves, thus increasing the stability of the turbine [42]. This paper takes an ISSC TLP, a typical four-column platform, as the primary research object.

2.1. Model Parameters

As mentioned above, the present paper systematically studies the TLP foundation of an offshore floating wind turbine. The foundation is composed of a floating platform and eight tension legs. Additionally, the floating platform consists of four vertical circular columns and four horizontal floating boxes with rectangular cross-sections. The main design parameters are presented in Table 1. The natural frequencies are calculated according to the un-damped linear equation for free motion in the frequency domain (as shown in Table 2).
The tension legs are distributed on four pillars, as shown in Figure 1. The eight tension legs are numbered from L1 to L8, counterclockwise, starting from the lower-left pillar. The standard ISSC TLP tendons are vertically anchored to the sea bed with a length of 415 m. Moreover, it is assumed that the surfaces of all columns and mooring lines are smooth.

2.2. Environment Loads

2.2.1. Hydrodynamic Load

Aimed at calculating the wave forces of large floating bodies, potential flow theory is commonly used in relative analysis [45]. The incompressible fluid without rotation is considered, and the existing velocity potential function satisfies the Laplace equation:
2 Φ = 0
Considering the diffraction forces generated by the interaction between waves and the structure and the radiation forces generated by the oscillations of the structure, four types of boundary conditions are expressed:
2 Φ t 2 + g Φ z z = 0 = 0
Φ z z = d = 0
Φ n S ( x , y , z ) = u n
where z represents the depth from the sea surface, d represents the seabed depth, and un represents the average movement velocity of a point on the wet object’s surface. The above boundary conditions include the free surface, seabed, wet surface, and radiation action. Assuming that ΦI, ΦD, and ΦR denote the incident potential, diffraction potential, and radiation potential, respectively, the total velocity potential of the flow field is expressed as:
Φ = Φ I + Φ D + Φ R
Next, we introduce the velocity potential function of the incident wave in linear wave theory, and ΦI can be rewritten in the form:
Φ I = i g a ω cosh k ( z + d ) cosh k d e i k x
where g represents the gravitational acceleration, ω represents the natural circular frequency, k is the wave number, d is the water depth, and a is the wave surface amplitude.
Next, we can obtain the governing equations and fixed solutions of first-order diffraction and radiation problems. Furthermore, the combined equations of wave forces and wave moments acting on the structure are obtained using the linearized Bernoulli equation. The wave force (Fhyd) consists of the hydrostatic component (FHS) and the radiation component (FR). The additional mass and damping coefficient can be calculated, and the wave excitation loads are composed of Froude-Krylov force, wave diffraction force, and moment, i.e.,
p = ρ g z = ρ Φ t
F j ( t ) = ρ g S z n j d s ρ Re j = 1 6 i ω ζ j e i ω t S ϕ j n j d s ρ Re i ω e i ω t S ( ϕ I + ϕ D ) n j d s
where Fj(t) denotes the wave load of the j-th degree of freedom, and ζj denotes the displacement of the j-th degree of freedom relative to the origin in the coordinate axis direction. ρ is the seawater density, generally 1025 kg·m−3. The hydrostatic restoring force is expressed as ρ g S z n j d s , the radiation force is ρ Re j = 1 6 i ω ζ j e i ω t S ϕ j n j d s , where ϕ j is the velocity potential caused by the j-th degree of freedom and nj is the introduced vector. The radiation velocity potential can be expressed as ϕ R = j = 1 6 ζ j ϕ j , and the wave-induced force is expressed as ρ Re i ω e i ω t S ( ϕ I + ϕ D ) n j d s , where ϕ I and ϕ D are the incident wave velocity potential and diffraction wave velocity potential, respectively.

2.2.2. Wind Load

Referring to the offshore floating platform specification, the wind load can be represented as the thrust and overturning moment acting on the wind turbine. The NPD wind spectrum is adopted for wind load calculation to simulate random wind load, and its spectrum function is expressed as follows [46,47]:
S N P D f = 320 U 10 10 2 z 10 0.45 / 1 + t 0.468 3.561
t = 172 f z 10 2 / 3 U 10 10 0.75
where S N P D f represents the fluctuating wind frequency spectrum, f is the fluctuating frequency, U10 is the hourly average wind speed at 10 m above the sea level, and z is the height from sea level. When the wind velocity at z on sea level is u(z,t), the wave equation can be expressed as:
τ ( t ) = U 0 + i = 1 K 2 S τ ( f i ) Δ f cos ( 2 π f i t + θ i )
where K is the number of defined intervals (the corresponding range is 50~100), Δ f is the equal spacing frequency interval, fi is the line frequency component, and θ i is the random phase angle with a uniform distribution. The random wind load can be simulated by bringing Equation (9) into the instantaneous wind velocity formula. At height z above sea level, the average wind velocity under the condition of average time ts (ts = 3600 s) is expressed as:
u ( z , t ) = U 0 1 + 0.0573 1 + 0.15 U 0 × ln z 10 1 0.41 I u ( z ) ln t t 0
where Iu(z) is the horizontal turbulence intensity, expressed as I u ( z ) = 0.06 1 + 0.043 U 0 / z 10 0.22 . The wind force at sea level z can be obtained by bringing the above-average wind velocity into the following equation:
F = 1 2 ρ a C F A × ( u ( z , t ) ) 2
where ρ a is the air density, generally 1.205 kg/m3. CF is the wind coefficient, generally taken as:
C F = 0.613 m n C s C h A m
where Cs is the shape coefficient of the wind structure (the circular cylinder takes the value of 0.5). Ch is the height coefficient above sea level (1.00 for 0~15.3 m and 1.10 for 15.3~30.5 m). Am is the projection of the structure m in the wind direction.

2.2.3. Current Load

The velocity of sea current particles on the seabed is almost zero. The change of the current sea load due to the depth and the drag force on the structure should be considered. According to API and the literature [48,49,50], the current velocity and current loads can be expressed as:
V c ( z ) = V w ( 0 ) z d + V t ( 0 ) z d 1 / 7
F c = 1 2 ρ C D A c V c ( z ) 2
where Vc(z) is the current velocity at height z, Vw(0) is the wind-driven current velocity at the sea surface, Vt(0) is the current velocity at the sea surface, and CD is the resistance coefficient, which is related to the Reynolds number, wave period parameter KC, cylinder surface roughness, and wave phase. According to API standards, CD takes the value of 0.6–1.0. Due to the smooth surface of the cylinder, CD is 0.65. Ac is the projected area on the vertical plane between the structure and the current, and Vc is the velocity of the current sea particle.

2.3. Mooring Load

The published literature shows that tension legs are mainly subjected to external environmental loads and axial force. Due to the characteristics of tension legs, they can be simplified to a discrete beam element model. The element stiffness matrix and mass matrix can be deduced according to the principle of minimum potential energy. Therefore, the dynamic equation of the tension leg can be expressed as follows:
M x ¨ + K x = F e + F z
where Fe is the external loads, and Fz is the axial force.
According to the modification of Morison’s equation on the inclined column, the wave force vector on the tension legs can be expressed as:
f = 1 2 C D ρ D U n U n + C M ρ π D 2 4 U ˙ n
U n = e × ( u × e )
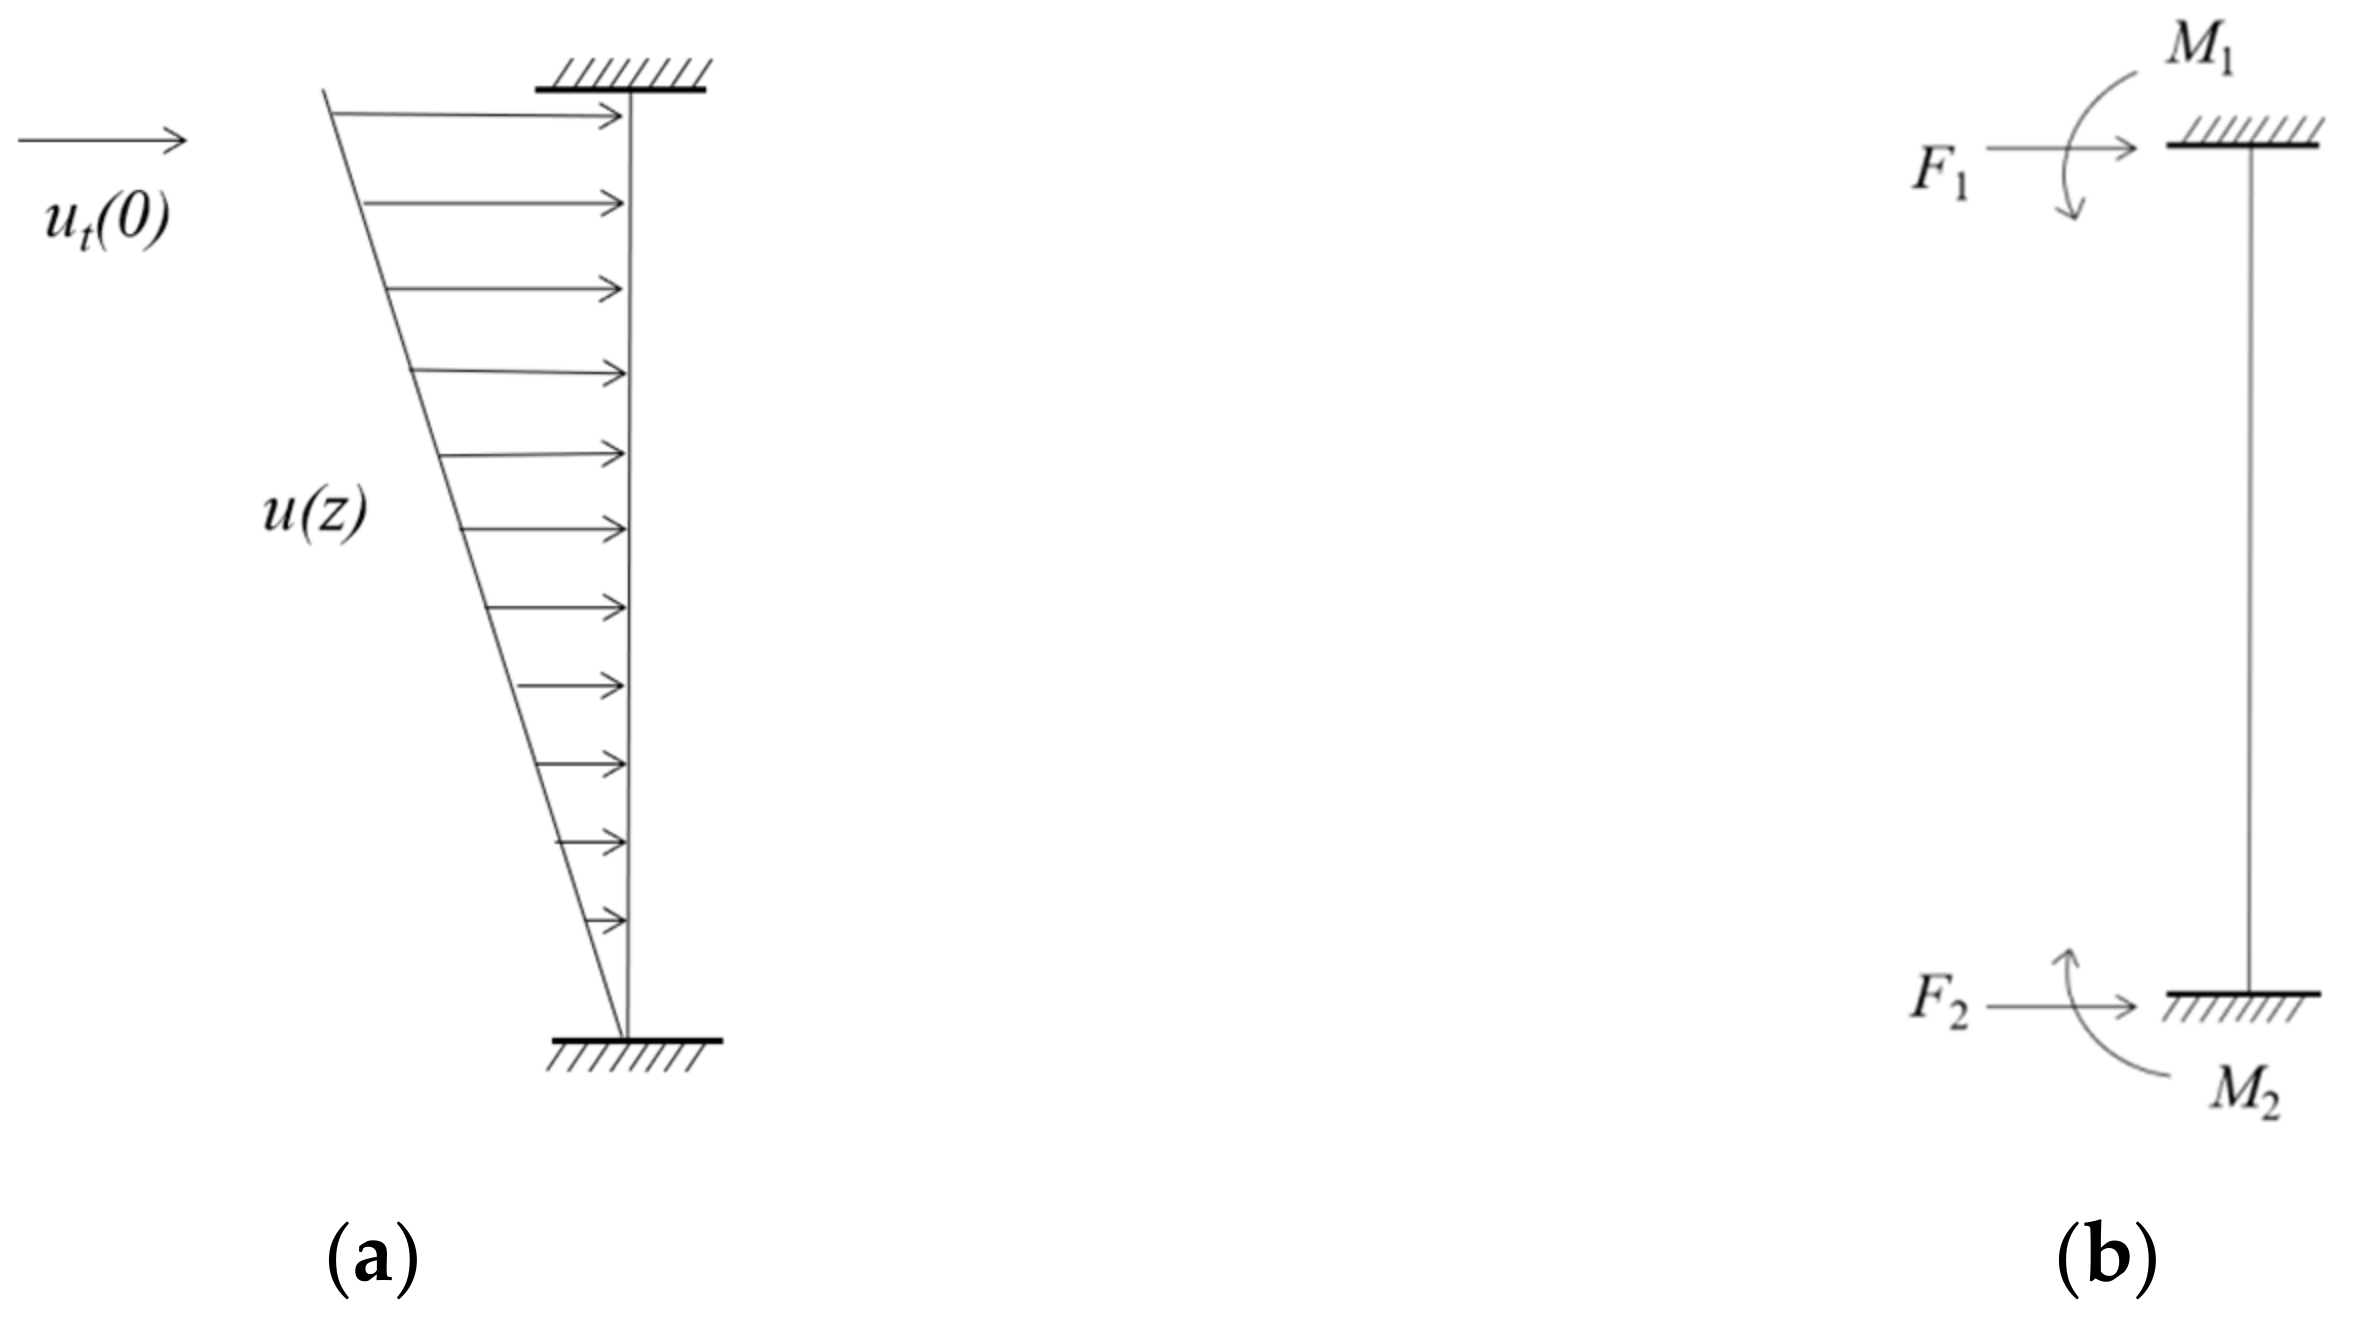
Assuming that the tension leg is affected by gradient water flow, it can be expressed as:
u ( z ) = u t ( 0 ) d × z + u t ( 0 )
where z is the height from the water surface (negative value), d is the length of the tension legs, and ut (0) is the flow velocity at the top of the tension regression. It can be seen that the flow velocity gradually decreases with the increased depth. The action on the tension-leg can be simplified to an equivalent nodal load, as shown in Figure 2.
If the tension-leg is divided into n sections, Li0 is the initial length of the i section, and L is the length of the tension leg. The axial force can be expressed as follows:
F i = E A L i 0 ( L i L i 0 ) × L i L i
L i = ( x i x i 1 ) 2 + ( y i y i 1 ) 2 + L n 2

2.4. Dynamic Equation of the Platform

According to the environmental loads described in the above subsection, the complex coupled nonlinear motion equation of the TLP can be expressed as:
M + A i j υ ¨ i + C V + C r a d + C m υ ˙ i + K W + K m υ i = F w i n d + F h y d + F c u r r e n t + n = 1 8 F L n
where M is the mass matrix, and Aij is the additional mass matrix of the floating platform. Cv is the viscous damping matrix, Crad is the radiation damping matrix, and Cm is the mooring damping matrix. Kw is the static water recovery force stiffness matrix, and Km is the mooring system stiffness matrix. νi (i = 6) is the displacement of the structure corresponding to the coordinate. Fwind, Fhyd, Fcurrent, and FLn are the wind load, hydrodynamic load, current load, and mooring force vector provided by the mooring Ln(n = 1, 2, 3...8), respectively. The calculation of the mass matrix and additional mass matrix is referred to in the literature [51], and the total stiffness matrix [52] is expressed as:
K = K 11 z G T K 11 K 22 z G T K 22 K 32 K 33 K 34 K 35 K 36 z G T K 22 K 44 + z G T 2 K 22 z G T K 11 K 55 + z G T 2 K 11 K 66
where K 11 = K 22 = n = 1 N T n L , K 33 = ρ g A w l + E A L , K 44 = ρ g I w l x + U z B Q z G n = 1 N T n z T + E I x L , K 55 = ρ g I w l y + U z B Q z G n = 1 N T n z T + E I y L , T n = U Q , z G T = z G z T . A is the total cross-section area, Awl is the water plane area, Iwlx and Iwly are its moments of inertia about the x- and y-axis, U is the buoyancy, Q is the platform weight, zB are the buoyancy coordinates, zG are the gravity centre coordinates, and L is the tension leg’s length.
The damping matrix can be simplified into the form related to the mass matrix and stiffness matrix:
K λ M = 0
C = 2 ξ i Φ λ 1 λ 2 λ 3 λ 4 λ 5 λ 6 Φ T M + A
where λ i = ω i 2 , [Φ] is the matrix of mode shape, ωi is the natural frequency, mi is modal mass, and ξi = 0.05. The calculations of viscous damping, mooring damping, and wave drift damping can be found in [53,54,55].
The dynamic equation of the tension leg is coupled with the dynamic equation of the floating platform. The high-order Runge–Kutta method is used to solve the above equations.

2.5. Finite Element Model of the Platform

In this paper, various loads on floating tension-leg platforms, including wind load, wave load, and current sea load, were modelled by employing ANSYS 16.0-AQWA. The coordinate system and the degrees of freedom in six directions are shown in Figure 3. The angle between the tension leg and the vertical direction was defined as α (as shown in Figure 1c), and the tension legs were numbered L1–L8 (as mentioned in Section 2.1). The L1, L3, L5, and L7 tension legs remained unchanged, and the L2, L4, L6, and L8 tension legs’ vertical direction were changed by altering α.
The whole domain description of the platform is illustrated in Figure 4, along with meshing details. The surface element model, excluding the tension legs, was meshed, and the mesh size was defined as 2 m, with 20,940 nodes and 21,032 elements.

3. Results and Discussion

3.1. Comparative Analysis of PSD

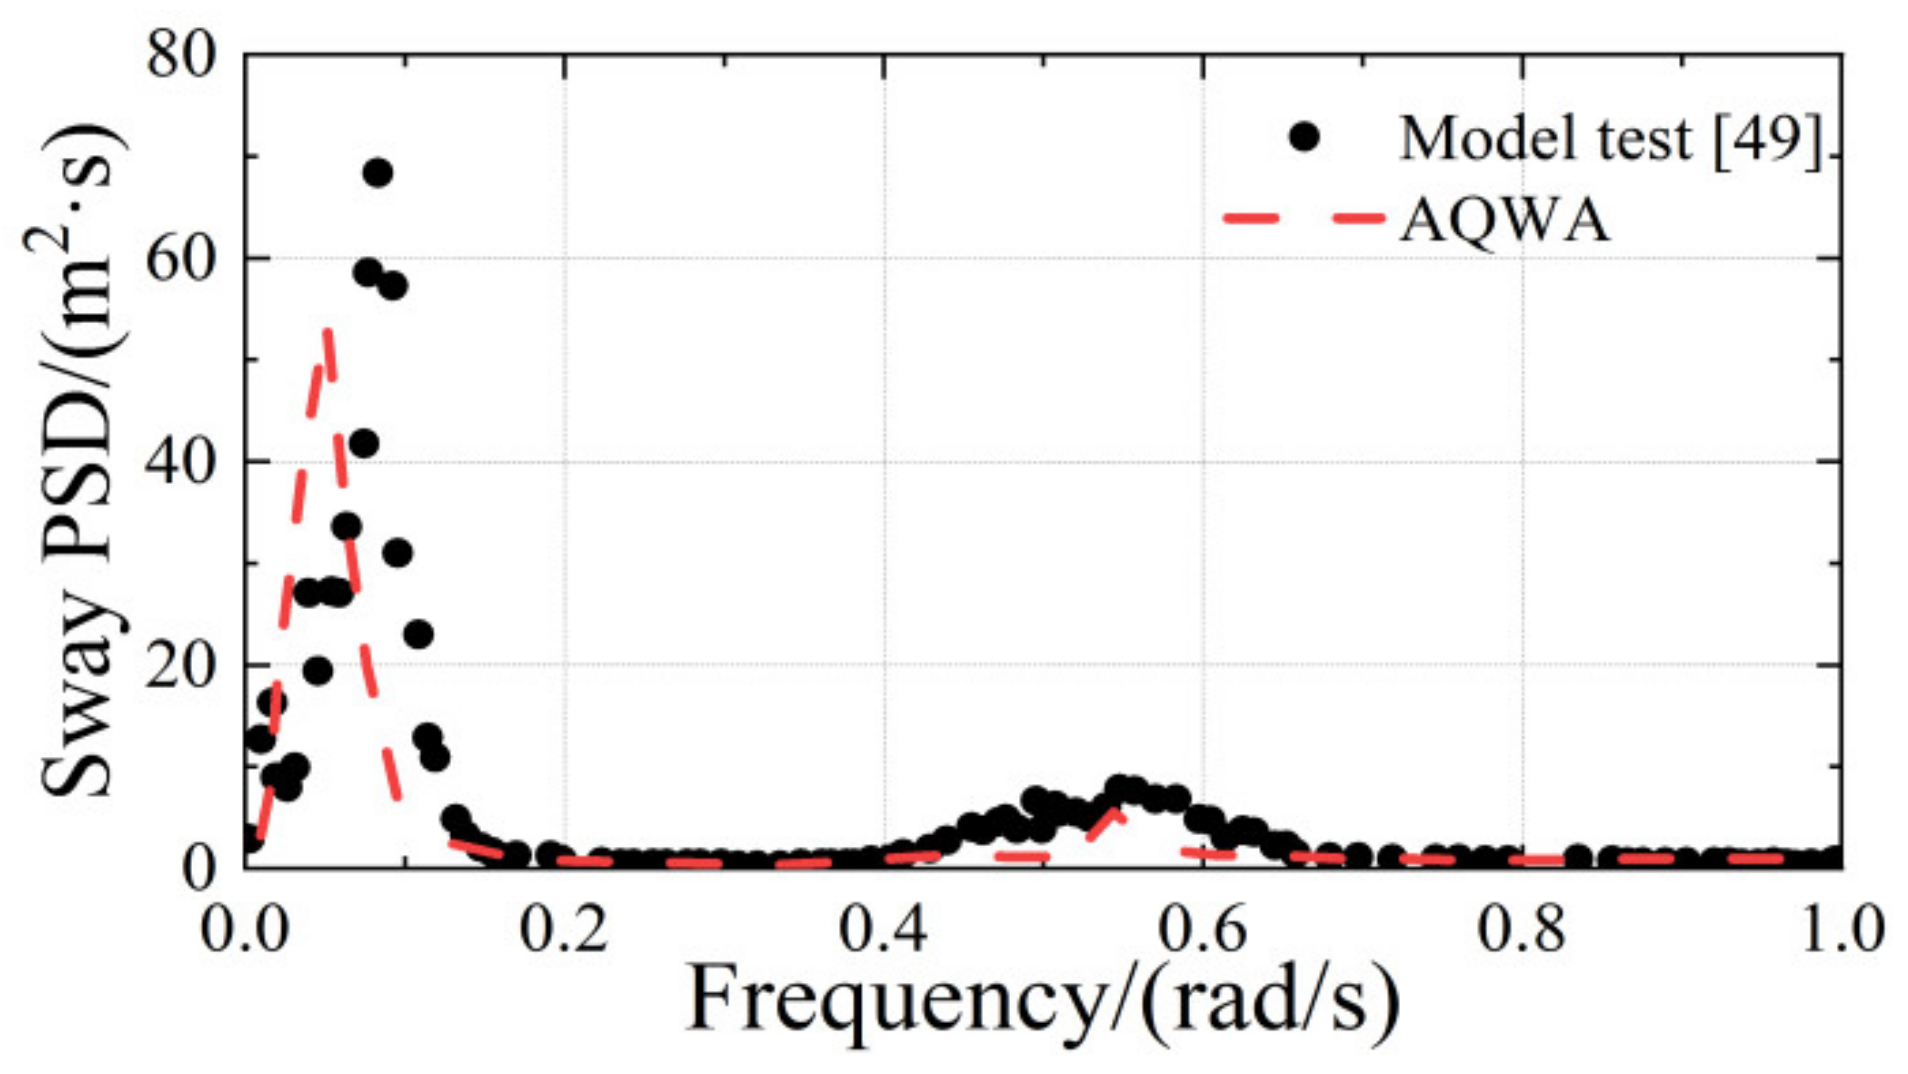
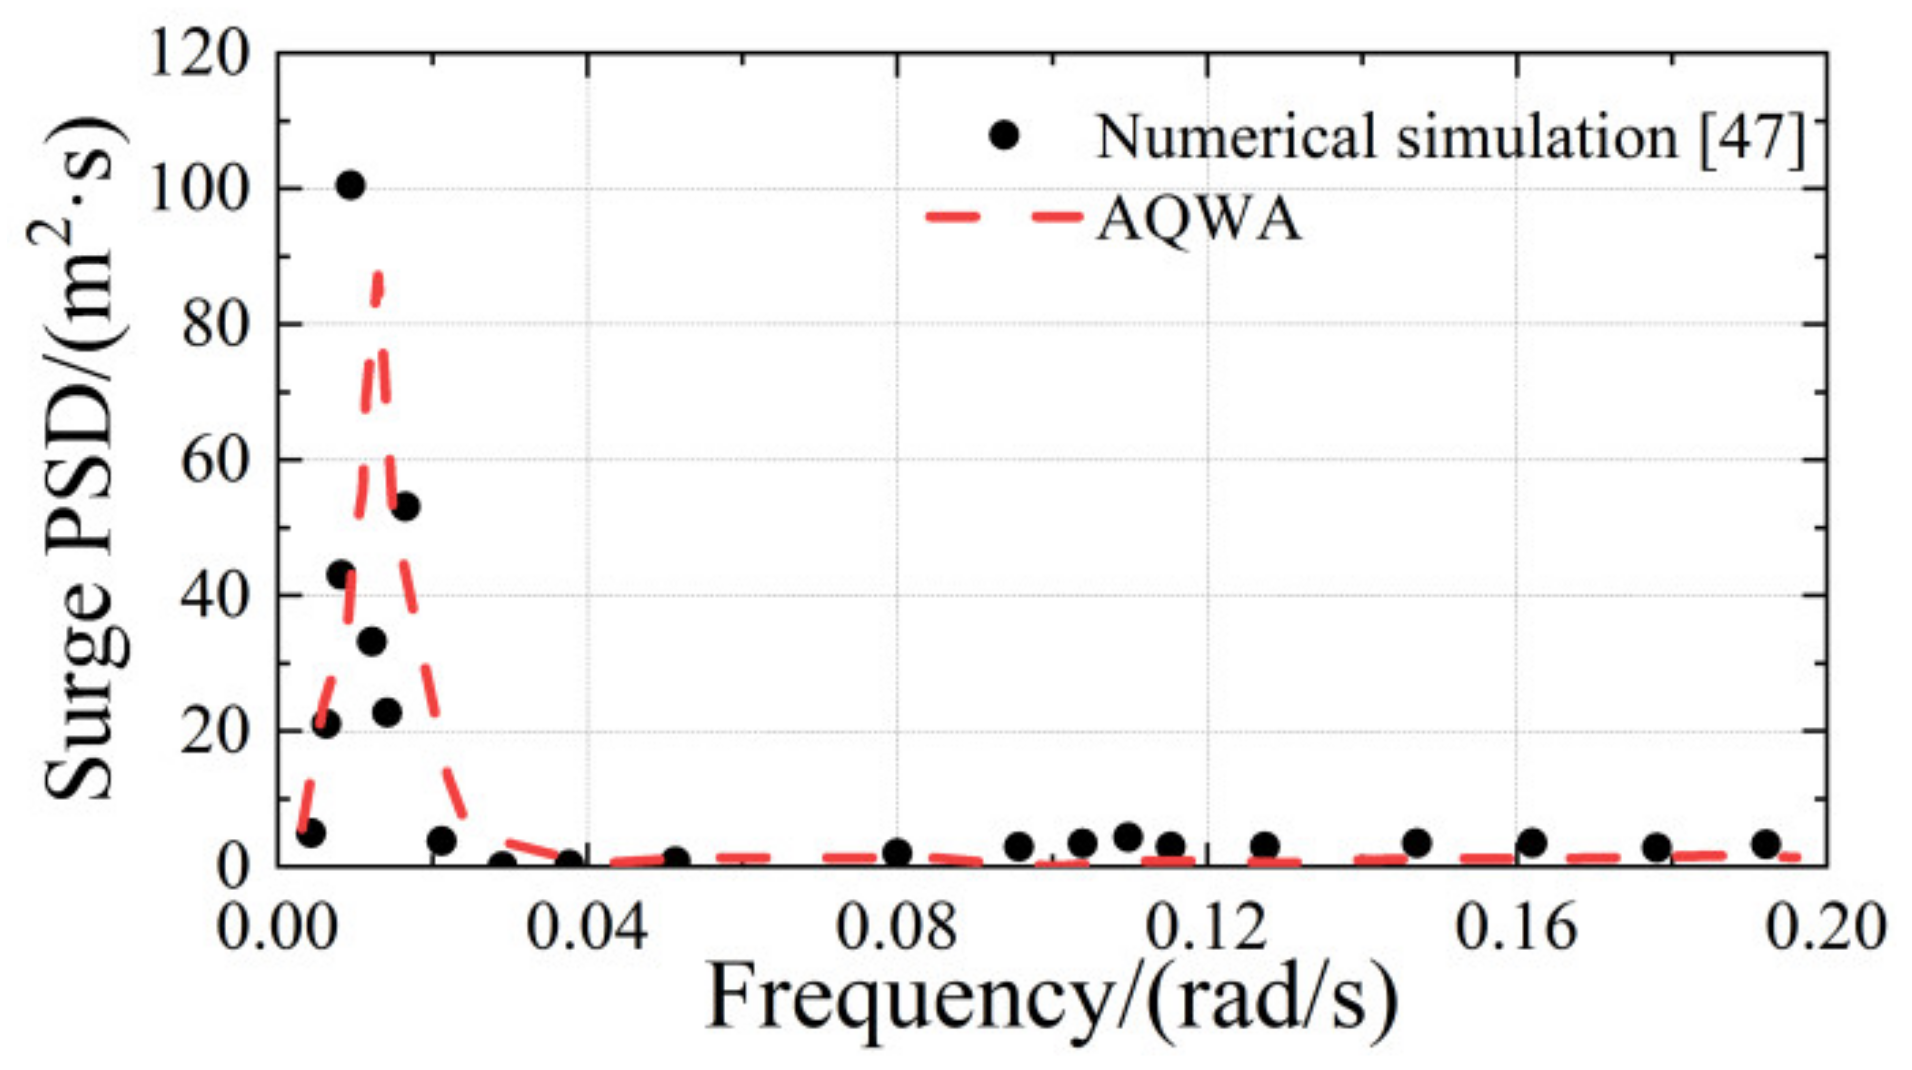
The floating TLP and tension legs have 6-DoF motion responses under environmental loads. The present numerical simulations were carried out using AQWA. The motion responses, including surge and sway under the same environmental loads, were compared to the references [47,56]. The square TLP in the references has four square columns and eight tendons. Notably, despite a few differences in geometry, the natural frequency of the AQWA model is close to that in the literature. In one study, the 1:40 scaling factor model test was reported by Gu et al. [56]. The significant height was 3 m and the significant period was 8.3 s. As shown in Figure 5, the model’s sway PSD was consistent with the trend in the literature. In a second study, another validation was conducted to compare the AQWA model and the numerical simulation carried out by Gu et al. [47]. The average current velocities at 0 m and 40 m depths are 1.08 m/s and 0.96 m/s, respectively. Furthermore, the average wind velocity at 10 m height is 12.6 m/s. With the increasing frequency, the surge PSD was basically the same as the previous results (Figure 6). However, the difference at the peak can be clearly captured. This may result from the discreteness of experimental results and the columns’ different shapes, masses, and so on. In general, the agreement showed the reliability of the present model and method in the simulation of the motion responses.

3.2. Environmental Conditions

For the floating platform, to investigate the influence of the tension legs’ connection angle on the response values of various degrees of freedom under the same working condition and discuss the change of tension legs’ tension under different working conditions, this paper defined several operating cases, including single-wave load, single-wind load, single-current load, and wind-wave-current load.
The JONSWAP spectrum was selected for all wave spectra with a wave angle of 45°, which can be expressed as:
S η ( ω ) = α * H s 2 ω m 4 ω 5 exp 5 4 ω m ω 4 γ exp ( ω ω m ) 2 2 σ 2 ω m 2
ω m = 22 g U 10 x ˜ 0.33
α * = 0.0624 0.230 + 0.0336 γ + 0.185 ( 1.9 + γ ) 1
where Hs is one-third of the significant wave height, ωm is the spectral peak frequency, x ˜ is the fetch length, and γ is the spectral peak factor.
After calculation, Tm presenting the spectral peak period can be calculated as:
T m = 2 π ω m × 1.086 1.408
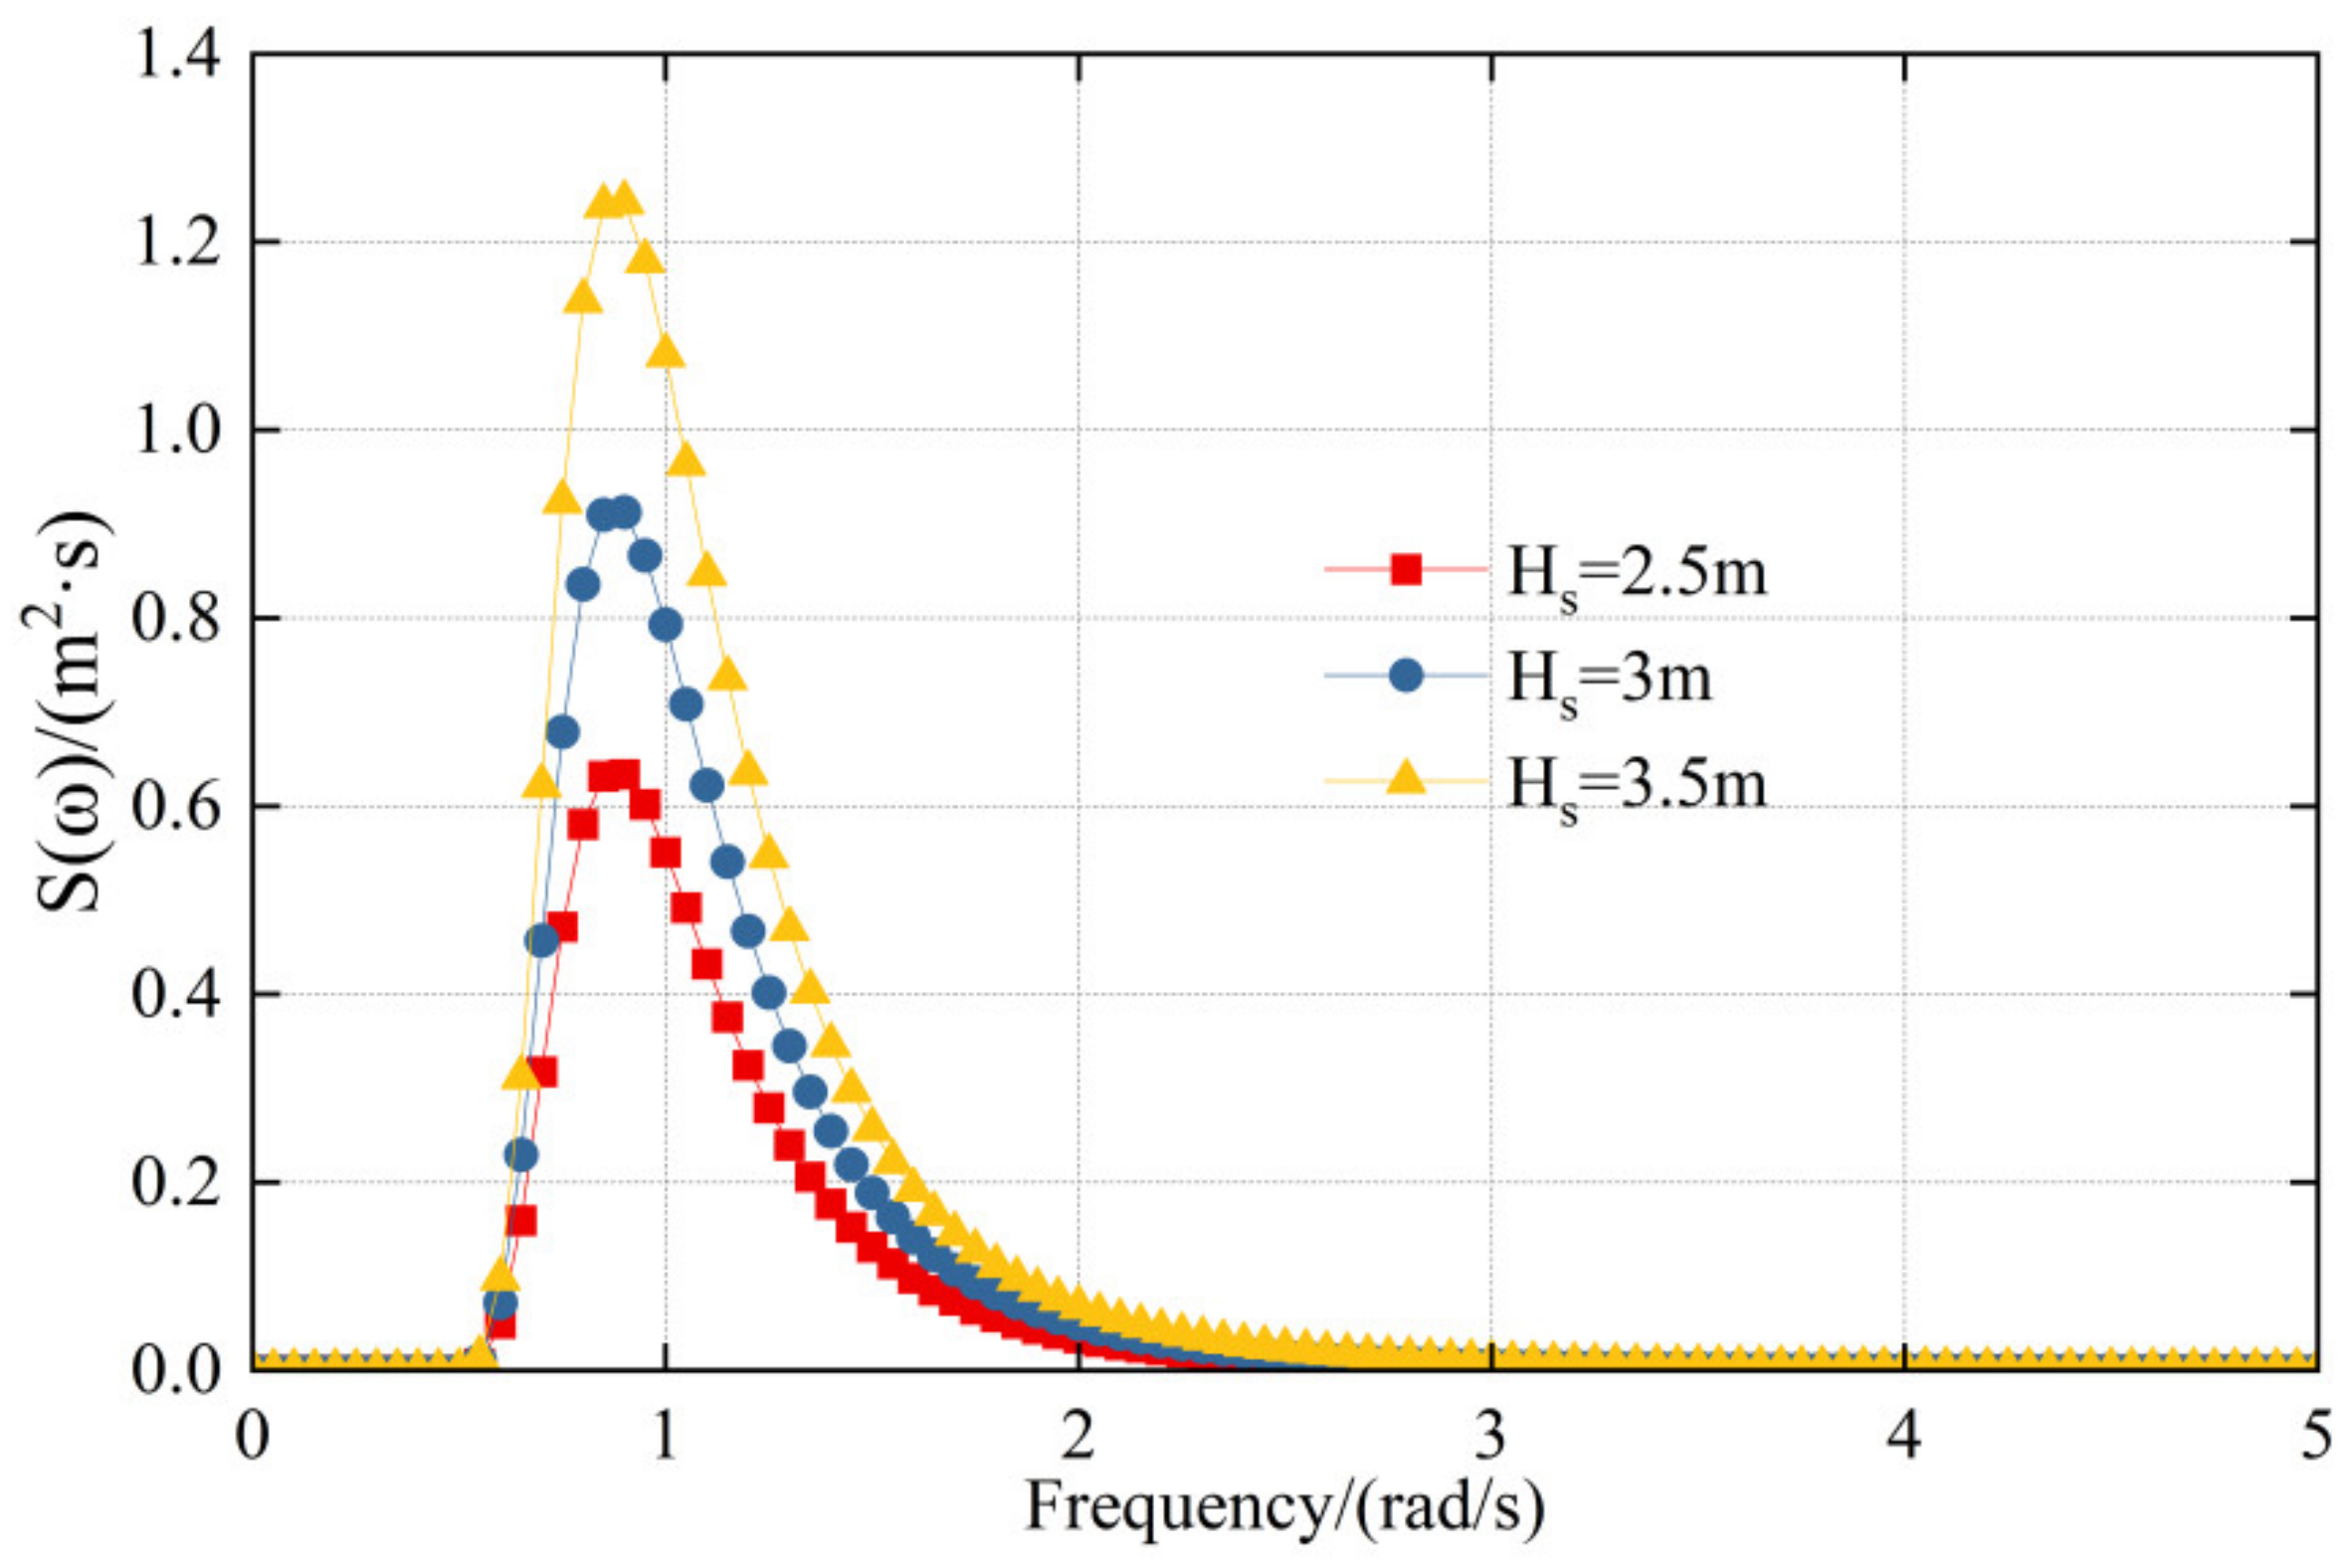
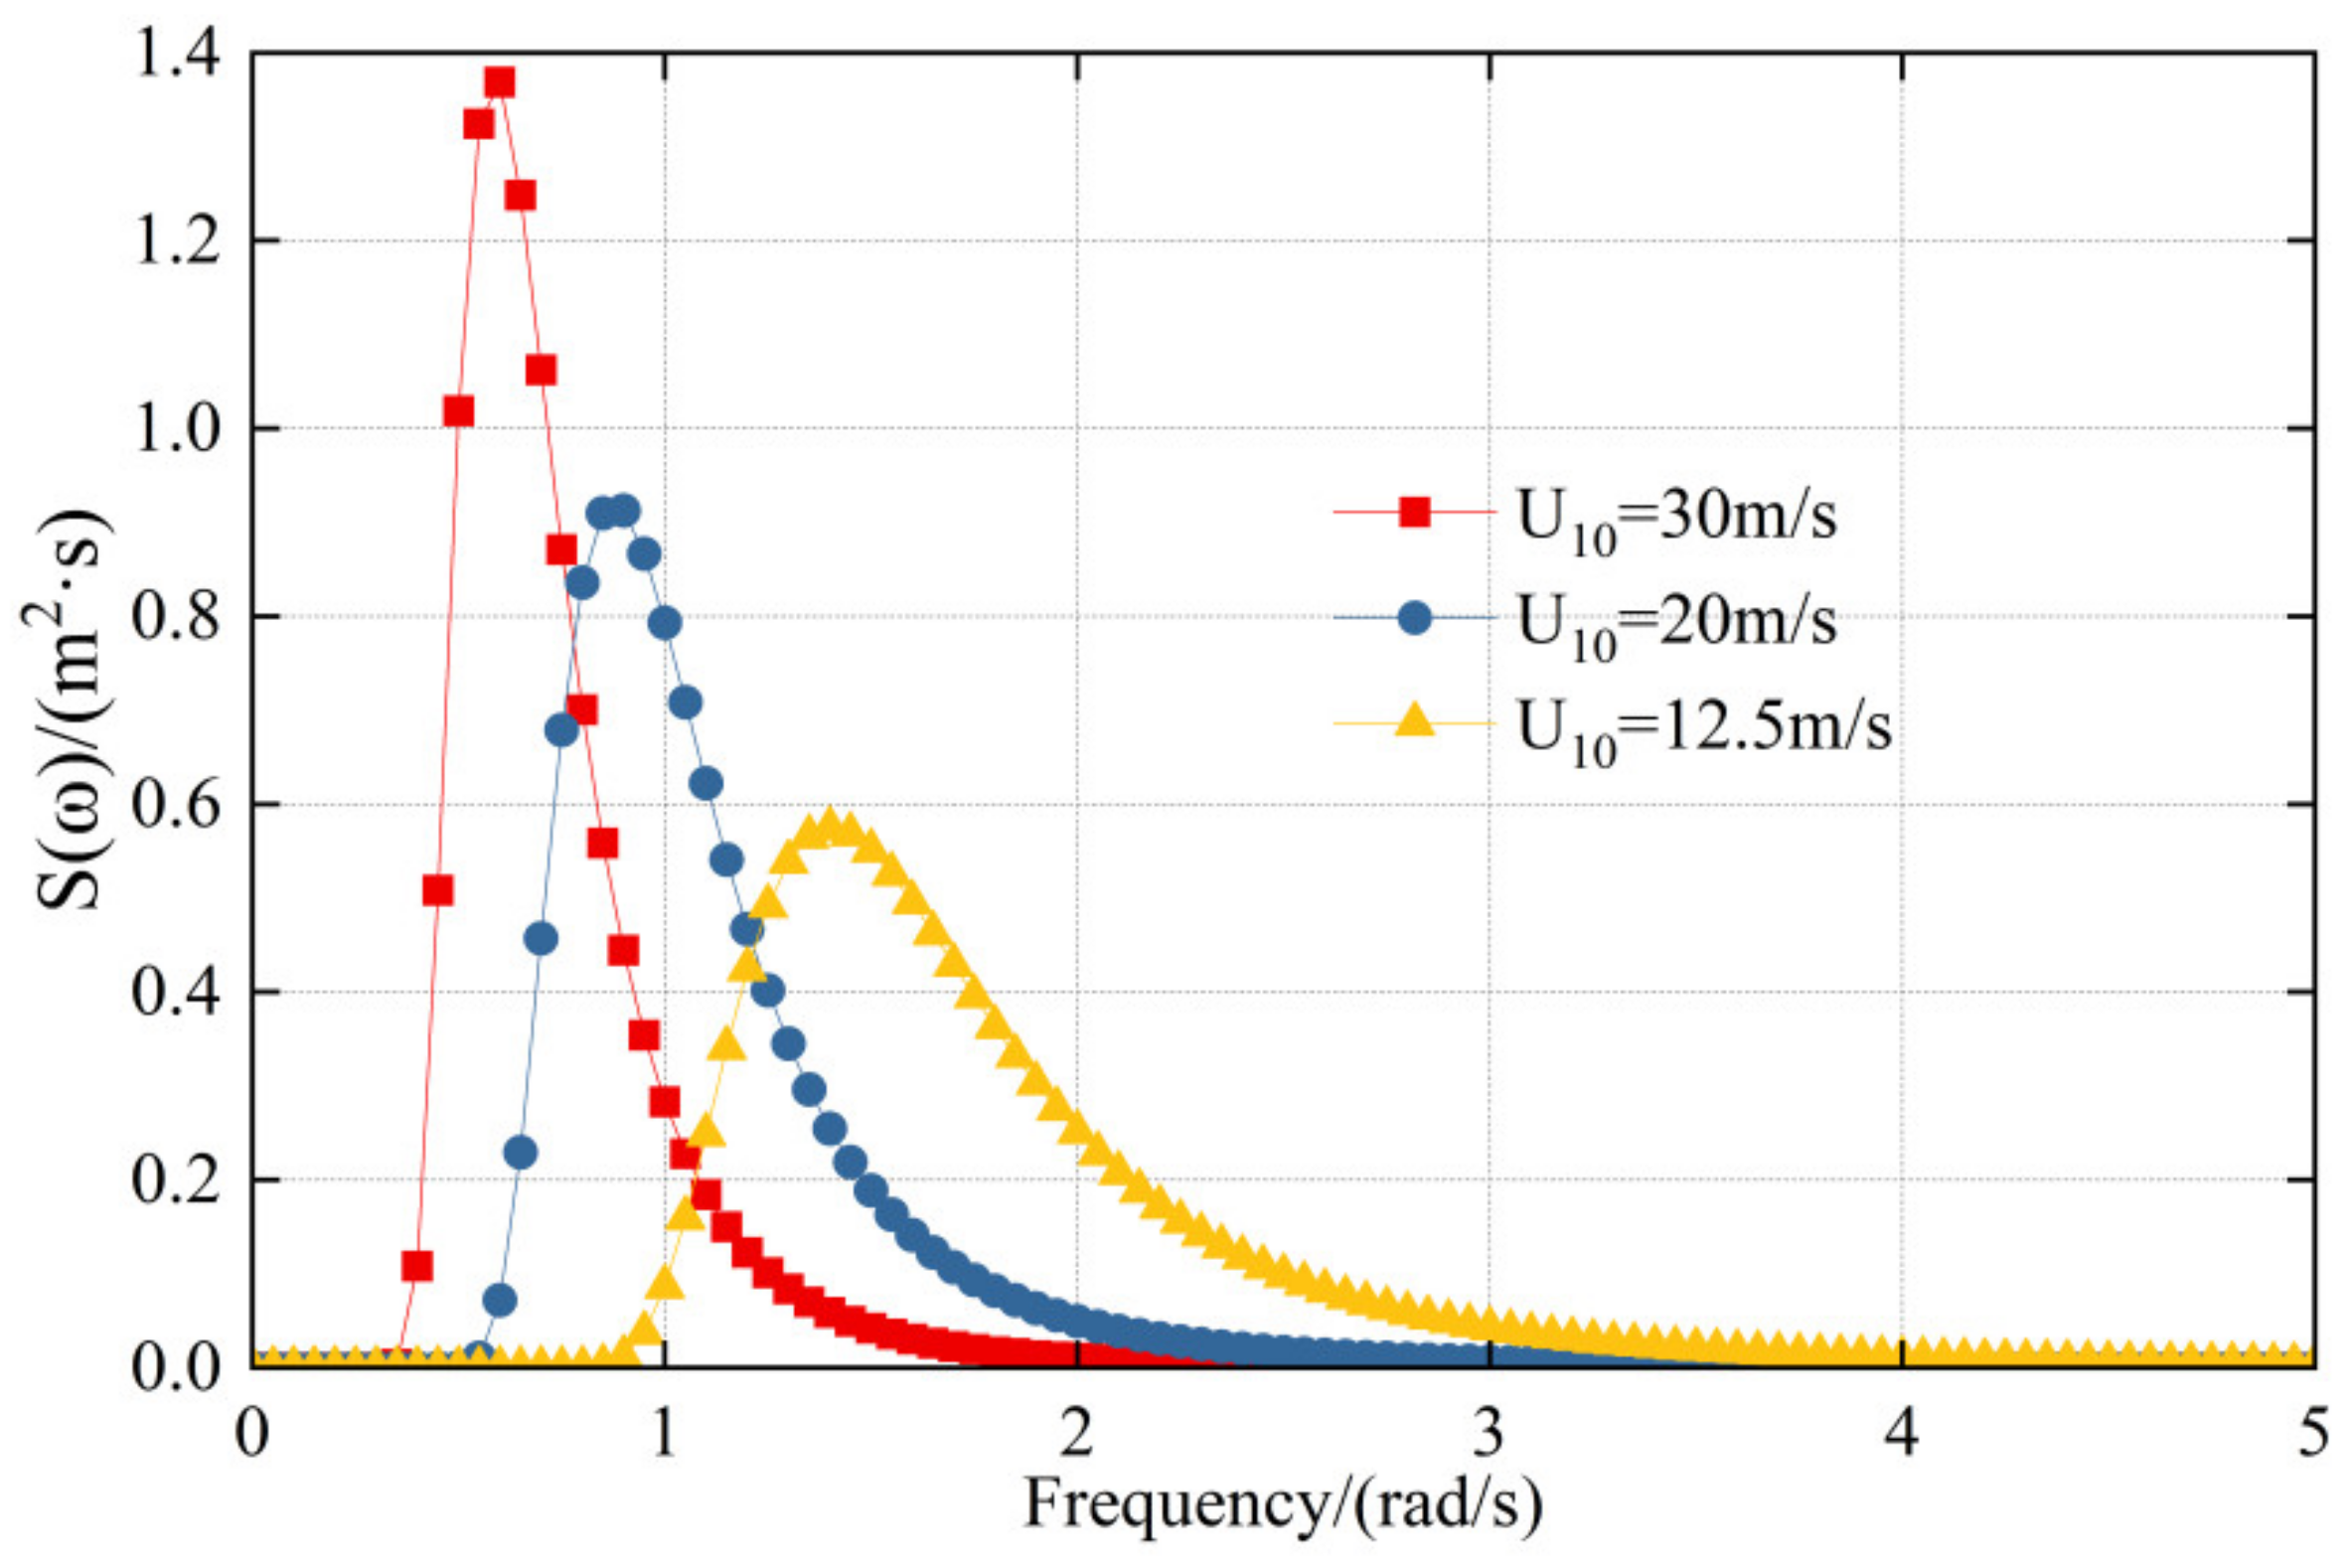
The spectral peak frequency corresponding to the significant wave height can be obtained by simulating the JONSWAP spectrum. The spectral peak factor can be evaluated by referring to the value range of different sea conditions (the JONSWAP spectrum applies to the North Sea, the Northern North sea, the Northern Atlantic, and others, with a range of 1~7. In this paper, the significant wave height is 2.5 m, so the spectral peak factor takes the value of 1.0). Figure 7 shows the wave spectrum when the significant wave height is 2.5 m, 3 m, and 3.5 m, respectively. Figure 8 outlines the change of peak frequency of the wave spectrum with the wind velocity. It can be concluded that the critical factor affecting peak frequency is the wind velocity at 10 m height on the sea surface.
The NPD spectrum is used for wind load in this paper. The base wind velocities are 12.5 m/s and 20 m/s, and the acting angle is 45°. The sea surface velocity of the current load is 1.08 m/s. Specific data are listed in Table 3.

3.3. The Influence of the Mooring Connection Angle

The use of AQWA primarily studied working condition C0, and the simulation time was 10799.8 s. Wind, wave, and current action angles were selected to be 45°, and the motion responses such as the surge, pitch, and yaw of the platform with the included angles α = 0°, α = 10°, α = 20°, and α = 30° were further compared and analyzed.
Figure 9, Figure 10 and Figure 11 show the comparison of the surge, pitch, and yaw response values under the same environmental loads with different α. In Figure 9, Figure 10 and Figure 11, under the action of environmental loads, the surge, pitch, and yaw all make reciprocating motions. Notably, the vibration frequency of the former two cases is remarkably larger than that of the yaw. It can also be concluded that when α = 0°, each response value is more extensive, while for α = 30°, the surge and pitch values are smaller, which shows apparent changes. Meanwhile, the angle between the tension legs has a relatively small influence on the maximum and minimum values of the yaw.
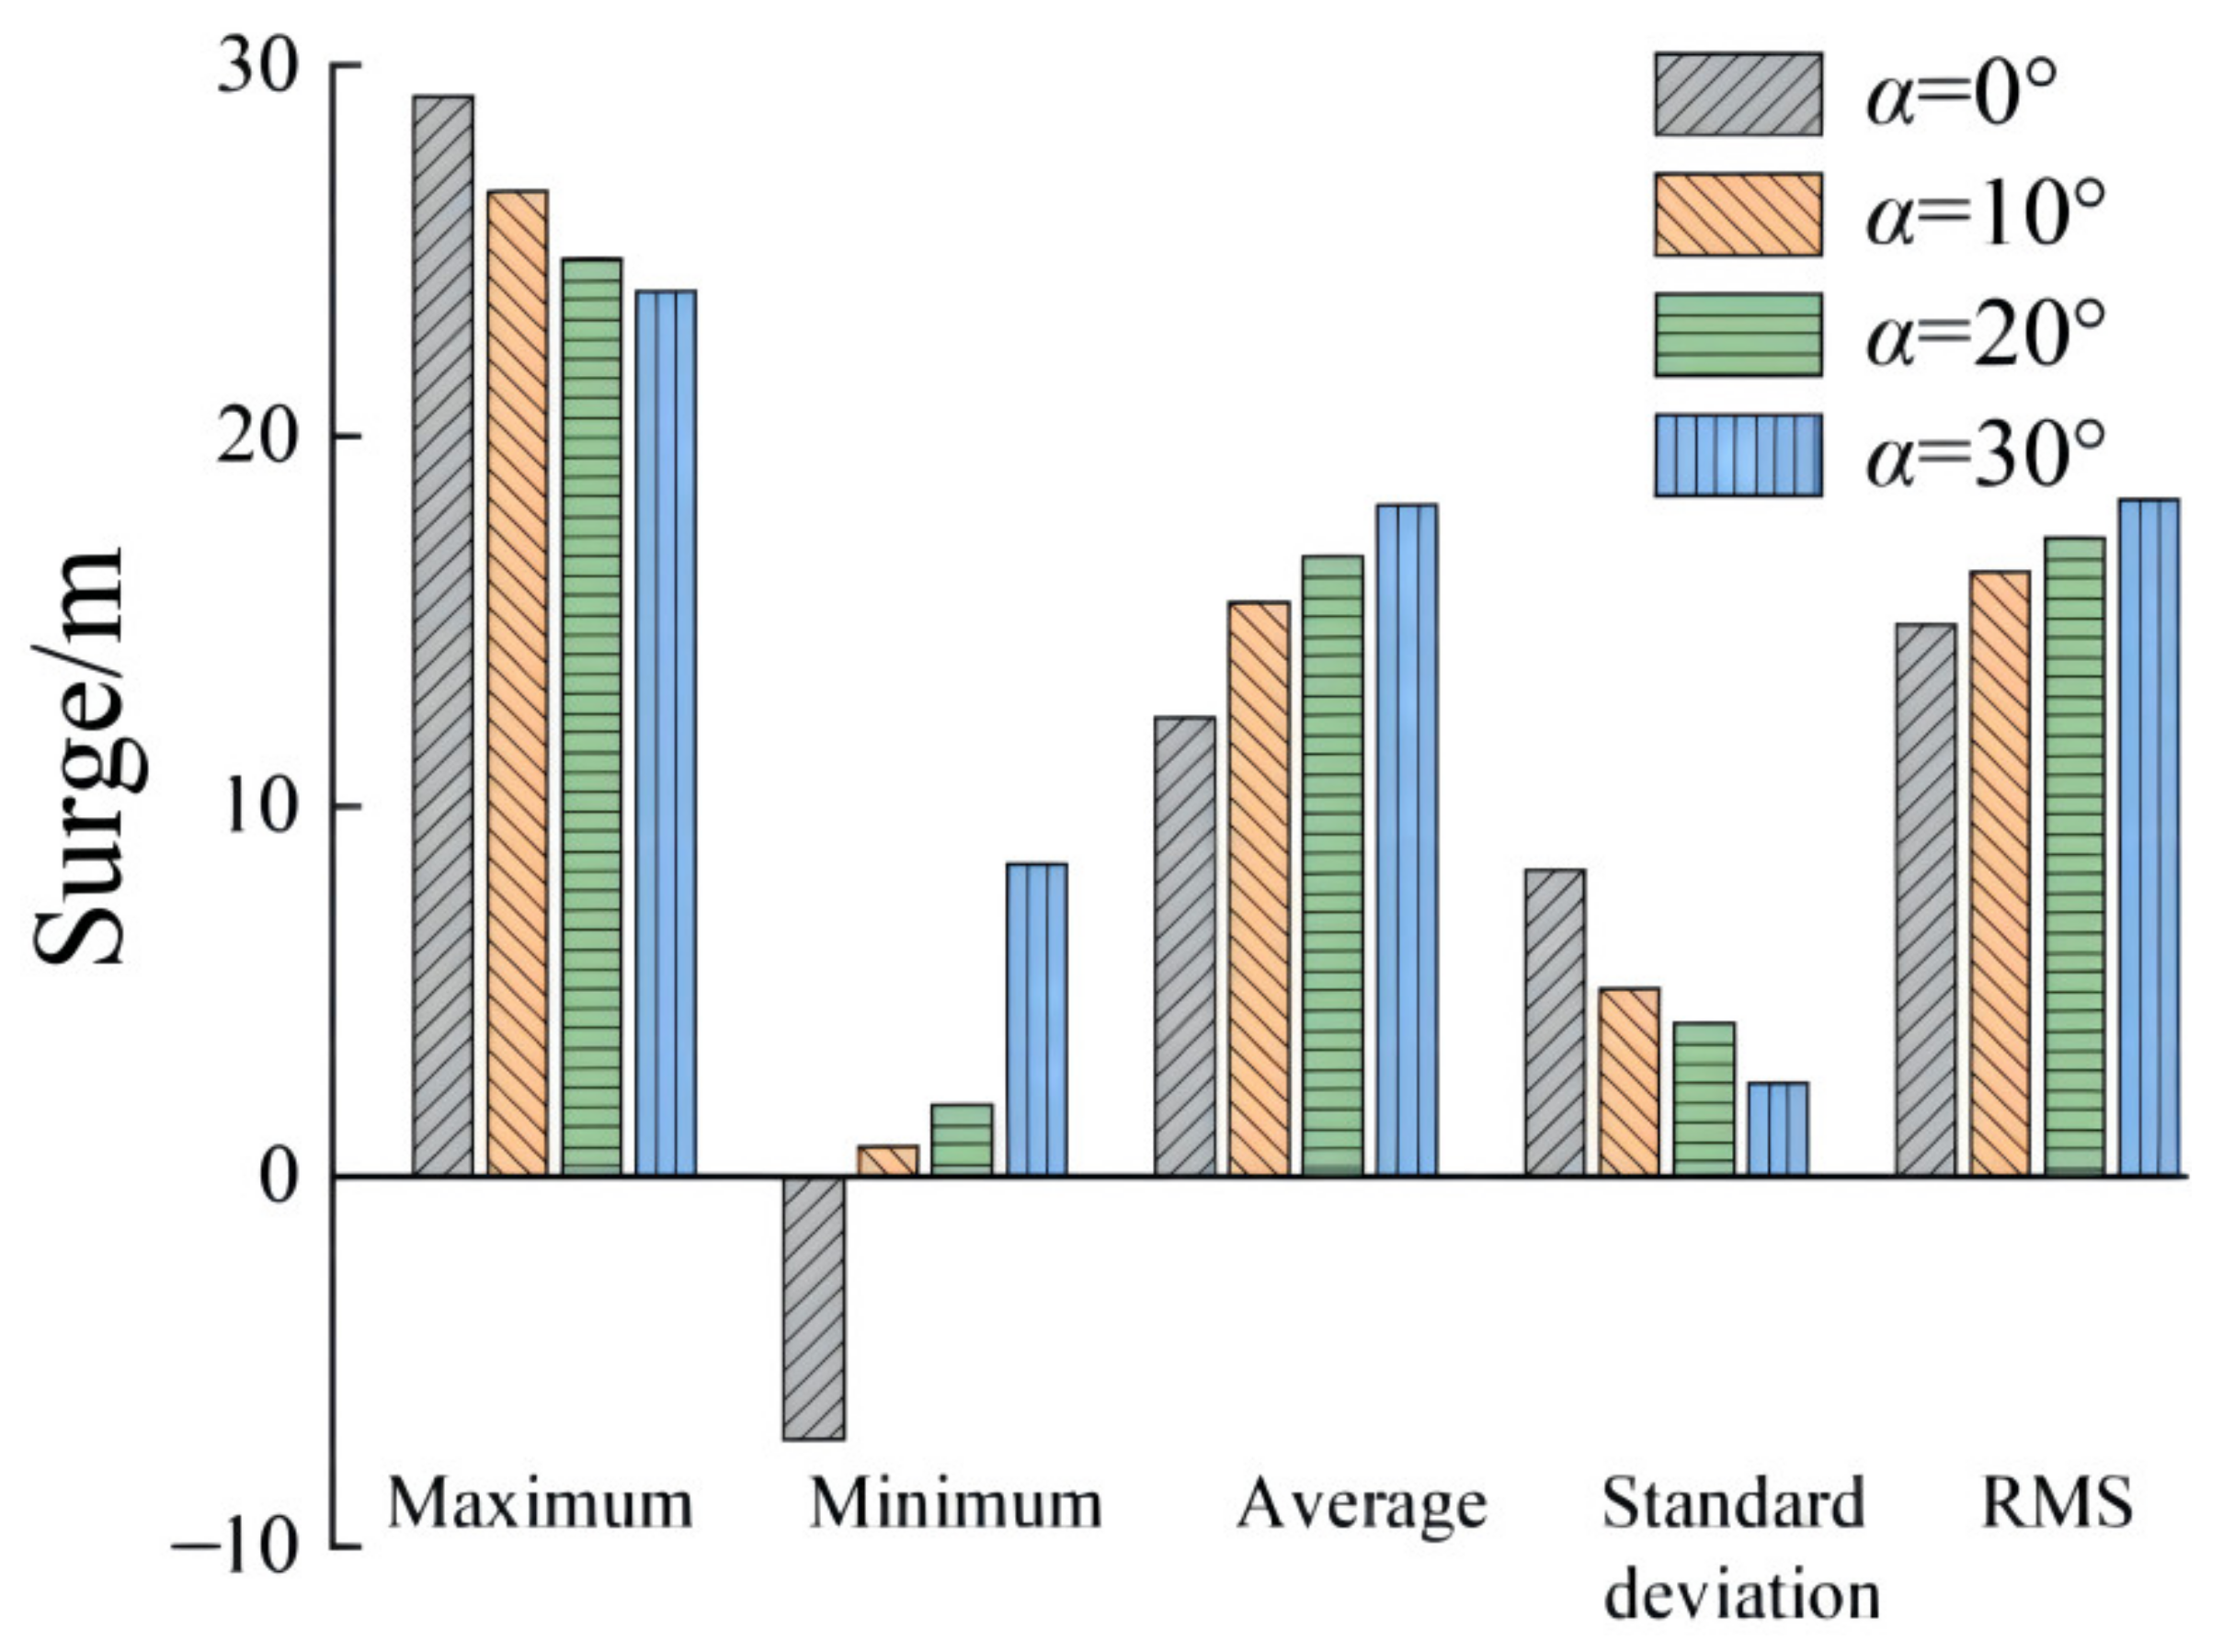
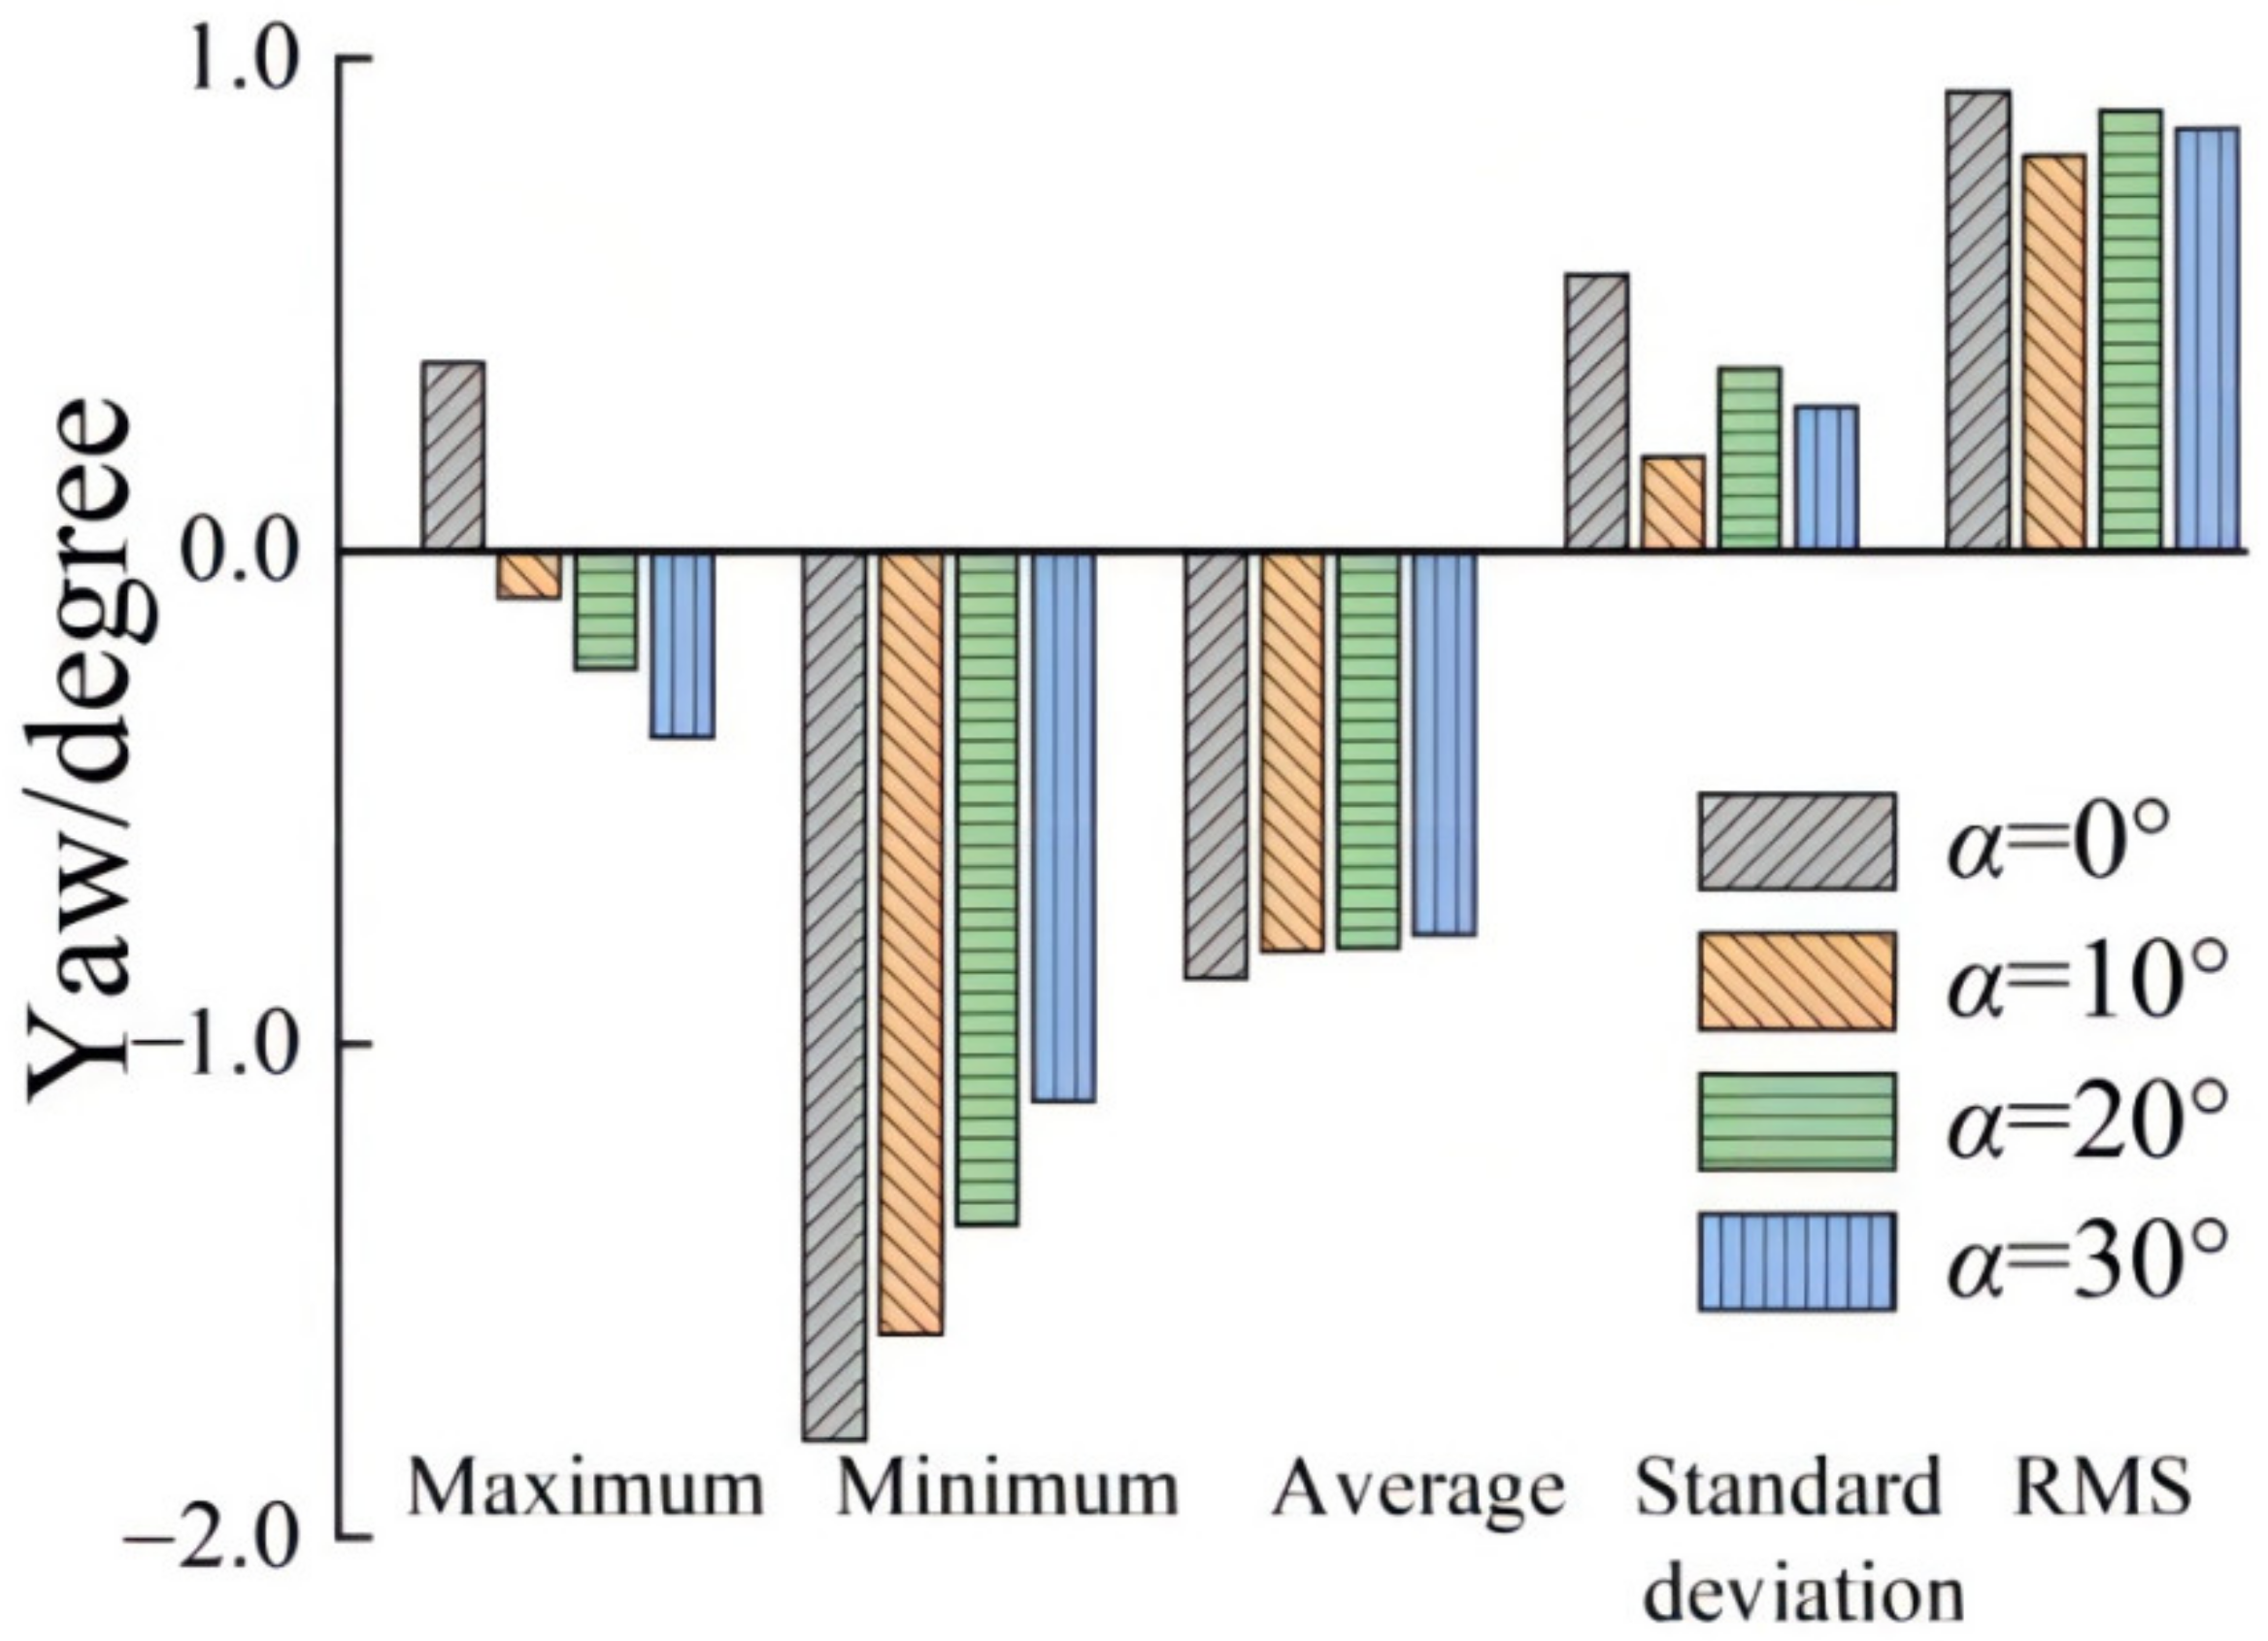
Table 4 shows the statistical values of the three responses under the same working condition, and Figure 12, Figure 13 and Figure 14 show those values’ histograms. The response with the most considerable value is selected to calculate the inhibition efficiency. We can see from the standard deviation that when α is small, the data fluctuation is generally large. The inhibition effect of increasing α on the motion response value fluctuation can also be judged via ƞ = |SD(30) − SD(0)|/SD(0) × 100% (where SD(0) and SD(30) are the standard deviations at 0° and 30°, respectively). It can be observed that the ƞ values are 69.48%, 57.22%, and 47.89%, respectively, for the surge, pitch, and yaw responses. Therefore, increasing α effectively inhibits large fluctuations of the platform, and the surge fluctuation is the best at α = 30°, which increases the platform’s safety.

3.4. Tension under Different Environmental Loads

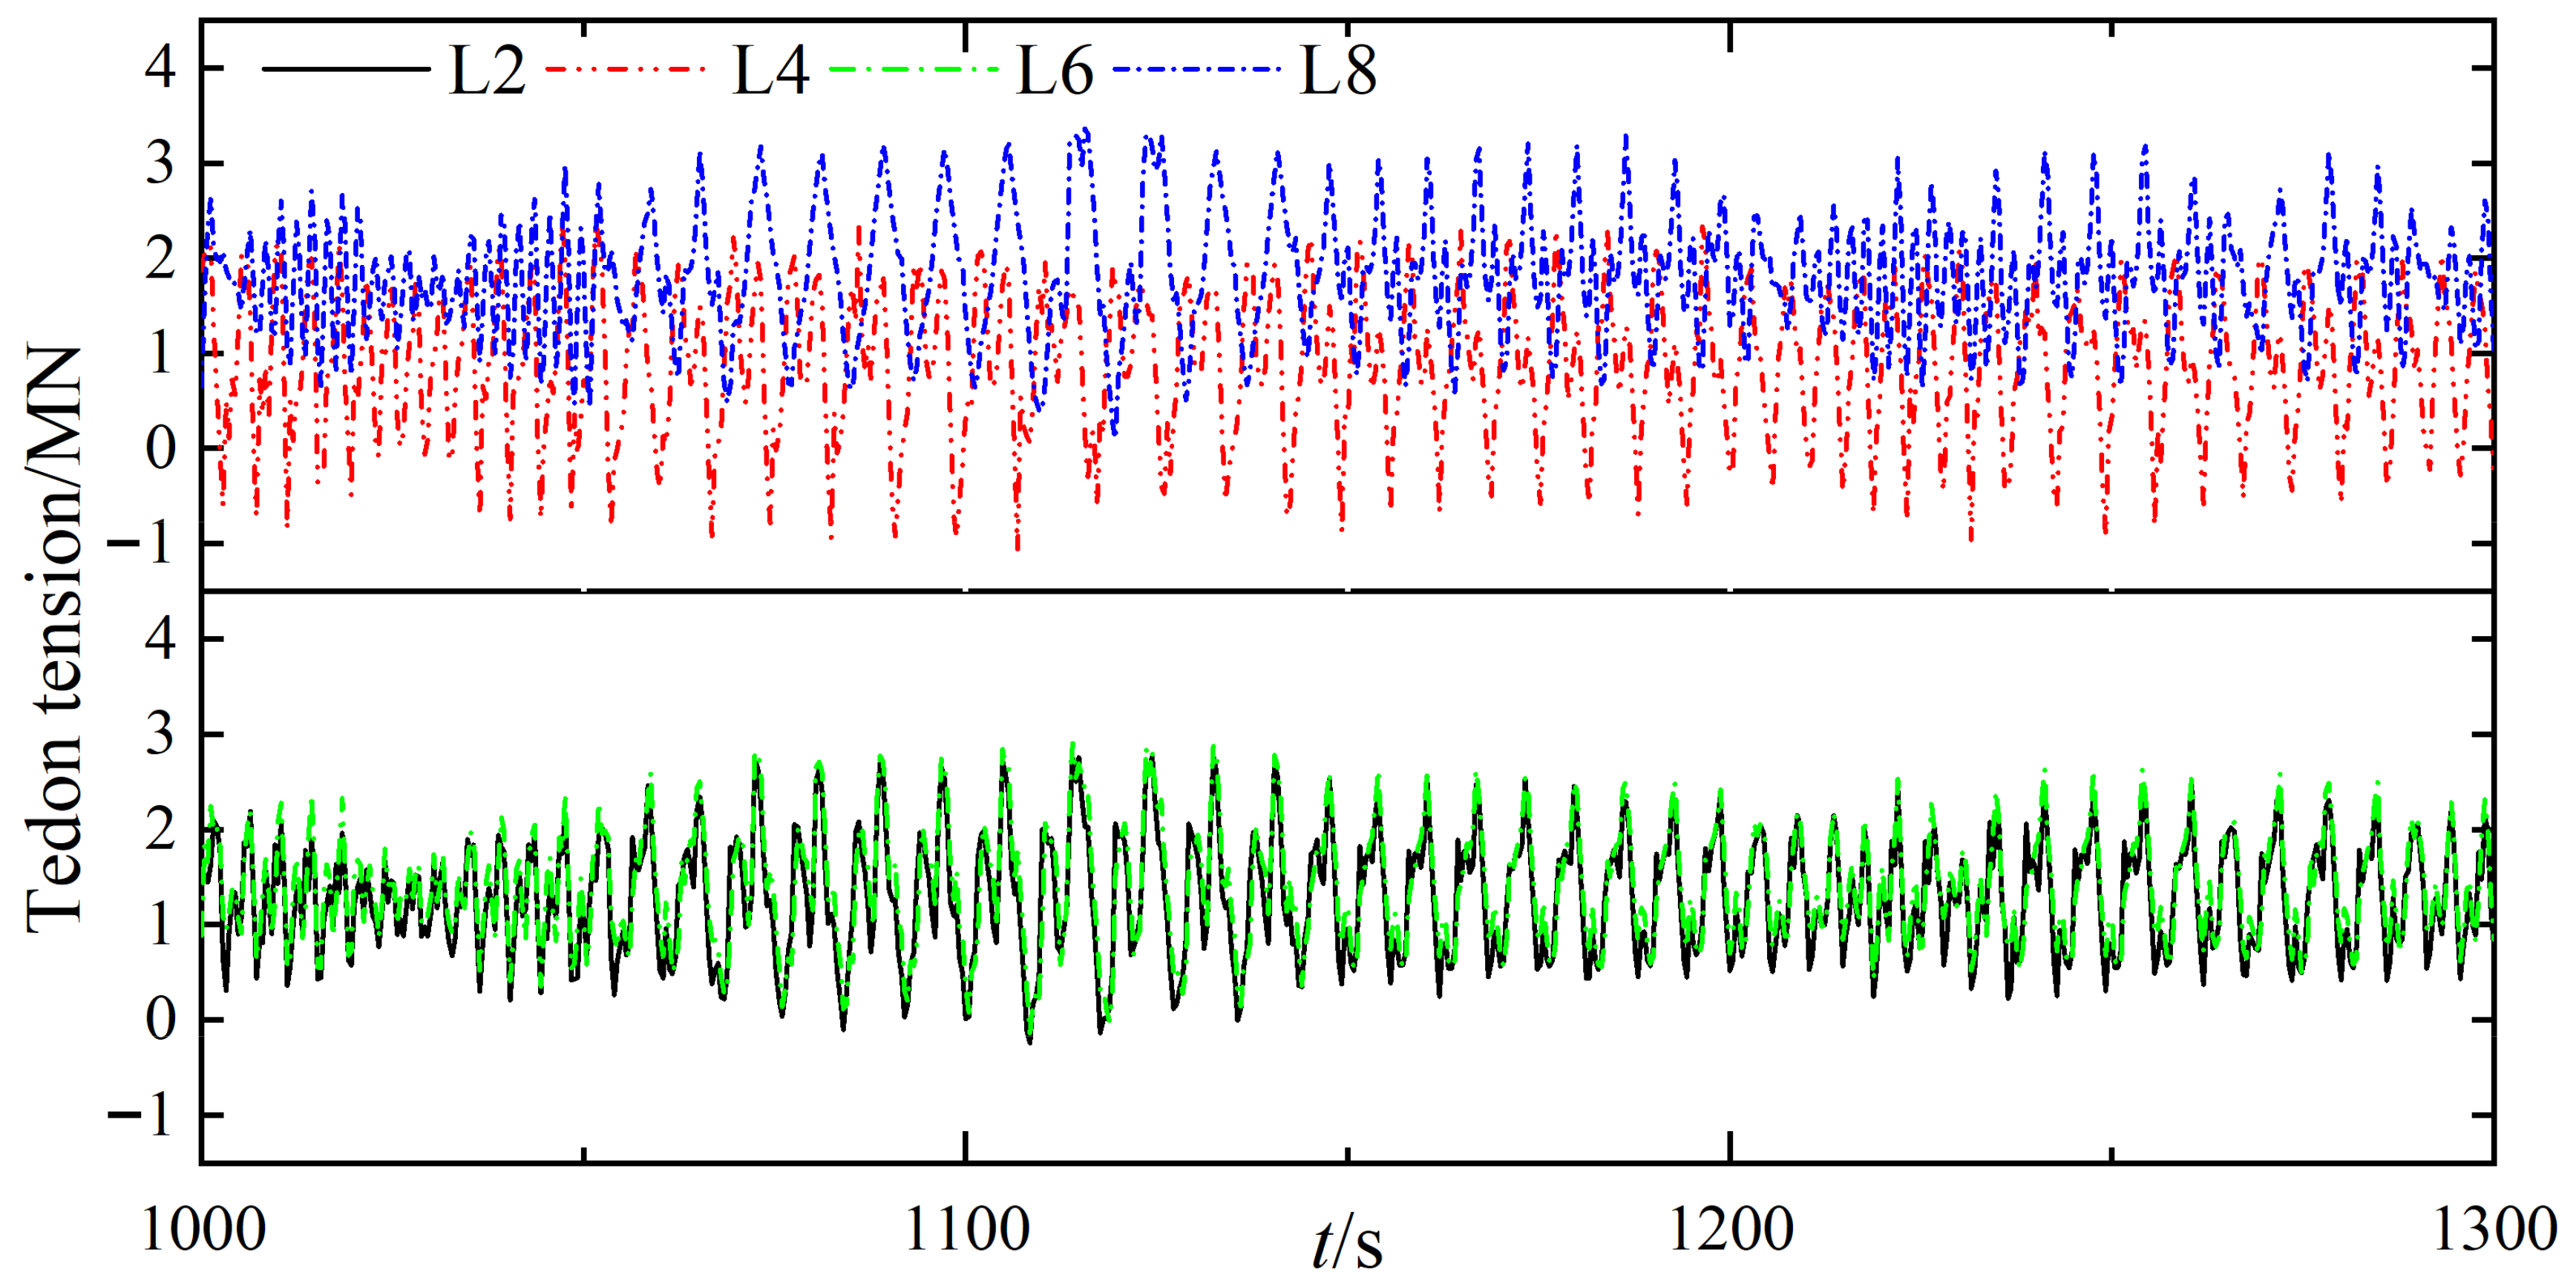
In Section 3.3 when α = 30°, the motion responses of the floating platform under environmental loads attain the minimum. This section discusses the influence of various loads on the tension of the tension legs when α = 30° by changing the combined working conditions of the environmental loads on the model, where the operating cases are C1~C4. Figure 15, Figure 16, Figure 17 and Figure 18, respectively, correspond to C1~C4 (C1 is under wind load only, C2 under wave load only, C3 under current load only, and C4 under all environmental loads). It can be seen that under C1, C2, and C4, the forces of the four tension legs are unbalanced. The tension of the L8 tension leg is the largest, while that of the L4 tension leg is the minimum value. For C3, the effect of the ocean current on the tension of the tension legs at different positions produces little difference, and the four curves fit well. Moreover, the maximum and minimum values occur for tension legs L8 and L4, respectively. By comparing the maximum and minimum values of C1~C4 and the curve fitting degree of L2, L4, L6, and L8, it can be estimated that wave load and wind load are the two main loads affecting the TLP’s motion performance.

4. Conclusions

Based on potential flow theory and the Morison formulation, this paper numerically investigated the stability of TLPs under the same or different environmental ocean conditions by altering the angle (α) between the tension leg and the vertical direction, which aims to provide a new approach for TLP performance optimization. The significant findings and conclusions can be summarized as follows:
Under the combined operation of wind, wave, and current, the maximum peak value of the response spectrum for the surge and sway is near the natural frequency of the degree of freedom, that is, 0~0.1 rad/s. Further, there is a slight fluctuation at the peak period of the sea state spectrum.
When altering the angle (α) between the tension leg and the vertical direction under the same working condition, the motion responses of the pitch and yaw change with the changing α. At α = 30°, the value of motion response attains the minimum. And for surge, pitch, and yaw, the standard deviation decreases significantly after altering the included angle, indicating that the platform shows good stability.
According to the statistical analysis of the response of the floating foundation under the same working condition, it can be concluded that the response values of the surge, pitch, and yaw decrease with an increasing α, which enhances the motion response suppression effect of the floating foundation.
To determine the main load factors affecting the normal working of the floating foundation, the influence of different combinations of marine environmental loads on the tension legs of the floating platform is further studied at α = 30°. It can be found that the tension leg facing the loading direction is the main object stressed with the most significant tension value, while the tension leg on the diagonal is the smallest. When only the current load is applied, the tension of all tendons is minimal, and the differences among tension legs are not noticeable. Under the condition of wind load and wave load only, the curves of different tension legs are similar to those of wind-wave-current conditions, and the tension is more significant than in the case of only the current load. Therefore, it can be judged that wave load and wind load are the main environmental factors affecting the performance of the floating foundation. This provides a reference for the future study of the sea state where the ocean wave load plays a leading role.
In conclusion, the form of the offshore structural platform is of great significance for the efficient development and utilization of offshore wind resources. After setting the specific angle, this study found that compared with the traditional tension-leg platform, the model demonstrates better stability under a complex nonlinear load, which reduced the loss caused by excessive motion response and increased the safety of the wind turbines.

Author Contributions

Conceptualization, W.Y.; methodology, N.W.; software, N.W.; validation, N.W. and W.Y.; formal analysis, X.X.; investigation, X.X. and W.Y.; resources, N.W., W.Y. and X.X.; data curation, N.W.; writing—original draft preparation, N.W.; writing—review and editing, N.W.; visualization, X.X. and W.Y.; supervision, X.X. and W.Y.; project administration, X.X.; funding acquisition, W.Y. All authors have read and agreed to the published version of the manuscript.

Funding

This work was supported by The Key Program of the National Natural Science Foundation of China (Grant number: 11932010).

Data Availability Statement

The data presented in this study are available on request from the corresponding author. The data are not publicly available due to [the privacy of the data for the follow-up study].

Conflicts of Interest

The authors declare no conflict of interest.

References

  1. Heronemus, W.E. Pollution-Free Energy From Offshore Winds. In Proceedings of the 8th Annual Conference of the Marine Technology Society, Washington, DC, USA, 11–13 September 1972. [Google Scholar]
  2. Huang, Y.; Cheng, P.; Wan, D. Numerical Analysis of a Floating Offshore Wind Turbine by Coupled Aero-Hydrodynamic Simulation. J. Mar. Sci. Appl. 2019, 18, 82–92. [Google Scholar] [CrossRef]
  3. Possner, A.; Caldeira, K. Geophysical potential for wind energy over the open oceans. Proc. Natl. Acad. Sci. USA 2017, 114, 11338–11343. [Google Scholar] [CrossRef] [PubMed] [Green Version]
  4. Koo, B.J.; Goupee, A.J.; Kimball, R.W.; Lambrakos, K.F. Model Tests for a Floating Wind Turbine on Three Different Floaters. J. Offshore Mech. Arct. Eng. 2014, 136, 1–11. [Google Scholar] [CrossRef]
  5. Tang, T.; Hu, J.; Liu, L. Study on the Dynamic Response for Floating Foundation of Offshore Wind Turbine. In Proceedings of the ASME 2011 30th International Conference on Ocean, Offshore and Arctic Engineering, Rotterdam, The Netherlands, 19–24 June 2011; Volume 6, pp. 19–24. [Google Scholar]
  6. Guedon, S.; Weller, S. Study of a Floating Foundation for Wind Turbines. J. Offshore Mech. Arct. Eng. 2013, 135, 75–88. [Google Scholar] [CrossRef]
  7. Sethuraman, L.; Venugopal, V. Hydrodynamic response of a stepped-spar floating wind turbine: Numerical modelling and tank testing. Renew. Energy 2013, 52, 160–174. [Google Scholar] [CrossRef]
  8. Wang, H.F.; Fan, Y.H. Preliminary Design of Offshore Wind Turbine Tension Leg Platform In the South China Sea. J. Eng. Sci. Technol. Rev. 2013, 6, 88–92. [Google Scholar] [CrossRef]
  9. Istrati, D.; Buckle, I.G. Effect of fluid-structure interaction on connection forces in bridges due to tsunami loads. In Proceedings of the 30th US-Japan Bridge Engineering Workshop, Washington, DC, USA, 21–23 October 2014. [Google Scholar]
  10. Anagnostopoulos, S.A. Dynamic response of offshore platforms to extreme waves including fluid-structure interaction. Eng. Struct. 1982, 4, 179–185. [Google Scholar] [CrossRef]
  11. Choi, S.J.; Lee, K.H.; Gudmestad, O.T. The effect of dynamic amplification due to a structure’s vibration on breaking wave impact. Ocean Eng. 2015, 96, 8–20. [Google Scholar] [CrossRef]
  12. Mercier, J.A. A Method for Computing Float-Platform Motions in Waves. J. Hydronautics 1970, 4, 98–104. [Google Scholar] [CrossRef]
  13. Mekha, B.B.; Johnson, C.P.; Roesset, J.M. Effects of different wave free surface approximations on the response of a TLP in deep water. In Proceedings of the Fourth International Offshore and Polar Engineering Conference, Osaka, Japan, 10–15 April 1994; pp. 105–115. [Google Scholar]
  14. Kim, C.H.; Kim, M.H.; Liu, Y.H.; Zhao, C.T. Time Domain Simulation of Non-Linear Response of a Coupled TLP System. In Proceedings of the Fourth International Offshore and Polar Engineering Conference, Osaka, Japan, 10–15 April 1994; Volume 4, pp. 88–96. [Google Scholar]
  15. Jain, A.K. Nonlinear coupled response of offshore tension leg platforms to regular wave forces. Ocean Eng. 1997, 24, 577–592. [Google Scholar] [CrossRef]
  16. Zeng, X.H.; Li, X.W.; Liu, Y.; Wu, Y.X. Nonlinear Dynamic Responses of Tension Leg Platform with Slack-Taut Tether. China Ocean Eng. 2009, 23, 37–48. [Google Scholar]
  17. Horoub, M.M. Dynamic Analysis of a Tension Leg Platforms (TLPs) Inspired by Parallel Robotic Manipulators. IEEE Access 2020, 8, 35222–35230. [Google Scholar] [CrossRef]
  18. Pakozdi, C.; Kendon, T.E.; Stansberg, C.T. Breaking wave impact on a platform column: An introductory CFD study. In Proceedings of the ASME 2011 30th International Conference on Ocean, Offshore and Arctic Engineering, Rotterdam, The Netherlands, 19–24 June 2011; Volume 44335, pp. 645–654. [Google Scholar]
  19. Xiang, T.; Istrati, D. Assessment of Extreme Wave Impact on Coastal Decks with Different Geometries via the Arbitrary Lagrangian-Eulerian Method. J. Mar. Sci. Eng. 2021, 9, 1342. [Google Scholar] [CrossRef]
  20. Pan, K.; IJzermans, R.H.A.; Jones, B.D.; Thyagarajan, A.; van Beest, B.W.H.; Williams, J.R. Application of the SPH method to solitary wave impact on an offshore platform. Comput. Part. Mech. 2015, 3, 155–166. [Google Scholar] [CrossRef] [Green Version]
  21. Canelas, R.; Ferreira, R.M.; Crespo, A.; Domínguez, J.M. A generalized SPH-DEM discretization for the modelling of complex multiphasic free surface flows. In Proceedings of the 8th International Spheric Workshop, Trondheim, Norway, 4–6 June 2013. [Google Scholar]
  22. Jonkman, J.; Larsen, T.; Hansen, A.; Nygaard, T.; Maus, K.; Karimirad, M.; Gao, Z.; Moan, T.; Fylling, I. Offshore code comparison collarboration within IEA wind task 23: Phase IV results regarding floating wind turbine modeling. In Proceedings of the European Wind Energy Conference (EWEC), Warsaw, Poland, 20–23 April 2010. [Google Scholar]
  23. Shen, M.; Hu, Z.; Liu, G. Dynamic response and viscous effect analysis of a TLP-type floating wind turbine using a coupled aero-hydro-mooring dynamic code. Renew. Energy 2016, 99, 800–812. [Google Scholar] [CrossRef] [Green Version]
  24. Li, L.; Hu, Z.; Wang, J.; Ma, Y. Development and Validation of an Aero-hydro Simulation Code for Offshore Floating Wind Turbine. J. Ocean Wind Energy 2015, 2, 1–11. [Google Scholar]
  25. Uzunoglu, E.; Soares, C.G. A system for the hydrodynamic design of tension leg platforms of floating wind turbine. Ocean Eng. 2019, 171, 78–92. [Google Scholar] [CrossRef]
  26. Cheng, P.; Huang, Y.; Wan, D. A numerical model for fully coupled aero-hydrodynamic analysis of floating offshore wind turbine. Ocean Eng. 2019, 173, 183–196. [Google Scholar] [CrossRef]
  27. Mohammad, R.T.; Rahim, S. Perturbation nonlinear response of tension leg platform under regular wave excitation. J. Mar. Sci. Technol. 2018, 23, 132–140. [Google Scholar]
  28. Luo, M.; Koh, C.G.; Lee, W.X.; Lin, P.; Reeve, D.E. Experimental study of freak wave impacts on a tension-leg platform. Mar. Struct. 2020, 74, 102821. [Google Scholar] [CrossRef]
  29. Kiamini, S.; Jalilvand, A.; Mobayen, S. LMI-based robust control of floating tension-leg platforms with uncertainties and time-delays in offshore wind turbines via T-S fuzzy approach. Ocean Eng. 2018, 154, 367–374. [Google Scholar] [CrossRef]
  30. Madsen, F.J.; Nielsen, T.R.L.; Kim, T.; Bredmose, H.; Pegalajar-Jurado, A.; Mikkelsen, R.F.; Lomholt, A.K.; Borg, M.; Mirzaei, M.; Shin, P. Experimental analysis of the scaled DTU10MW TLP floating wind turbine with different control strategies. Renew. Energy 2020, 155, 330–346. [Google Scholar] [CrossRef]
  31. Chow, J.H.; Ng, E.Y.; Narasimalu, S. Numerical study of the dynamic response of a wind turbine on a tension leg platform with a coupled partitioned six degree-of-freedom rigid body motion solve. Ocean Eng. 2019, 172, 575–582. [Google Scholar] [CrossRef]
  32. Yang, Y.; Bashir, M.; Wang, J.; Michailides, C.; Loughney, S.; Armin, M.; Hernández, S.; Urbano, J.; Li, C. Wind-wave coupling effects on the fatigue damage of tendons for a 10 MW multi-body floating wind turbine. Ocean Eng. 2020, 217, 107909. [Google Scholar] [CrossRef]
  33. Sun, J.; Hu, S.L.J.; Li, H. Laplace domain method for computing the transient response of floating structures to irregular waves. Ocean Eng. 2020, 203, 107200. [Google Scholar] [CrossRef]
  34. Dai, J.; Hu, W.; Yang, X.; Yang, S. Modeling and investigation of load and motion characteristics of offshore floating wind turbines. Ocean Eng. 2018, 159, 187–200. [Google Scholar] [CrossRef]
  35. Rao, D.S.B.; Selvam, R.P.; Srinivasan, N. Hydrodynamic Analysis of Tension Based Tension Leg Platform. In Proceedings of the ASME 2012 31st International Conference on Ocean, Offshore and Arctic Engineering, Rio de Janeiro, Brazil, 1–6 July 2012; pp. 201–207. [Google Scholar]
  36. Adam, F.; Myland, T.; Dahlhaus, F.; Großmann, J. Scale tests of the GICON®-TLP for Wind Turbines. In Proceedings of the ASME 2014 33rd International Conference on Ocean, Offshore and Arctic Engineering, San Francisco, CA, USA, 8–13 June 2014; p. V09AT09A011. [Google Scholar]
  37. Han, Y.; Le, C.; Ding, H.; Cheng, Z.; Zhang, P. Stability and dynamic response analysis of a submerged tension leg platform for offshore wind turbines. Ocean Eng. 2017, 129, 68–82. [Google Scholar] [CrossRef]
  38. Ma, Z.; Ren, N.; Wang, Y.; Wang, S.; Shi, W.; Zhai, G. A Comprehensive Study on the Serbuoys Offshore Wind Tension Leg Platform Coupling Dynamic Response under Typical Operational Conditions. Energies 2019, 12, 2067. [Google Scholar] [CrossRef] [Green Version]
  39. Ren, N.; Ma, Z.; Shan, B. Experimental and numerical study of dynamic responses of a new combined TLP type floating wind turbine and a wave energy converter under operational conditions. Renew. Energy 2020, 151, 966–974. [Google Scholar] [CrossRef]
  40. Van der Meer, J.W.; Briganti, R.; Zanuttigh, B.; Wang, B. Wave transmission and reflection at low-crested structures: Design formulae, oblique wave attack and spectral change. Coast. Eng. 2005, 52, 915–929. [Google Scholar] [CrossRef]
  41. Istrati, D.; Buckle, I.G. Tsunami Loads on Straight and Skewed Bridges—Part 2: Numerical Investigation and Design Recommendations (No. FHWA-OR-RD-21-13); Oregon Department of Transportation: Salem, OR, USA, 2021. [Google Scholar]
  42. Matha, D. Model Development and Loads Analysis of an Offshore Wind Turbine on a Tension Leg Platform with a Comparison to Other Floating Turbine Concepts: April 2009; National Renewable Energy Laboratory (NREL): Golden, CO, USA, 2010.
  43. Taylor, R.E.; Jefferys, E.R. Variability of hydrodynamic load predictions for a tension leg platform. Ocean Eng. 1986, 13, 449–490. [Google Scholar] [CrossRef]
  44. Zhou, B.Z.; Wu, G.X. Resonance of a tension leg platform exited by third-harmonic force in nonlinear regular waves. Philos. Trans. R. Soc. A Math. Phys. Eng. Sci. 2014, 373, 20140105. [Google Scholar] [CrossRef] [Green Version]
  45. Kaushik, M. Theoretical and Experimental Aerodynamics; Springer: Singapore, 2019; pp. 107–126. [Google Scholar]
  46. API RP 2SK. Recommended Practice for Design and Analysis of Stationkeeping for Floating Structures; American Petroleum Institute: Washington, DC, USA, 2005; Volume 10, p. 59. [Google Scholar]
  47. Gu, J.Y.; Yang, J.M.; Lv, H.N. Studies of TLP Dynamic Response Under Wind, Waves and Current. China Ocean. Eng. 2012, 26, 363–378. [Google Scholar] [CrossRef]
  48. Offshore Standard DNV-OS-J101; Design of Offshore Wind Turbine Structures; Det Norske Veritas: Bærum, Norway, 2004.
  49. API RP2A WSD. Recommended Practice for Planning, Designing and Constructing Fixed Offshore Platforms—Working Stress Design; American Petroleum Institute: Washington, DC, USA, 2000. [Google Scholar]
  50. Ding, Q.; Li, C.; Yu, N.; Hao, W.; Ji, J. Numerical and experimental investigation into the dynamic response of a floating wind turbine spar array platform. J. Mech. Sci. Technol. 2018, 32, 1106–1116. [Google Scholar] [CrossRef]
  51. Watanabe, E.; Utsunomiya, T.; Kubota, A. Analysis of wave-drift damping of a VLFS with shallow draft. Mar. Struct. 2000, 13, 383–397. [Google Scholar] [CrossRef]
  52. Senjanović, I.; Hadžić, N.; Tomić, M. On the linear stiffness of tension leg platforms. Sustain. Mar. Trans. Exp. Sea Res. 2011, 108, 1081–1088. [Google Scholar]
  53. Brown, D.T.; Mavrakos, S. Comparative study on mooring line dynamic loading. Mar. Struct. 1999, 12, 131–151. [Google Scholar] [CrossRef]
  54. Newman, J.N. Wave-drift damping of floating bodies. J. Fluid Mech. 1993, 249, 241–259. [Google Scholar] [CrossRef]
  55. Faltinsen, O.M. Sea Loads on Ships and Offshore Structures; Cambridge University Press: New York, NY, USA, 1990. [Google Scholar]
  56. Gu, J.Y.; Yang, J.M.; Lv, H.N. Numerical Simulations and Model Tests of the Mooring Characteristic of A Tension Leg Platform Under Random Waves. China Ocean Eng. 2013, 27, 563–578. [Google Scholar] [CrossRef]
  57. Zhao, Y.; Yang, J.; He, Y. Preliminary Design of a Multi-Column TLP Foundation for a 5-MW Offshore Wind Turbine. Energies 2012, 5, 3874–3891. [Google Scholar] [CrossRef]
Figure 1. The diagram of ISSC TLP: (a) The floor plan; (b) The front elevation; (c) Schematic of angle α.
Water 14 00283 g001
Figure 2. Equivalent load diagram: (a) Gradient current load; (b) The equivalent load.
Water 14 00283 g002
Figure 3. Degrees of freedom.
Water 14 00283 g003
Figure 4. Diagram of grid division.
Water 14 00283 g004
Figure 5. Comparison of sway PSD [49].
Water 14 00283 g005
Figure 6. Comparison of surge PSD [47].
Water 14 00283 g006
Figure 7. JONSWAP spectrum with different wave heights.
Water 14 00283 g007
Figure 8. JONSWAP spectrum with different wind speeds.
Water 14 00283 g008
Figure 9. Comparison of surge responses: (a) Motion responses of TLP when α = 0° and α = 10°; (b) Motion responses of TLP when α = 20° and α = 30°.
Water 14 00283 g009
Figure 10. Comparison of pitch responses: (a) Motion responses of TLP when α = 0° and α = 10°; (b) Motion responses of TLP when α = 20° and α = 30°.
Water 14 00283 g010
Figure 11. Comparison of yaw responses: (a) Motion responses of TLP when α = 0° and α = 10°; (b) Motion responses of TLP when α = 20° and α = 30°.
Water 14 00283 g011
Figure 12. Statistical value of surge.
Water 14 00283 g012
Figure 13. Statistical value of pitch.
Water 14 00283 g013
Figure 14. Statistical value of yaw.
Water 14 00283 g014
Figure 15. Tendon tension under C1 (wind loads).
Water 14 00283 g015
Figure 16. Tendon tension under C2 (wave loads).
Water 14 00283 g016
Figure 17. Tendon tension under C3 (current loads).
Water 14 00283 g017
Figure 18. Tendon tension under C4 (wind, wave, and current loads).
Water 14 00283 g018
Table 1. The main parameters of ISSC TLP [43].
ParametersValuesParametersValues
Column spacing86.25 mTotal pretension14 × 103 kN
Column radius8.44 mInner diameter of tension leg0.3436 m
Column length67.5 mOutside diameter of tension leg0.8 m
Floating box width7.50 mTendon length415.0 m
Floating box height10.50 mKxx1.501 × 109 kN·m−1
Displacement54.5 × 106 kgKzz0.813 × 106 kN·m−1
Total mass40.5 × 106 kgDry weight1575.9 kg·m−1
Ixx82.37 × 109 kg·m2Wet weight240.5 kg·m−1
Iyy82.37 × 109 kg·m2Tendon’s equivalent stiffness2.28 × 107 kN
Izz98.07 × 109 kg·m2Area of contour vertical to current5.019 × 103 m2
Center of gravity38.0 mArea of contour vertical to wind2.194 × 103 m2
Draft35.00 m
Table 2. Natural frequencies of ISSC TLP [44].
SurgeSwayHeaveRollPitchYaw
ω n (rad·s−1)0.06120.06123.4883.4013.4010.0764
Table 3. Parameter definitions under different cases [57].
Operating CasesLoadHs (m)Tm (s)γU (m·s−1)Vt(0) (m·s−1)
C0Environmental loads2.55.4112.51.08
C1Wind---20-
C2Wave38.71--
C3Current----1.08
C4C1 + C2 + C338.71201.08
Table 4. Statistical values of response under the same working condition.
Angleα = 0°α = 10°α = 20°α = 30°
DoF
SurgeMaximum value29.152326.586824.760523.9051
Minimum value−7.11600.83141.93388.4415
Average12.402315.508516.735818.1114
Standard deviation8.26055.08154.13962.5211
Root mean square14.896516.317917.239018.2856
PitchMaximum value0.07610.05490.05810.0278
Minimum value−0.1839−0.1693−0.1411−0.0990
Average−0.0652−0.0494−0.0475−0.0208
Standard deviation0.05260.06420.05170.0225
Root mean square0.07080.09150.07150.0306
YawMaximum value0.3804−0.0940−0.2403−0.3778
Minimum value−1.8028−1.5896−1.3665−1.1153
Average−0.8671−0.8121−0.8050−0.7787
Standard deviation0.55950.19170.36940.2915
Root mean square0.93190.80190.89220.8561
Publisher’s Note: MDPI stays neutral with regard to jurisdictional claims in published maps and institutional affiliations.