1. Introduction
The Nile River stretches from south to north (length: 6853 km) in northeast Africa through the Nile River Basin (NRB, area: 3.4 × 10
6 km
2;
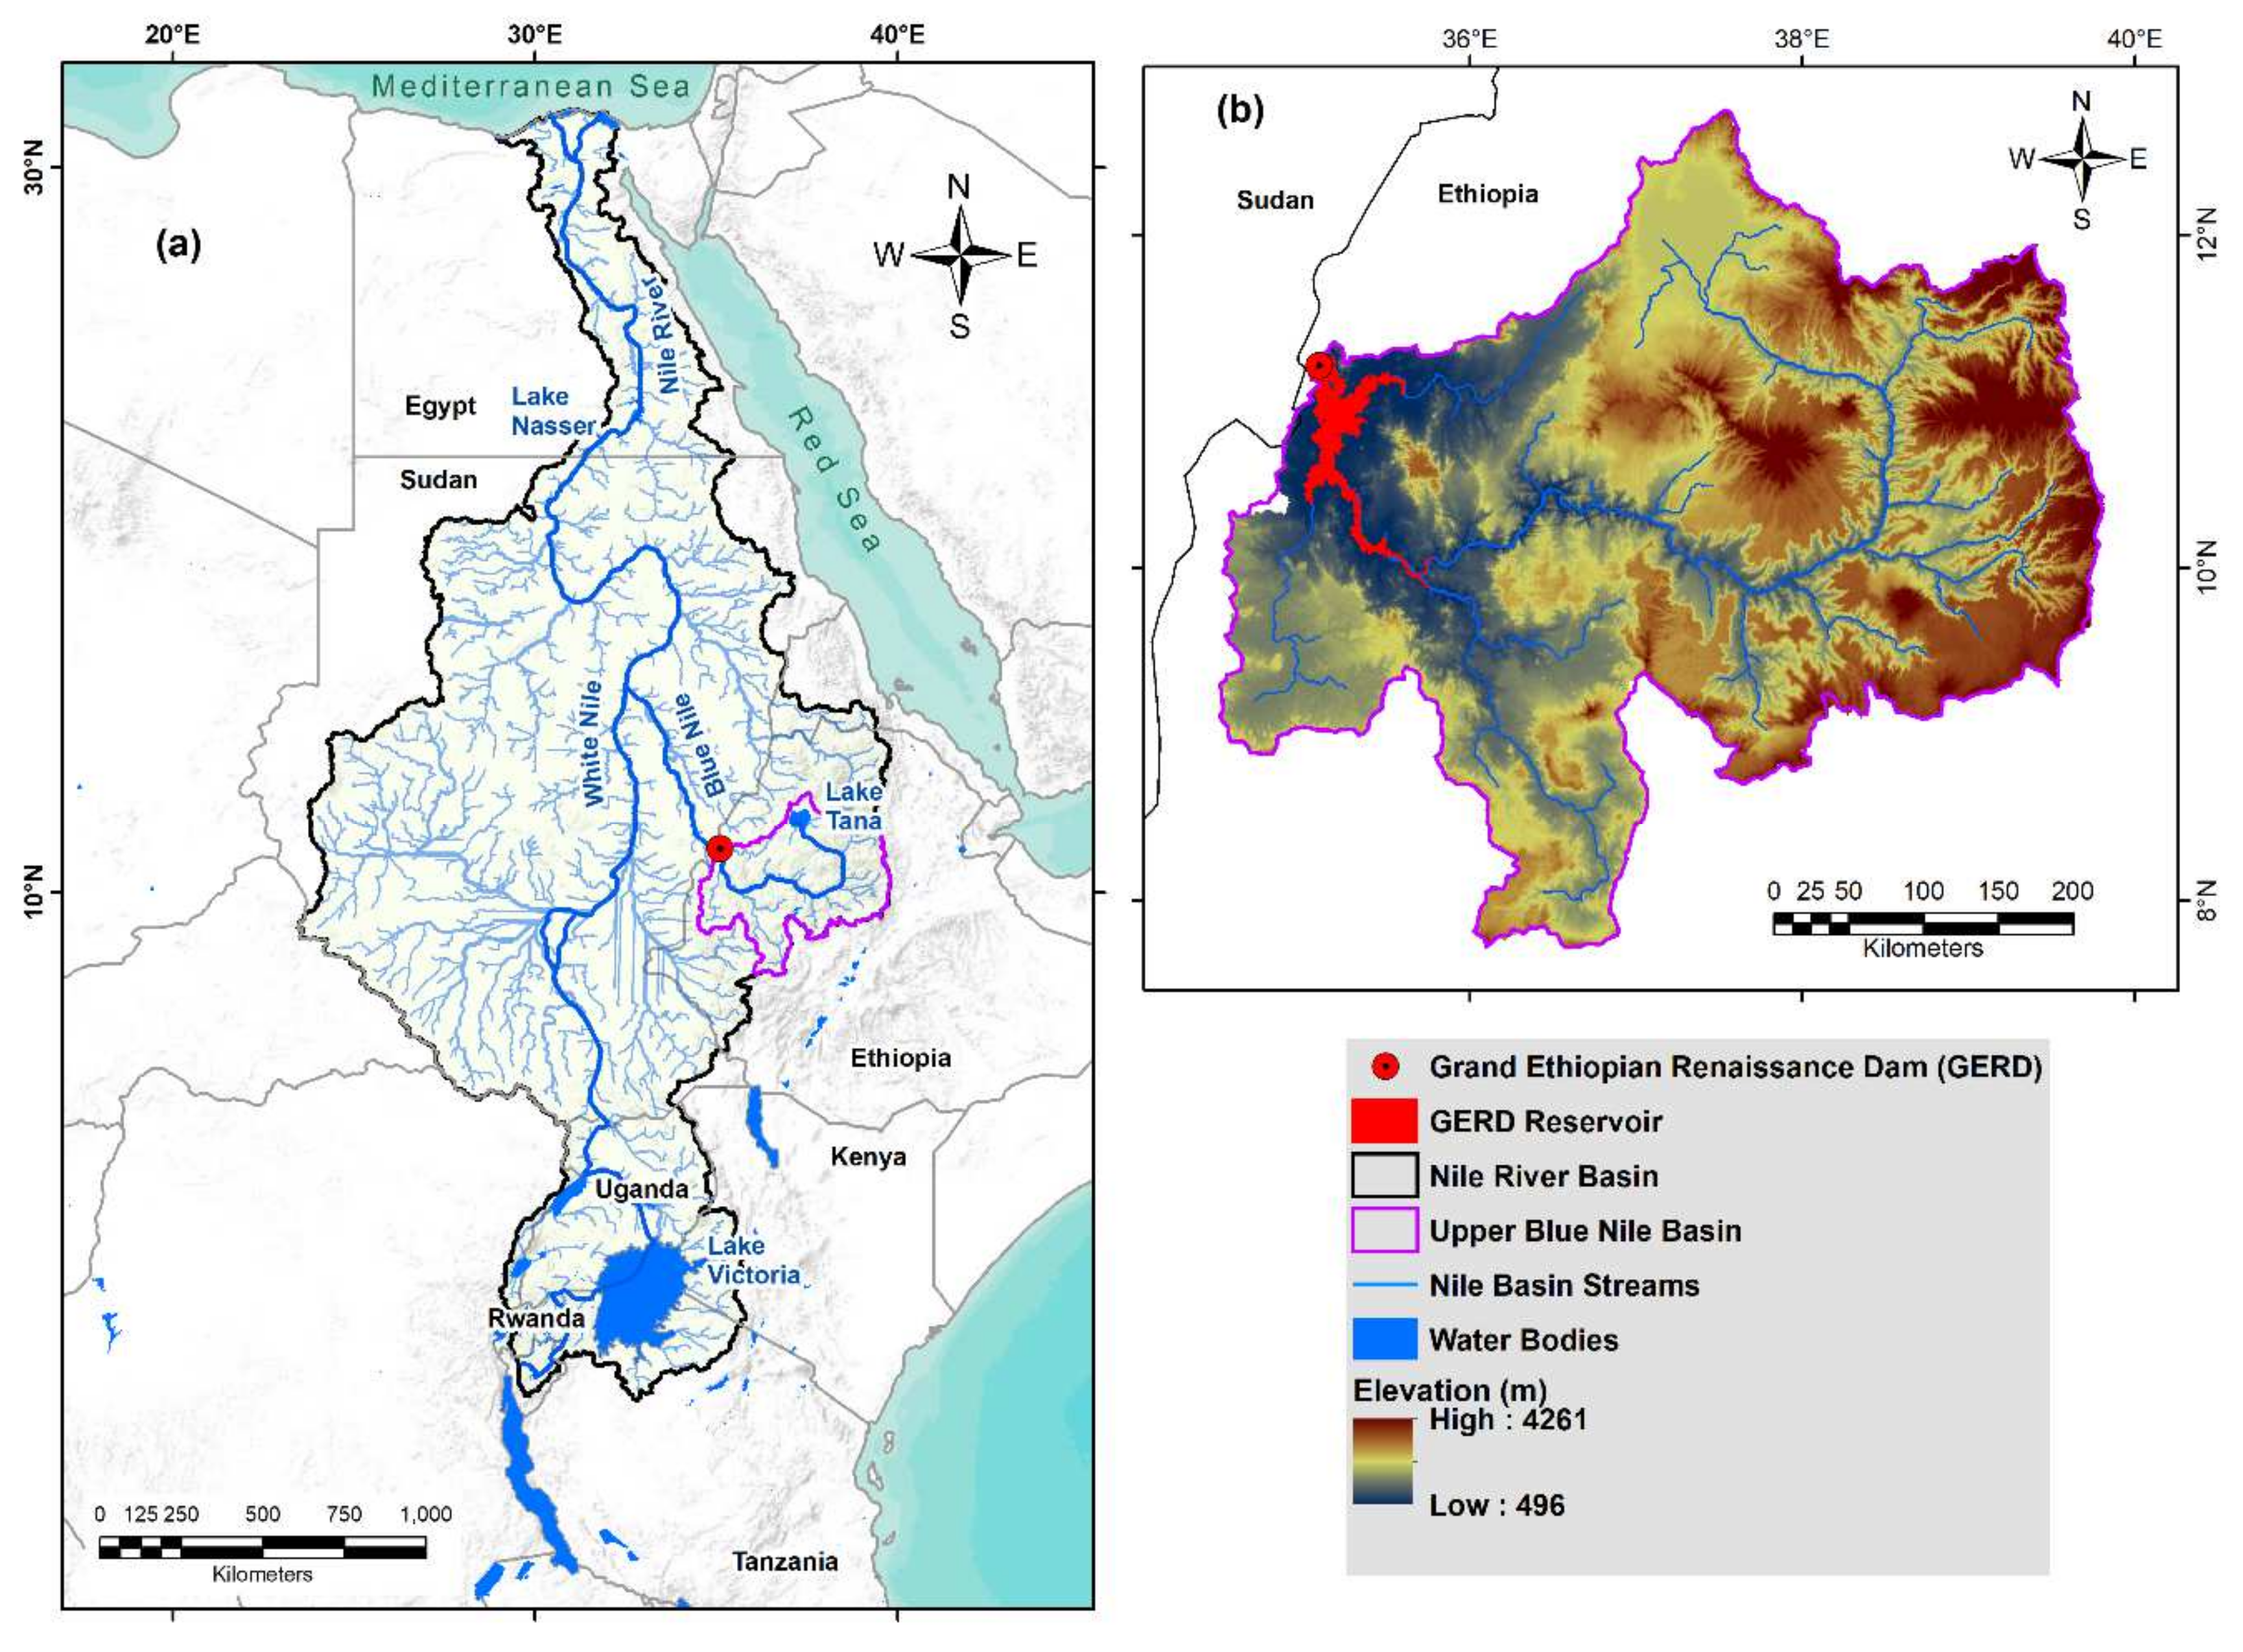
Figure 1a). The main sources of the Nile River are the While and Blue Niles. The White Nile flows from Lake Victoria and runs through Uganda and into Sudan, where it meets the Blue Nile (originating from the Lake Tana in Ethiopia) at the city Khartoum. The Nile River then flows north towards Egypt (
Figure 1a). The NRB extends over 11 African countries and represents a home for an estimated 300 × 10
6 people, the majority of whom live in rural areas.
In addition to the transboundary nature of the NRB, which contributes significantly to political conflicts and disputes, the water resources of the NRB are extremely vulnerable to both natural climatic and anthropogenic forces [
1]. Natural factors include climatic cyclicity that affects flow volumes and timing [
2]. They also include changes in precipitation patterns, amounts, frequencies, and distributions; changes in temperature, and changes in frequency and severity of floods and drought events [
3].
The construction of new and the heightening of existing irrigation and hydropower dams also affects the NRB water resources [
1]. Ethiopia, for example, just launched a major project to construct the Grand Ethiopian Renaissance Dam (GERD). The GERD is located on the Blue Nile, about 15 km east of the Ethiopian border with Sudan (
Figure 1a) [
4]. The Blue Nile runs north–south and then east–west through the Upper Blue Nile Basin (UBN; area: 173,000 km
2;
Figure 1b). It is estimated that the dam will provide up to 6.45 gigawatts of electricity upon completion [
5]. This is a significant power source for the Ethiopian economy. This project is expected to bring employment and business opportunities, as well as putting the world’s gaze on Ethiopia. Upon completion, the outcomes of this project are expected to improve Ethiopians’ living standards and initiate and maintain their sustainable development.
However, this project has the potential to cause irreversible damage to the ecosystem in the entire NRB, thereby threatening the livelihood of the neighboring communities living in the downstream countries Sudan and Egypt. This has led to some political tensions between these affected countries. Many of the arguments posited by the feuding factions about the project are largely based on media reports that lack scientific rigor. The most important issues of contention are the size of the reservoir to be created by the GERD and the time it will take to fill this reservoir.
In a recent study, Taye et. al. [
6] argue that in spite of the contentious nature of the project, GERD—like any major river infrastructure project—can bring about social, environmental, and economic change, and on balance, can provide substantial benefits for regional development. Similarly, in a study that uses a Computable General Equilibrium (CGE) framework with dynamic feedbacks between the river system and Egypt’s macroeconomy, Basheer et al. [
7] show that a coordinated operating strategy could result in a situation where Egypt’s water demands are met during periods of water scarcity while increasing hydropower generation and storage in Ethiopia during high flows. However, in an analysis that relies on growth rate projections by the World Bank [
8], Heggy et al. [
9] find that implementing GERD in a 3-year span would contribute to losses in Egypt’s Gross Domestic Product (GDP) per capita by approximately 8%, and to a rise in the national unemployment rate by about 11 percentage points.
In this study, we apply a multidisciplinary and comprehensive approach to investigate both the environmental and economic impact of GERD, focusing on water supply in the downstream countries, agricultural production, and overall economic activity, with a focus on Egypt. Specifically, we quantify the volume of projected losses in Egypt’s annual water allocation from the Nile. We then estimate the resulting losses in Egypt’s agricultural land and the corresponding impact on Egypt’s economy. Specifically, we examine losses/gains in economic variables such as agricultural sector output, real GDP per capita, consumption per capita, male and female employment (both in agriculture and economy-wide), and the cost of living.
It is worth mentioning that this study assumes that there is no mitigating strategy put in place by Egypt. Our estimates for environmental and economic impacts therefore represent the worst-case scenario in terms of losses generated by GERD. We would also like to note that, while this study focuses on Egypt, there are other downstream countries (Sudan) that would be impacted in various ways. Furthermore, Ethiopia is expected to benefit tremendously from GERD when the project takes off. It would constitute a significant source of power for the Ethiopian economy and is expected to bring employment and business opportunities. By some estimates, up to 12,000 new jobs would be created in the wake of GERD [
10]. These benefits would go a long way to improving the overall living standards in the country. Sudan’s accumulated GDP gains from GERD (2020—2060) are estimated between US
$ 27 billion and US
$ 29 billion relative to a baseline without the GERD [
11] The coverage of this study is therefore limited in terms of the overall impact of GERD.
2. Materials and Methods
In this multidisciplinary study, we investigate the environmental and economic impact of the GERD. In particular, we examine the effects of GERD on downstream water flows along the NRB, focusing on Egypt. We also assess the impact of the project on available agricultural land, agricultural production, and overall economic activity in Egypt. In carrying out this exercise, we first quantify the volume of projected losses in Egypt’s annual water allocation from the Blue Nile while taking into account specific reservoir filling periods that are currently under consideration. We then estimate the resultant losses in Egypt’s agricultural land and the corresponding impact on macroeconomic variables such as food production, food import and export, employment, the cost of living, real GDP per capita, and welfare. In order to provide a clearer presentation, we confine our study to three of the reservoir filling scenarios under consideration. Specifically, we examine losses under the 3, 7, and 10-year filling scenarios.
Figure 2 presents a flow diagram illustrating the sequence of events from water losses through economic losses.
2.1. Nile River Water Losses
The current Egypt annual Nile water allocation is estimated at 55 km
3. This volume will be significantly affected by the construction of the GERD reservoir, particularly by the reservoir volume and filling period. Media reports suggest different GERD reservoir volumes to be filled in different time periods, for example, filling 16, 63, 67, 70, and 74 km
3 in 3, 5, 7, 10, and 15 years. In this study, we simulate the Nile water losses attributed to filling the GERD reservoir volume of 74 km
3 over 3, 7, and 10 years. We calculate the volume by summing up the impoundment (filling) volume, infiltration losses, evapotranspiration losses, and climate change-related losses. Errors in the average annual water losses were calculated as the standard deviation of water losses in individual years.
Figure 3 and
Table 1 show the average annual losses in Egypt’s Nile water allocation as a function of the GERD filling scenarios.
Impoundment Volume: The annual impoundment volume was calculated by dividing the GERD reservoir volume (74 km3) by the number of years in each filling scenario. We assumed a constant yearly filling volume for each filling scenario.
Infiltration Losses: Given the lack of infiltration information at the GERD site, we used the infiltration rate of the High Aswan Dam reservoir (e.g., Lake Nasser;
Figure 1a). The Lake Nasser infiltration rate was estimated at 2% of the lake volume [
12].
Evapotranspiration Rate: The evapotranspiration rate at the Roseries reservoir (90 km downstream from GERD) was used in this study. This rate was estimated at 2000 mm/yr [
13]. We also accounted for an 8.3% increase in evapotranspiration rates, predicted in different climatic models [
14]. The final evapotranspiration rate used in this study is 2166 mm/yr. The evapotranspiration volume was calculated by multiplying the rate by the area of the GERD reservoir (1770 km
2). The GERD reservoir area was calculated using a 30 m digital elevation model (DEM) extracted from the Shuttle Radar Topography Mission (SRTM) for the UBN sub-basin (
Figure 1b) [
4]. Knowing the GERD reservoir volume (74 km
3), the water height could be estimated using ArcGIS tools, yielding a raster with the shape of the final reservoir. This raster was then used to calculate the reservoir area at each filling stage.
Climate Change Losses: We use the average annual rainfall rates over the UBN sub-basin to calculate the rainfall/discharge ratio. This ratio was then used to calculate the loss in discharge rates as a result of climate changes. The Global Precipitation Climatology Project (GPCP) rainfall data was used to calculate the average annual rainfall for the UBN sub-basin during the period from 1979 to 2020. An annual discharge rate of 48.9 km
3 was reported at El Diem station (located right above the GERD location). Using this rate, the discharge to rainfall ratio was calculated at 28%. We accounted for a 5.5% decrease in rainfall rates, predicted from different climatic models [
14]. The corrected average annual discharge rate was estimated at 46.21 km
3.
2.2. Losses in Agricultural Land
The loss in downstream water flows constitutes a significant shock to Egypt’s agricultural land by rendering a significant part of an otherwise fertile land less suitable for farming and other agricultural activities. We estimate the losses in agricultural land by using the conversion rates published by Abdelhaleem and Helal, [
15]. In their work, they calculate the average loss in agricultural land for Upper Egypt as follows:
For middle Egypt and Nile Delta, they use the following formula:
We averaged estimates from Equations (1) and (2) in order to calibrate the losses in agricultural land for all of Egypt that are attributable to GERD. Errors in the average annual losses in agricultural lands were calculated as the standard deviation of land losses in individual years.
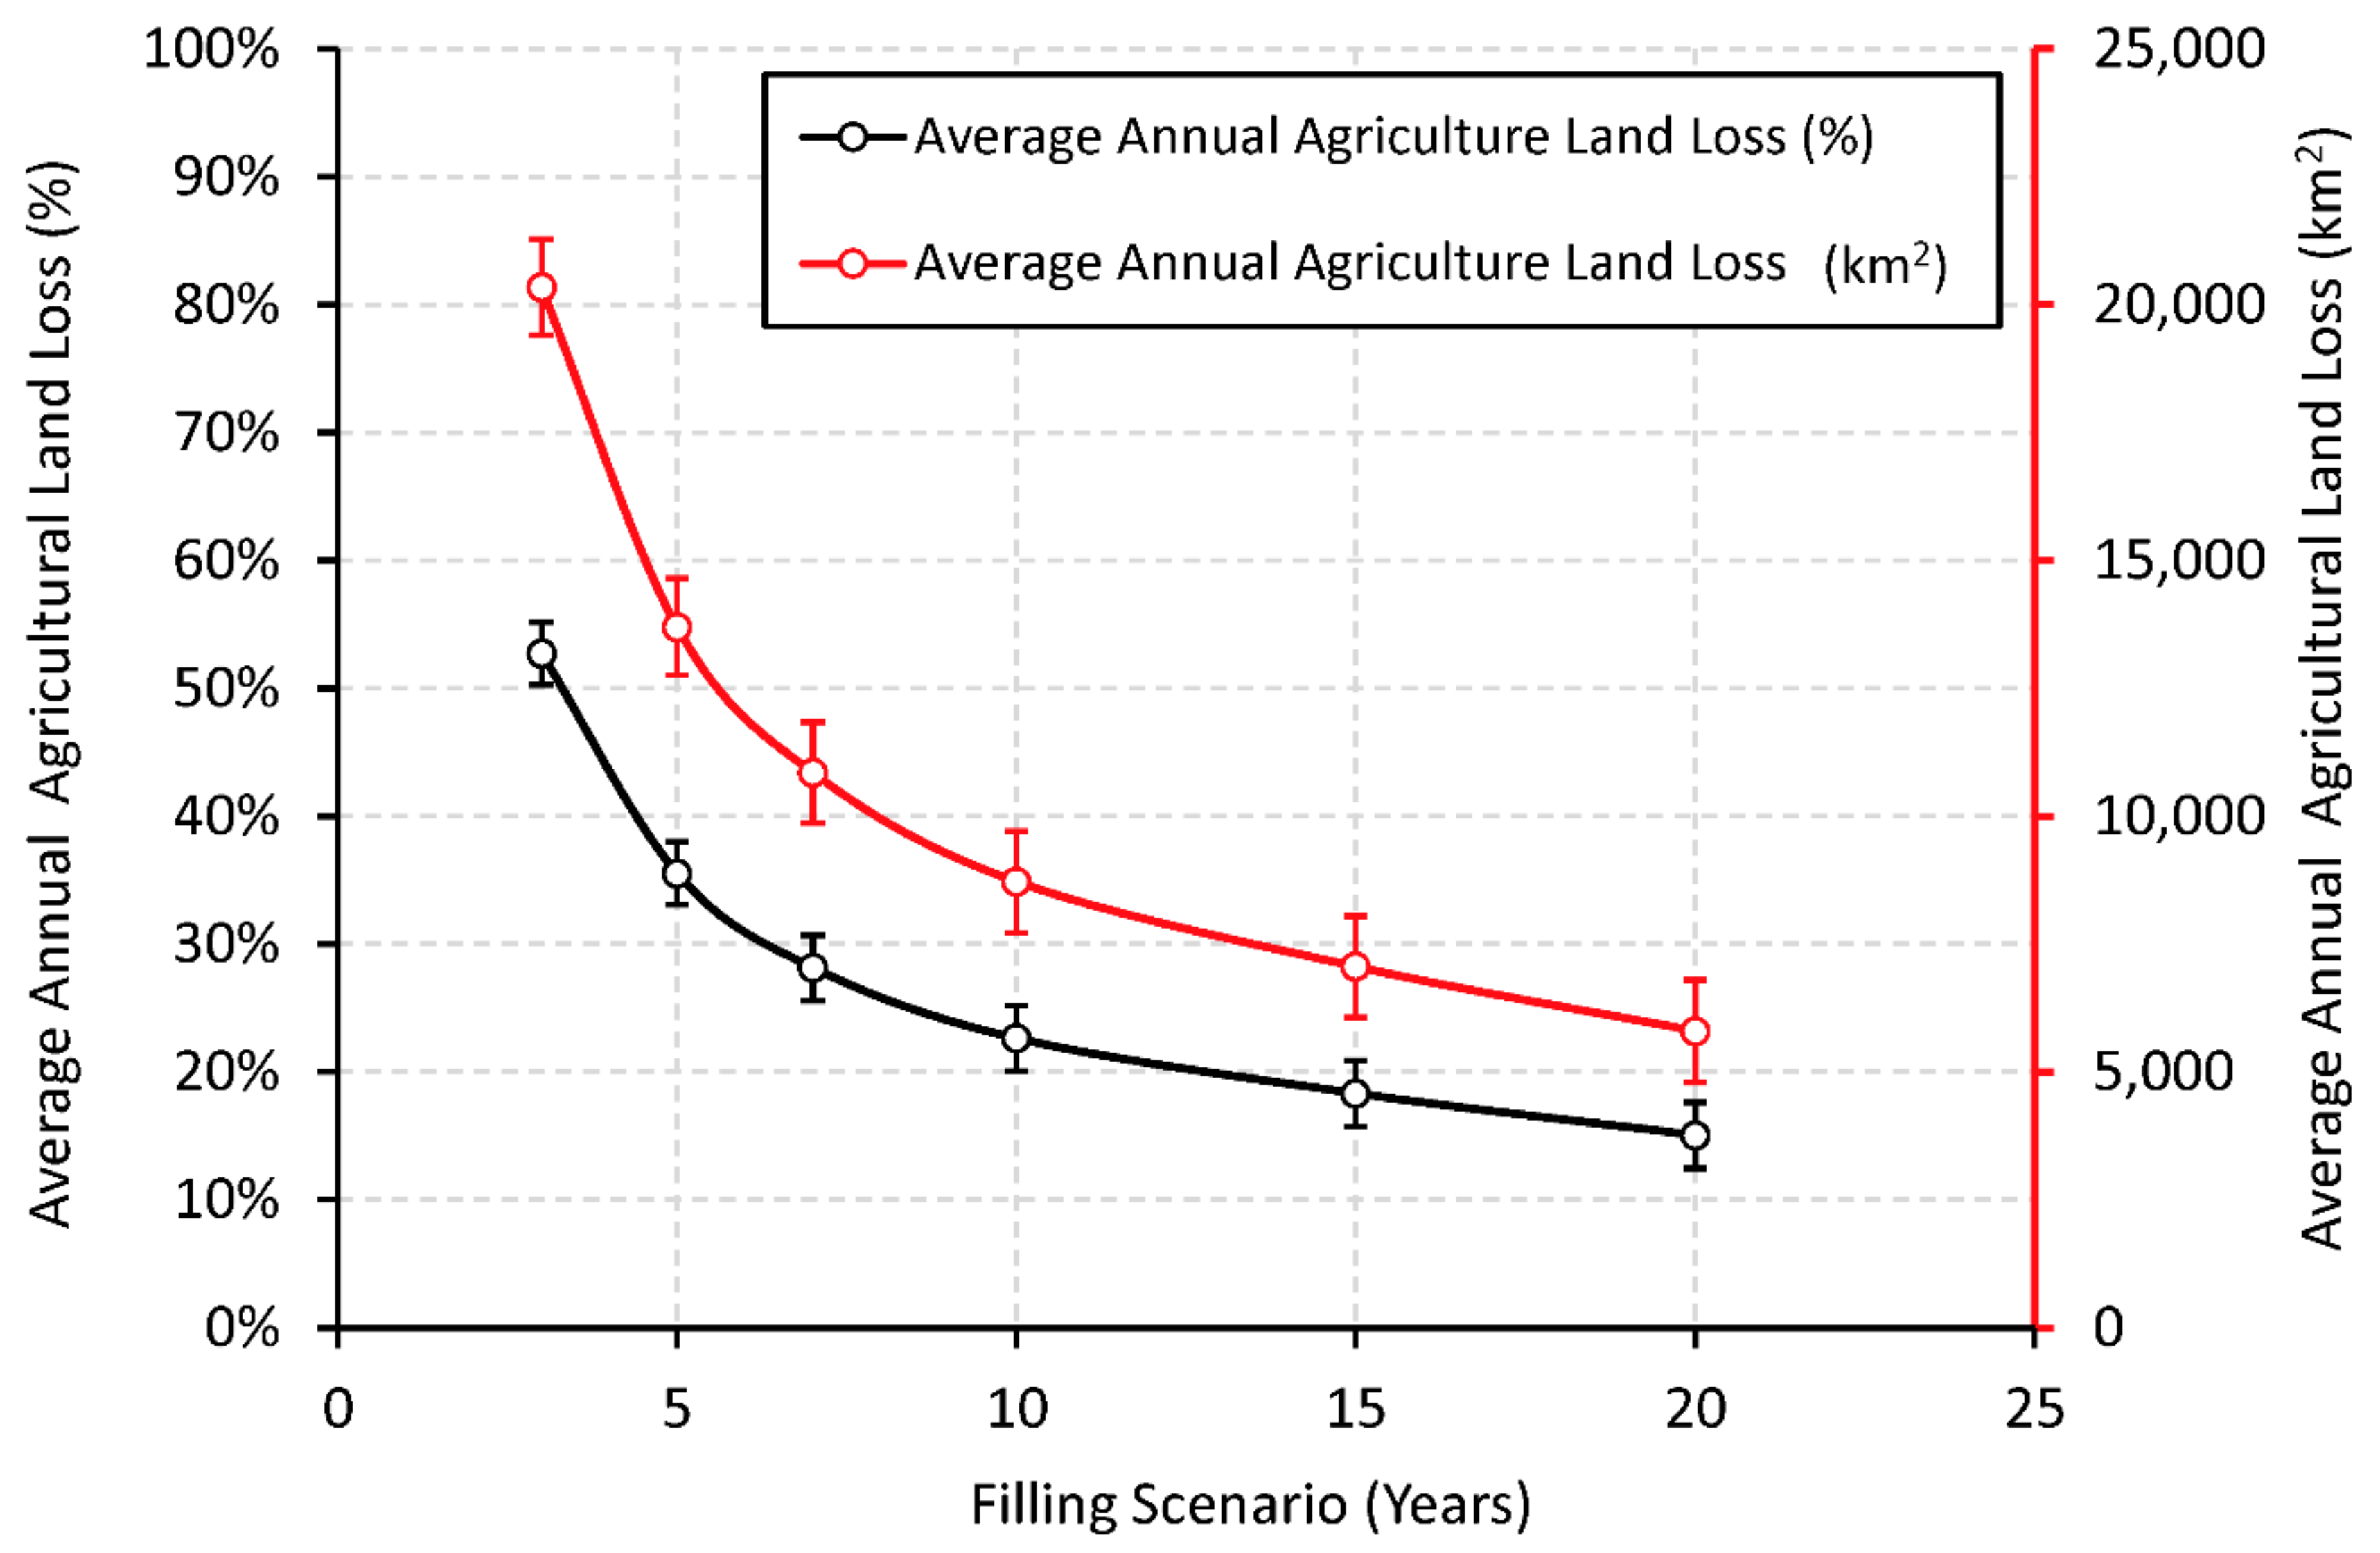
Figure 4 and
Table 1 present projected annual losses in Egypt’s agricultural land as a function of the filling period (in years).
2.3. Impact on Egypt’s Economy
Having estimated the losses in Egypt’s water allocation under the alternative filling scenarios (e.g., 3, 7, and 10-year filling scenarios) and the corresponding losses in agricultural land, we then look at mechanisms through which this affects Egypt’s economy. In particular, we analyze the effects of GERD on Egypt’s agricultural sector output, employment in the agricultural sector, food import, and food export. We also look at the impact of this project on Egypt’s real GDP and cost-of-living. In order to carry out this analysis, we first build an empirical framework to forecast trends in the selected economic variables (baseline model). We then examine deviations from these trends caused by the shocks from GERD under the alternative filling scenarios.
2.3.1. Baseline Model Structure
The quantitative framework for trend analysis builds on a Vector Auto Regressive (VAR) model, presented in the general form as follows:
where
Yt is an
LX1 vector of endogenous variables,
β is an
LXLp matrix of coefficients, and
ϵt is an
LX1 vector of white noise. Given the number of lags
p, the companion matrix
β is given as follows:
In order to determine the appropriate number of lags, we carry out fitness tests based on the Akaike’s Information Criterion (AIC) [
16], Schwarz’s Bayesian Information Criterion (SBIC) [
17], and the Hannan and Quinn Information Criterion (HQIC) [
18]. We then set
p based on the selection order criteria for the system (
Appendix A). We also test for stationarity by examining the eigenvalue stability conditions of the companion matrix, thereby ensuring that all the eigenvalues lie within the unit circle [
17]. Moreover, we follow-up with a Johansen test for cointegration to gauge if there is a long-run relationship between the series [
19]. We then employ vector error correction procedures [
19] where appropriate (
Appendix A).
Given this multivariate VAR framework, we then map out expected values of the system
n periods ahead recursively [
20]. Based on the availability of data up to period
t, we can forecast for periods (
t + 1), (
t + 2), and (
t +
n) as follows, respectively:
2.3.2. Baseline Model Inputs
We use annual data from the World Development Indicator (WDI) database published by the World Bank [
21]. The data spans a 50-year period, from 1970 through 2019. In setting up the variables in the system, we follow [
22]. The full set of variables in the system are ordered as follows:
The variable “agricultural land”, which is measured in squared kilometers, is the share of land area that is arable and used for permanent crops and permanent pastures. The variable “food production” refers to the production index of food crops that are considered edible and nutritious. The variables “food import” and “food export” are, respectively, the share of import and export of food items (as defined by Standard International Trade Classification (SITC) sections 0, 1, 4, and SITC division 22) in total merchandise trade. The variable “female agric. employment” represents the share of the female labor force employed in the agricultural sector. Likewise, “male agric. employment” is the share of the male labor force engaged in the agricultural sector. When appropriate, we substitute these two employment variables for a single variable termed “agric. sector employment”, which represents the share of Egypt’s total labor force that is employed in the agricultural sector. Similarly, we substitute food production for “agricultural sector output”, which sums up the value added of agriculture, forestry, and fisheries. We note that the term “agricultural sector output” and “agricultural production” are used interchangeably in this paper. Moreover, consumption per capita, investment per capita, real GDP per capita, CPI inflation, and unemployment rate are as defined in standard literature. Although the data generally spans from 1970 to 2019, we do acknowledge missing entries in some of the series, especially for the earlier part of the period. We therefore make adjustments as we see appropriate (
Appendix A).
2.3.3. The Transmission of GERD in the Macroeconomy
The loss in Egypt’s available agricultural land due to the construction of GERD is expected to cause significant disruption in the supply of food and other agricultural products, which will have significant ramifications for the broader economy. To examine the extent of this disruption, we first carry out sensitivity analysis where we examine the responses of selected economic variables to changes in available agricultural land. We then use the estimated elasticity coefficients and the projected losses in available agricultural land (
Table 1) to map out the potential losses/gains in the economic variables under the alternative filling scenarios.
First, we estimate the elasticity coefficients for agricultural sector output and food production in response to changes in the size of agricultural land. The quantitative frameworks for estimating these elasticities are given as follows, respectively:
where the variables
ln_AgriYt and
ln_Food−Prodt represent Egypt’s agricultural sector output and food production in logs, respectively, whereas
ln_Agrilandt represents the size of Egypt’s agricultural land, also in logs.
βY and
βF are then the elasticity coefficients between agricultural sector output and food production on the one hand, and Egypt’s available agricultural land on the other hand, respectively.
XY,t and
XF,t are vectors of other independent variables (in logs) which include Egypt’s population, private investment, and private consumption. Given the composition of variables in Equations (9) and (10), we conduct model fitness tests through a Variance Inflation Factor (VIF) analysis. The VIFs and the associated tolerance levels (not shown) suggest the presence of multicollinearity. To correct for this, we drop private investment and consumption from (9) and (10). This confines
XY,t and
XF,t to the size of Egypt’s population.
Moreover, a Breusch–Pagan (BP) test [
23] reveals that the baseline model is not robust to heteroscedasticity (with a reported chi-square statistic and
p-value equal to 13.66 and 0.0002, respectively). We therefore employ robust cluster procedures in order to obtain estimates that are consistent even in the face of the heteroscedasticity. Estimating Equations (9) and (10) yields
βY = 0.33 and
βF = 0.73, which are both statistically significant at the 1% level. Having obtained the elasticity coefficients for agricultural sector output and food production, we then regress other macroeconomic variables on agricultural sector output in order to obtain the elasticity coefficients for these variables with respect to agricultural production.
3. Results and Discussion
3.1. Losses in Egypt’s Water and Agricultural Land
Figure 3 and
Table 1 show the relationship between average annual losses in Egypt’s Nile water allocation and GERD filling scenarios. Given the GERD reservoir volume of 74 km
3, we estimate losses in Egypt’s annual water allocation to be 51.29 ± 2.62%, 24.75 ± 2.76%, and 18.78 ± 2.76% for the 3, 7, and 10-year filling scenarios, respectively. The nature and extent of the loss depends on the length of time it takes for Ethiopia to fill the reservoir. Losses that emanate from shorter filling horizons are expected to be more severe on impact, but less persistent, whereas losses from longer filling horizons are expected to be relatively less severe on impact, but drag on for longer periods.
Egypt will lose 52.75 ± 2.44%, 28.14 ± 2.56% and 22.61 ± 2.58% of their agricultural land, relative to the baseline, for the 3, 7 and 10-year filling scenarios, respectively (
Figure 4;
Table 1). The losses in agricultural land presented in
Figure 4 and
Table 1 are calibrated under the assumption that there is no mitigating strategy in place by the government of Egypt. These estimates therefore represent the worst-case scenario in terms of losses in agricultural land. In subsequent studies, we plan to extend the analysis to include various mitigation strategies that are likely to be implemented by the government of Egypt.
3.2. Projected Trends in Selected Economic Variables: Baseline Model
Table 2 presents a numerical summary of projected trends in selected variables in a baseline (no GERD) scenario over a 3-year period. In this scenario, Egypt’s agricultural sector output is projected to grow at an average annual rate of 2.27 ± 0.71% for the next 3 years, with minimum growth expected to be 1.47% and maximum to be 2.83%. Moreover, consumption per capita, which is a measure of overall welfare to some extent, is projected to grow at an annual rate of 4.74 ± 2.12% in the 3-year horizon.
In addition, real GDP per capita is projected to grow at an average annual rate of 2.38 ± 1.65%. This translates into an average annual growth in real GDP of 4.51 ± 1.65%, with minimum growth in the 3-year horizon projected to be 3.43% and a maximum 6.41%. Real GDP growth rate in Egypt pre-pandemic was estimated to be 5.6%. This declined to 3.6% during the fiscal year 2019/2020, following the COVID-19 shocks. However, the World Bank projects that, assuming vaccines are steadily rolled out through 2021 and early 2022, Egypt will start regaining its pre-pandemic growth momentum by the fiscal years 2021/2022/2023 [
8]. Similarly, the IMF projects Egypt’s GDP growth to ramp up from 2.5% in 2021 to 5.8% by the year 2025 [
24]. This puts our estimates of real GDP growth right within the range projected by both the World Bank and the IMF. In what follows, we examine deviations from these trends arising from GERD under the alternative feeling scenarios.
3.3. Effects of GERD on Egypt’s Macroeconomy
Table 3 summarizes results of this quantitative exercise (
Appendix B). First, consider the top panel of
Table 3. The results show that a 1 standard deviation (SD) increase in agricultural land translates into a 0.33 SD increase in the value of agricultural output overall, and a 0.73 SD increase in food production in particular. This provides a channel for GERD to manifest in Egypt’s agricultural sector, with implications for the entire economy.
For transmission into the broader economy, we look at the coefficients in the bottom panel (Panel b;
Table 3). The coefficients in this panel represent the sensitivity of the featured variables to changes in agricultural sector production. Following a 1 SD increase in agricultural sector output, food import declines by 0.49 SD. This also causes an increase of 0.94 SD in food export. As expected, female employment, male employment, and total employment in the agricultural sector respond positively to output in this sector. CPI inflation, on the other hand, declines in response to an increase in agricultural sector output. Moreover, real GDP per capita and consumption per capita increase by 0.46 and 0.73 SD, respectively, in response to a 1 SD increase in agricultural sector output.
Having established the transmission channel for losses in agricultural land in the economy, we now look at the impact of GERD on specific macroeconomic variables under the alternative filling scenarios. Using the elasticity coefficients (
Table 3) and the expected losses in agricultural land (
Table 1 ), we estimate the projected losses/gains in the variables for the alternative reservoir filling scenarios. We also trace out the expected deviations in these variables from trends in the baseline scenario.
3.3.1. GDP, the Cost of Living, and Welfare
We start by examining the overall impact of GERD on agricultural sector output, real GDP per capita and consumption per capita. We also examine the impact of GERD on the overall cost of living, as measured by CPI inflation.
Figure 5 presents projected trends in these variables for both GERD and non-GERD (baseline) scenarios. A few comments are in order. First, in the baseline scenario, agricultural output, GDP per capita, and consumption per capita are projected to continue trending upwards for the next few years, with projected average annual growths of 2.27 ± 0.71%, 2.38 ± 1.65% and 4.74 ± 2.12%, respectively, over the next 3 years (
Table 2). Overall, the recent swings in CPI inflation are expected to continue in the next few years. For a 3-year horizon, however, this variable is expected to continue a downward trend.
The implementation of GERD is projected to cause disruptions in these economic trends to various degrees depending on the filling scenario. As shown in the top panel of
Table 4, the projected annual losses in agricultural sector output due to GERD are estimated to average 17.51 ± 0.99%, 9.34 ± 0.92%, and 7.50 ± 0.90% under the 3, 7, and 10-year filling scenarios, respectively, relative to the baseline (
Figure 5a). This also translates into annual losses in real GDP per capita of 8.02 ± 0.45%, 4.28 ± 0.42%, and 3.44 ± 0.41%, respectively (
Figure 5b). The projected loss in GDP per capita under the 3-year scenario is in line with the findings by Heggy et al. [
9]. In a study that relies on growth rate projections by the World Bank [
25], they also find that implementing GERD in a 3-year span would contribute to losses in GDP per capita by approximately 8%. Moreover, as shown in the bottom panel of
Table 4, the projected losses in real GDP per capita amount to annual losses in real GDP of
$26.30 ± 2.81 billion,
$15.70 ± 3.04 billion, and
$13.40 ± 3.11 billion, respectively. For agricultural sector output, this amounts to annual losses equivalent to
$6.99 ± 0.58 billion,
$3.96 ± 0.61 billion, and
$3.32 ± 0.65 billion, under the 3, 7, and 10-year filling scenarios, respectively.
The disruptive effects of GERD also lead to losses in welfare, as defined by the decline in consumption per capita, of up to 12.83 ± 0.73% relative to the baseline, while augmenting the cost of living in Egypt to various degrees depending on the reservoir filling scenario (
Figure 5c,d). Under the 3-year scenario for example, CPI inflation is projected to rise 9.38 ± 4.38 percentage points above the baseline (
Figure 5d). For the 7-year and 10-year scenarios, the projections are 4.70 ± 1.66 and 5.07 ± 2.75 percentage points higher than the baseline, respectively (
Figure 5d).
3.3.2. Food Production, Food Import, and Food Export
We now look at the impact of GERD on food production, food imports, and food exports.
Figure 6 presents projected trends in these variables in both GERD and the baseline (no GERD) scenarios. A numerical summary of these trends is presented in
Table 5.
In the baseline scenario, the graph shows a generally upward trend in the index of food production. With GERD, however, food production declines significantly, with the shorter filling scenarios constituting larger shocks to this variable (
Figure 6a). Under the 3-year filling scenario, GERD is projected to cause an average annual loss in food production of 38.47 ± 2.18% relative to the baseline scenario (
Table 5). For the 7-year and 10-year filling periods, the corresponding average annual losses are 20.53 ± 2.02% and 16.49 ± 1.98%, respectively. To partially compensate for the shortage in domestic food production, food import, as a share of total merchandise import, is expected to rise by 8.56 ± 0.49%, 4.57 ± 0.45%, and 3.67 ± 0.44% annually relative to the baseline, depending on the filling scenario (
Figure 6b). Compared to food import, food export is projected to decline more dramatically, with the 3-year filling scenario causing an annual decline of 16.50 ± 0.94% relative to the baseline scenario (
Figure 6c;
Table 5).
3.3.3. Trends in Employment
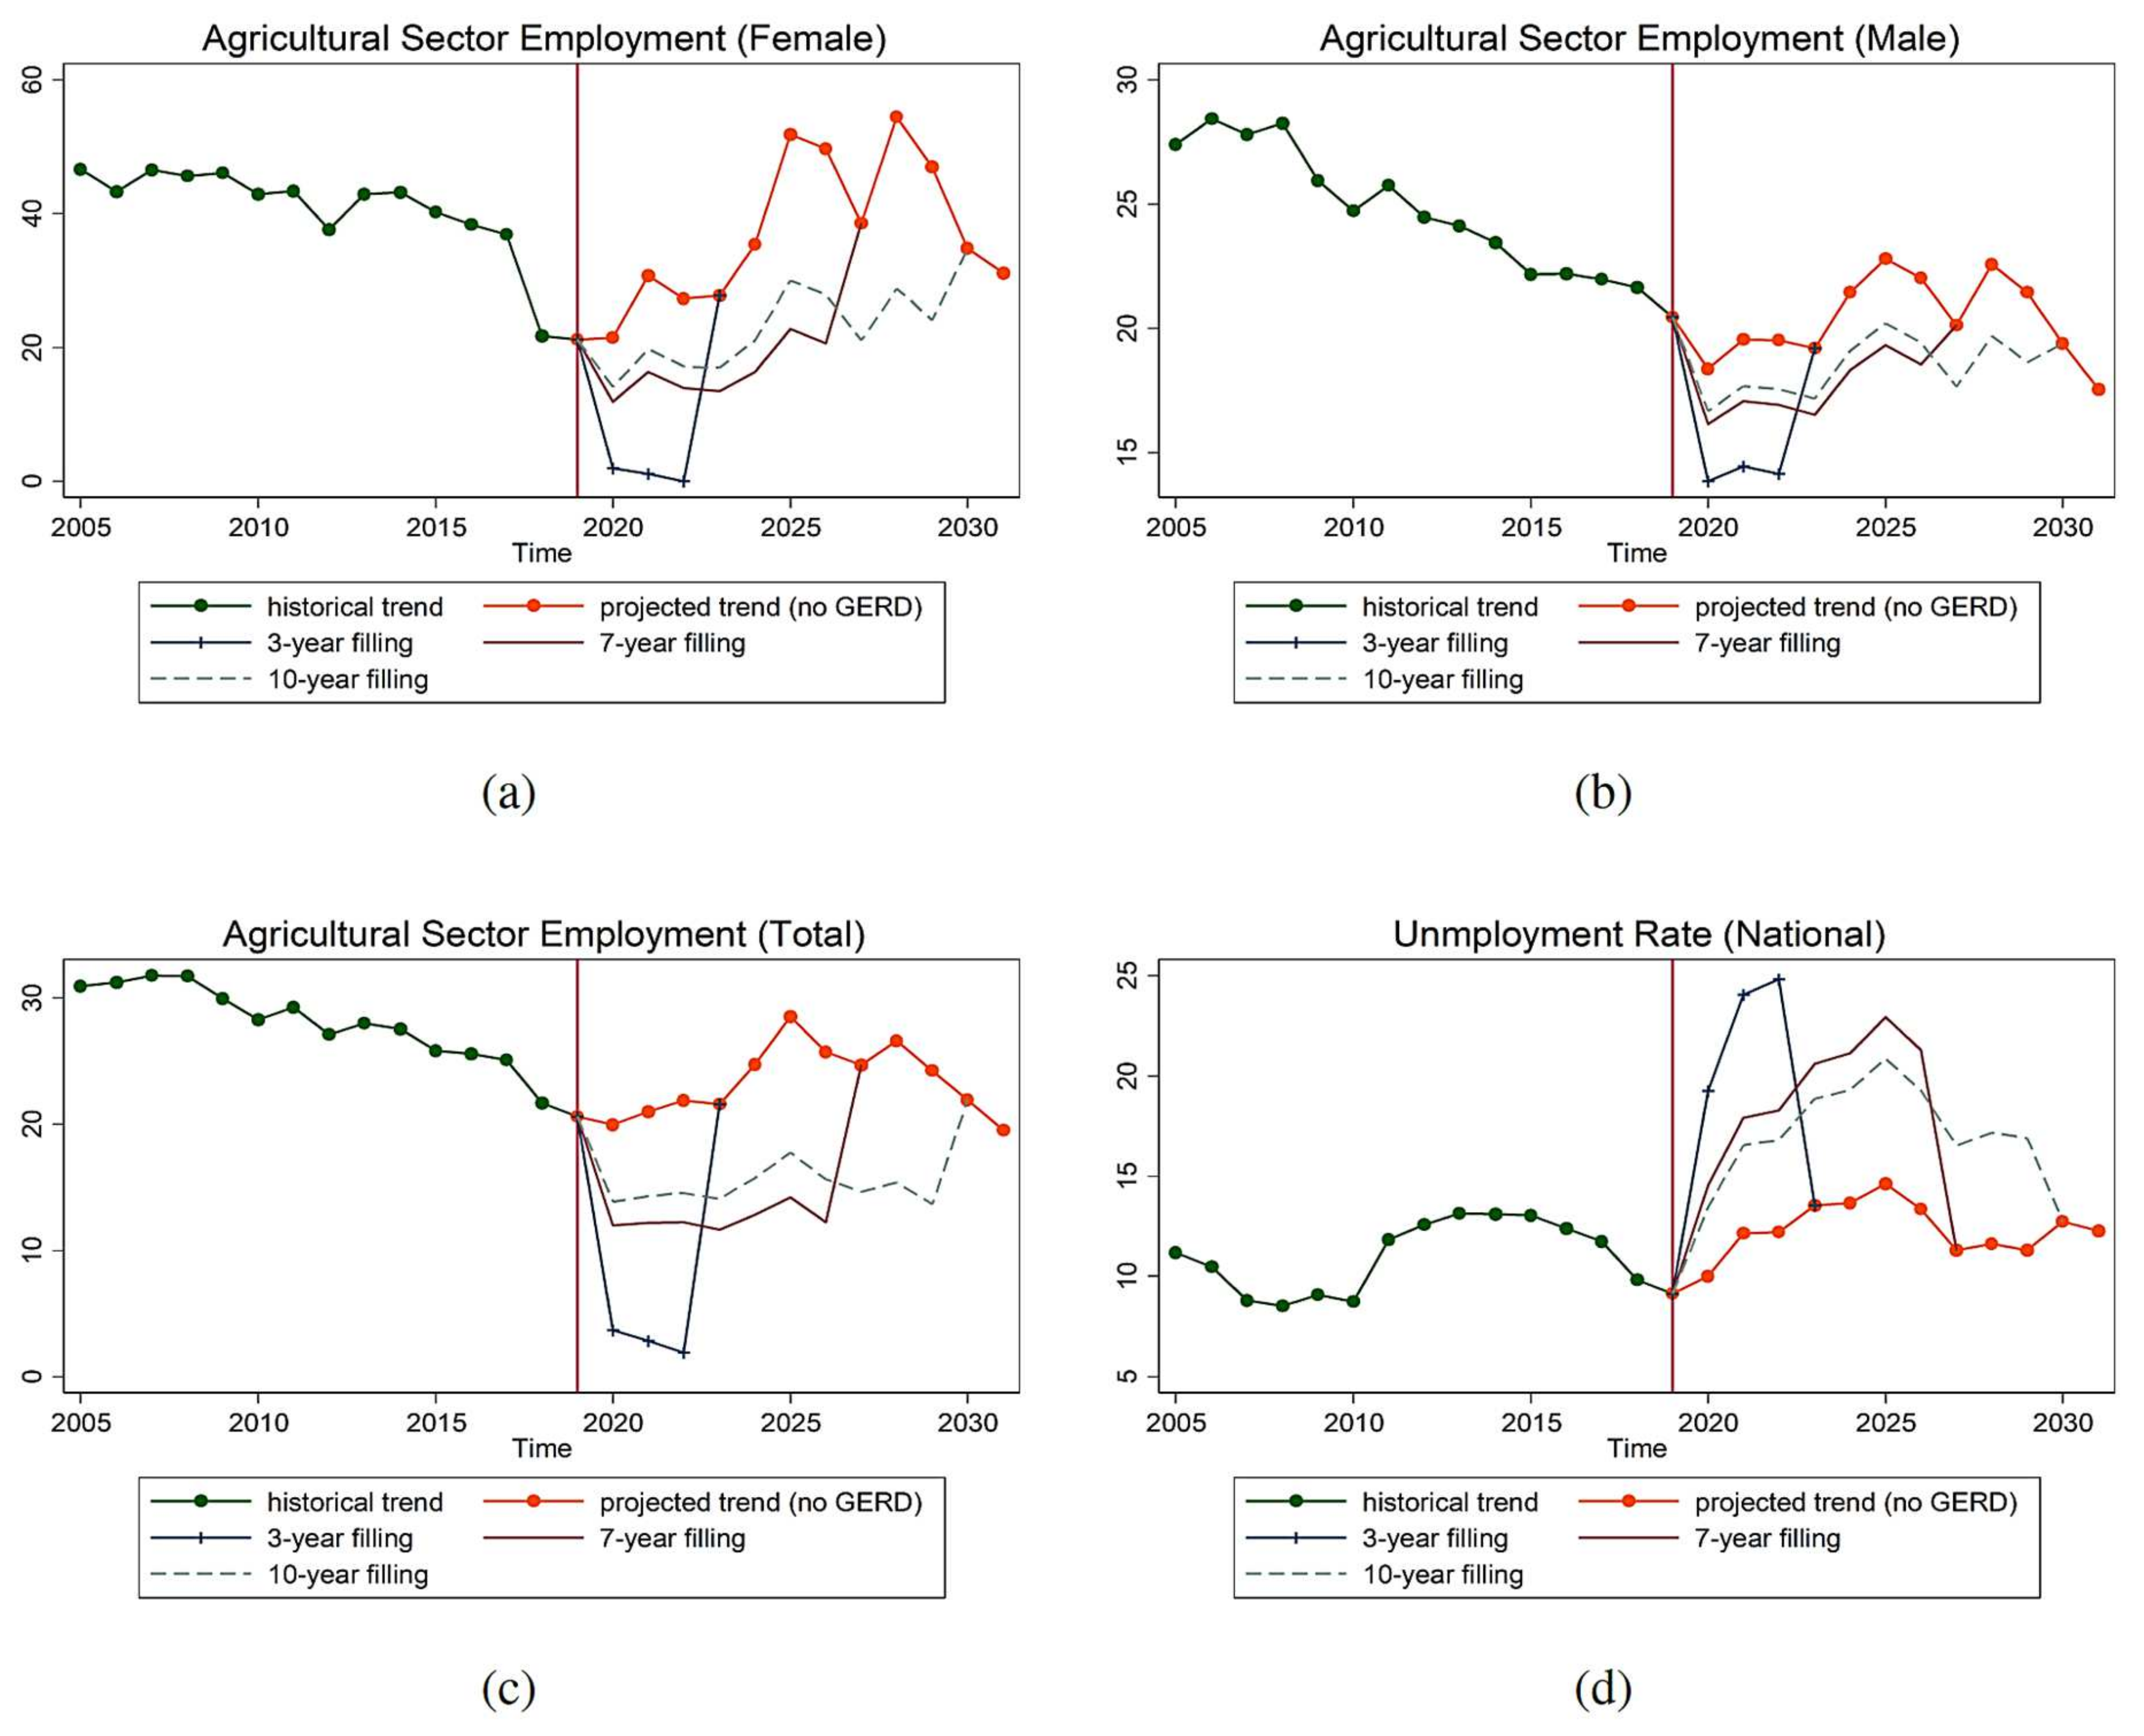
In this part, we focus on employment trends with and without GERD. Specifically, we examine the impact of GERD on employment in the agricultural sector by gender and how that translates into overall national unemployment numbers.
Figure 7 presents projected trends in employment for both GERD and the baseline scenarios.
In the baseline scenario, the share of female workers engaged in agricultural activity is projected to trend upwards in the next few years, with noticeable swings in the short run (
Figure 7a). A similar trend is projected for the share of male employment in the agricultural sector (
Figure 7b). Not surprising, the share of the labor force engaged in the agricultural sector as a whole inherits the properties of these two series.
With the implementation of GERD, both male and female employment in the agricultural sector is projected to drop drastically, with female employment suffering significantly higher losses than that of male (
Figure 7a,b). As shown in
Table 6, the share of female workers in the agricultural sector is expected to decline by 25.48 ± 5.32 percentage points annually under the 3-year filling scenario relative to the baseline. For male workers, the losses are projected to be 5.00 ± 0.44 percentage points below the baseline. These translate into a total loss of 18.10 ± 1.85 percentage points in the share of the labor force engaged in the agricultural sector (
Figure 7c), thereby contributing to the national unemployment rate of 11.24 ± 1.77 percentage points (
Figure 7d). This is also consistent with the findings in Heggy et al. [
9] amid the differences in methods.
4. Conclusions
In this multidisciplinary study, we investigate the environmental and economic impact of the GERD. We do so by quantifying the volume of projected losses in Egypt’s annual water allocation from the Blue Nile, focusing on the 3, 7, and 10-year reservoir filling scenarios that are part of the array of scenarios currently under consideration. We then estimate the resultant losses in Egypt’s agricultural land and the corresponding impact on macroeconomic variables such as food production, food import and export, employment, the cost of living, real GDP per capita and general welfare.
Given the GERD reservoir volume of 74 km3, we estimate losses in Egypt’s annual water allocation be 51.29 ± 2.62%, 24.75 ± 2.76% and 18.78 ± 2.76% for the 3, 7 and 10-year filling scenarios, respectively. These translate into projected annual losses in agricultural land of 52.75 ± 2.44%, 28.14 ± 2.56%, and 22.61 ± 2.58% relative to the baseline scenario. Under the 3-year filling scenario, these losses lead to an average annual decline in food production of 38.47 ± 2.18% relative to the baseline, leading to a rise in food import by 8.56 ± 0.49% and a corresponding decline in food export of 16.50 ± 0.94%. With regards to overall agricultural sector output, the losses are projected to be 17.51 ± 0.99% annually for the 3-year filling period relative to the baseline. Moreover, the decline in the supply of food and other agricultural raw materials leads to a rise in the overall cost of living (CPI inflation) by 9.38 ± 4.38 percentage points above the baseline.
Furthermore, with GERD, both male and female employment in the agricultural sector is projected to drop drastically, with female employment suffering significantly higher losses compared to male employment. Specifically, the share of female workers engaged in the agricultural sector is expected to decline by 25.48 ± 5.32 percentage points annually below the baseline under the 3-year filling scenario. For male workers, the losses are projected to be 5.00 ± 0.44 percentage points below the baseline. These translate into a total decline of 18.10 ± 1.85 percentage points in the share of labor force engaged in the agricultural sector, thereby contributing to a rise in the national unemployment rate of 11.24 ± 1.77 percentage points. Moreover, we estimate the projected annual losses in real GDP per capita to be 8.02 ± 0.45%, 4.28 ± 0.42%, and 3.44 ± 0.41% for the 3, 7, and 10-year scenarios, respectively. These translate into annual losses in Egypt’s real GDP of $26.30 ± 2.81 billion, $15.70 ± 3.04 billion, and $13.40 ± 3.11 billion, respectively, leading to overall welfare losses, defined as the decline in consumption per capita, by 12.83 ± 0.73%, 6.85 ± 0.67%, and 5.50 ± 0.66%, respectively.
There are a few caveats that we would like to reiterate. First, we carried out this study under the assumption that there are no mitigating strategy in place by the government of Egypt. Therefore, these estimates represent the worst-case scenario in terms of losses generated by GERD. In subsequent studies, we plan to extend the analysis to include various mitigation strategies that are likely to be implemented by the government of Egypt. We would also like to note that, while this study focuses on Egypt, there are other downstream countries (Sudan) that would be impacted in various ways. Furthermore, Ethiopia is expected to benefit tremendously from GERD when the project takes off. It would constitute a significant source of power for the Ethiopian economy, and is expected to bring employment and business opportunities. These benefits would go a long way to improving the overall living standards in the country. The coverage of this study is therefore limited in terms of the overall impact of GERD.
We also assume that the GERD reservoir will be filled gradually under a constant filling rate (fixed water amount per year). This constitutes a departure from reality, since Ethiopia will be filling the reservoir using “phase” mechanisms. For example, in each filling phase, they would add a certain volume of water to the reservoir for which the filling rate might not be constant from year to year. Moreover, we assume full recovery in Egypt’s water allocation following the end of reservoir filling. We assume the same for the subsequent loss in agricultural land. However, we acknowledge that recovery may take longer, and in the case of agricultural land, the loss in productivity may not be fully recoverable. These shortfalls likely limit the robustness of our results. In spite of this, the results provide some useful insights into the real-world consequences of GERD.
Author Contributions
Conceptualization, A.K. and M.A.; methodology, A.K. and M.A.; software, A.K., M.A., and A.B.; validation, A.K. and M.A.; formal analysis, A.K., M.A., and A.B.; investigation, A.K., M.A., and A.B.; resources, A.K. and M.A.; data curation, A.K., M.A., and A.B.; writing—original draft preparation, A.K., M.A., and A.B.; writing—review and editing, A.K. and M.A.; visualization, A.K. and M.A.; supervision, A.K. and M.A.; project administration, A.K. and M.A.; funding acquisition, A.K. and M.A. All authors have read and agreed to the published version of the manuscript.
Funding
This research was funded by the Division of Research and Innovation at Texas A&M University—Corpus Christi, grant number 282625-21010.
Institutional Review Board Statement
Not applicable.
Informed Consent Statement
Not applicable.
Data Availability Statement
Acknowledgments
We would like to thank the Division of Research and Innovation at Texas A&M University—Corpus Christi for providing funding through the Research Enhancement Program for this research.
Conflicts of Interest
The authors declare no conflict of interest.
Appendix A. The VAR System
The time span for the series is from 1970 to 2019. However, some of the variable in the system have missing entries that are significant. For example, variables for agricultural sector employment including that for male, female, and combined are only available from 1991 through 2019. Likewise, the entries for unemployment rate are spotty, especially in the earlier part of the series. We therefore make adjustments by excluding these variables where we see appropriate.
Model 1: In order to obtain the projected values for agricultural sector output, consumption per capita, real GDP per capita, and real GDP, we use the following system of variables:
We carry out a fitness test based on the Akaike’s Information Criterion (AIC), Schwarz’s Bayesian Information Criterion (SBIC), and the Hannan and Quinn Information Criterion (HQIC). We set
p = 5 based on the selection order criteria. We also test for stationarity by examining the eigenvalue stability conditions of the companion matrix. The results show that all the eigenvalues lie inside the unit circle. However, a Johansen tests for cointegration fails to support the absence of long run relationships between the series (with a reported rank = 4). We therefore estimate both the short run VAR model and a long run Vector Error Correction Model (VECM). Results generated by the VAR model are reported in
Table 2 and
Table 4, with graphs in
Figure 5 (in the main text). Predictions based on the VECM estimation are presented in
Table A1 and
Table A2.
Table A1.
Projected average annual growth (%) in selected variables in a baseline (no GERD) scenario over the next 3-year period based on VECM estimates.
Table A1.
Projected average annual growth (%) in selected variables in a baseline (no GERD) scenario over the next 3-year period based on VECM estimates.
| Variable | Mean | St. Dev. | Lower Limit | Upper Limit |
|---|
| agricultural output (value added) | 3.35 | 0.17 | 3.16 | 3.48 |
| consumption per capita | 3.10 | 2.10 | 1.27 | 5.39 |
| real GDP per capita | 4.48 | 0.71 | 3.96 | 5.29 |
| real GDP | 6.61 | 0.71 | 6.09 | 7.42 |
Table A2.
Losses/gains in agricultural sector output, real GDP per capita and consumption per capita relative to the baseline (no GERD) scenario based on VECM estimates.
Table A2.
Losses/gains in agricultural sector output, real GDP per capita and consumption per capita relative to the baseline (no GERD) scenario based on VECM estimates.
| (a) Average Annual Losses/Gains (%) Relative to the Baseline (no GERD) Scenario |
| Variable | 3-Year Filling | 7-Year Filling | 10-Year Filling |
| Agricultural output (value added) | −17.51 | −9.34 | −7.50 |
| Real GDP per capita | −8.02 | −4.28 | −3.4 |
| Consumption per capita | −12.83 | −6.85 | −5.50 |
| (b) Approximate Dollar Equivalent in Annual Losses/Gains (Billion $) |
| Variable | 3-Year Filling | 7-Year Filling | 10-Year Filling |
| Agricultural output (value added) | −7.18 | −4.13 | −3.51 |
| Real GDP | −27.70 | −17.00 | −15.20 |
Model 2: In projecting values for food production, food import, and food export, we substitute the variable “agricultural sector output” for the variable “food production”, in which case we set
p = 4 bases on the selection order criteria. The resultant system also satisfies stability conditions. However, like the preceding system, a Johansen test for cointegration fails to support the absence of cointegration (with a reported rank = 3). Estimating this system via VAR generates the values in
Table 4 and
Figure 6 (in the main text). Results of the VECM estimates are presented in
Table A3.
Table A3.
Average annual losses/gains (%) in food production, food imports, food exports, and CPI inflation relative to the baseline scenario based on VECM estimates.
Table A3.
Average annual losses/gains (%) in food production, food imports, food exports, and CPI inflation relative to the baseline scenario based on VECM estimates.
| Variable | 3-Year Filling | 7-Year Filling | 10-Year Filling |
|---|
| Food production | −38.47 | −20.53 | −16.49 |
| Food imports | 8.56 | 4.57 | 3.67 |
| Food exports | −16.50 | −8.80 | −7.07 |
Model 3: For agricultural sector employment variables (with a shorter time span from 1991 to 2019), the unemployment rate, and CPI inflation, we use the full set of variables, while acknowledging the limitations of the data. The resultant system is given as follows:
For this system, we set
p = 3 based on the selection order criteria. We also confirm stationarity of this system by examining the eigenvalue stability conditions of the companion matrix. The Johansen test in this case supports the absence of cointegration. Estimating this system leads to the values that are reported in
Table 6, with graphs plotted in
Figure 7 (in the main text).
Appendix B. Elasticity
In
Section 2.3.3, we presented a framework for estimating elasticity coefficients in agricultural sector output and food production given changes in available agricultural land. We now present a framework for obtaining elasticity coefficients for the other macroeconomic variables. This is given in the general form as follows:
where
is the log of the dependent variable of interest and
is the log of agricultural sector output.
is a vector of other control variables, also in logs. The constant β is then the elasticity coefficient for the variable
with respect to changes in agricultural sector output.
Table A4 summarizes the methods for estimating these coefficients, which are reported in
Table 3 (in the main text).
Table A4.
Summary of methods for obtaining elasticity coefficients for selected variables with respect to agricultural sector output.
Table A4.
Summary of methods for obtaining elasticity coefficients for selected variables with respect to agricultural sector output.
| | Estimator | | p-Value |
|---|
| Food import | - agric. sector output | OLS, vce cluster by time | −0.49 | 0.001 |
| | - exchange rate | | | |
| Food export | - agric. sector output | OLS, vce cluster by time | 0.94 | 0.006 |
| | - exchange rate | | | |
| CPI Inflation | - agric. sector output | IV 2SLS, vce cluster by time | −4.35 | 0.006 |
| | - consumption per capita | agric. sector output = pop | | |
| | - investment per capita | | | |
| | - exchange rate | | | |
| Employment in agric. | - agric. sector output | OLS, vce cluster by time | 5.51 | 0.000 |
| sector (female) | - female population | | | |
| | - adult fertility rate | | | |
| | - interaction b/w | | | |
| | - female population | | | |
| | - and adult fertility rate | | | |
| Employment in agric. | - agric. sector output | OLS, vce cluster by time | 1.49 | 0.000 |
| sector (male) | - male population | | | |
| Employment in agric. | - agric. production | IV 2SLS, vce cluster by time | 4.93 | 0.015 |
| sector (total) | - population | population = energy use | | |
| Unemployment rate | - agric. sector output | IV 2SLS, vce cluster by time | −5.58 | 0.000 |
| (national) | - population | population = energy use | | |
| Real GDP per capita | - agric. sector output | IV 2SLS, vce cluster by time | 0.46 | 0.000 |
| | - investment | agric. sector output = pop | | |
| | - exchange rate | | | |
| Consumption per capita | - agric. sector output | IV 2SLS, vce cluster by time | 0.73 | 0.000 |
| | - investment | agric. sector output = pop | | |
References
- Ahmed, M.; Sultan, M.; Wahr, J.; Yan, E. The use of GRACE data to monitor natural and anthropogenic induced variations in water availability across Africa. Earth-Sci. Rev. 2014, 136, 289–300. [Google Scholar] [CrossRef]
- Kondrashov, D.; Feliks, Y.; Ghil, M. Oscillatory modes of extended Nile River records (A.D. 622–1922). Geophys. Res. Lett. 2005, 32, L10702. [Google Scholar] [CrossRef] [Green Version]
- Swain, A. Challenges for water sharing in the Nile basin: Changing geo-politics and changing climate. Hydrol. Sci. J. 2011, 56, 687–702. [Google Scholar] [CrossRef] [Green Version]
- Chen, Y.; Ahmed, M.; Tangdamrongsub, N.; Murgulet, D. Reservoir-Induced Land Deformation: Case Study from the Grand Ethiopian Renaissance Dam. Remote Sens. 2021, 13, 874. [Google Scholar] [CrossRef]
- Gebreluel, G. The Washington Quarterly Ethiopia’s Grand Renaissance Dam: Ending Africa’s Oldest Geopolitical Rivalry? Wash. Q. 2014, 37, 25–37. [Google Scholar] [CrossRef]
- Taye, M.T.; Tadesse, T.; Senay, G.B.; Block, P. The Grand Ethiopian Renaissance Dam: Source of Cooperation or Contention? J. Water Resour. Plan. Manag. 2016, 142, 02516001. [Google Scholar] [CrossRef]
- Basheer, M.; Nechifor, V.; Calzadilla, A.; Siddig, K.; Etichia, M.; Whittington, D.; Hulme, D.; Harou, J.J. Collaborative management of the Grand Ethiopian Renaissance Dam increases economic benefits and resilience. Nat. Commun. 2021, 12, 1–12. [Google Scholar] [CrossRef] [PubMed]
- The World Bank. Egypt’s Economic Update—October 2021. Available online: https://www.worldbank.org/en/country/egypt/publication/economic-update-october-2021 (accessed on 13 December 2021).
- Heggy, E.; Sharkawy, Z.; Abotalib, A.Z. Egypt’s water budget deficit and suggested mitigation policies for the Grand Ethiopian Renaissance Dam filling scenarios. Environ. Res. Lett. 2021, 16, 074022. [Google Scholar] [CrossRef]
- Water Technology Grand Ethiopian Renaissance Dam Project, Benishangul-Gumuz. Available online: https://www.water-technology.net/projects/grand-ethiopian-renaissance-dam-africa/ (accessed on 3 January 2022).
- Siddig, K.; Basheer, M.; Luckmann, J.; Grethe, H. Long-term Economy-wide Impacts of the Grand Ethiopian Renaissance Dam on Sudan. In Proceedings of the 22nd Annual Conference on Global Economic Analysis, Warsaw, Poland, 19–21 June 2019. [Google Scholar]
- Sultan, M.; Ahmed, M.; Sturchio, N.; Yan, Y.E.; Milewski, A.; Becker, R.; Wahr, J.; Becker, D.; Chouinard, K. Assessment of the vulnerabilities of the Nubian Sandstone Fossil Aquifer, North Africa. In Climate Vulnerability: Understanding and Addressing Threats to Essential Resources; Pielke, R.A., Ed.; Elsevier: Amsterdam, The Netherlands, 2013; Volume 5, pp. 311–333. ISBN 9780123847041. [Google Scholar]
- Bashar, K.E.; Mustafa, M.O. Water balance assessment of the Roseires Reservoir. In Improved Water and Land Management in the Ethiopian Highlands: Its Impact on Downstream Stakeholders Dependent on the Blue Nile; IWMI: Addis Ababa, Ethiopia, 2009. [Google Scholar]
- Setegn, S.G.; Rayner, D.; Melesse, A.M.; Dargahi, B. Impact of climate change on the hydroclimatology of Lake Tana Basin, Ethiopia. Water Resour. Res. 2011, 47, 1–13. [Google Scholar] [CrossRef]
- Abdelhaleem, F.; Helal, E. Impacts of Grand Ethiopian Renaissance Dam on Different Water Usages in Upper Egypt. Br. J. Appl. Sci. Technol. 2015, 8, 461–483. [Google Scholar] [CrossRef]
- Akaike, H. A New Look at the Statistical Model Identification. IEEE Trans. Autom. Control 1974, 19, 716–723. [Google Scholar] [CrossRef]
- Schwert, G.W. Tests for Unit Roots. J. Bus. Econ. Stat. 2012, 20, 5–17. [Google Scholar] [CrossRef]
- Hannan, E.J.; Quinn, B.G. The Determination of the Order of an Autoregression. J. R. Stat. Soc. Ser. B 1979, 41, 190–195. [Google Scholar] [CrossRef]
- Johansen, S. Statistical analysis of cointegration vectors. J. Econ. Dyn. Control 1988, 12, 231–254. [Google Scholar] [CrossRef]
- Levendis, J.D. Time Series Econometrics: Learning Through Replication; Springer Texts in Business and Economics; Springer International Publishing: Cham, Switzerland, 2018; ISBN 978-3-319-98281-6. [Google Scholar]
- Bank, T.W. Egypt: Development News, Research, Data|World Bank. Available online: https://www.worldbank.org/en/country/egypt (accessed on 13 December 2021).
- Drechsel, T. Earnings-Based Borrowing Constraints and Macroeconomic Fluctuations. Job Mark. Pap. 1-102. 2018. Available online: https://ideas.repec.org/p/jmp/jm2018/pdr141.html (accessed on 4 December 2021).
- Breusch, T.S.; Pagan, A.R. A Simple Test for Heteroscedasticity and Random Coefficient Variation. Econometrica 1979, 47, 1287. [Google Scholar] [CrossRef]
- IMF. IMF Executive Board Completes the Second Review under the Stand-By Arrangement (SBA) for the Arab Republic of Egypt and Concludes 2021 Article IV Consultation. Available online: https://www.imf.org/en/News/Articles/2021/06/23/pr21193-egypt-imf-execboard-completes-2ndrev-under-the-sba-concludes-2021aiv (accessed on 13 December 2021).
- The World Bank. High and Dry: Climate Change, Water, and the Economy; The World Bank: Washington, DC, USA, 2016. [Google Scholar]
Figure 1.
(a) Spatial distribution of the Nile River within the Nile River Basin (NRB) and location of the Grand Ethiopian Renaissance Dam (GERD), major lakes, and the Upper Blue Nile (UBN) sub-basin. (b) Digital elevation model (DEM) of the UBN sub-basin. The location of the 74 km3 GERD reservoir is also shown.
Figure 2.
Egypt’s water and economic losses due to GERD construction.
Figure 2.
Egypt’s water and economic losses due to GERD construction.
Figure 3.
Average annual water loss from Egypt’s Nile water allocation (in km3 and %) as a function of filling scenarios (in years).
Figure 3.
Average annual water loss from Egypt’s Nile water allocation (in km3 and %) as a function of filling scenarios (in years).
Figure 4.
Impact of the GERD on Egypt’s agriculture land (in km2 and %) as function of filling scenario (in years).
Figure 4.
Impact of the GERD on Egypt’s agriculture land (in km2 and %) as function of filling scenario (in years).
Figure 5.
Projected trends in (a) agricultural sector output (billion $), (b) GDP per capita, (c) consumption per capita, and (d) CPI inflation under the alternative filling scenarios.
Figure 5.
Projected trends in (a) agricultural sector output (billion $), (b) GDP per capita, (c) consumption per capita, and (d) CPI inflation under the alternative filling scenarios.
Figure 6.
Projected trends in (a) food production index, (b) food imports, and (c) food exports under the alternative filling scenarios.
Figure 6.
Projected trends in (a) food production index, (b) food imports, and (c) food exports under the alternative filling scenarios.
Figure 7.
Projected trends in (a) female employment in the agricultural sector, (b) male employment in the agricultural sector, (c) total employment in the agricultural sector (male and female), and (d) the national unemployment rate under the alternative filling scenarios.
Figure 7.
Projected trends in (a) female employment in the agricultural sector, (b) male employment in the agricultural sector, (c) total employment in the agricultural sector (male and female), and (d) the national unemployment rate under the alternative filling scenarios.
Table 1.
Average annual losses in Egypt’s Nile water allocation and the associated losses in agricultural land relative to the baseline (no GERD) scenario.
Table 1.
Average annual losses in Egypt’s Nile water allocation and the associated losses in agricultural land relative to the baseline (no GERD) scenario.
| Filling Period | Loss in Egypt’s Water Allocation (%) | Loss in Egypt’s Agricultural Land (%) |
|---|
| 3 | 51.29 ± 2.62 | 52.75 ± 2.44 |
| 7 | 24.75 ± 2.76 | 28.14 ± 2.56 |
| 10 | 18.78 ± 2.76 | 22.61 ± 2.58 |
Table 2.
Projected average annual growth (%) in selected variables in a baseline (no GERD) scenario over the next 3 years.
Table 2.
Projected average annual growth (%) in selected variables in a baseline (no GERD) scenario over the next 3 years.
| Variable | Mean ± Standard Deviation | Lower Limit | Upper Limit |
|---|
| Agricultural sector output (value added) | 2.27 ± 0.71 | 1.47 | 2.83 |
| Consumption per capita | 4.74 ± 2.12 | 2.48 | 6.69 |
| Real GDP per capita | 2.38 ± 1.65 | 1.30 | 4.28 |
| Real GDP | 4.51 ± 1.65 | 3.43 | 6.41 |
Table 3.
Elasticity coefficients for selected variables grouped by regressors.
Table 3.
Elasticity coefficients for selected variables grouped by regressors.
| (a) Regressor = Agricultural Land |
| Variable | Elasticity Coefficient |
| Agricultural output (value added) | 0.33 |
| Food production | 0.73 |
| (b) Regressor = Agricultural Output (Value Added) |
| Variable | Elasticity Coefficient |
| Food import | −0.49 |
| Food export | 0.94 |
| Employment in agric. Sector (female) | 5.51 |
| Employment in agric. Sector (male) | 1.49 |
| Employment in agric. Sector (total) | 4.93 |
| Unemployment rate (national) | −5.58 |
| CPI inflation | −4.35 |
| Real GDP per capita | 0.46 |
| Consumption per capita | 0.73 |
Table 4.
Losses/gains in agricultural sector output, real GDP per capita, consumption per capita, and CPI inflation relative to the baseline (no GERD) scenario.
Table 4.
Losses/gains in agricultural sector output, real GDP per capita, consumption per capita, and CPI inflation relative to the baseline (no GERD) scenario.
| (a) Average Annual Losses/Gains (%) Relative to the Baseline (no GERD) Scenario |
| Variable | 3-Year Filling | 7-Year Filling | 10-Year Filling |
| Agricultural output (value added) | −17.51 ± 0.99 | −9.34 ± 0.92 | −7.50 ± 0.90 |
| Real GDP per capita | −8.02 ± 0.45 | −4.28 ± 0.42 | −3.44 ± 0.41 |
| Consumption per capita | −12.83 ± 0.73 | −6.85 ± 0.67 | −5.50 ± 0.66 |
| CPI inflation | 9.38 ± 4.38 | 4.70 ± 1.66 | 5.07 ± 2.75 |
| (b) Approximate Dollar Equivalent in Annual Losses/Gains (Billion $) in Agricultural Sector Output and Real GDP |
| Variable | 3-Year Filling | 7-Year Filling | 10-Year Filling |
| Agricultural output (value added) | −6.99 ± 0.58 | −3.96 ± 0.61 | −3.32 ± 0.65 |
| Real GDP | −26.30 ± 2.81 | −15.70 ± 3.04 | −13.40 ± 3.11 |
Table 5.
Average annual losses/gains (%) in food production, food imports, and food exports relative to the benchmark (no GERD) scenario.
Table 5.
Average annual losses/gains (%) in food production, food imports, and food exports relative to the benchmark (no GERD) scenario.
| Variable | 3-Year Filling | 7-Year Filling | 10-Year Filling |
|---|
| Food production | −38.47 ± 2.18 | −20.53 ± 2.02 | −16.49 ± 1.98 |
| Food imports | 8.56 ± 0.49 | 4.57 ± 0.45 | 3.67 ± 0.44 |
| Food exports | −16.50 ± 0.94 | −8.80 ± 0.87 | −7.07 ± 0.85 |
Table 6.
Average annual change (%) in agricultural sector employment and the national unemployment rate relative to the benchmark (no GERD) scenario.
Table 6.
Average annual change (%) in agricultural sector employment and the national unemployment rate relative to the benchmark (no GERD) scenario.
| Variable | 3-Year Filling | 7-Year Filling | 10-Year Filling |
|---|
| Employment in agric. sector (female) | −25.48 ± 5.32 | −18.40 ± 7.81 | −16.31 ± 6.45 |
| Employment in agric. sector (male) | −5.00 ± 0.44 | −2.86 ± 0.50 | −2.33 ± 0.42 |
| Employment in agric. sector (total) | −18.10 ± 1.85 | −10.85 ± 2.42 | −8.92 ± 1.88 |
| Unemployment rate (national) | 11.24 ± 1.77 | 6.73 ± 1.35 | 5.19 ± 0.83 |
| Publisher’s Note: MDPI stays neutral with regard to jurisdictional claims in published maps and institutional affiliations. |
© 2022 by the authors. Licensee MDPI, Basel, Switzerland. This article is an open access article distributed under the terms and conditions of the Creative Commons Attribution (CC BY) license (https://creativecommons.org/licenses/by/4.0/).


