Article

Effects of Cyclic Freezing–Thawing on Dynamic Properties of Loess Reinforced with Polypropylene Fiber and Fly Ash

1
College of Civil Engineering, Xijing University, Xi’an 710123, China
2
Shaanxi Key Laboratory of Safety and Durability of Concrete Structures, Xijing University, Xi’an 710123, China
*
Author to whom correspondence should be addressed.
Water 2022, 14(3), 317; https://doi.org/10.3390/w14030317
Submission received: 16 December 2021 / Revised: 17 January 2022 / Accepted: 18 January 2022 / Published: 21 January 2022

Abstract

:
Periodic freezing–thawing is recognized as a real threat to the mechanical properties of reinforced loess, which has been used in the recent construction of high-speed railways in northwest China; however, the performance of these materials under periodic freezing–thawing and dynamic loading has rarely been investigated. In this work, dynamic triaxial tests were conducted on fly ash- and polypropylene fiber-reinforced loess with different blend ratios and freeze–thaw cycles. The dynamic shear modulus and damping ratio were investigated. The results revealed that cyclic freezing–thawing had a remarkable effect on the dynamic shear modulus and damping ratio, which demonstrated considerable reductions and increases, respectively, after cyclic freezing–thawing. Additionally, the dynamic shear modulus increased notably with the fly ash content and confining pressure and decreased with the water content. Meanwhile, the damping ratio increased with the fiber content and water content and decreased with the fly ash content and confining pressure. Comparatively, the effects of polypropylene fiber on dynamic behavior were found to be not significant. Furthermore, novel models were established to predict the dynamic shear modulus and damping ratio for reinforced loess. The results provide more information towards infrastructure design in seasonal frozen regions.

1. Introduction

Loess is widespread soil that stretches from seasonal frozen areas to permafrost areas in Northern China. Due to a lack of coarse-grained materials, it is often selected as a filling material for highways, railways, and high-speed railways (HSR) despite its unfavorable engineering characteristics such as its large pores and high sensitivity to water and temperature [1,2,3]. An effective method to mitigate these deficiencies and to improve the fill is to reinforce the soil with cementitious additives and reinforcing materials [4]. In practice, however, the freezing–thawing weathering process and dynamic traffic loads could strongly influence the long-term dynamic behaviors of the modified loess substructure and could threaten the operational safety of infrastructures [5,6,7]. Therefore, how to estimate the dynamic properties of reinforced loess in these complex environments has become an urgent problem that needs to be solved in cold regions.
Loess-reinforcing techniques to create better pavements based on conventional stabilizers, such as cement and lime, have become more mature due to long-term progress and practices [8,9,10]. However, the productions of these materials are energy-intensive, result in high CO2 emissions, and are becoming increasingly expensive. Fly ash (FA) is a waste material from coal-firing power plants, and hundreds of millions of tons of it is generated annually [11]. In the context of energy-saving and sustainable development policies, many experimental research studies have been focused on FA-based reinforcing techniques for different types of soils. Most of the existing work on FA-reinforcing techniques focus on clayey soil [12,13] and silty soil [14,15]. There are few studies on FA-reinforced loess, and fewer have promoted a combination of FA and synthetic fibers to reinforce loess soils [16].
Periodic freezing–thawing (F–T) has been recognized as a major threat to the mechanical properties of reinforced soils. A review of previous studies reveals that different additive materials and synthetic fibers have been applied to alleviate the detrimental effects of F–T and to improve soil performance. Arora and Aydilek [17] reported that soil reinforced by class F FA exhibited better F–T resistance than soil that had been reinforced by lime in an experiment. Shafique et al. [18] observed a 40% strength loss of class C FA-reinforced soil after F–T; however, the residual strength was still at least three times higher than that of pure soil. Meanwhile, a great deal of experimental research has also utilized polypropylene fiber (PF) to improve soil resistance to F–T cycles. Kravchenko et al. [19] demonstrated that PF performs as a better reinforcement material than basalt fiber in clay when exposed to F–T action. Li [20] concluded that the addition of fiber makes cement-reinforced clay more ductile when subjected to F–T cycles. Notwithstanding, some studies maintain that the benefits of adding PF are not significant [21,22].
The dynamic shear modulus ( G d ) and the damping ratio ( λ ) are the main parameters to describe the stiffness and energy dissipation characteristics of subgrade fillings. Some studies [23,24,25,26] have been carried out on the dynamic response of soil that has been reinforced with various stabilizers and synthetic fibers, such as class C FA, PF, lime, cement, etc. These experimental works reveal that that the dynamic modulus increased with the addition of reinforcing materials, and some investigations [25,26] also found considerable decreases in λ after reinforcement. However, these investigations on dynamic properties were mainly focused on clayey soils, and few works have been conducted on loess, especially regarding F–T effects.
The existing literature has clearly exhibited a gap in connecting freeze–thaw-, fiber-, and cementite additive-modified and loess-focused topics together when investigating the dynamic performance of reinforced loess. In the present work, dynamic triaxial tests were conducted on FA- and PF-reinforced loess with different blend ratios and freeze–thaw cycles. The dynamic properties, G d and λ , of reinforced loess were obtained and discussed in terms of five key factors for reinforced soil in cold regions: F–T cycles, FA and PF contents, initial water content, and confining pressure. Finally, novel models for these dynamic properties were established.

2. Materials and Methods
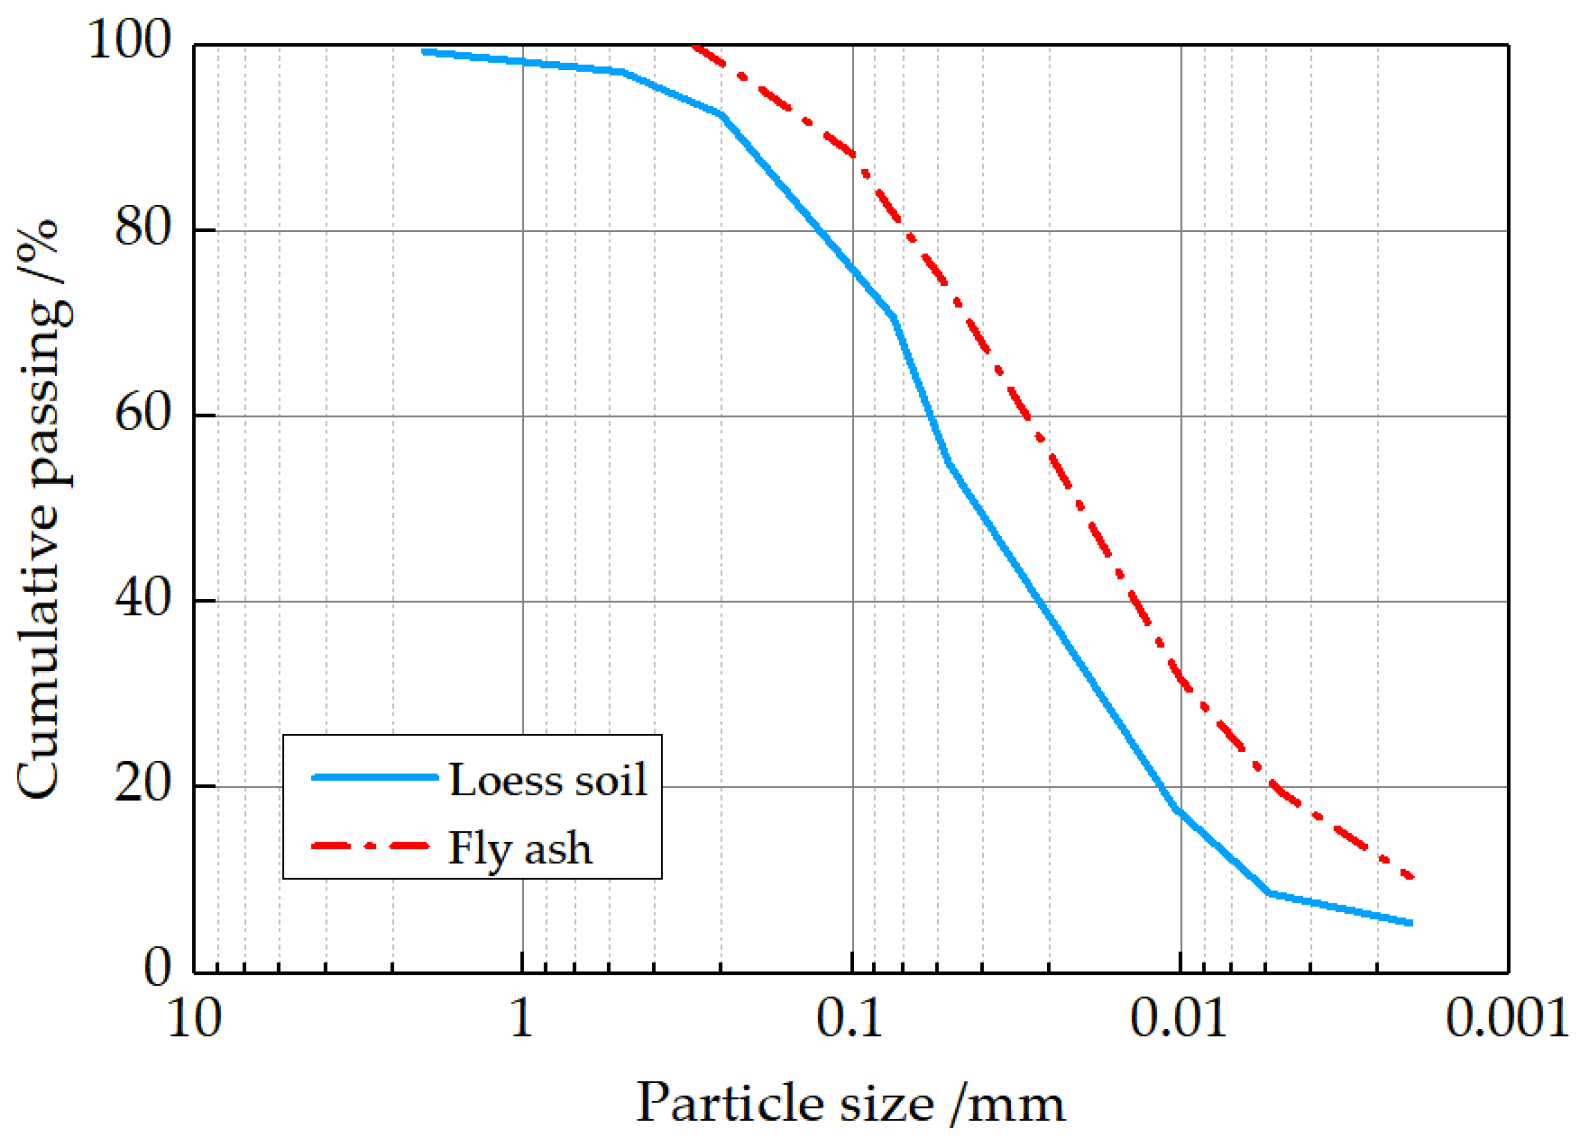
2.1. Materials

The studied loess was collected from the southern region of Xi’an, Shaanxi Province, NW China. The key physical and index properties are detailed in Table 1. Figure 1 exhibits the gradation curves of the loess and fly ash (FA) in the present work. The FA and polypropylene fiber (PF) were supplied by a firm in Henan Province, China. FA is a fine, powdery material that is primarily composed of spherical glassy particles, and its chemical composition is listed in Table 2. With a calcium oxide content of 7.7%, it can be classified as Class F [27]. Table 3 provides the main PF parameters, which were provided by the manufacturer.

2.2. Specimen Preparation

The influence of five key factors for reinforced soil in cold regions: F–T cycle, FA content, PF content, initial water content, and confining pressure, were investigated. Table 4 summarizes the dynamic triaxial test conditions. It should be noted that the specimens were tested with 0, 1, 2, 3, 5, 7, and 10, F–T cycles; at FA contents of 0%, 5%, 10%, 15%, 20%, and 30%; at PF contents of 0%, 0.25%,0.5%, 0.75%, and 1.0%; at initial water contents of 13%, 16%, 18.9%, 22%, and 25%; and at confining pressures of 12.5, 25, 50, 100, 200, 300, and 400 kPa.
Before mixing the samples, all of the loess and additives were pulverized, oven-dried, and then measured by mass according to the predesignated mix ratio. Afterward, the samples were thoroughly hand-mixed with corresponding initial water content. In order to reduce the fiber’s electrostatic effect for a more even mixture, all of the materials were divided into 10 parts prior to mixing. Every part of the mixture was manually stirred until visual uniformity was achieved. The prepared mixtures were cast in 10 sequential layers into a standard metallic mold (50 mm diameter, 100 mm high). Every layer surface was scraped prior to subsequent compaction to avoid the delamination effect. Finally, the mixtures were compacted by targeting the maximum dry density of T01 (1.76 g/cm3). After that, the new molded specimens were sealed and placed in a curing chamber for 7 days at a constant temperature of 20.0 ± 2 °C.
After curing, the samples were subjected to a cyclic F–T process in a programmable freeze–thaw chamber (Figure 2a). According to the test results derived by Orakoglu et al. [13], a uniform temperature inside the sample can be achieved within 12 h of the freezing/thawing process. Considering this, the specimens were conditioned at −10 °C for 12 h and were subsequently allowed to thaw at +20 °C for 12 h, which means that one F–T cycle took 24 h. This procedure was repeated 0, 1, 2, 3, 5, 7, and 10 times since a new equilibrium could be achieved after 5 to 10 F–T cycles for most soils [28].

2.3. Apparatus and Testing Procedure

GDS DYNTTS manufactured by Global Digital Systems Ltd. Instruments (Figure 2b) was utilized to conduct dynamic triaxial tests in this work. The strain-dependent dynamic behaviors of reinforced loess can be obtained by applying multi-stage dynamic stress control (Figure 3). All of the specimens were subjected to about 15 different cyclic stress amplitudes, and each uniform amplitude consisted of 50 sinusoidal load cycles.

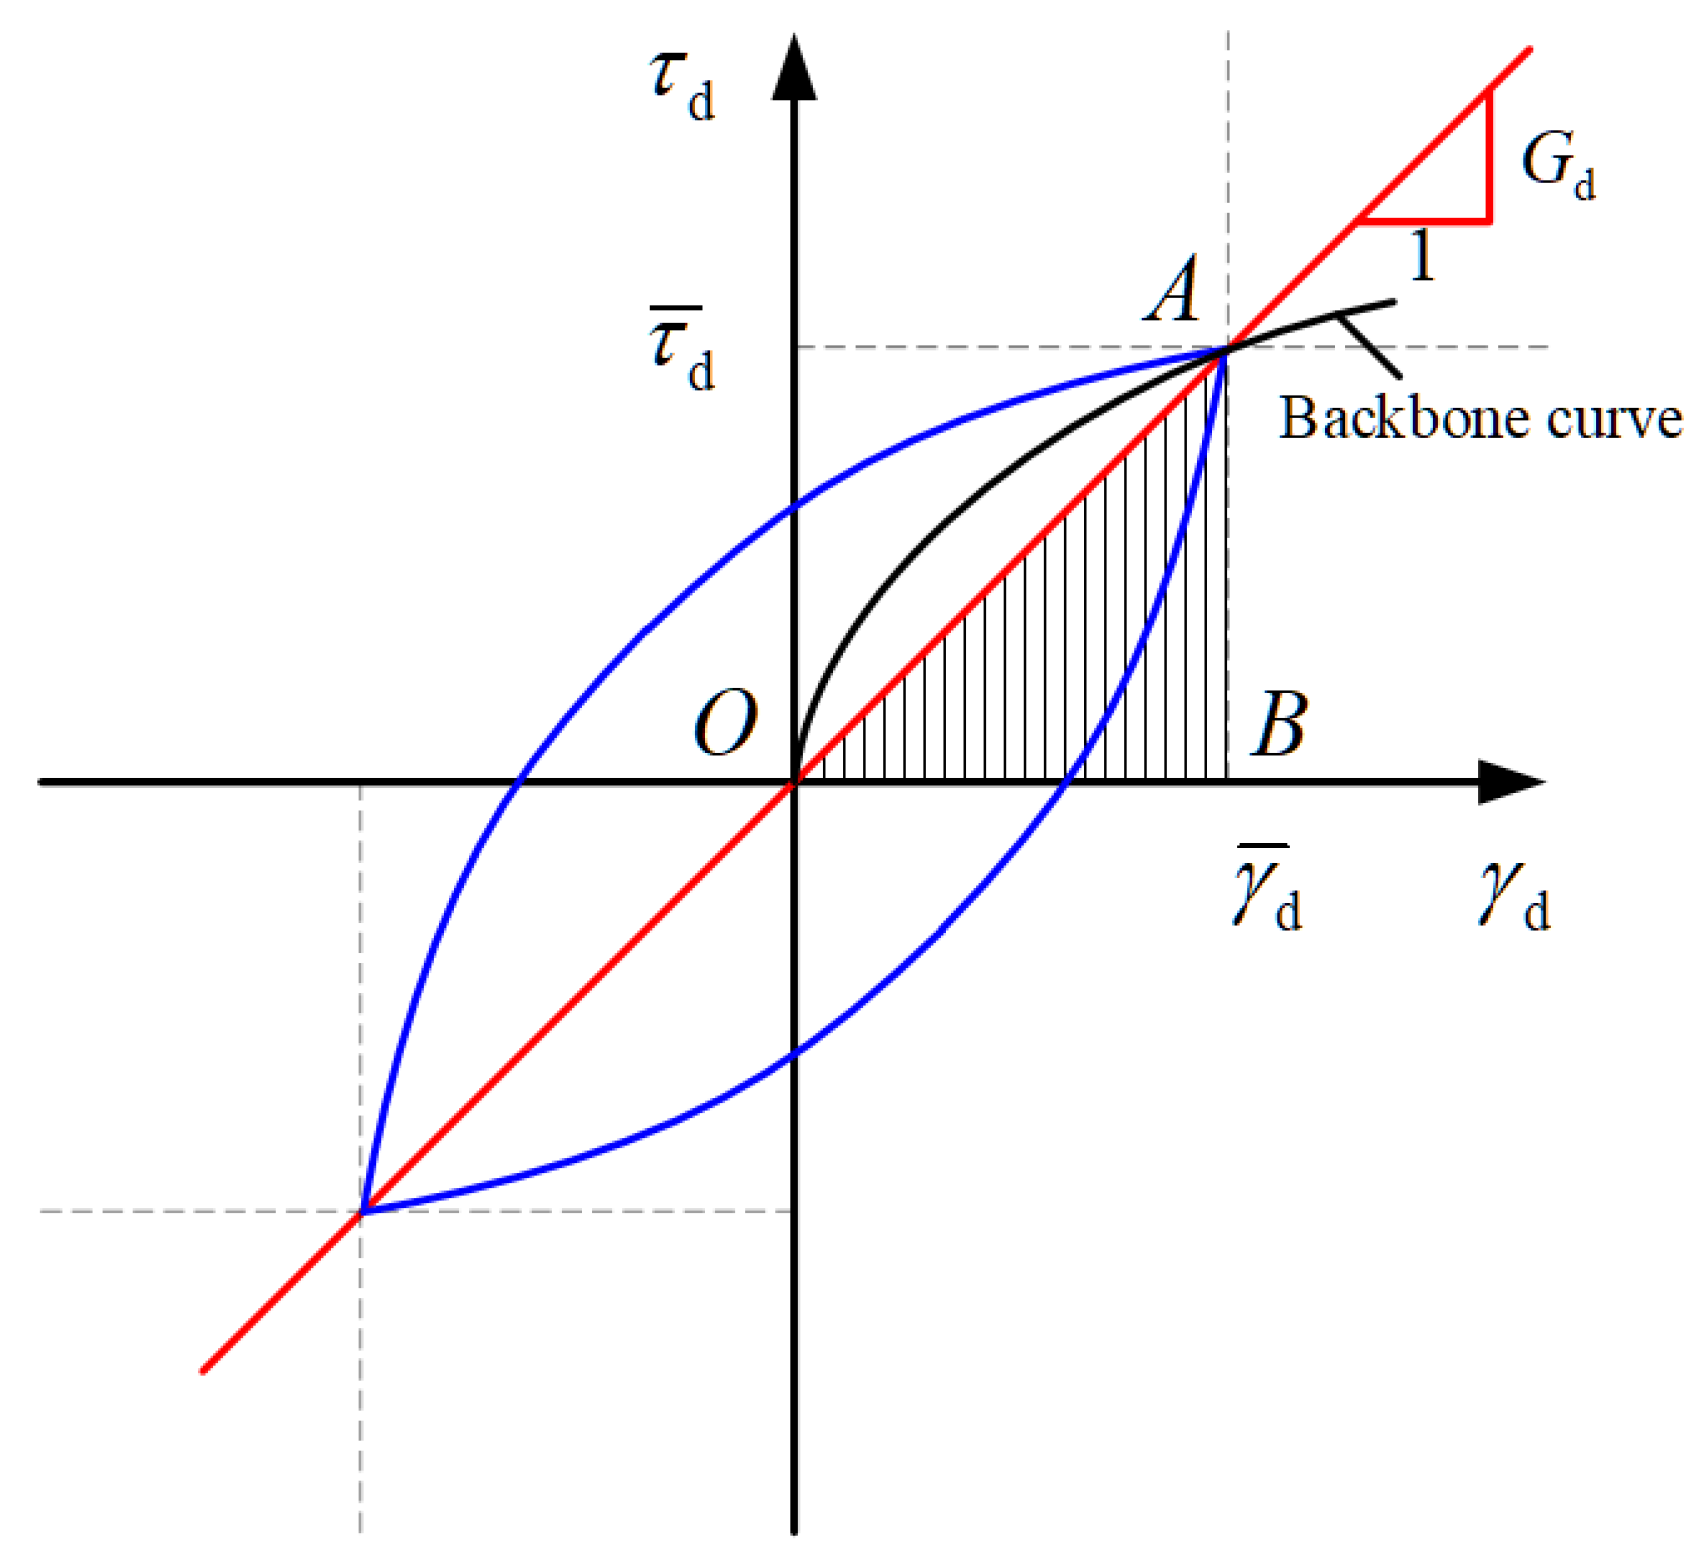
3. Determination of Dynamic Parameters

The dynamic behavior of reinforced samples can be determined by their response to multi-stage dynamic loads. From the test results, the dynamic shear stress τ d and dynamic strain γ d can be determined by
τ d = σ d 2 ,
γ d = ( 1 + μ ) × ε d ,
where σ d is the dynamic axial stress; ε d is the dynamic axial strain; and μ is Poisson’s ratio.
Figure 4 presents the archetype of the τ d - γ d hysteresis loops of soils under dynamic axial loading. The backbone curves are obtained by connecting the loop peaks of different stress amplitudes. In the present work, the dynamic shear modulus G d was calculated as follows:
G d = τ ¯ d γ ¯ d ,
where τ ¯ d and γ ¯ d are the amplitudes of the dynamic shear stress and strain, respectively.
The damping ratio is a key parameter that reflects the energy dissipation characteristics of soils. According to Hardin and Drnevich [29], it can be calculated from the hysteresis loop using the following equation:
λ = W D 4 π W A ,
where W D , which represents the energy loss, equals the area enclosed by the hysteresis loop, and W A , which represents the elastic strain energy, equals the area of triangle OAB.
The hyperbolic model is applied in the backbone curve fitting as follows:
τ d = γ d a + b γ d ,
where a and b are two positive parameters obtained from data fitting. Accordingly, the dynamic shear modulus can be obtained from:
G d = τ d γ d = 1 a + b γ d ,
G d G dmax = 1 1 + γ d / γ dr ,
where γ dr is the reference strain. According to Equation (6), G d reaches its maximum value at γ d = 0 , which is denoted as the maximum dynamic shear modulus, G dmax = 1 / a ; τ d approaching infinity is denoted as ultimate dynamic shear stress, τ dult = 1 / b . Accordingly, γ dr is equal to a / b or τ dult / G dmax .
Hardin and Drnevich suggested that λ is a function of the normalized shear modulus G d / G dmax . In this study, the following relationship is adopted to describe strain-dependent behavior of the damping ratio:
λ λ max = ( 1 G d G dmax ) n ,
where λ max is the maximum damping ratio, and n is a fitting constant.

4. Results and Discussions

4.1. Effect of Freeze–Thaw Cycle

Figure 5a exhibits the backbone curves ( τ d - γ d relationships) for various F–T cycles. Generally, all of the specimens present strain-hardening characteristics, which not only illustrates how τ d increases as the strain amplitude increases, but also the applicability of the Hardin model. The backbone curve gradually shifts downward with cyclic F–T, indicating the deterioration in the dynamic performance of the reinforced loess under F–T conditions. Moreover, this downward shift recedes with the number of F–T cycles. Specifically, the backbone curve shifts downward sharply when N 5 , while this phenomenon becomes less obvious as the number of F–T cycles increases. Similar observations were also reported by Orakoglu et al. [13] and Jing et al. [30] for reinforced clayey soil.
Figure 5b,c show the variations in G d and λ with shear strain γ d , respectively. As is shown, G d decreases with the number of F–T cycles, while λ increases. Notably, the specimen that does not experience F–T presented the best G dmax of approximately 48.52 MPa, while the specimen subjected to 5 F–T cycles achieved the smallest G dmax -value of 28.15 MPa (a reduction of 41.98%). Meanwhile, λ max increased by 52.58%, from 27.54% to 42.02%.
The reason for these phenomena lies in the deteriorating effects of F–T on the developed cementation among particles and fibers [14,31,32]. During the freezing stage, the water between particles freezes and its volume increase by 11%. This expansion results in the development of stress, micro-pore breakage, and finally, cracks being generated within the soil structure. During the thawing period, the void space and cracks in the soil structure propagate further, leading to soil particle rearrangement to create weaker interparticle bonds. Therefore, the reinforced loess endures a considerable loss in stiffness (lower G d ) while presenting high energy dissipation characteristics (higher λ ).

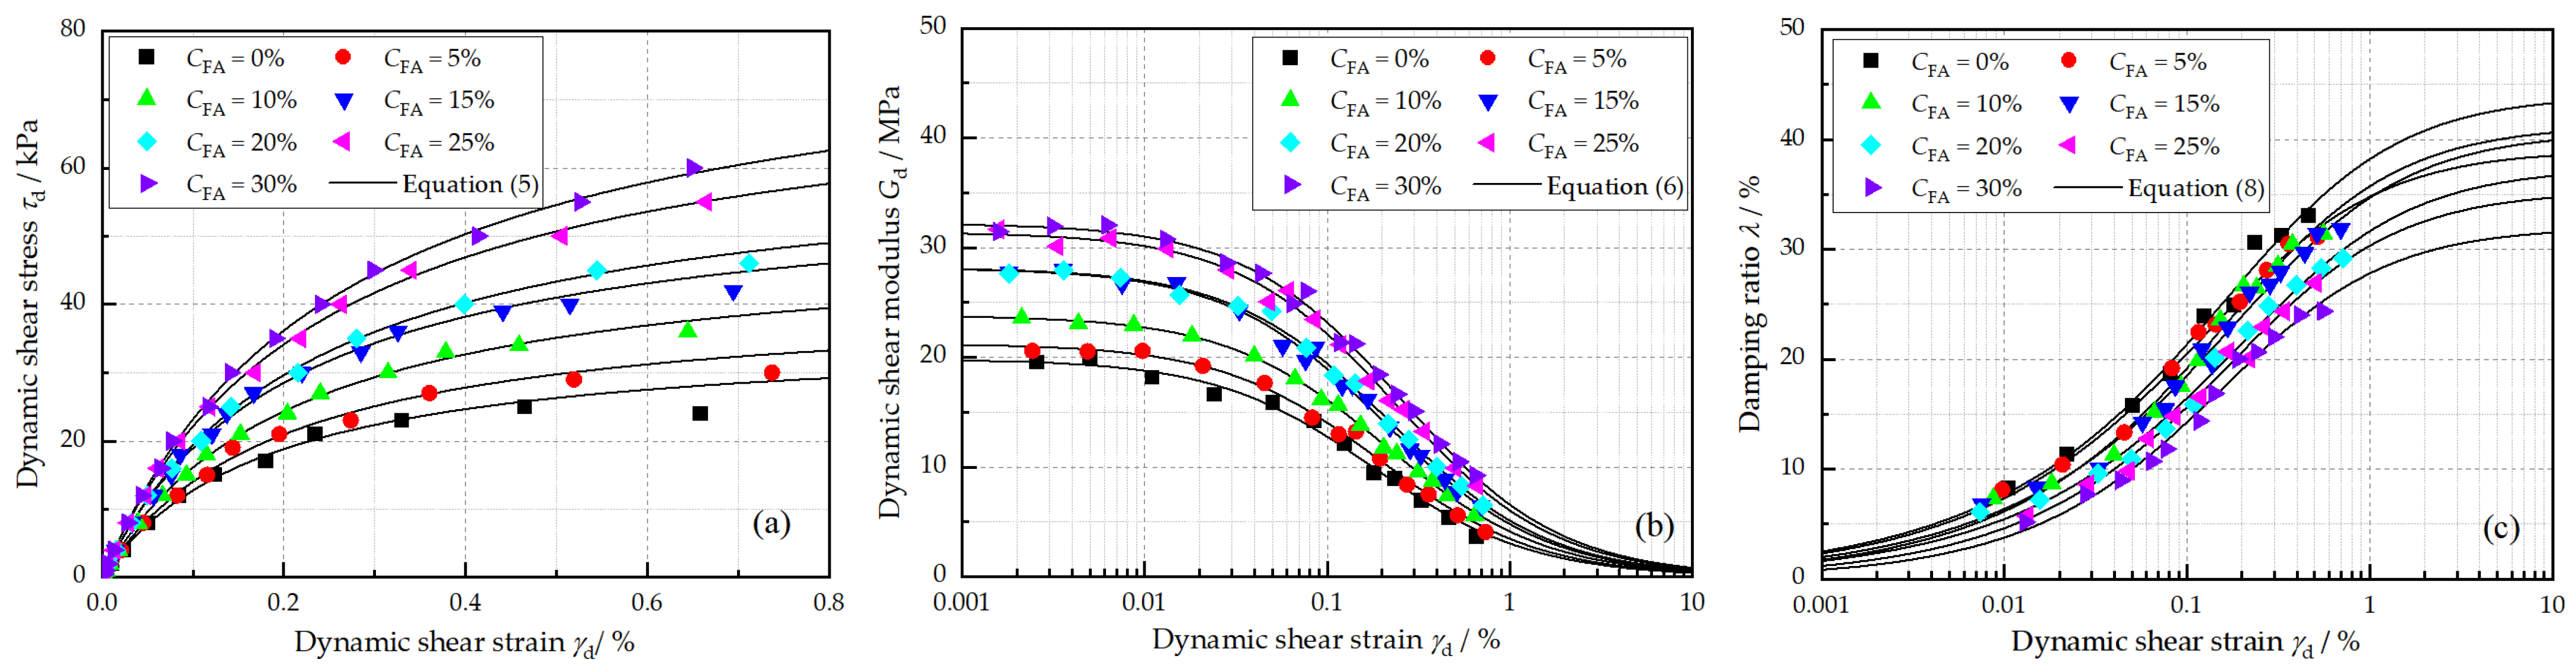
4.2. Effect of Fly Ash

The influence of FA on the dynamic properties, τ d , G d , and λ , of reinforced loess is demonstrated in Figure 6. It can be observed in Figure 6a that the backbone curve shifts upward as the FA content increases. τ dult increased from 35.79 kPa to 82.55 kPa as the FA content increased from 0% to 30%. The specimen without FA exhibited the lowest G dmax -value of 19.81 MPa, whereas the specimen with a FA content of 30% reached the highest G dmax -value of 32.21 MPa, an increase of about 62.59% (Figure 6b). This is presumably related to the cementation effect caused by the pozzolanic reactions of FA [15]. This cementation effect provides a confinement between soil particles and the fiber, which results in higher stiffness and a lower damping ratio.
Generally, a decrease in λ was observed when the FA content increased (Figure 6c). This is because the addition of FA improves the rigidity of loess, reducing particle slippage and rearrangement, and thus, the reinforced loess exhibits lower energy dissipation characteristics [15].

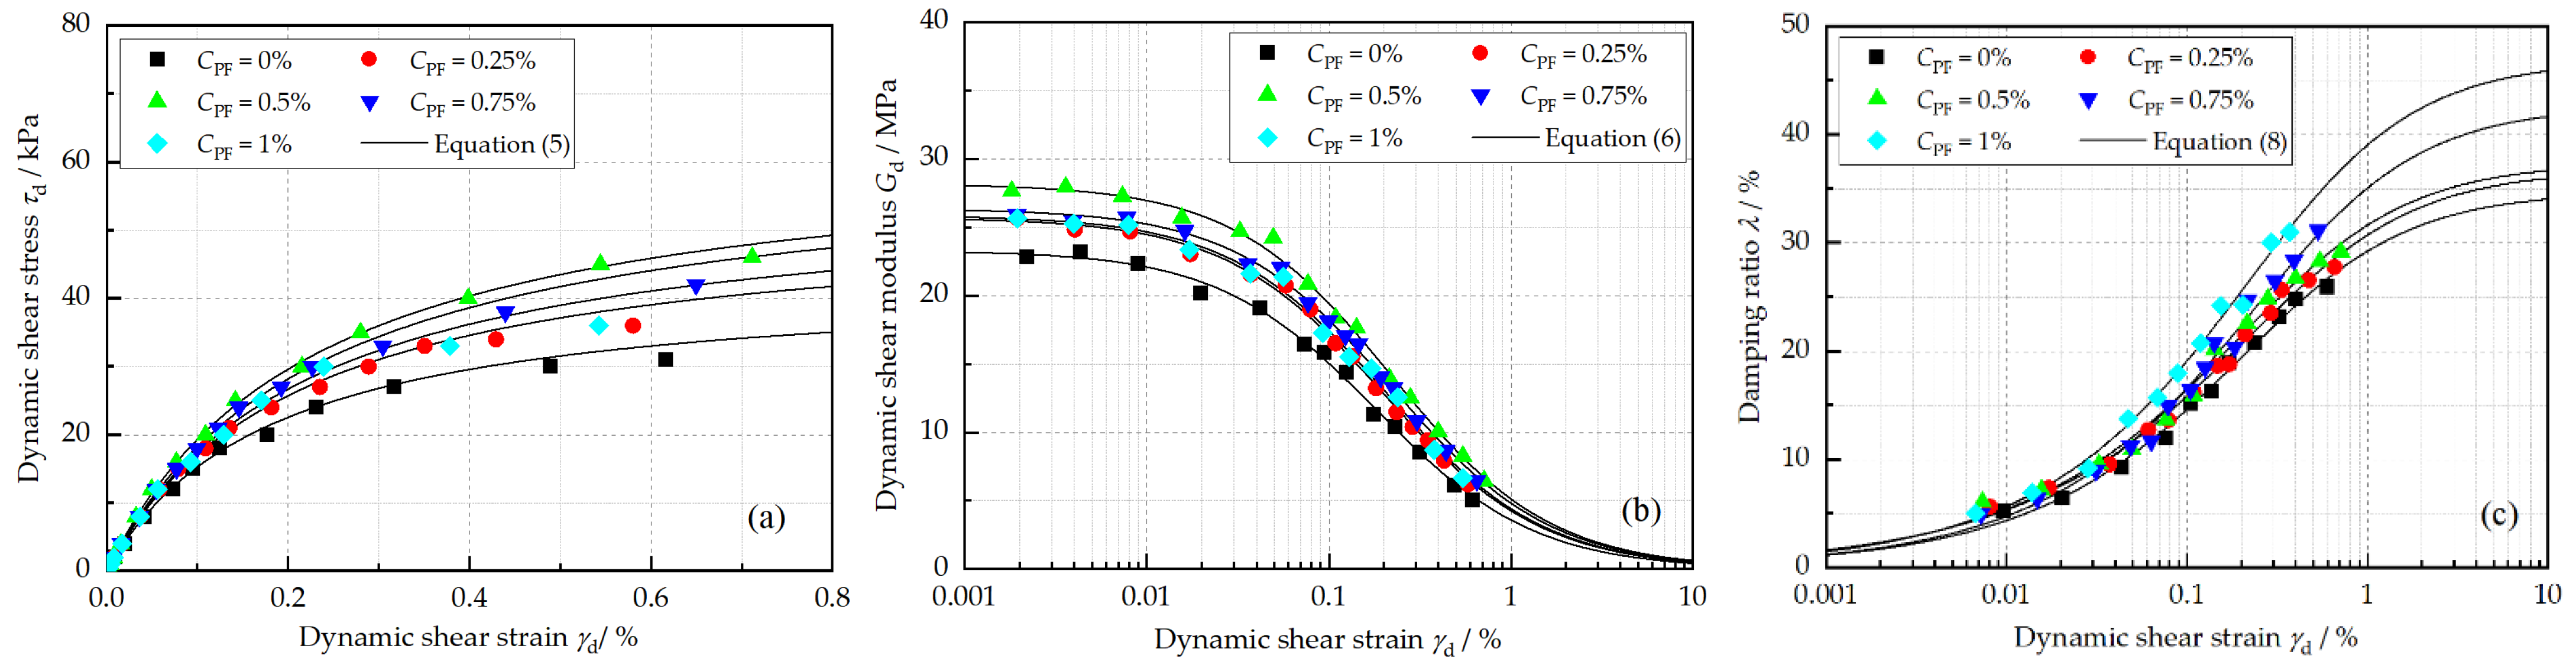
4.3. Effect of Polypropylene Fiber

Figure 7 depicts the effects of PF on the τ d , G d , and λ of reinforced loess. It can be seen that both the backbone curve and G d - γ d curve present an upward-shifting trend first and then downward-shifting as the PF content increases, which indicates an optimal PF content. Specifically, compared with 0% PF content, τ dult of specimen with 0.25%, 0.5 % PF content increase by 20.63%and 47.67%, respectively. Nevertheless, it decreased by 15.07% as the PF content further increased from 0.5% to 1.0%. On the other hand, with the increase in the PF content from 0% to 0.5%, G dmax gradually increased by 20.89%, from 23.29 MPa to 28.15 MPa, and then declined by 8.22% as the PF content continued to increase (Figure 7b). The most noteworthy effect of PF was found on the specimen with a PF content of 0.5%. As for λ , it increased with the addition of PF, especially when γ d was larger than 0.1%.
Generally, the addition of PF does not achieve a significant improvement in the stiffness and energy dissipation behavior of the reinforced loess compared to the effects of FA. The effects of PF can be explained by the cementing force formed between the PF and the mixture, resulting in significant increases in the shear stress as well as in the shear modulus. The disappointing reinforcement effect of a higher PF content may be due to the electrostatic interaction between PF that leads to the fibers forming groups. As a result, unevenly distributed fibers would decrease the reinforcement effect and destroy the soil structure, degrading the dynamic performance of reinforced soil.

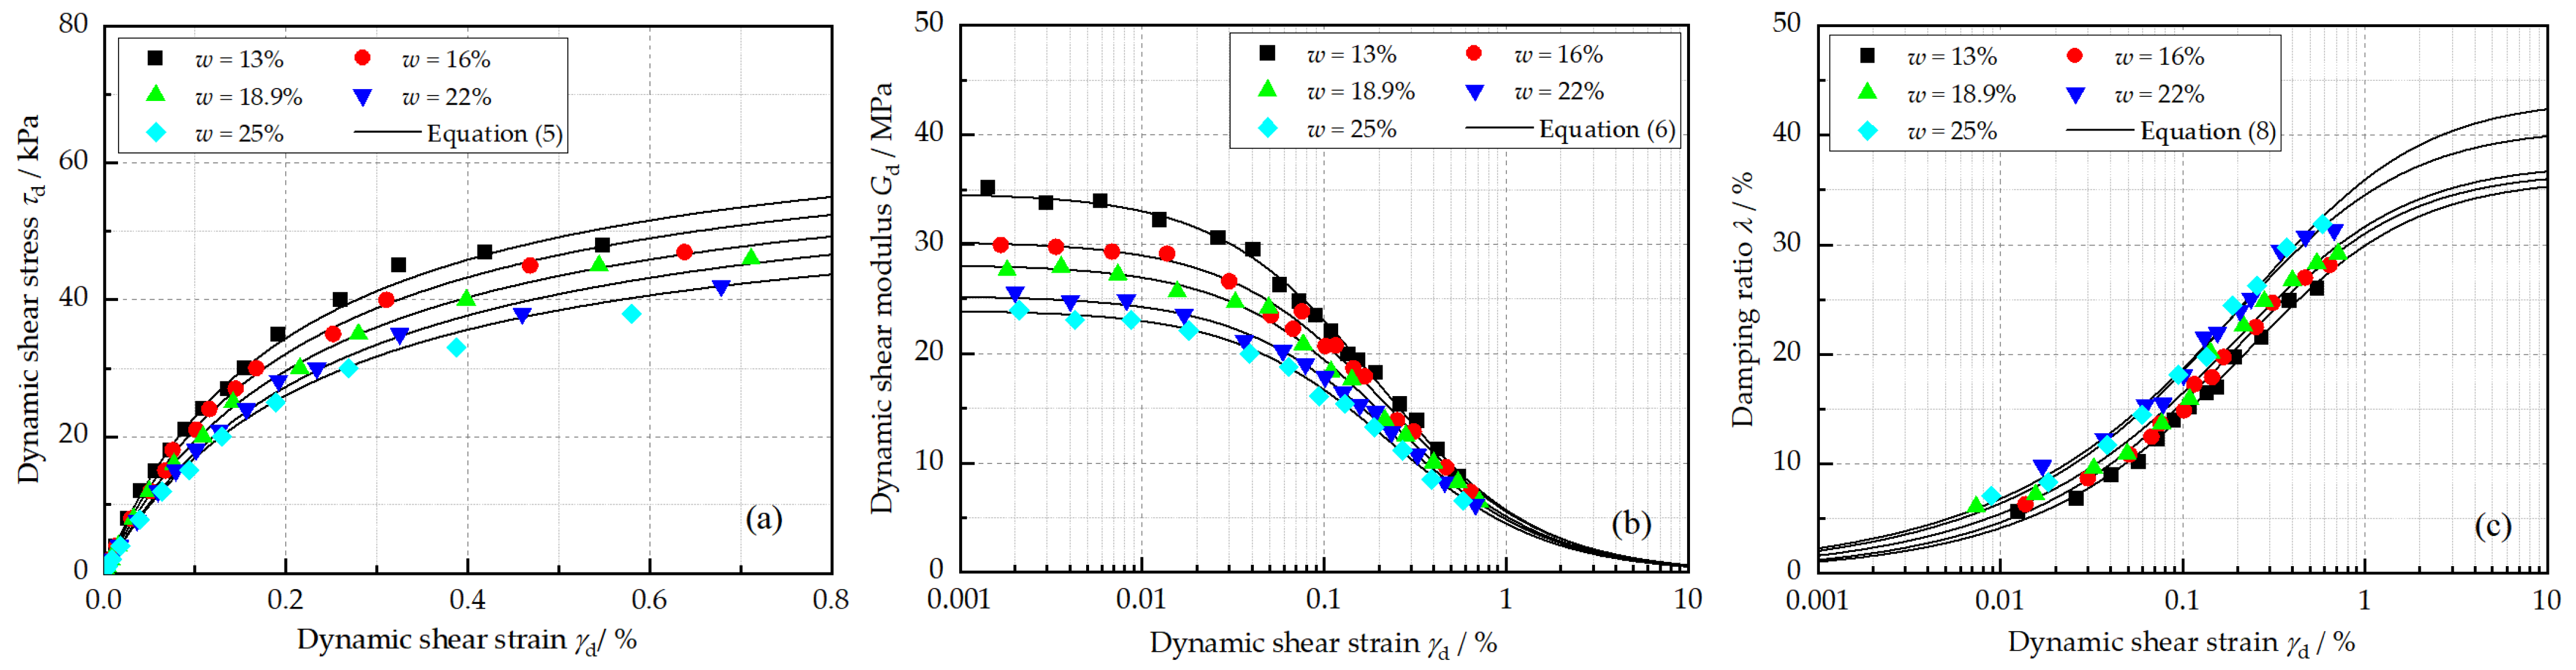
4.4. Effect of Initial Water Content

Figure 8a,b present the τ d and G d of reinforced loess with initial water contents of 13%, 16%, 18.9%, 22%, and 25%, respectively. As expected, both of them exhibit a decreasing trend as the initial water content increases. To be specific, the τ dult of reinforced loess slides from 68.25 kPa to 54.71 kPa, and G dmax decreases from 34.69 MPa to 23.98 MPa with water contents ranging from 13% to 25%. However, there is an increment in λ as the initial water content increases (Figure 8c).
The effect of the initial water content can be attributed to two reasons. Firstly, the friction interaction inside the specimen is weakened due to the thickened bound water and increased free water [33]. Consequently, the soil particles in the reinforced loess can move easily under dynamic loads, which contributes to the deterioration of dynamic behavior. More than that, the deterioration effect of F–T is enhanced due to the increased amount of pore water, which turns into ice and separates the soil particles during F–T process.

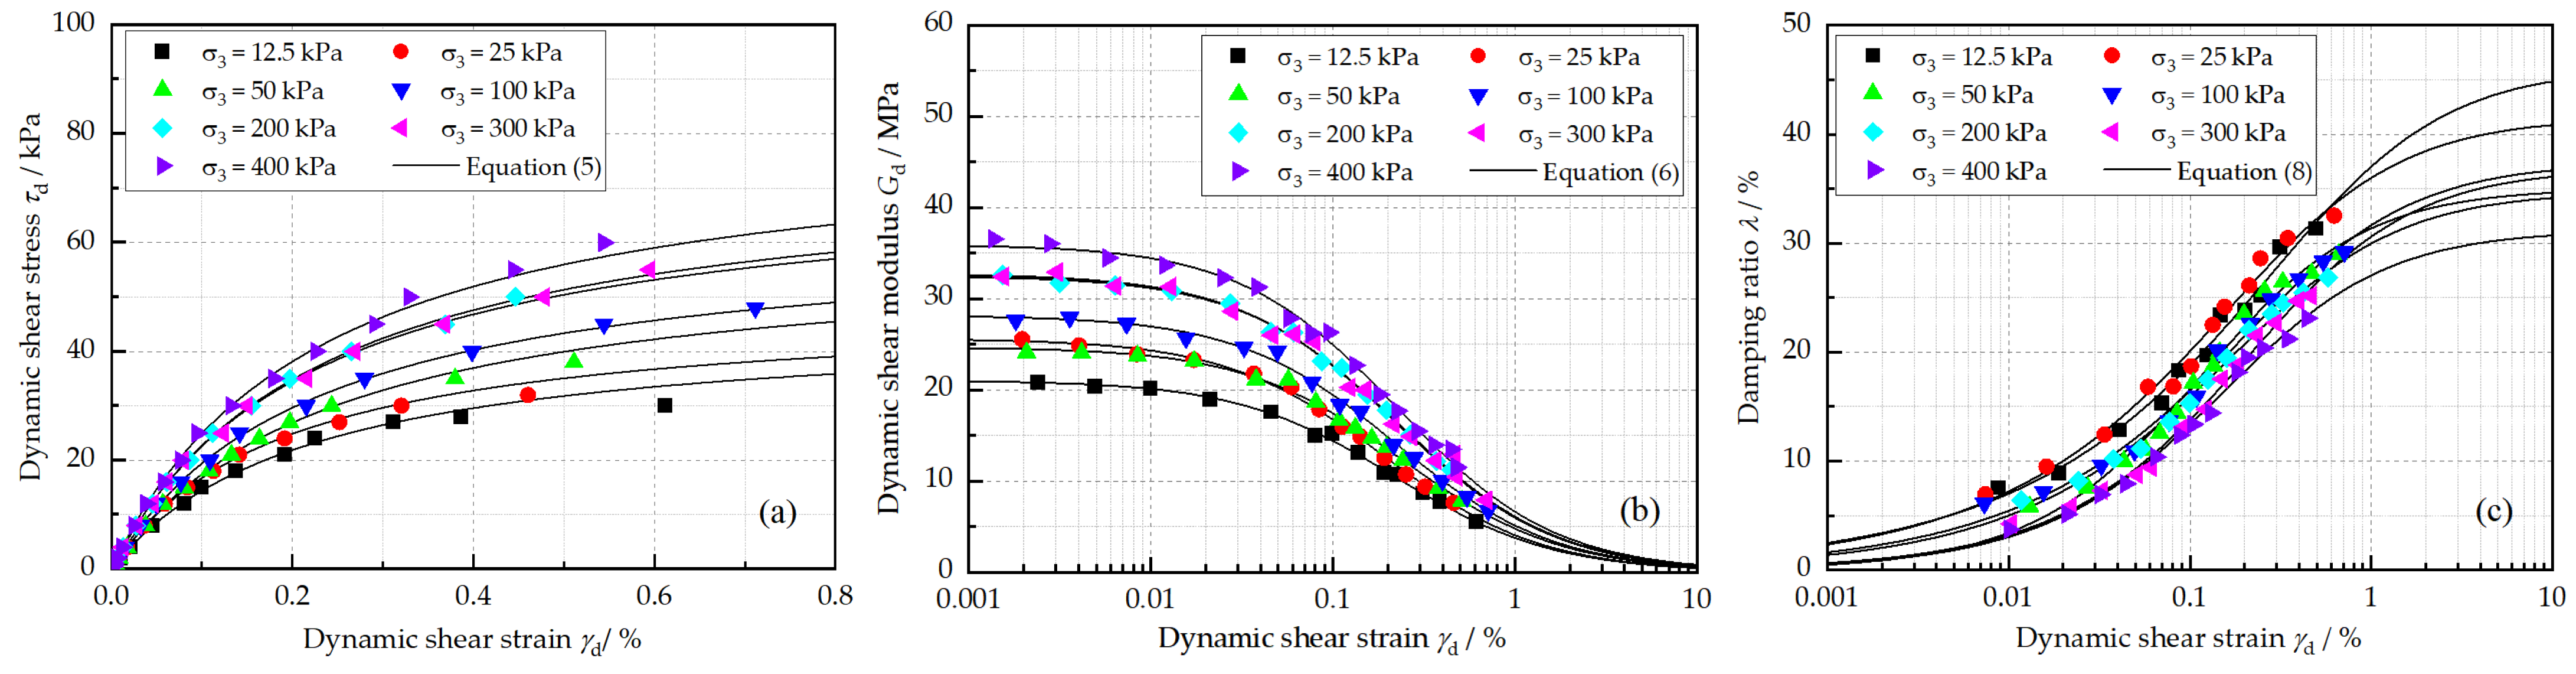
4.5. Effect of Confining Pressure

The effects of confining pressure on the τ d , G d , and λ of reinforced loess are presented in Figure 9. As is shown, τ d and G d increase as the confining pressure increase. An increase in τ dult of up to 70.96% and an increase in G dmax of 67.77% are observed with confining pressures ranging from 12.5 kPa to 400 kPa. Meanwhile, a marked decrease in λ is observed as the confining pressure increases. For example, at a strain amplitude of 0.5%, the value of λ is reduced from 32.18% to 24.00% when the confining pressure increases from 12.5 kPa to 400 kPa.
It can be observed that the dynamic behavior of the reinforced loess is significantly improved by the confining pressure. This can be explained by the enhanced friction force between the particles and by the particle rearrangement in the soil, which leads to less open void space, less partial micro-cracks, and stronger inter-particle contact [34]. In addition to this, this effect also leads to less energy dissipation during wave propagation, and leads to further decreases in λ .

4.6. Theoretical Analytical Formulations

According to Equation (7), G dmax and λ max are important parameters in estimating the dynamic properties of reinforced loess. Therefore, their relationships with the five key factors, N, C FA , C PF , w, and σ 3 , was evaluated first. Subsequently, novel models for the dynamic shear modulus and the damping ratio of reinforced loess in cold regions are constructed.
Before analysis, the standard maximum dynamic shear modulus G dmax 0 and standard maximum damping ratio λ max 0 are introduced to normalize the data and to evaluate the influences of various factors. The G dmax and λ max values of sample T01, which are equal to 28.15 MPa and 34.71%, respectively, were selected.

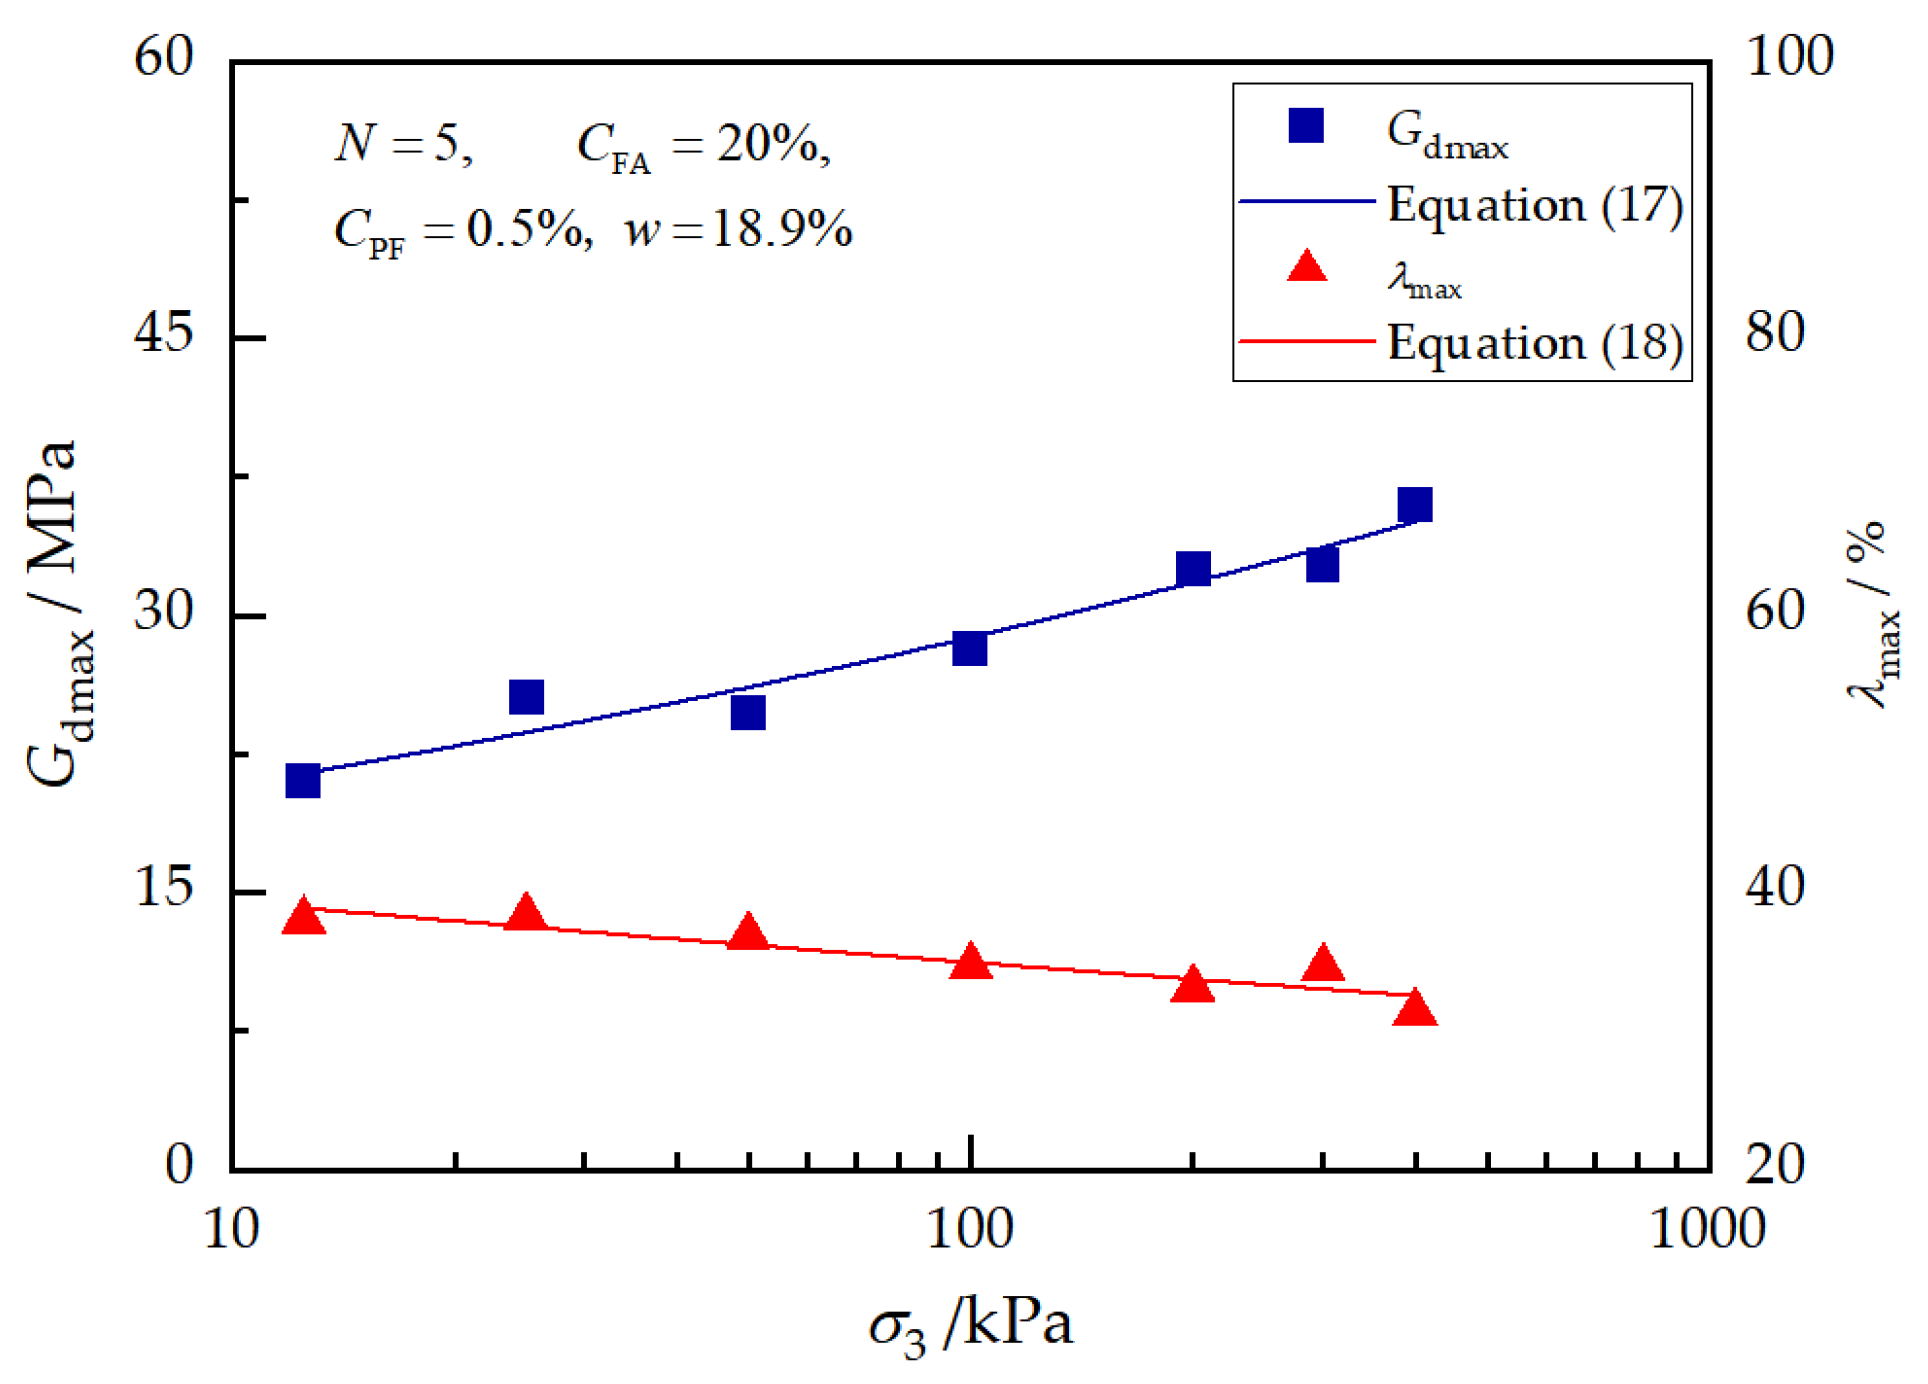
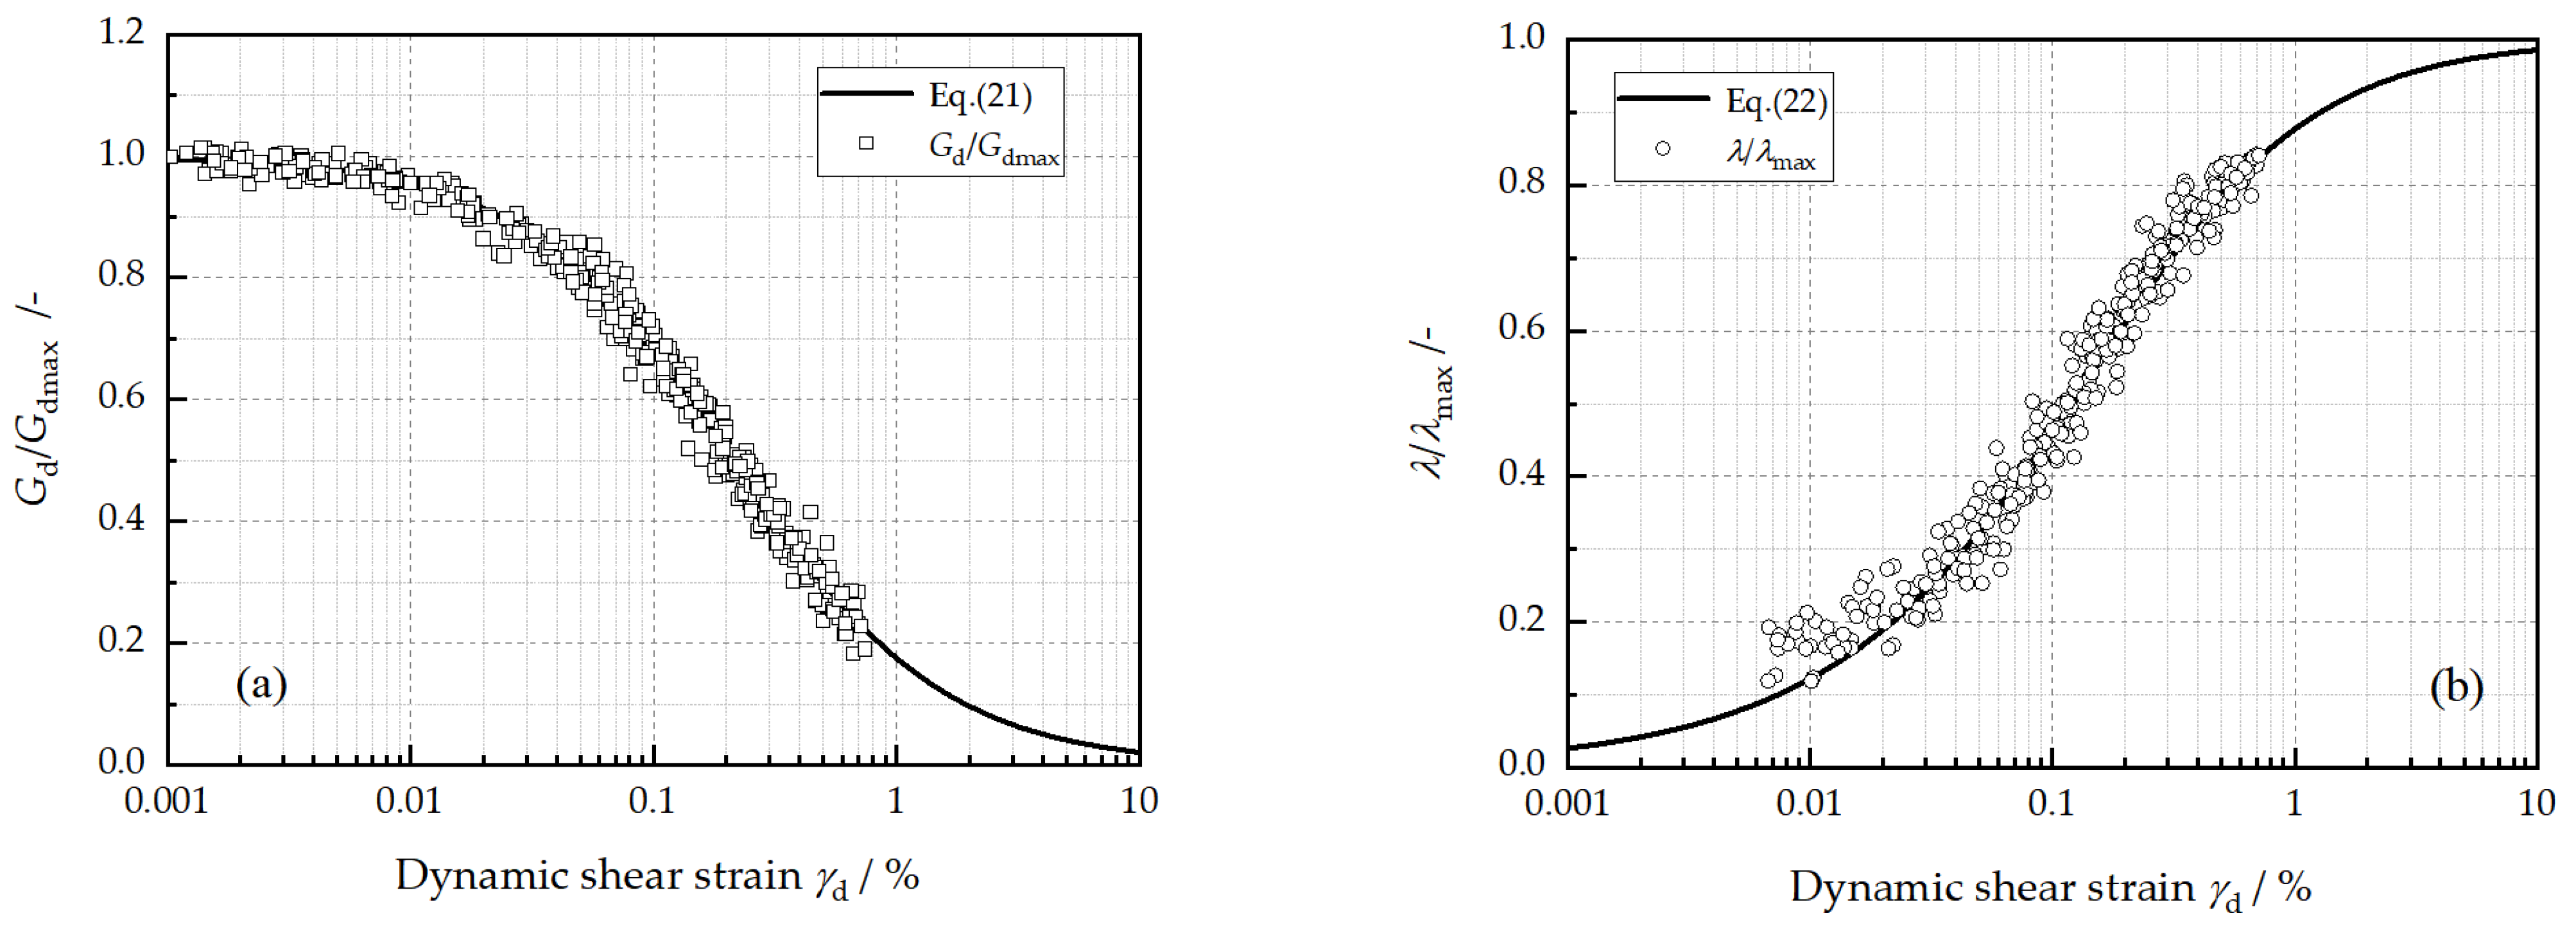
4.6.1. Normalized Maximum Shear Modulus and Damping Ratio

Figure 10 exhibits the relationships of G dmax and λ max with the number of F–T cycles. It can be observed G dmax sharply decreases from 48.52 MPa to 28.15 MPa and reaches its stable state after approximately five F–T cycles. Meanwhile, λ max increases almost linearly with the number of F–T cycles. Their relationship with the number of F–T cycles can be described by the following equations:
G dmax = 20.53 · ( e 0.437 N + 1.366 ) = g N ( N ) · G dmax 0 ,
λ max = 1.194 · N + 29.057 = d N ( N ) · λ max 0 ,
where g N ( N ) and d N ( N ) represent the normalized parameters, G dmax / G dmax 0 and λ max / λ max 0 , which are affected by the number of F–T cycles.
Figure 11 depicts the variations in G dmax and λ max caused by the FA content. As shown, G dmax keeps increasing near-linearly from 20.2 MPa to 32.5 MPa, achieving an increase of 60% when the FA content is increased from 0% to 30%. Similarly, λ max exhibits a linearly increasing tendency from 44.85% to 32.11% with the FA content. The following equations are used to describe these relationships:
G dmax = 0.4418 · C FA + 19.76 = g f ( C FA ) · G dmax 0 ,
λ max = 0.3029 · C FA + 41.17 = d f ( C FA ) · λ max 0 ,
where g f ( C FA ) and d f ( C FA ) represent the normalized parameters, G dmax / G dmax 0 and λ max / λ max 0 , which are affected by the FA content.
Figure 12 shows the effects of PF on the G dmax and λ max of reinforced loess. Generally, the effects of the PF content were found to not be significant in comparison to other factors. When the PF content increased from 0.0% to 1.0%, G dmax first experienced a moderate increase, and thereafter, it decreased slightly, while λ max increased almost linearly with the PF content. A quadratic polynomial and a linear model were proposed, respectively, for G dmax and λ max as follows:
G dmax = 11.50 · C PF 2 + 13.80 · C PF + 23.27 = g p ( C PF ) · G dmax 0 ,
λ max = 10.00 · C PF + 31.25 = d p ( C PF ) · λ max 0 ,
where g p ( C PF ) and d p ( C PF ) represent the normalized parameters, G dmax / G dmax 0 and λ max / λ max 0 , which are affected by the PF content.
Figure 13 presents the effects of the initial water content on the G dmax and λ max of reinforced loess. As shown in the figure, a noticeable decrease in G dmax and an increase in λ max are observed when the initial water content increases from 13% to 25%. The effects of the initial water content can be described by the following equations:
G dmax = 0.8790 · w + 45.16 = g w ( w ) · G dmax 0 ,
λ max = 0.4612 · w + 26.82 = d w ( w ) · λ max 0 ,
where g w ( w ) and d w ( w ) represent the normalized parameters, G dmax / G dmax 0 and λ max / λ max 0 , which are affected by the initial water content.
Figure 14 generates G dmax and λ max versus the confining pressure on the semi-logarithmic scale. As shown in the figure, an approximately linear increase in G dmax and an approximately linear decrease in λ max are observed as the confining pressure increases. Through regression analysis, G dmax and λ max are described by the following Equations:
G max = 28.87 · ( σ 3 / p a ) 0.142 = g σ ( σ 3 ) · G max 0 ,
λ max = 34.93 · ( σ 3 / p a ) 0.05113 = d σ ( σ 3 ) · λ max 0 ,
where g σ ( σ 3 ) and d σ ( σ 3 ) represent the normalized parameters, G dmax / G dmax 0 and λ max / λ max 0 , which are affected by the confining pressure; p a is the atmospheric pressure, 101.3 kPa.

4.6.2. Empirical Expression for Dynamic Shear Modulus

Considering the effects of F–T cycles, FA content, PF content, initial water content, and confining pressure, Equations (19) and (20) are proposed to predict the G dmax and λ max of reinforced loess in Equations (7) and (8):
G dmax = g N ( N ) × g f ( C FA ) × g p ( C PF ) × g w ( w ) × g σ ( σ 3 ) × G dmax 0 ,
λ max = d N ( N ) × d f ( C FA ) × d p ( C PF ) × d w ( w ) × d σ ( σ 3 ) × λ max 0 ,
where the parameters and normalized functions of G dmax and λ max have been discussed in the former parts.
Figure 15 presents the comparisons of the experimental G dmax and λ max with the predicted values from Equations (19) and (20). It can be observed that both the predicted G dmax and λ max exhibit an approximate linear relationship of 1:1 with the test data, which indicates that the G dmax and λ max of reinforced loess can be estimated from these equations well.
Generally, G d and λ are normalized by G dmax and λ max , respectively. As shown in Figure 16, the normalized dynamic shear modulus at different experimental conditions presents a similar variation tendency, and so does the normalized damping ratio. Equations (7) and (8) are utilized to fit these normalized data and result in Equations (21) and (22):
G d G dmax = 1 1 + γ d / γ ¯ dr ,
λ λ max = ( 1 1 1 + γ d / γ ¯ dr ) n ¯ ,
where γ ¯ dr and n ¯ are normalized the parameters and are equal to 0.2132 and 0.6757, respectively.
Substituting Equation (19) into Equation (21), a comprehensive function for the G d of modified loess by considering multiple factors is established as follows:
G d = G dmax 0 1 + γ d / γ ¯ dr × 20.53 · ( e 0.437 N + 1.366 ) × ( 0.4418 · C FA + 19.76 ) × ( 11.50 · C PF 2 + 13.80 · C PF + 23.27 ) × ( 0.8790 · w + 45.16 ) , × 28.87 · ( σ 3 / p a ) 0.142 × G dmax 0 5
Similarly, an empirical expression for the damping ratio can be deduced as:
λ = λ max 0 × ( 1 1 1 + γ d / γ ¯ dr ) n × ( 1.194 · N + 29.06 ) × ( 0.3029 · C FA + 41.17 ) × ( 10.00 · C PF + 31.25 ) , × ( 0.4612 · w + 26.82 ) × 34.93 · ( σ 3 / p a ) 0.05113 × λ max 0 5
where G d and G dmax 0 are expressed in MPa; C FA , C PF , and w are expressed as percentages (%); σ 3 and p a are expressed in kPa; and G dmax 0 and λ max 0 are equal to 28.15 MPa and 34.71%, respectively.
Figure 17 presents the comparisons of the experimental values of G d and λ with the corresponding predicted values by Equations (23) and (24). It can be seen that the predicted results are in good agreement with the experimental values. The correlation coefficients are up to 0.952 and 0.973, respectively. It can be concluded that the prediction models can be confidently applied to estimate G d and λ in designing FA–PF-reinforced loess.

5. Conclusions

In this study, a series of dynamic triaxial tests were performed on loess that had been reinforced with FA and PF. The dynamic shear stress, dynamic shear modulus, and damping ratio were analyzed by considering five key factors for reinforced soil in cold regions. Finally, the impacts of these factors were incorporated into newly established models to determine the dynamic shear modulus and damping ratio. The following major conclusions can be drawn:
(1)
The reinforced samples exhibited strain-hardening behavior. The Hardin model was adopted to describe the dynamic shear stress–strain relationships and exhibited good agreement with the experimental data.
(2)
A considerable reduction in the dynamic shear modulus was observed with increasing freeze–thaw cycles and initial water content. On the contrary, the dynamic shear modulus increased as the FA content and confining pressure increases. The sample with 0.5% PP fiber showed the best dynamic performance, and generally, the impact of PP fiber is not significant by comparison.
(3)
The damping ratio decreased as the FA content and confining pressure increased. However, it increased with cyclic freezing–thawing, PF content, and initial water content, which illustrates the better energy dissipation performance of the reinforced loess.
(4)
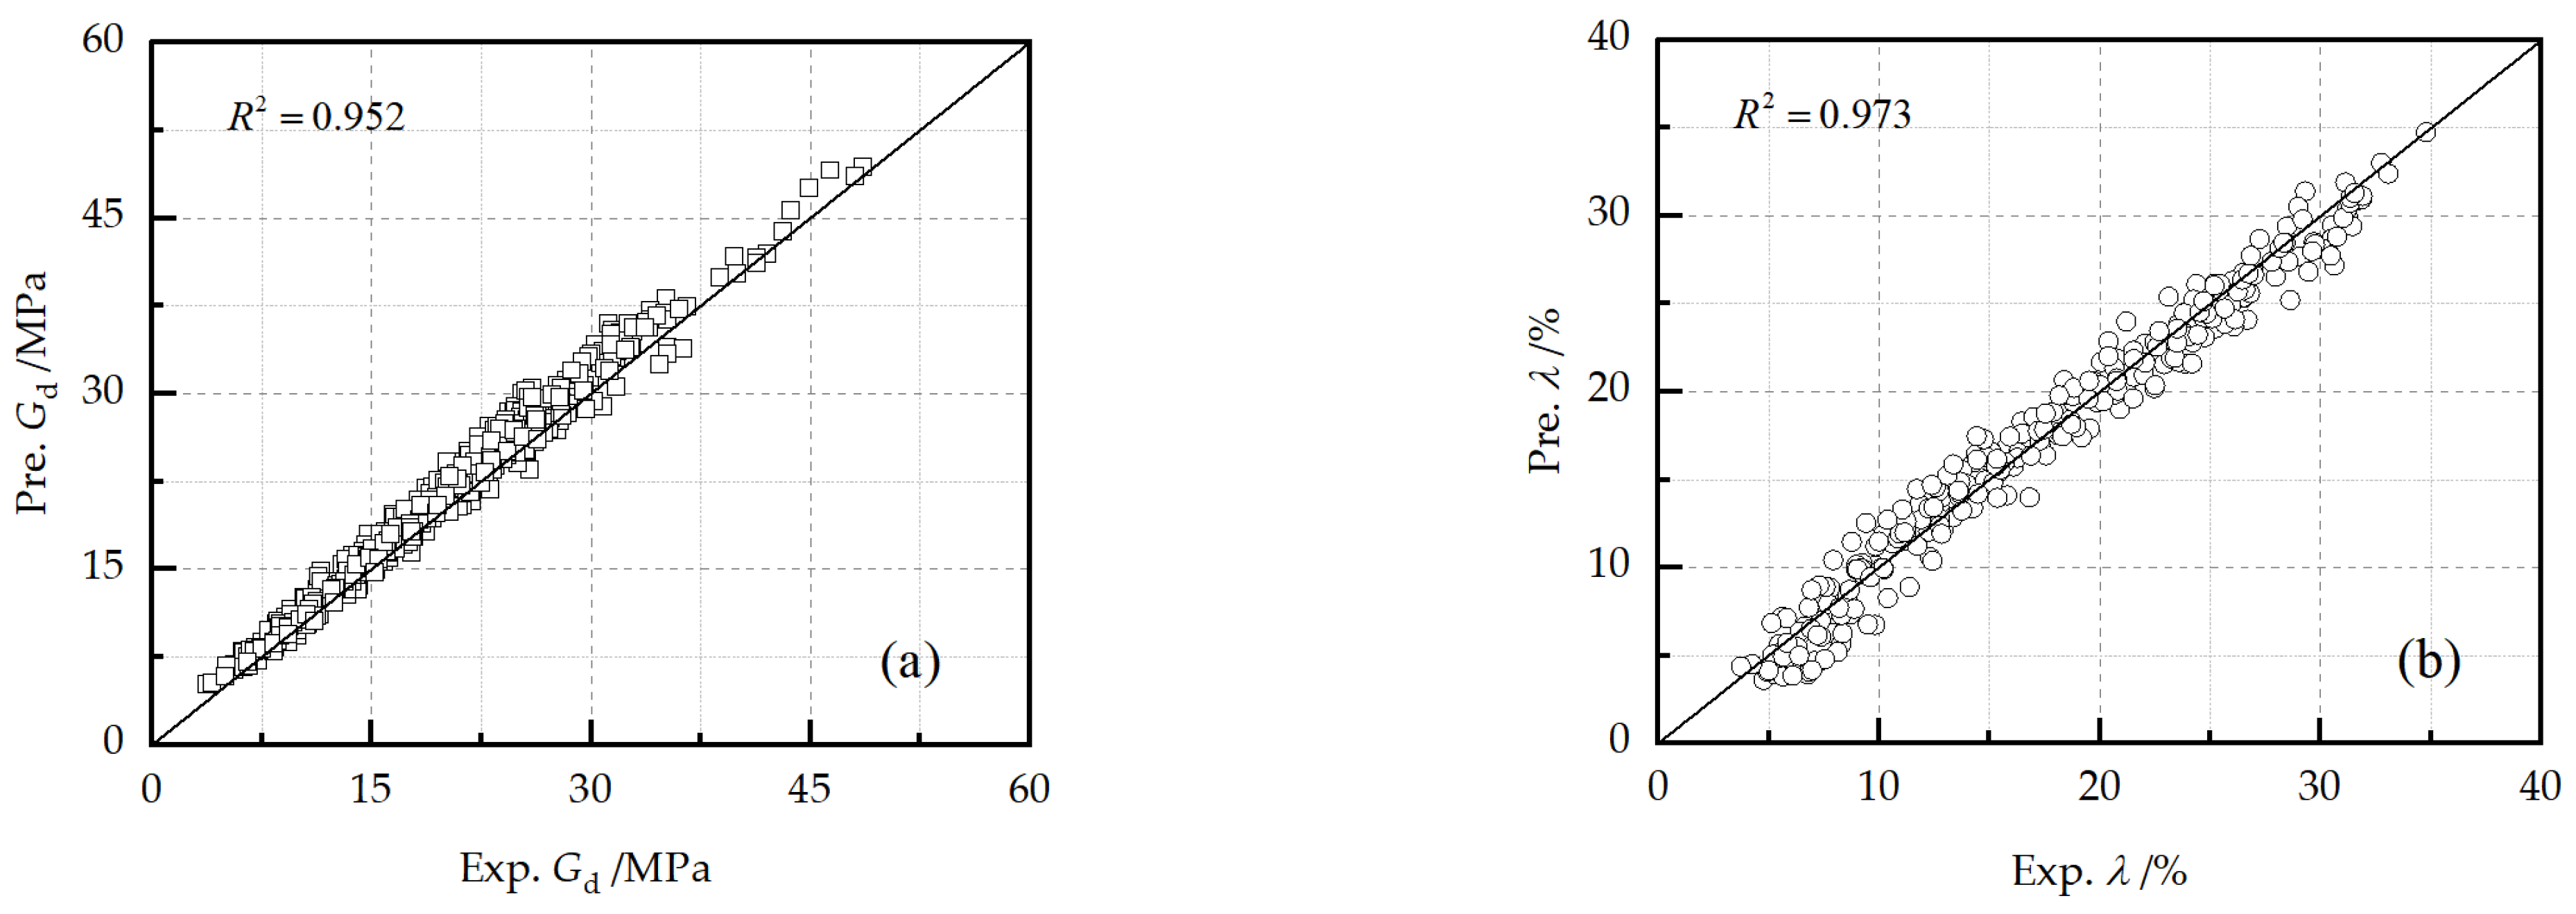
Novel empirical models for the dynamic shear modulus and damping ratio were established by taking account of freeze–thaw cycle, FA content, PF content, initial water content, and confining pressure. The comparison of the experimental and predicted results illustrated that the newly established models are suitable to estimate the dynamic shear modulus and damping ratio of fly ash–polypropylene fiber-reinforced loess.

Author Contributions

Conceptualization, S.C.; methodology, S.C.; validation, T.L.; formal analysis, S.C.; investigation, S.C.; data curation, Y.Z.; writing—original draft preparation, S.C.; writing—review and editing, T.L. and G.L.; project administration, S.C.; funding acquisition, S.C. All authors have read and agreed to the published version of the manuscript.

Funding

This research was funded by the National Natural Science Foundation of China (12102367), the Natural Science Basic Research Program of Shaanxi Province (2021JQ-870), the Special Fund for Scientific Research by Shaanxi Provincial Education Department (21JK0961), and the Special Fund for the Launch of Scientific Research in Xijing University (XJ20B11).

Institutional Review Board Statement

Not applicable.

Informed Consent Statement

Not applicable.

Data Availability Statement

The data presented in this study are available on request from the corresponding author.

Acknowledgments

The Youth Innovation Team of Shaanxi Universities is acknowledged.

Conflicts of Interest

The authors declare no conflict of interest.

References

  1. Lu, J.; Sun, B.; Ren, F.; Li, H.; Jiao, X. Effect of Freeze-Thaw Cycles on Soil Detachment Capacities of Three Loamy Soils on the Loess Plateau of China. Water 2021, 13, 342. [Google Scholar] [CrossRef]
  2. Yang, M.; Li, H.; Li, N.; Yang, S. Effect of subway excavation with different support pressures on existing utility tunnel in Xi’an loess. Adv. Civ. Eng. 2020, 2020, 8818949. [Google Scholar] [CrossRef]
  3. Lian, B.; Peng, J.; Zhan, H.; Wang, X. Mechanical response of root-reinforced loess with various water contents. Soil Till. Res. 2019, 193, 85–94. [Google Scholar] [CrossRef]
  4. Mariri, M.; Moayed, R.Z.; Kordnaeij, A. Stress-strain behavior of loess soil stabilized with cement, zeolite, and recycled polyester fiber. J. Mater. Civil Eng. 2019, 31, 4019291. [Google Scholar] [CrossRef]
  5. Chen, S.F.; Kong, L.W.; Xu, G.F. An effective way to estimate the Poisson’s ratio of silty clay in seasonal frozen regions. Cold Reg. Sci. Technol. 2018, 154, 74–84. [Google Scholar] [CrossRef]
  6. Kravchenko, E.; Liu, J.; Krainiukov, A.; Chang, D. Dynamic behavior of clay modified with polypropylene fiber under freeze-thaw cycles. Transp. Geotech. 2019, 21, 100282. [Google Scholar] [CrossRef]
  7. Gao, C.H.; Du, G.Y.; Guo, Q.; Zhuang, Z.X. Static and dynamic behaviors of basalt fiber reinforced cement-soil after freeze-thaw cycle. KSCE J. Civ. Eng. 2020, 24, 3573–3583. [Google Scholar] [CrossRef]
  8. Liu, H.M.; Wang, L.M.; Gao, P. The mechanical properties of cement reinforced loess and pore microstructure characteristics. Appl. Mech. Mater. 2014, 527, 25–30. [Google Scholar] [CrossRef]
  9. An, Q.; Zhang, Q.; Zhang, X.; Zhang, J. Bridging the gap between engineering properties and grouting reinforcement mechanisms for loess in eastern China: Taking Jinan loess as an example. Bull. Eng. Geol. Environ. 2021, 80, 4125–4141. [Google Scholar] [CrossRef]
  10. Jiang, Y.; Yuan, K.; Li, Q.; Deng, C.; Xue, J. Comparison of mechanical properties of cement-stabilized loess produced using different compaction methods. Adv. Mater. Sci. Eng. 2020, 2020, 1–20. [Google Scholar] [CrossRef]
  11. Ahmaruzzaman, M. A review on the utilization of fly ash. Prog. Energ. Combust. 2010, 36, 327–363. [Google Scholar] [CrossRef]
  12. Rosa, M.G.; Cetin, B.; Edil, T.B.; Benson, C.H. Freeze-thaw performance of fly ash-stabilized materials and recycled pavement materials. J. Mater. Civil Eng. 2017, 29, 4017015. [Google Scholar] [CrossRef]
  13. Orakoglu, M.E.; Liu, J.; Niu, F. Dynamic behavior of fiber-reinforced soil under freeze-thaw cycles. Soil Dyn. Earthq. Eng. 2017, 101, 269–284. [Google Scholar] [CrossRef]
  14. Wei, H.; Jiao, Y.; Liu, H. Effect of freeze-thaw cycles on mechanical property of silty clay modified by fly ash and crumb rubber. Cold Reg. Sci. Technol. 2015, 116, 70–77. [Google Scholar] [CrossRef]
  15. Lang, L.; Li, F.; Chen, B. Small-strain dynamic properties of silty clay stabilized by cement and fly ash. Constr. Build. Mater. 2020, 237, 117646. [Google Scholar] [CrossRef]
  16. Liu, Z.; Cai, C.S.; Liu, F.; Fan, F. Feasibility study of loess stabilization with fly ash-based geopolymer. J. Mater. Civil Eng. 2016, 28, 04016003. [Google Scholar] [CrossRef]
  17. Arora, S.; Aydilek, A.H. Class f fly-ash-amended soils as highway base materials. J. Mater. Civil Eng. 2005, 17, 640–649. [Google Scholar] [CrossRef] [Green Version]
  18. Bin-Shafique, S.; Rahman, K.; Yaykiran, M.; Azfar, I. The long-term performance of two fly ash stabilized fine-grained soil subbases. Resour. Conserv. Recycl. 2010, 54, 666–672. [Google Scholar] [CrossRef]
  19. Kravchenko, E.; Liu, J.; Niu, W.; Zhang, S. Performance of clay soil reinforced with fibers subjected to freeze-thaw cycles. Cold Reg. Sci. Technol. 2018, 153, 18–24. [Google Scholar] [CrossRef]
  20. Li, L.; Shao, W.; Li, Y.; Cetin, B. Effects of climatic factors on mechanical properties of cement and fiber reinforced clays. J. Geotech. Geoenviron. 2015, 33, 537–548. [Google Scholar] [CrossRef]
  21. Zaimoglu, A.S. Freezing-thawing behavior of fine-grained soils reinforced with polypropylene fibers. Cold Reg. Sci. Technol. 2010, 60, 63–65. [Google Scholar] [CrossRef]
  22. Roustaei, M.; Eslami, A.; Ghazavi, M. Effects of freeze-thaw cycles on a fiber reinforced fine grained soil in relation to geotechnical parameters. Cold Reg. Sci. Technol. 2015, 120, 127–137. [Google Scholar] [CrossRef]
  23. Chae, Y.S.; Chaiang, J.C. Dynamic properties of lime and LFA treated soils. In Proceedings of the ASCE Geotechnical Engineering Division Specialty Conference, Pasadena, CA, USA, 19–21 June 1978. [Google Scholar]
  24. Fatahi, B.; Fatahi, B.; Le, T.M.; Khabbaz, A.H. Small-strain properties of soft clay treated with fibre and cement. Geosynth. Int. 2013, 20, 286–300. [Google Scholar] [CrossRef] [Green Version]
  25. Fahoum, K.; Aggour, M.S.; Amini, F. Dynamic properties of cohesive soils treated with lime. J. Geotech. Eng. 1996, 122, 382–389. [Google Scholar] [CrossRef]
  26. Saride, S.; Dutta, T.T. Effect of fly-ash stabilization on stiffness modulus degradation of expansive clays. J. Mater. Civil Eng. 2016, 28, 4016166. [Google Scholar] [CrossRef]
  27. ASTM. Standard Specification for Coal Fly Ash and Raw or Calcined Natural Pozzolan for Use in Concrete; ASTM International: West Conshohocken, PA, USA, 2015. [Google Scholar]
  28. Ghazavi, M.; Roustaie, M. The influence of freeze-thaw cycles on the unconfined compressive strength of fiber-reinforced clay. Cold Reg. Sci. Technol. 2010, 61, 125–131. [Google Scholar] [CrossRef]
  29. Hardin, B.; Drnevich, V. Shear modulus and damping in soils: Design equations and curves. J. Soil Mech. Found. Div. 1972, 98, 667–692. [Google Scholar] [CrossRef]
  30. Jing, R.; Zhang, F.; Feng, D.; Liu, X.; Scarpas, A. Dynamic shear modulus and damping ratio of compacted silty clay subjected to freeze-thaw cycles. J. Mater. Civil Eng. 2019, 31, 4019244. [Google Scholar] [CrossRef]
  31. Lin, B.; Zhang, F.; Feng, D.; Tang, K.; Feng, X. Dynamic shear modulus and damping ratio of thawed saturated clay under long-term cyclic loading. Cold Reg. Sci. Technol. 2018, 145, 93–105. [Google Scholar] [CrossRef]
  32. Su, Y.Q.; Ma, W.; Zhong, X.M.; Wang, Q.; Mu, Y.H. Experimental study of influence of freeze-thaw cycles on damping ratio of remolded Qinghai-Tibet silty clay. Chin. J. Rock Mech. Eng. 2021, 40, 2960–2967. [Google Scholar]
  33. Kong, L.M.; Liang, K.; Peng, L.Y. Experimental study on the influence of specific surface area on the soil-freezing characteristic curve. Rock Soil Mech. 2021, 7, 1883–1893. (In Chinese) [Google Scholar]
  34. Cai, J.; Dong, B.Y. Micro-structure study on collapsibility loess with SEM method. Appl. Mech. Mater. 2011, 52–54, 1279–1283. [Google Scholar] [CrossRef]
Figure 1. Particle size distribution curve of the loess and fly ash.
Water 14 00317 g001
Figure 2. Test equipment: (a) Programmable temperature-controlled chamber; (b) GDS dynamic triaxial test system (GDS DYNTTS).
Water 14 00317 g002
Figure 3. Application diagram of multi-stage cyclic loading.
Water 14 00317 g003
Figure 4. Determination of dynamic soil properties.
Water 14 00317 g004
Figure 5. Effects of freeze–thaw cycle on (a) backbone curve, (b) dynamic shear modulus, and (c) damping ratio, under the conditions of C FA = 20%, C PF = 0.5%, w = 18.9%, and σ 3 = 100 kPa.
Water 14 00317 g005
Figure 6. Effects of fly ash on (a) backbone curve, (b) dynamic shear modulus, and (c) damping ratio under the conditions of N = 5, C PF = 0.5%, w = 18.9%, and σ 3 = 100 kPa.
Water 14 00317 g006
Figure 7. Effects of polypropylene fiber content on (a) backbone curve, (b) dynamic shear modulus, and (c) damping ratio under the conditions of N = 5, C FA = 20%, w = 18.9%, and σ 3 = 100 kPa.
Water 14 00317 g007
Figure 8. Effects of initial water content on (a) backbone curve, (b) dynamic shear modulus, and (c) damping ratio under the conditions of N = 5, C FA = 20%, C PF = 0.5%, and σ 3 = 100 kPa.
Water 14 00317 g008
Figure 9. Effects of confining pressure on (a) backbone curve, (b) dynamic shear modulus, and (c) damping ratio under the conditions of N = 5, C FA = 20%, C PF = 0.5% and w = 18.9%.
Water 14 00317 g009
Figure 10. Effects of freeze–thaw cycle on G dmax and λ max .
Water 14 00317 g010
Figure 11. Effects of fly ash content on G dmax and λ max .
Water 14 00317 g011
Figure 12. Effects of polypropylene fiber content on G dmax and λ max .
Water 14 00317 g012
Figure 13. Effects of initial water content on G dmax and λ max .
Water 14 00317 g013
Figure 14. Effects of confining pressure on G dmax and λ max .
Water 14 00317 g014
Figure 15. Prediction results (Pre.) against experimental results (Exp.): (a) maximum dynamic shear modulus, (b) maximum damping ratio.
Water 14 00317 g015
Figure 16. Normalized data versus dynamic shear strain: (a) normalized dynamic shear modulus, (b) normalized damping ratio.
Water 14 00317 g016
Figure 17. Prediction results (Pre.) against experimental results (Exp.) for reinforced loess: (a) dynamic shear modulus, (b) damping ratio.
Water 14 00317 g017
Table 1. Physical properties of the loess in the present work.
Properties Value
Specific gravity(-)2.64
Plastic limit(%)20.6
Liquid limit(%)34.2
Plastic index(-)13.6
Optimum moisture content(%)14.4
Dry density(kg/m3)1760
Table 2. Chemical composition of fly ash.
CompositionValue (Percentage by Weight)
SiO254.24
Al2O324.69
Fe2O34.8
CaO7.7
MgO4.2
K2O0.38
Na2O0.85
TiO20.44
Ignition Loss (950 °C)2.7
Table 3. Parameters of the polypropylene fiber.
Parameter Value
Fiber type(-)Single fiber
Length(mm)12.00
Diameter(mm)0.048
Density(g/cm3)0.91
Modulus of elasticity(GPa)4.8
Elongation at break(%)15.00
Breaking tensile strength(MPa)486.00
Table 4. Summary of dynamic triaxial test conditions.
SeriesN C FA ( % ) C PF ( % ) w (%) σ 3   ( kPa ) Symbol
15200.518.9100T01
20, 1, 2, 3, 7, 10200.518.9100T02~T07
350, 5, 10, 15, 300.518.9100T08~T12
45200, 0.25, 0.75, 1.018.9100T13~T16
55200.513, 16, 22, 25100T17~T20
65200.518.912.5, 25, 50, 200, 300, 400T21~T26
Notes: N: number of F–T cycles; C FA : FA content; C PF : PF content; w: water content; σ 3 : confining pressure.
Publisher’s Note: MDPI stays neutral with regard to jurisdictional claims in published maps and institutional affiliations.

