Abstract
In this study, to address drinking water supply problems, a new drinking water supply system that combines the aquifer storage transfer and recovery (ASTR) technique and hazard analysis and critical control point (HACCP) was introduced. ASTR, a type of managed aquifer recharge, protects and purifies water resources using aquifers, whereas HACCP increases drinking water safety by analyzing and controlling hazards. The system was applied by installing an ASTR pilot plant in the Samrak Park in the Nakdong River delta in South Korea where the deteriorating water quality of the water supply sources has affected the drinking water supply. HACCP analysis revealed that 114 hazardous events occurred during various stages of water processing from the water intake source to the consumers. The analysis of the risks of these events revealed that nine of these risks can be considered as major hazardous events. In addition, the analysis of potential risks using a stochastic methodology revealed that the Gangseo-gu District in Busan exhibited the highest potential risk. Furthermore, critical control points were determined using a decision tree, and management criteria, management methods, verification methods, documentation, and recording methods were proposed. These results indicate that the application of HACCP to ASTR can improve drinking water safety.
1. Introduction
Climate change has increased the difficulties involved in securing water sources because it causes changes that cannot be controlled by existing water resource management systems. For example, increased temperature results in changes in rainfall patterns and an increase in evaporation loss [1]. Furthermore, climate change results in a more frequent occurrence of extreme events, such as floods and droughts [2]. Accordingly, the amount of available water per person in South Korea is expected to decrease by 6.23% by 2025 compared to that in 1993 [3]. The existing water resource management system in South Korea is incapable of optimally managing water resources to address such changes. This indicates that the loss of water resources may increase, and drinking water supply problems may emerge owing to broader regional disparities.
Generally, water quality accidents affect public health. Over the years, several major water quality accidents have occurred, such as the Sandoz chemical spill in 1986, during which 1300 tons of pesticide flowed into the Rhine River owing to a fire incident, and the 2014 Elk River chemical spill, during which a chemical substance flowed into the Elk River in Charleston, West Virginia [4]. The continuous occurrence of such contaminant spills erodes public trust in the quality of drinking water, thus leading to a low drinking rate. To address these issues, the aquifer storage transfer and recovery (ASTR) technique, which is used to supply drinking water using aquifers, and the hazard analysis and critical control point (HACCP), which is a quality management system for processed food, have attracted attention.
The ASTR technique, which is a type of managed aquifer recharge (MAR) technique, stores surface water in aquifers using injection wells, after which the water is abstracted from abstraction wells (Figure 1). Since the 1980s, MAR has attracted widespread application and research attention in Europe [5], the United States, Australia, Japan, Southeast Asia [6], and the Middle East [7]. Particularly, MAR has attracted attention owing to its attractive advantages, such as a large aquifer storage area, low cost of using aquifers, no evaporation loss, no pollutants infiltration or algae bloom, sustainable storage and usage, and water purification [8]. Furthermore, MAR enables the discharge of saline groundwater from surface water injected from coastal areas using saline aquifers, and the formation of a buffer zone and an independent fresh water body, thereby enabling the supply of drinking water [9,10].
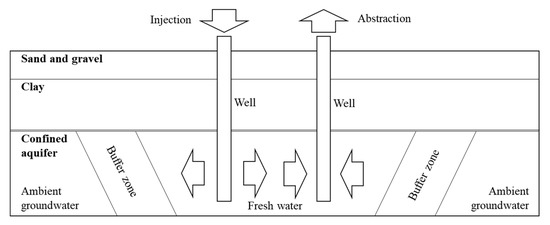
Figure 1.
Schematic of the aquifer storage transfer and recovery (ASTR) technique.
In addition to the advantages of MAR, ASTR enables a separate injection and pumping of water. Generally, ASTR is applied to confined aquifers containing several injection and abstraction wells. For example, in Australia, where more than 60% of the land area has a desert climate with an annual precipitation of 250 mm or less, MAR is actively used to store and reuse water. Particularly, ASTR is applied in several Australian cities, including Perth, Melbourne, and Adelaide [11].
HACCP, which is a food quality management system, is used to analyze potential hazards during the entire processing of food from the introduction of raw materials to production and to supply to consumers. Specifically, it involves the selection of critical control points (CCPs) to systematically and efficiently manage these hazards, thereby securing food safety [12]. HACCP has been employed for several applications. For example, HACCP was employed as an administrative guideline for food safety by the Food and Agriculture Organization (FAO) of the United Nations and the World Health Organization (WHO) in 1993. Subsequently, it has been adopted in the food safety acts of most countries globally, and is mainly applied to processed foods. In the 1990s, a study investigated the application of HACCP to the processing of drinking water [13]. In addition, Seoul introduced HACCP and ISO 22000 certification to drinking water production in 2016 [14]. Furthermore, Dewettinck et al. [15] investigated the application of HACCP to the production of drinking water using an infiltration pond. In addition, various countries, including the United States [16], Canada [17], and Australia [18], have applied HACCP to the processing of drinking water. This study introduced a drinking water supply system with improved safety in which water was safely stored using an ASTR, and hazards that occur during the drinking water supply process were managed using HACCP.
2. Study Area
The study area investigated in this study was the Nakdong River basin, which is located in the southern region of South Korea. The basin is 400.7 km long, and has an area of approximately 23,000 km2 (Figure 2). By area, this basin consists of 71% forests, 26% rice paddies and farms, and 1.4% cities. By soil type, this basin consists of 71% lithosols, 19% alluvium, and 9% bedrock [19]. The Nakdong River flows through 42 cities (Figure 2 and Table 1), and the total living population in this basin is approximately 7.7 million. The most important city around this basin is Busan, which is the second largest city in South Korea, with a population of 3.4 million. Busan is a major port city with active import, export, and fishery activities, and it serves as a hub for heavy and chemical industries. In Figure 2, Busan includes city no. 40 (Buk-gu District), 41 (Sasang-gu District), and 42 (Gangseo-gu District) with populations of 300,000, 240,000, and 110,000, respectively. Daegu (city no. 2–9), which is another major city in South Korea, is located in the middle of this basin. Daegu is a transportation hub that connects Seoul, which is the capital of South Korea, and Busan. Accordingly, this has resulted in the development of high-tech industries, such as automobile, mechanical, steel, and textile industries, in Daegu. All these cities are subjected to major water management as the main stream of the Nakdong River flows through them, indicating that these cities contribute to the drinking water hazards.
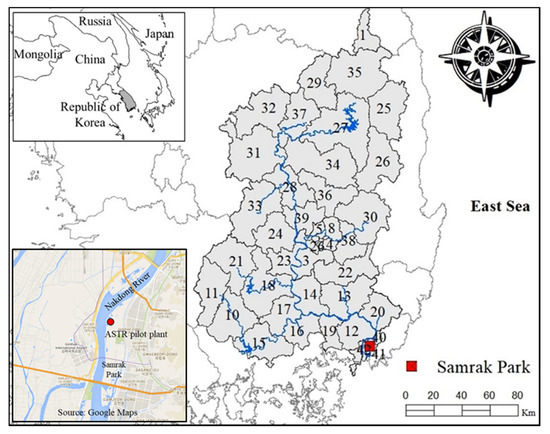
Figure 2.
Location of the ASTR pilot plant and cities around the Nakdong River basin.

Table 1.
Numbers and names of cities on the map of Nakdong River basin.
Owing to the pollution of the Nakdong river, which is a major drinking water resource in South Korea, Busan has been experiencing difficulties in the supply of drinking water. The accidental spill of phenol into the Nakdong River in 1991 [20] has significantly reduced public trust in the quality of drinking water. To address the drinking water problem in Busan, in this study, an ASTR pilot plant was installed in an empty lot on the western side of Samrak Park along the Nakdong River delta (Figure 2). This plant consisted of 12 observation wells, nine injection wells, and eight abstraction wells. The injection and abstraction wells were located within an area with a width and length of 120 m each (Figure 3). In addition, the plant was designed to store 106 m3 of drinking water and to supply water at a rate of 2000 m3/day through the use of multiple injection and abstraction wells. The plant was located at a distance of approximately 50 m from the Nakdong river, which facilitated water intake. Nevertheless, the injection and abstraction wells were watertight to avoid the risks posed by flooding during typhoons and heavy rainfalls. The drinking water supply process using surface water involves seven stages: retrieval of surface water, intake, storage, treatment, storage after purification, distribution, and supply to consumers stages. As shown in Figure 4, the drinking water supply process using ASTR involves three additional steps: pretreatment, injection, and abstraction.
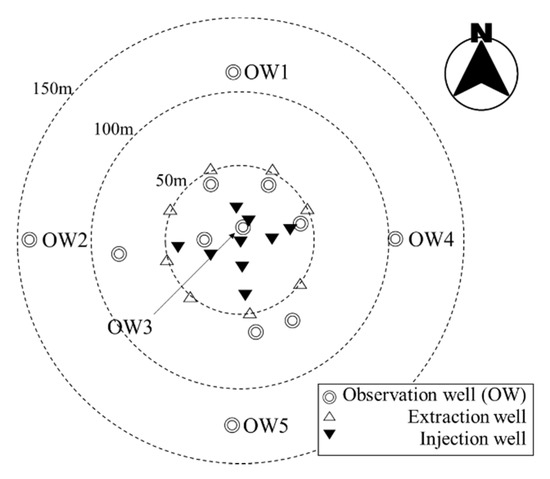
Figure 3.
Arrangement of the wells used for the ASTR technique.
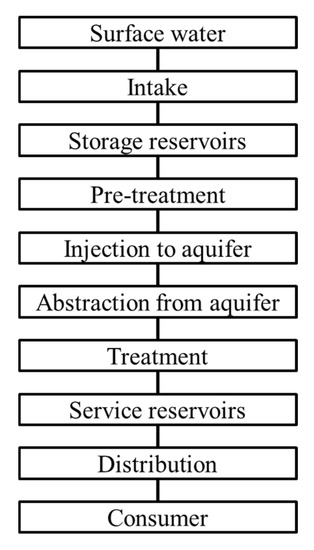
Figure 4.
Flow diagram of the drinking water supply process using ASTR.
Figure 5 shows the geological profiles of the Samrak Park. The observation and sampling wells were installed to obtain geological information near the pilot plant area which is necessary to judge the suitability of MAR introduction and to design and manage the facility. As shown in the image, there is a continuous distribution of a clayey layer with a thickness of 10–30 m above a confined aquifer under the Samrak Park, and this layer blocked the infiltration of pollutants from the ground surface. The stratum of the region where the pilot plant was installed consisted of clay, sand, gravel, and weathered rock layers. The injection and abstraction of fresh water occurred in a confined aquifer comprised of sand and gravel layers located at a depth of 40–70 m underground. In addition, the thickness and permeability coefficient of the sand layer were 17–24.5 m and 1.3–34 m/day, respectively, and those of the gravel layer were 2.8–11 m and 70–300 m/day, respectively. If the sand and gravel layers were considered as one aquifer, the average permeability coefficient of the aquifer was 40 m/day. The ground surface consisted of alluvium and exhibited a slightly high pollution level in 2009 with a copper and lead concentration of 7.44 and 9.85 mg/kg, respectively. However, the clay layer, which exhibited an average thickness of 16 m and an excellent connectivity, protected the confined aquifer below, which was comprised of sand and gravel layers, from external pollutants.
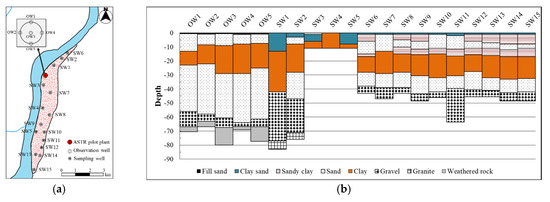
Figure 5.
Boring test results of the observation and sampling wells in the Samrak Park, (a) location of wells, (b) well logs (modified from [21]).
The analysis results of the groundwater samples collected from the confined aquifer located at a depth of at least 30 m underground at Samrak Park are as follows. The aquifer can be considered as a saline aquifer based on its electrical conductivity (EC), salinity, chloride ion level, and sodium ion level of 40.7 mS/cm, 26.1 psu, 17,107.3 mg/L, and 8639.9 mg/L, respectively [22]. In addition, according to the drinking water standards, as the nitrate concentration was undetectable, the possibility of organic pollution was low. Furthermore, the levels of pH (7.7), sulfate ion (13.8 mg/L), manganese (1.3 mg/L), and dissolved oxygen (DO; 0.9 mg/L) were low, whereas those of total dissolved solids (TDS, 26.4 g/L) and iron (11.6 mg/L) were high [22]. These levels indicate that the aquifer meets the criteria for storing drinking water.
The water quality assessment of the Nakdong River, which is the water source of the cities along the basin, indicated that the river exhibited appropriate levels of DO, biochemical oxygen demand, total phosphorus, and total oxygen demand for drinking water. However, the pH, chemical oxygen demand (COD), suspended solids (SS), total coliform, and fecal coliform levels of the river were particularly high in summer and fall. The pH level of the river was maintained above 8.5 during 25% of the operation period, the COD was maintained at over 7 mg/L during 50% of the operation period, and the SS was generally low, but could be as high as 78.7 mg/L (Table 2). In addition, the average total coliform was 6825.7, and it was maintained at above 6850 during 25% of the operation period and could be as high as 122,400. Furthermore, the fecal coliform was generally under 1000, but could be as high as 12,400.
Table 2.
Water quality of the Nakdong River during the pilot plant operation period (1 January 2016–31 December 2017) [23].
3. Analysis Methods
HACCP involves the sequential application of seven basic principles: (1) performing a hazard analysis, (2) determining the CCPs, (3) establishing critical limits, (4) establishing a CCP monitoring system, (5) establishing a corrective action, (6) establishing a verification procedure, and (7) introducing a documentation system. The methods used for the hazard analysis, potential risk analysis (which is a subordinate concept), and for determining the CCPs are described below.
3.1. Hazard Analysis
In this study, a hazardous event analysis method was introduced to perform the hazard analysis. Hazardous events include any events that negatively affect the maintenance of the targeted water quality owing to their adverse effects on the ASTR. The subjects analyzed in this study included the 10 stages involved in the water supply process using ASTR, which is shown in Figure 4, from the extraction of surface water stage to the supply to consumers stage. Specifically, the process used to analyze hazardous events related to the extraction of surface water should consider the environmental factors of the basin. Therefore, it is essential to strictly perform hazardous event analysis to discover events and factors that negatively affect drinking water production, storage, and supply systems to consumers, thereby enabling a safe process management. This study revised and applied the hazardous event analysis method proposed under the WHO water safety plans [24]. These hazardous events include physical, microbial, and chemical accidents. Both the likelihood and the severity of each hazardous event are scored from 1 to 5, as summarized in Table 3.
Table 3.
Scoring criteria for the likelihood and severity of hazardous events [24].
Accordingly, the risk score was calculated using
This indicates that the risk score will range from 1 to 25. Risks were categorized into low (L, 1–5), medium (M, 6–9), high (H, 10–14), and very high (VH, >15) risks, with events having H and VH risk scores being considered as major hazardous events. Equation (1) originated from WHO [24].
3.2. Potential Risk Analysis
Chemical hazards pose the greatest risk to water quality. As the Nakdong River flows through major industrial cities, it is susceptible to chemical spills. Accordingly, a potential risk analysis method was developed to preemptively prevent chemical spills. Generally, it is very difficult to analyze individual chemical spill accidents because of the significantly large numbers of locations, causes, and paths of chemical spills. In addition, it is currently challenging to directly estimate the probability of chemical spills in each city, the amount of chemical substances flowing to ASTR sites, and the economic damage caused by the movement of chemical substances, by using the information obtained from the investigation. Therefore, in this study, a potential risk concept was introduced to indirectly represent the negative effects. The potential risk analysis simplified the distance over which chemical substances travel from the source to ASTR plants, associated this distance to the chemical toxicity and transfers, and then quantified it using
where t is the time (years), is the potential risk a city (c) poses to the ASTR site at a specific time, h is the toxicity, m is the number of chemicals q, is the chemical substances, x is the total transfers (kg/yr), and d is the linear distance (m) between the ASTR site and a city. The total transfers of pollutant can be obtained from the pollutant release and transfer register. However, the data on the total transfers for deriving the potential risk in South Korea are insufficient because only data from 2001 are available. To address the problems associated with this lack of data, the potential risk () was artificially generated using the stochastic methodology introduced by Ji and Lee [25] based on the process illustrated in Figure 6. The most appropriate probability distribution for each city was applied using 14 types of probability distributions, including the generalized extreme value, and the return period was calculated using
where Tr is the return period (years) and F is the cumulative distribution function. The potential risk () corresponding to the return period was determined using the inverse calculation of this equation.
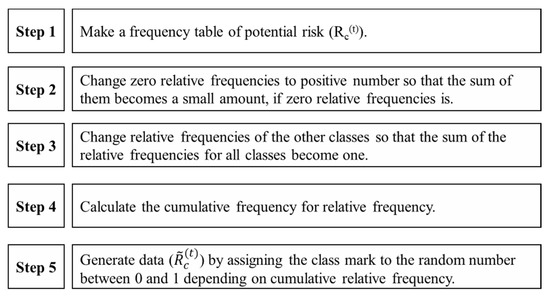
Figure 6.
Process for generating the data set () using the potential risk .
3.3. Determination of the CCP
The intensive management of CCPs ensures a more efficient concentration of the labor efforts and interests than the existing system, thereby ensuring that the production of safe drinking water is economically feasible. However, it is important to select appropriate CCPs because the selection of the wrong CCPs can result in wasted efforts or result in missing the points for controlling risks. To address this, the Codex Alimentarius International Food Standards developed a decision tree for determining CCPs [12]. Figure 7 shows the three questions that were derived from four questions to optimize the process for determining the CCPs. In this study, Q1 was asked for all the 10 stages involved in the drinking water supply process using the ASTR system (Figure 4), and the yes/no answer to this question and subsequent questions enabled the determination of whether or not a given step is a CCP.
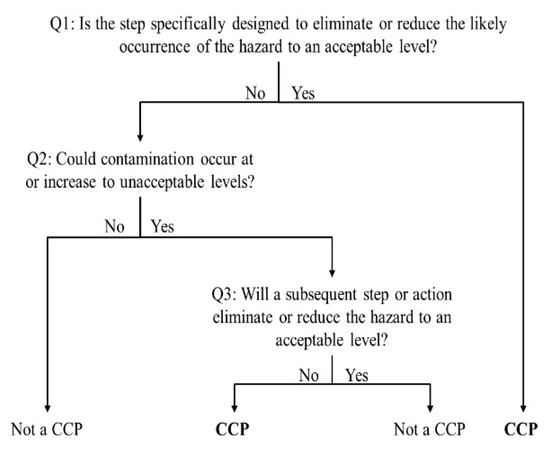
Figure 7.
Decision tree for determining a critical control point (CCP) [12,26].
4. Results and Discussion
4.1. Hazard Analysis
The analysis of the risks involved in the 10 stages of the drinking water supply process using ASTR revealed that there are 114 hazardous events during the process (Figure 4). These events originated from various references [8,11,13,15,17,18,19,27,28,29,30]. The numbers of hazardous events in the source water, intake, storage reservoirs, pretreatment, injection to aquifer, abstraction from aquifer, posttreatment, service reservoirs, distribution, and supply to consumer stages were 25, 3, 10, 19, 5, 8, 8, 15, 17, and 4, respectively. Among these, there were nine major hazardous events with a risk score of 10 or higher, and these risks were related to the source water (7), storage reservoirs (1), and service reservoirs (1) stages.
An example of the major hazardous events was unauthorized wastewater discharge. Fifteen water pollution accidents with unknown causes occurred in 2012. The likelihood score of these accidents was 3 considering the fact that numerous commercial and industrial facilities are located in the Nakdong River basin and that unauthorized wastewater discharge typically occurs during rainfall or stealthily at night. In addition, the likelihood score of unauthorized effluents was 5 owing to the fact that these effluents were not treated, and involved various chemical and microbial risks, such as pathogenic bacteria, metals, nutriments, and nonbiodegradable organics. Accordingly, the overall risk score of unauthorized wastewater discharge was 15.
Next, a survey was conducted on these major hazardous events to further verify the analysis results. To this end, 15 experts in the water resource environment field who investigate ASTRs were used as respondents, and the survey results are shown in Table 4. The results were consistent with the risk score analysis results. However, the survey risk scores of unauthorized wastewater discharge, eutrophication, and inappropriate maintenance of residual chlorine were different from those of the analysis, whereas the risk scores of other major hazardous events were consistent. Unauthorized wastewater discharge exhibited a higher survey risk score, indicating that it should be treated with more concern, whereas inappropriate maintenance of residual chlorine exhibited a lower risk score, indicating that it should be treated with less concern.
Table 4.
Results of the survey of professionals on the risk of major hazardous events.
4.2. Potential Risk Analysis
The Nakdong River basin consists of a total of 55 regions, including 21 cities or districts in the North Gyeongsang Province, 16 cities or districts in South Gyeongsang Province, one district in Ulsan Metropolitan City, six districts in Busan Metropolitan City, one city in North Jeolla Province, one district in South Jeolla Province, eight districts or counties in Daegu Metropolitan City, and one city in Gangwon Province. Among these, the 42 cities, districts, and counties listed in Table 1 were analyzed in this study, and the cities located at the boundary of the basin were excluded. For the potential risk analysis, the 10 chemical substances with the highest discharge amounts in the Nakdong River basin in 2014 were analyzed: xylene, toluene, ethyl acetate, methylethylketone, ethylbenzene, methyl alcohol, dichloromethane, isopropanol, N,N-dimethylformamide, and butane.
The toxicity was examined using the NFPA 704 standard established by the National Fire Protection Association (NFPA) of the United States. This standard provides information on health, flammability, reactivity, and other hazards through an index assigned to chemical substances to enable prompt responses during an emergency. Particularly, the health index was applied for the toxicity analysis in this study. According to the NFPA, the health index can appropriately represent the potential risk of drinking water supply facilities as it was assigned after performing a sufficient number of tests on intake, contact, and inhalation using albino rats [31]. The health index ranges from 0 to 4, with 0 and 4 indicating the lowest and highest toxicity, respectively. The 10 analyzed chemical substances exhibited a toxicity level of 1 or 2, which was not high.
Figure 8 shows the potential risk analysis results of each city per return period. The Gangseo-gu District in Busan (no. 42) exhibited the highest potential risk. In addition, the potential risk increased from 21.3 in the 10-year return period to 25.2 in the 50-year return period, 26.6 in the 100-year return period, and 27.9 in the 200-year return period, which was the highest potential risk observed in the study area. This district is located in a coastal region and contains advanced industries and trade businesses, as it has been intensively developed as part of a national development plan. Accordingly, it exhibited the most significant potential risk to the ASTR site owing to three factors: distance to the ASTR site, toxicity of the chemical substances released in this district, and transfer of these chemical substances. In addition, cities 19 and 20 exhibited high potential risks to the ASTR site. In summary, the cities that exhibited high potential risks to the ASTR site were mainly located in the coastal region near the ASTR, followed by Daegu, which is in the central region of the basin. Based on a commercial and industrial development perspective in modern Korea, these regions have benefited from intensive national development plans. However, despite their high economic power in Korea, these regions exhibit a high pollution potential.
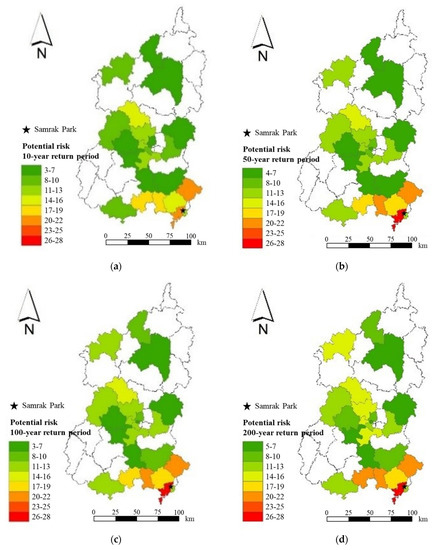
Figure 8.
Potential risk distribution in the Nakdong River basin. (a) 10-year return period. (b) 50-year return period. (c) 100-year return period. (d) 200-year return period.
4.3. CCP Determination
In this study, a decision tree was employed to determine the CCPs (Figure 7), and Q1 was asked for all the 10 stages involved in the drinking water supply process using the ASTR system (Figure 4), and the yes/no answer to this question and subsequent questions enabled the determination of whether a given step is a CCP. For example, the extraction of source water was not a process for eliminating or reducing hazards (Q1 = N). However, a pollutant in the source water may exceed the critical limit (Q2 = Y). Accordingly, although various hazards can be observed in the source water stage, all water treatment facilities, including ASTRs, can only eliminate or reduce certain hazards (Q3 = N). Therefore, the source water stage was a CCP. Similarly, the pretreatment step was designed to eliminate specific hazards to prevent blockage or pollution in aquifers (Q1 = Y), thus making the pretreatment step a CCP. In contrast, the water intake stage does not eliminate hazards (Q1 = N). Further, pollutant levels in the intake may exceed the critical limit, as microorganisms may grow rapidly (Q2 = Y). However, subsequent stages, such as pretreatment, ASTR, and posttreatment, can eliminate or reduce hazards (Q3 = Y). Therefore, the intake stage was not a CCP. The careful consideration of all the 10 steps in the decision tree revealed that there were eight CCPs in the drinking water supply process using the ASTR (Table 5).
Table 5.
Answers and decision in the decision tree for determining the CCPs.
Generally, water treatment processes are composed of multiple barriers that eliminate water quality hazards. Processes such as coagulation, precipitation, and filtration eliminate hazards of corresponding sizes within a specific range. In addition, chlorination or ozone disinfection processes removes microorganisms. If these processes are arranged sequentially in a water treatment process, duplicated hazards can be eliminated, thereby enabling the formation of a multiple barrier system. Most water treatment facilities are CCPs because they eliminate specific hazards.
4.4. Management of CCPs
Among the seven basic principles, five basic principles, excluding hazard analysis and CCP determination, can be used to establish a management plan for CCPs and the entire water supply process. Particularly, the critical limits include the criteria for ensuring that the hazards in CCPs have no adverse effect on the operation, final product quality, and production cost. In addition, it is essential to adhere to the drinking water guidelines stipulated by law to enable the application of water for drinking purposes. Therefore, hazards should be eliminated in stages. First, the source water should be subjected to a pretreatment process before injection to prevent the contamination of ambient groundwater and to ensure the continuous use of aquifers. In this study, based on the pretreatment guidelines established in the United States [6,32], Australia [33,34], and Europe [35,36], as well as the standards for drinking water established in the environmental laws of Korea [37], the turbidity was set to <1 NTU. Subsequently, the injection pressure was adjusted according to the standard pressure based on the swelling of the ground, blockage detection, and energy efficiency of injection. For the abstraction stage, chlorine was used as the standard for maintaining fresh water bodies and preventing the extraction of saline groundwater. Other criteria were identical to those generally used for the application of HACCP to regular water treatment plants [27]. Table 6 shows the CCP management guideline for pretreatment, injection, and abstraction processes of the ASTR technique applied in this study.
Table 6.
CCP management guidelines for the combined ASTR and HACCP process (modified from [6,27,32,33,34,35,36]).
According to the Ministry of Food and Drug Safety [38], verification of the procedure should focus on whether the HACCP system effectively enhances safety, is implemented as planned, and requires adjustments. In this study, the verification process involved three steps. First, the effectiveness of the HACCP procedure was evaluated based on whether all hazards were examined and analyzed, CCP determination was appropriate, critical limits were sufficiently safe, and monitoring was appropriately conducted. Second, the practicability of the HACCP procedure was evaluated based on whether the monitoring was implemented according to the determined procedure, corrective actions were appropriately employed, and equipment was inspected regularly. Third, the crisis response was verified. To minimize damage in the case of hazardous events, it is essential to develop a response system. This can be achieved by implementing response measures by simulating accident situations to verify their effectiveness, while ensuring that relevant personnel are prepared and well-informed.
In addition, the verification process must be performed periodically. Verification should be performed during the first application of the HACCP procedure (initial verification), during an ordinary production process (regular verification), when new information relating to production products is determined, or when there is a change in a system in terms of raw material or process (special verification), and to inspect the entire system at least once annually (periodic verification). The internal verification should be performed independently by relevant institutions, and external verification should be performed by a third party. External verification should be conducted once annually.
In addition, the HACCP system must be documented to enhance and efficiently operate the system. In addition, it is essential to accurately document necessary information in an easily understandable manner. For the documentation process, the person responsible for documentation, the inspector, time and period of documentation, and retention period and place of documents must be considered. The documentation of various issues required by the Korea Institute for Food Safety Management Accreditation [39] is described as follows.
First, raw materials used during the process should be documented. In this study, the water quality state and unusual issues in the Nakdong River, location and time of the water intake, and intake amount were documented. Second, all monitoring records relating to CCPs must be documented. Third, the final water quality inspection results and residual chlorine concentration after chlorination must be documented. Fourth, issues relating to the production and distribution of drinking water, including the production and supply amounts, as well as supply process and regions, must be documented. Fifth, any occurrence of hazardous events, cases when hazards exceeded the critical limits of CCPs, and corrective actions should be documented. Sixth, verification-related details must be documented. Lastly, the hygienic conditions of the work sites and the records of training on work tasks and the implemented HACCP must be documented.
After a management plan is established according to the seven basic principles of HACCP, the plan should be strictly adhered to, documented, and managed in stages. Kim [40] reported that documentation contributes to achieving product quality and quality improvement, providing appropriate training or education, guaranteeing repeatability and traceability, providing objective evidence, and assessing the effectiveness of systems. To ensure that quality management is performed continuously, rather than as a one-time event, relevant personnel at facilities should be consistently trained and informed of the documented details, and the existing systems should be improved using new information.
5. Conclusions
Currently, drinking water supply systems are experiencing quantitative and qualitative challenges owing to various factors, such as climate change, water source pollution, and pipe network management. To overcome these challenges, in this study, a pilot drinking water supply plant that utilizes ASTR, a type of MAR, was established and HACCP was applied to the system to analyze the potential risk. The results revealed that a total of 114 hazardous events occurred across the various stages of the water supply process from the water intake source, namely, the Nakdong River, to the consumers. In addition, the analysis and survey results revealed that nine out of these events were major hazardous events with a risk rating of “H” or “VH”. Furthermore, a potential risk analysis was performed for 10 chemical substances with the highest discharge amounts into the Nakdong River basin, as chemical substances are involved in most major hazardous events. The results revealed that the Gangseo-gu District in Busan exhibited the highest potential risk based on the toxicity of chemical substances, distance to the ASTR site, and transfers of these chemical substances. In addition, a stochastic methodology revealed that this region exhibited the highest potential risk for a 100-year return period. Among the 10 stages involved in the drinking water supply process, eight stages (excluding the water intake and service reservoirs before pretreatment stages) were determined to be CCPs for effective hazards management. These eight stages were necessary processes for eliminating physical, chemical, and microbial hazards that may be present at various stages from the water intake source to supply to the consumers stage. Furthermore, CCP parameters, monitoring procedures, and corrective actions were established based on relevant laws for drinking water to effectively manage CCPs. In addition, the findings indicate that periodic verification and relevant documentation are required to monitor the effective operation of HACCP.
The use of ASTR, which safely stores and uses water, in the drinking water supply system secured water sources and removed pollutants. In addition, the application of HACCP, which is a preemptive process management system, in the water supply system prevented water quality accidents and increased the trustworthiness of drinking water. This study developed a technique for reinforcing and applying the basin management function of HACCP to protect aquifers, which are the core of ASTR systems, and to increase the quality and safety of drinking water; thereby, extending the duration of drinking water production and increasing consumer trust. The method proposed in this study is an alternative solution that has positive impacts on both the producers and the consumers of drinking water.
Author Contributions
H.W.J. developed the methodology and conducted the work under the supervision and review of S.-I.L. All authors have read and agreed to the published version of the manuscript.
Funding
This work was supported by the National Research Foundation of Korea (NRF) grant by the Korea government (2021R1A2C2011193). This research was also supported by the Korea Environment Industry & Technology Institute (KEITI) through Demand Responsive Water Supply Service Program, funded by the Korea Ministry of Environment (MOE) (146515).
Conflicts of Interest
The authors declare that they have no conflict of interest.
References
- Dore, M.H. Global Drinking Water Management and Conservation; Springer International Publishing: New York, NY, USA, 2015; pp. 6–8. [Google Scholar]
- Seneviratne, S.I.; Zhang, X.; Adnan, M.; Badi, W.; Dereczynski, C.; Di Luca, A.; Ghosh, S.; Iskandar, I.; Kossin, J.; Lewis, S.; et al. Weather and Climate Extreme Events in a Changing Climate; Climate Change 2021: The Physical Science Basis. Contribution of Working Group I to the Sixth Assessment Report of the Intergovernmental Panel on Climate Change; Cambridge University Press: Cambridge, UK, 2021. [Google Scholar]
- Park, D.S.; Lee, H.J. The emergency management measures for the water shortage by climate change. Korean Rev. Crisis Emerg. Manag. 2010, 6, 198–213. (In Korean) [Google Scholar]
- National Toxicology Program. West Virginia Chemical Spill. Available online: https://ntp.niehs.nih.gov/whatwestudy/topics/wvspill/index.html (accessed on 18 October 2021).
- Sprenger, C.; Hartog, N.; Hernández, M.; Vilanova, E.; Grützmacher, G.; Scheibler, F.; Hannappel, S. Inventory of managed aquifer recharge sites in Europe: Historical development, current situation and perspectives. Hydrogeol. J. 2017, 25, 1909–1922. [Google Scholar] [CrossRef] [Green Version]
- Glass, J.; Rico, D.A.V.; Stefan, C.; Nga, T.T.V. Simulation of the impact of managed aquifer recharge on the groundwater system in Hanoi, Vietnam. Hydrogeol. J. 2018, 26, 2427–2442. [Google Scholar] [CrossRef]
- Xanke, J.; Liesch, T.; Goeppert, N.; Klinger, J.; Gassen, N.; Goldscheider, N. Contamination risk and drinking water protection for a large-scale managed aquifer recharge site in a semi-arid karst region, Jordan. Hydrogeol. J. 2017, 25, 1795–1809. [Google Scholar] [CrossRef]
- Maliva, R.G.; Missimer, T.M. Aquifer Storage and Recovery and Managed Aquifer Recharge using Wells: Planning, Hydrogeology, Design and Operation; Schlumberger: Houston, TX, USA, 2010. [Google Scholar]
- Reese, R.S. Inventory and Review of Aquifer Storage and Recovery in Southern Florida; Water-Resources Investigations Report 2002-4036; USGS: Reston, VA, USA, 2002. [Google Scholar]
- Misut, P.E.; Voss, C.I. Freshwater–saltwater transition zone movement during aquifer storage and recovery cycles in Brooklyn and Queens, New York City, USA. J. Hydrol. 2007, 337, 87–103. [Google Scholar] [CrossRef]
- Parsons, S.; Dillon, P.; Irvine, E.; Holland, G.; Kaufman, C. Progress in Managed Aquifer Recharge in Australia; Waterlines Report; National Water Commission: Canberra, Australia, 2012; pp. 11–12. [Google Scholar]
- Codex Alimentarius Commission. Hazard Analysis and Critical Control Point (HACCP) System and Guidelines for Its Application; Annex to CAC/RCP 3; 1997; pp. 1–1969. Available online: https://www.fao.org/3/y1579e/y1579e03.htm#TopOfPage (accessed on 14 November 2021).
- Havelaar, A.H. Application of HACCP to drinking water supply. Food Control 1994, 5, 145–152. [Google Scholar] [CrossRef]
- Arisu. Available online: https://arisu.seoul.go.kr/c5/sub4_4_2.jsp (accessed on 29 October 2021). (In Korean).
- Dewettinck, T.; Van Houtte, E.; Geenens, D.; Van Hege, K.; Verstraete, W. HACCP (Hazard Analysis and Critical Control Points) to guarantee safe water reuse and drinking water production—A case study. Water Sci. Technol. 2001, 43, 31–38. [Google Scholar] [CrossRef]
- Martel, K.; Kirmeyer, G.; Hanson, A.; Stevens, M.; Mullerger, J. Application of HACCP for Distribution System Protection; American Water Works Association: Denver, CO, USA, 2006. [Google Scholar]
- CWWA. Canadian Guidance Document for Managing Drinking Water Systems; Canadian Water and Wastewater Association: Ottawa, ON, Canada, 2005. [Google Scholar]
- NHMRC; NRMMC. Australian Drinking Water Guidelines 6 National Water Quality Management Strategy; National Health and Medical Research Council, National Resource Management Ministerial Council, Commonwealth of Australia: Canberra, Australia, 2011. [Google Scholar]
- WAMIS. Available online: http://www.wamis.go.kr/ (accessed on 1 October 2021).
- Kim, D.H.; Lee, S.K.; Chun, B.Y.; Lee, D.H.; Hong, S.C.; Jang, B.K. Illness associated with contamination of drinking water supplies with phenol. J. Korean Med. Sci. 1994, 9, 218–223. [Google Scholar] [CrossRef] [Green Version]
- Ji, H.W.; Lee, S.-I. Hazardous event analysis in drinking water production using aquifer storage transfer and recovery. J. Korean Soc. Water Wastewater 2015, 29, 23–31. (In Korean) [Google Scholar]
- Ko, M.-S.; Cho, K.; Jeong, D.; Lee, S. Identification of the microbes mediating Fe reduction in a deep saline aquifer and their influence during managed aquifer recharge. Sci. Total Environ. 2016, 545, 486–492. [Google Scholar] [CrossRef] [PubMed]
- Water Environment Information System. Available online: http://water.nier.go.kr/web/waterMeasure?pMENU_NO=2 (accessed on 29 October 2021). (In Korean).
- Deere, D.; Stevens, M.; Davison, A.; Helm, G.; Dufour, A. Water Quality: Guidelines, Standards and Health—Assessment of Risk and Risk Management for Water-Related Infectious Disease; IWA Publishing: London, UK, 2001; pp. 257–288. [Google Scholar]
- Ji, H.W.; Lee, S.-I. Use of pollutant release and transfer register (PRTR) to assess potential risk associated with chemicals in a drinking water supply facility. Desalination Water Treat. 2016, 57, 29228–29239. [Google Scholar] [CrossRef]
- Ji, H.W.; Lee, S.-I. Application of HACCP principles to MAR-based drinking water supply system. J. Korean Soc. Water Wastewater 2016, 30, 533–543. (In Korean) [Google Scholar] [CrossRef]
- Damikouka, I.; Katsiri, A.; Tzia, C. Application of HACCP principles in drinking water treatment. Desalination 2007, 210, 138–145. [Google Scholar] [CrossRef]
- Haeffner, H.; Detay, M.; Bersillon, J.L. Sustainable Groundwater Management Using Artificial Recharge in the Paris Region. In Artificial Recharge of Groundwater, 1st ed.; CRC Press: Boca Raton, FL, USA, 1998; pp. 9–14. [Google Scholar]
- Khaniki, G.R.J.; Mahdavi, M.; Mohebbi, M.R. HACCP application for treatment of drinking water for Germi in Iran. J. Food Agric. Environ. 2009, 7, 709–712. [Google Scholar]
- Tavasolifar, A.; Bina, B.; Amin, M.M.; Ebrahimi, A.; Jalali, M. Implementation of hazard analysis and critical control points in the drinking water supply system. Int. J. Environ. Health Eng. 2012, 1, 32. [Google Scholar] [CrossRef]
- NFPA. NFPA 704: Standard System for the Identification of the Hazards of Materials for Emergency Response, 2012 ed.; NFPA: Boston, MA, USA, 2012; pp. 8–16. [Google Scholar]
- Pyne, R.D.G. Water Quality in Aquifer Storage Recovery (ASR) Wells. In Proceedings of the American Water Works Association Annual Meeting, Anaheim, CA, USA, 15–19 June 2003. [Google Scholar]
- Page, D.; Dillon, P.; Toze, S.; Bixio, D.; Genthe, B.; Cisneros, B.E.J.; Wintgens, T. Valuing the subsurface pathogen treatment barrier in water recycling via aquifers for drinking supplies. Water Res. 2010, 44, 1841–1852. [Google Scholar] [CrossRef] [PubMed]
- Clinton, T. Reclaimed Water Aquifer Storage and Recovery: Potential Changes in Water Quality; Water Reuse Foundation: Alexandria, Egypt, 2007. [Google Scholar]
- Levantesi, C.; La Mantia, R.; Masciopinto, C.; Böckelmann, U.; Ayuso-Gabella, M.N.; Salgot, M.; Tandoi, V.; Van Houtte, E.; Wintgens, T.; Grohmann, E. Quantification of pathogenic microorganisms and microbial indicators in three wastewater reclamation and managed aquifer recharge facilities in Europe. Sci. Total Environ. 2010, 408, 4923–4930. [Google Scholar] [CrossRef] [PubMed]
- Antoniou, E.A.; van Breukelen, B.M.; Putters, B.; Stuyfzand, P.J. Hydrogeochemical patterns, processes and mass transfers during aquifer storage and recovery (ASR) in an anoxic sandy aquifer. Appl. Geochem. 2012, 27, 2435–2452. [Google Scholar] [CrossRef]
- Rules for Drinking Water Quality Standards and Inspections. Available online: https://www.law.go.kr/LSW/lsInfoP.do?efYd=20210916&lsiSeq=235667#AJAX (accessed on 12 January 2022). (In Korean).
- Ministry of Food and Drug Safety. Available online: http:/www.mfds.go.kr/brd/m_584/view.do?seq=8571 (accessed on 29 October 2021). (In Korean).
- Korea Agency of HACCP Accreditation and Services. Available online: https://www.haccp.or.kr/site/haccp/sub.do?key=2211 (accessed on 29 October 2021).
- Kim, Y.K. Quality Management System: ISO 9001:2000; B&M Books: Seoul, Korea, 2007; pp. 3–14. (In Korean) [Google Scholar]
Publisher’s Note: MDPI stays neutral with regard to jurisdictional claims in published maps and institutional affiliations. |
© 2022 by the authors. Licensee MDPI, Basel, Switzerland. This article is an open access article distributed under the terms and conditions of the Creative Commons Attribution (CC BY) license (https://creativecommons.org/licenses/by/4.0/).