Communication

The Taiwan Climate Change Projection Information and Adaptation Knowledge Platform: A Decade of Climate Research

National Science and Technology Center for Disaster Reduction, New Taipei City 23153, Taiwan
*
Authors to whom correspondence should be addressed.
Water 2022, 14(3), 358; https://doi.org/10.3390/w14030358
Submission received: 21 December 2021 / Revised: 21 January 2022 / Accepted: 24 January 2022 / Published: 26 January 2022

Abstract

:
Taiwan’s climate change projections have always presented a challenge due to Taiwan’s size and unique meteorological and geographical characteristics. The Taiwan Climate Change Projection Information and Adaptation Knowledge Platform (TCCIP), funded by the Ministry of Science and Technology, Taiwan, is a decade-long climate research project with the most predominant climate data provider and national adaptation policymaking in the country. This paper outlines the evolution of the project. It describes the project’s major achievements, including climate projection arising from participation in the WCRP Coupled Model Inter-comparison Project (CMIP), dynamically and statistically downscaled data with resolutions up to 5 km grid, impact assessments of various themes, such as flooding, as well as the support of national policies through approaches including risk maps, climate data, and knowledge brokering.

1. Introduction

Taiwan is exposed to various natural hazards, such as typhoons, earthquakes, flash floods, and landslides, because Taiwan is situated in the central area of Western North Pacific typhoon pathways [1] along the western Circum-Pacific seismic belt, which is expected to be exacerbated by anthropogenic climate change with increased frequency and magnitude.
In response to the impacts of climate change, governmental institutions have introduced a series of policies. In 2010, catastrophic damage caused by Typhoon Morakot triggered nationwide awareness that focused on a more resilient adaptive approach to complement traditional disaster prevention measures. The National Adaptation Strategy [2] was formed through a series of inter-departmental and stakeholder discussions. The 1st five-year National Climate Change Adaptation Action Plan began in 2013, which considered eight adaptation themes, including disaster, water resources, land use, infrastructure, energy and industry, coastal zones, agriculture and biodiversity, and health, and ultimately proposed 399 action plans [3]. By 2015, Taiwan promulgated the Greenhouse Gas Reduction and Management Act with a legally binding emission reduction target and made adaptation policies and actions compulsory for all relevant departments and institutions [4]. Abiding by the Act and the subsequent National Climate Change Action Guidelines, the 2nd phase of the National Adaptation Plan started in 2018 (Figure 1), building upon available data, knowledge, and outcomes achieved in the 1st phase. It proposed a total of 125 action plans [5,6,7,8,9,10].
To support national adaptation actions, the TCCIP created an indicative map of climate-related actions for climate-related actions in Taiwan (as shown in Figure 2). The National Science Council (now Ministry of Science and Technology) began to fund a series of climate research projects to develop practical climate projections for purpose of enhancing decision-making. Since 2009, the NSC initiated three pilot research projects aimed at different purposes, including the Consortium for Climate Change Study (CCliCS), the TCCIP, and the Taiwan integrated research program on Climate Change Adaptation Technology (TaiCCAT), which continued for two phases within nine years, and were merged into the current and third phase of the TCCIP project (Figure 3 and Figure 4). The following context will outline significant outcomes achieved during a decade of adaptation research, discuss the project’s current status, and address existing and potential gaps from a practical perspective.

2. Integration and Development of Climate Data

2.1. Integration of Observation Data

The characteristics of rainfalls, such as their extremes, variations across different time scales, and spatial differences, are common problems for relevant studies during data processing. Taiwan has approximately 1500 observation stations within its 36,000 km2 area. However, selecting appropriate time and spatial data from a wide range of observation records for analysis can be challenging for non-meteorologists, and these issues are further amplified in Taiwan due to its diverse climate system. Therefore, the TCCIP project assembled data from 51 institutions and established the Taiwan Rainfall Index (TRI), which comprises daily rainfall data from 1900 to 2010, processed from 1187 stations selected through stringent evaluation processes. In addition, over 7.2 million paper records from the Central Weather Bureau were also converted into an electronic dataset with 23 variables, covering parameters including air and water pressure, temperature, humidity, wind, precipitation, and sunshine. In addition, regarding previous studies [11,12], temperature and rainfall grid data were also generated with a resolution of 1 × 1 km from 1960 to 2009. These valuable data became the foundation of climate analysis in the country in the context of addressing historical weather and climate anomalies, planning infrastructure standards, or comparisons with climate projections.

2.2. Development of Climate Projection

Downscaling methodology is an essential element of climate projections in Taiwan due to the fact that the resolution of international general circulation models (GCMs) used by the Intergovernmental Panel on Climate Change (IPCC) usually ranges from 150 to 300 km, which is not sufficient for practical evaluation of future climate change impacts in the country. The TCCIP project currently provides the most comprehensive climate projection data in Taiwan, with two separate methodologies aimed at different purposes, namely statistical downscaling and dynamical downscaling, and continues to evolve following the most recent international developments.
The TCCIP project team adopted bias correction and spatial disaggregation methods for statistical downscaling using the empirical cumulative distribution functions method (ECDF) [13,14,15,16], selecting three IPCC AR4 scenarios of A1B, A2, and B1 [17], using 24 atmosphere–ocean coupled general circulation models (AOGCM) for two time periods, 2020–2039 and 2080–2099, with output resolutions of 25 km and 5 km. As for dynamical downscaling, the team utilized two high-resolution atmospheric circulation models, one was developed by the Meteorological Research Institute (MRI) [18] under the Japan Meteorological Agency (JMA), another is an ECHAM5 GCM developed by the Max Planck Institute for Meteorology, which is affiliated with the Max Planck Society and the University of Hamburg.
These models were used to determine the initial field and boundary conditions, while the weather research and forecasting modeling system (WRF) developed by the National Center for Atmospheric Research in the U.S. [19] was used for downscaling and regional climate modeling. A data performance test showed that MRI performed better than ECHAM5 at a lower troposphere, whereas ECHAM5 exiled at a mid-higher troposphere. This was likely due to the terrain data used by ECHAM5 only managing to simulate 100–200 m topography, whereas the topography differences simulated by MRI can be as much as 2500 m and is thus able to project atmospheric circulation and precipitation in Taiwan more accurately.
During the 5th phase (CMIP5), a total of 33 GCMs, four warming scenarios of RCP2.6, 4.5, 6.0, and 8.5 were selected [20]. The time period between 1960–2005 was used as a historical baseline, and data between 2006–2100 underwent statistical downscaling, which was carried using spatial interpolation and bias correction using the ECDF methods utilized in the previous project phase. For dynamical downscaling, in addition to the MRI model, a high-resolution atmospheric model (HiRAM C384) [21,22,23,24,25,26,27,28,29,30,31] developed by the Geophysical Fluid Dynamics Laboratory (GFDL) was also used for cross-comparison, with a resolution of 25 km, baseline period of 1979–2003, simulating projections during 2039–2065 and 2075–2099 using the RCP8.5 scenario. These models were coupled with WRF to assess the impact of extreme and typhoon events in the context of topics such as flooding and landslides. Downscaled data have unique characteristics (Table 1) and were selected for subsequent analysis and assessment according to different research needs.

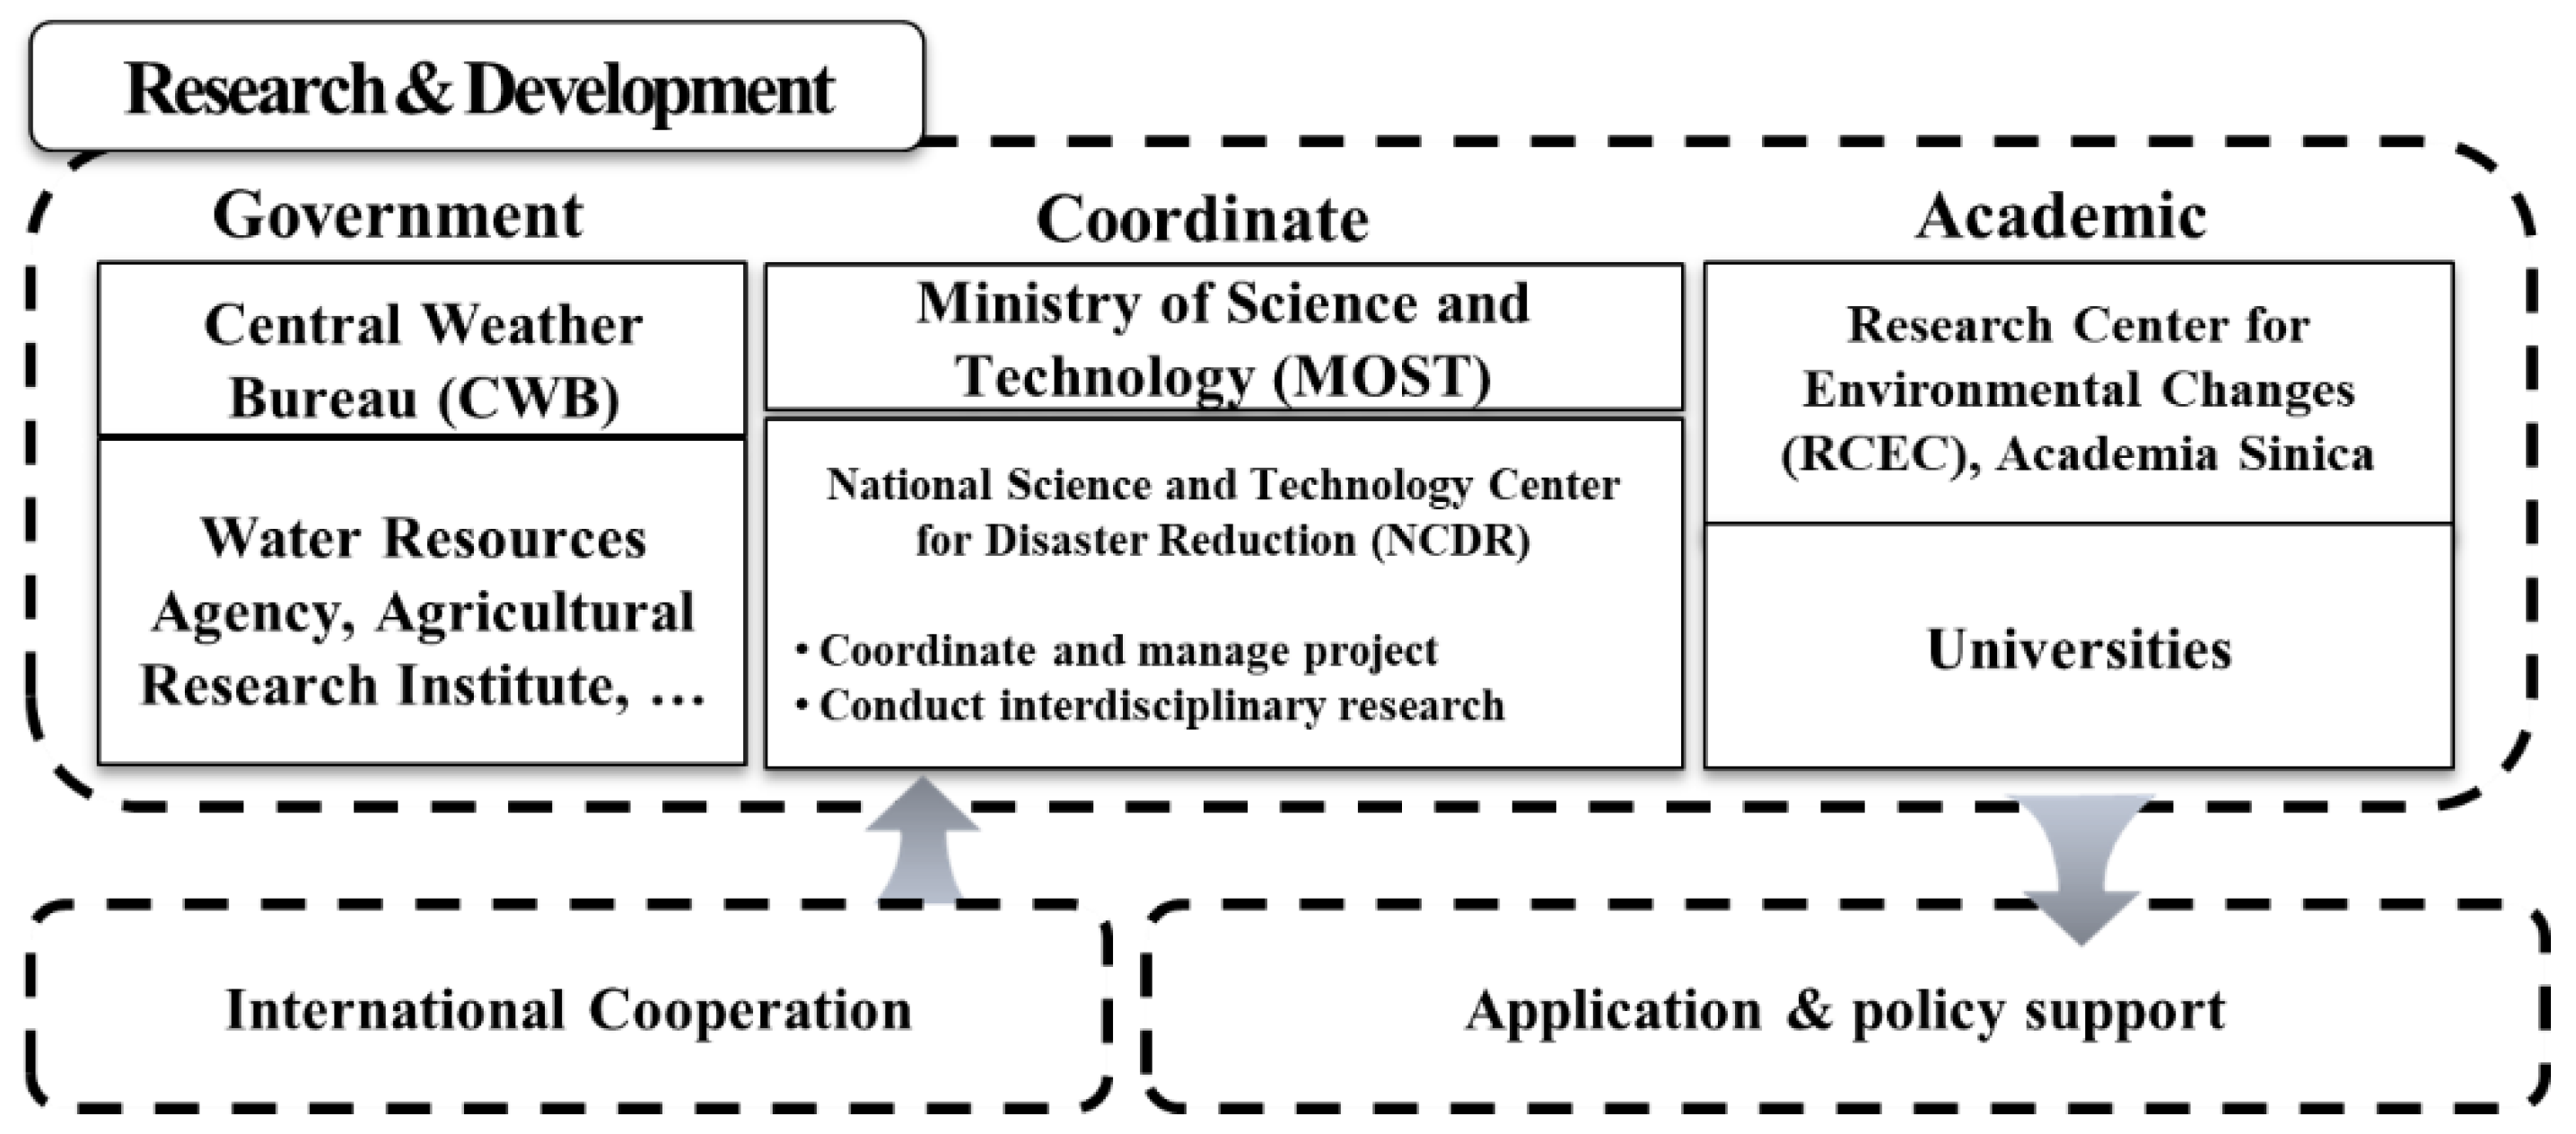
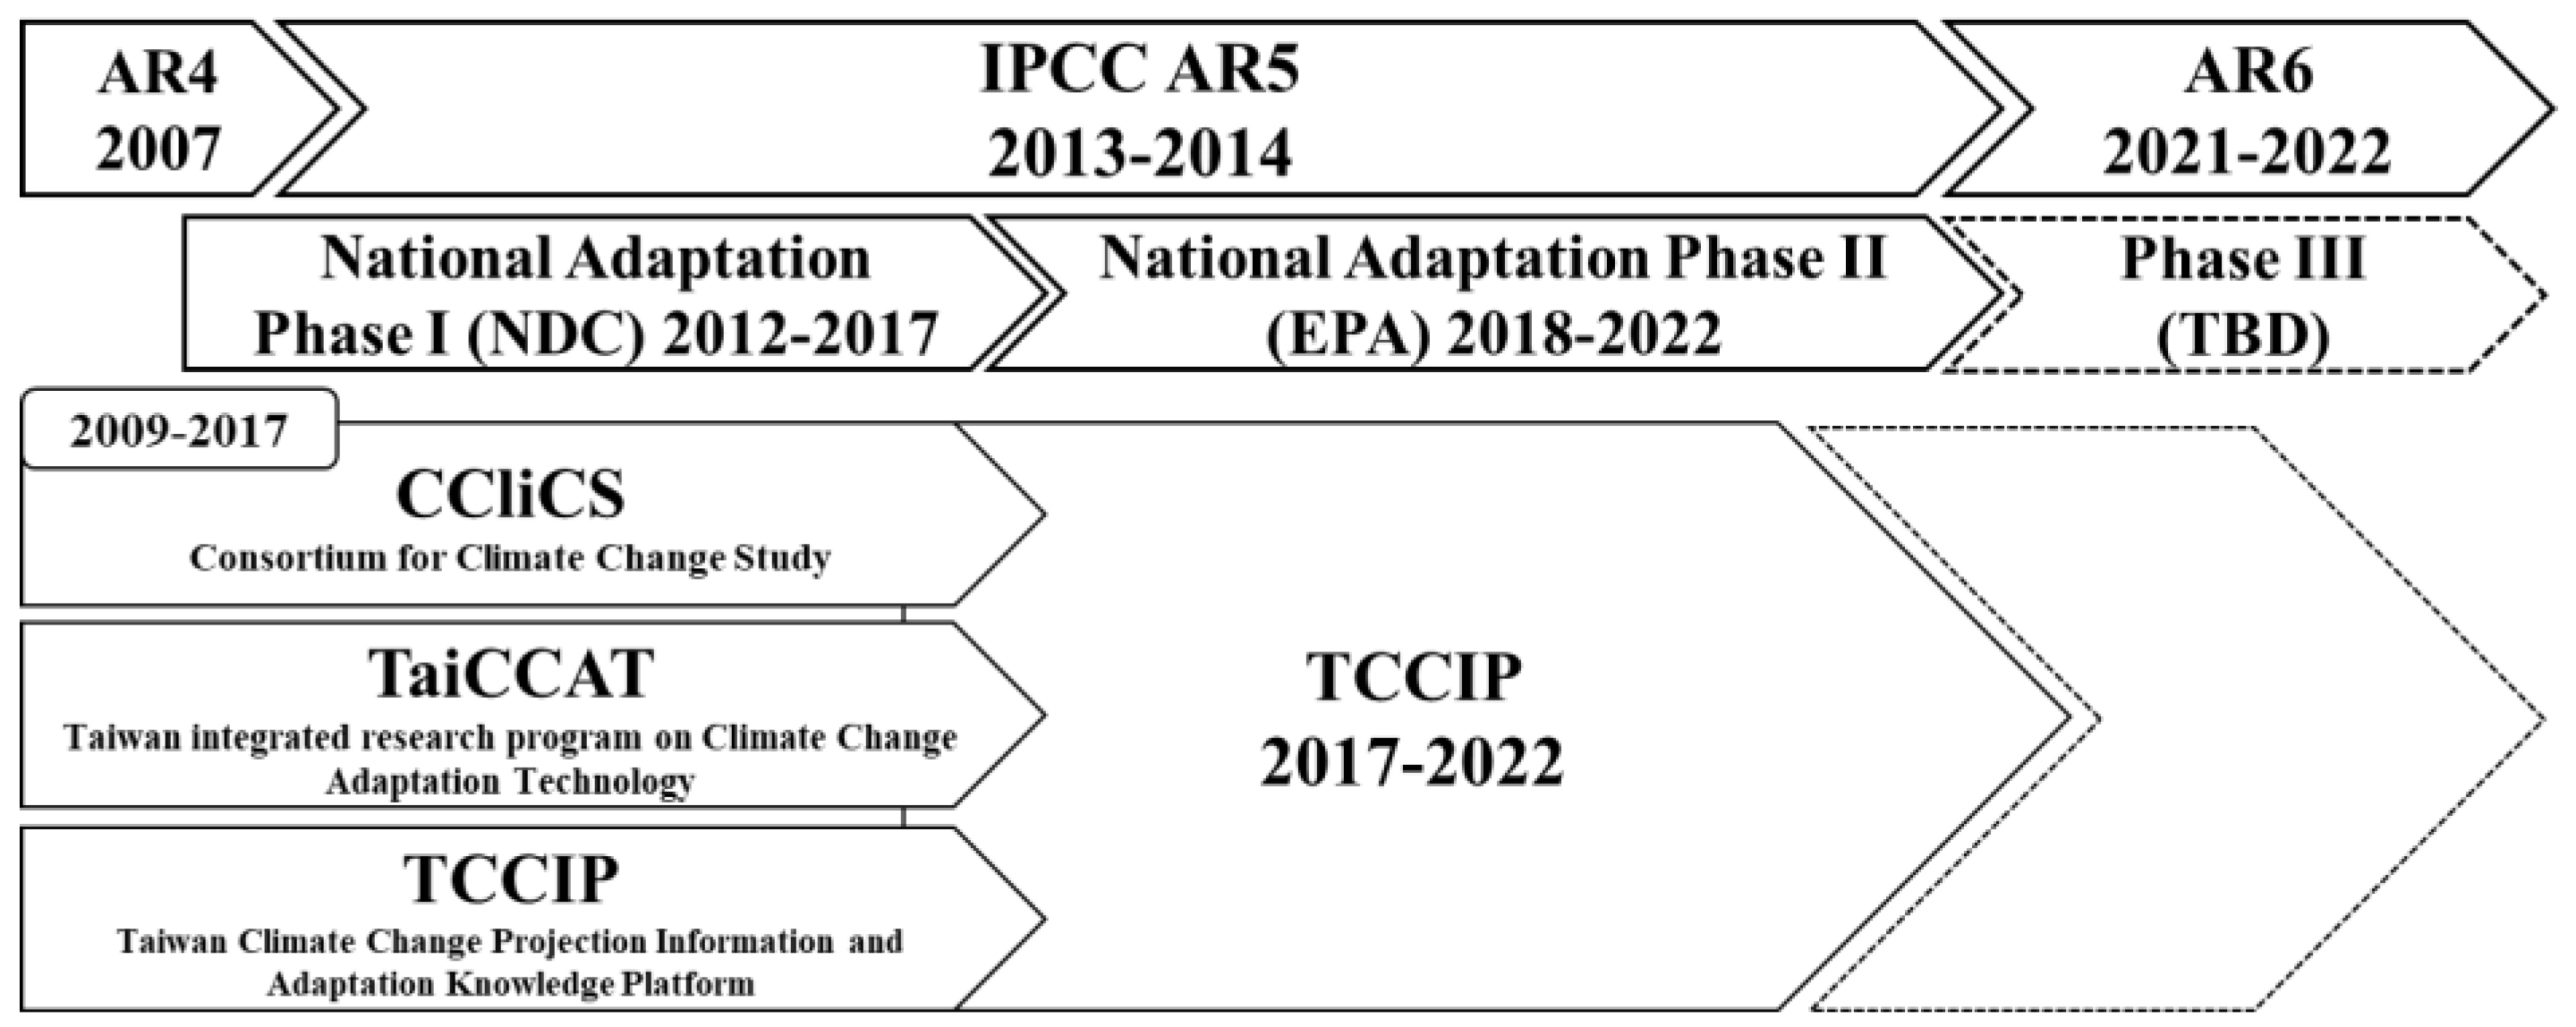
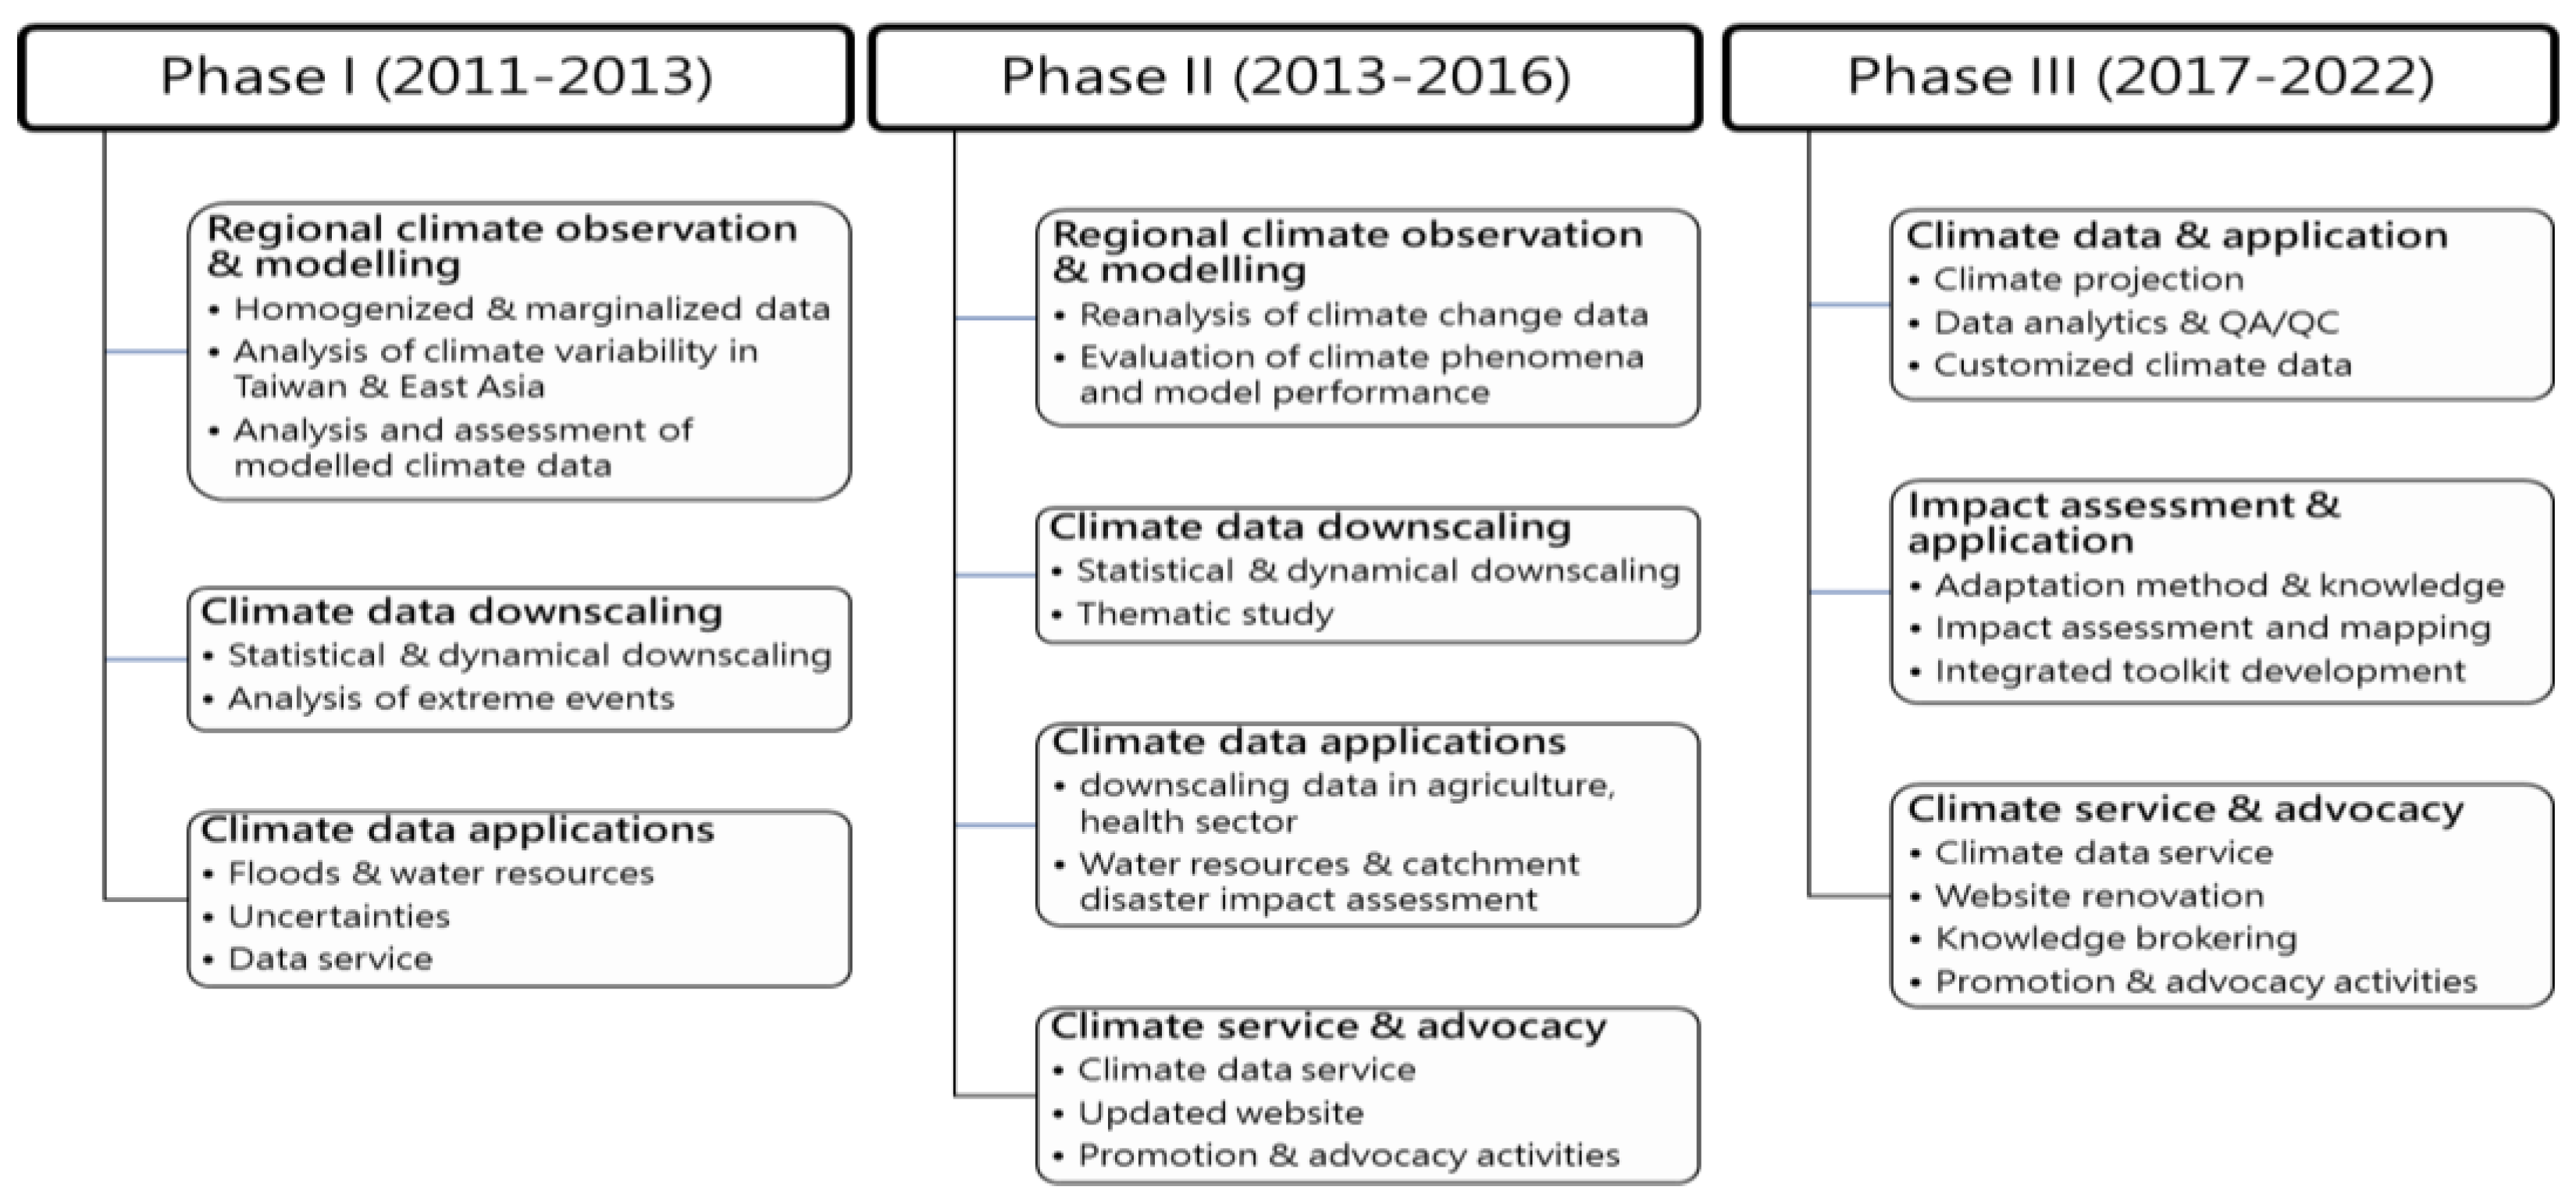
3. The Evolution of TCCIP Projects

The first phase of the Taiwan Climate Change Projection and Information Platform Project (TCCIP) consisted of three teams who were responsible for three different core research topics: the analysis of regional observation and projections, the establishment of viable downscaling methodologies, and the application of climate data. The second phase (2013–2016) built upon the achievements of the previous phase, with improvements and updates carried out by four separate teams, each with specialized functions. To further enhance the quality of climate service, the TCCIP team digitized over 7.2 million historical climate data acquired from the Central Weather Bureau, which is affiliated with the Ministry of Transportation and Communications, Taiwan. In addition, tide stations for seal level observations were corrected into a unified dataset, while the grid dataset was updated for more accurate performance than the actual spatial distribution of observation data. These datasets received a total of 164 applications for various research purposes. The third phase (2017–2022) has emphasized the essence of a testbed platform, where new climate data is generated a more transparent and replicable way, while investigating practical approaches to close the gaps between research and practice, including plausible impact assessments, case studies, and tools. In addition, the TCCIP website has undergone its third renovation and now provides interactive information, adaptation knowledge, and climate projection data. A summary of the critical actions carried out during the different TCCIP project stages is outlined in Figure 5.
Due to its natural spatial limitations, downscaled climate data is key to Taiwan’s risk assessments and subsequent adaptation decisions. In terms of the data adopted, GCMs from CMIP5 were adopted. The statistically downscaled data were updated, providing more variables and time periods (Table 2), and were used for the preliminary assessment of rice crop production using DSSAT [32,33], as well as the distribution of dengue fever and risk of death under different climate scenarios. In addition, data generated using CMIP3 during the previous project phase were compared with the CMIP5 data, allowing the user to better understand the differences and characteristics between these two sets of data. For dynamical downscaling, the HiRAM GCM was used in addition to four sets of MRI simulations, which allowed for multi-model comparison and the evaluation of the performances of different applications.
In addition, the TCCIP website was re-designed to accommodate the increasing variety of research outcomes through an interactive interface of historical and project data, adaptation knowledge, publications, and data service. An updated version of the climate science report was also published, which addressed up-to-date climate projection and the understanding of climate impacts in Taiwan.

4. Application and Promotion of Climate Data

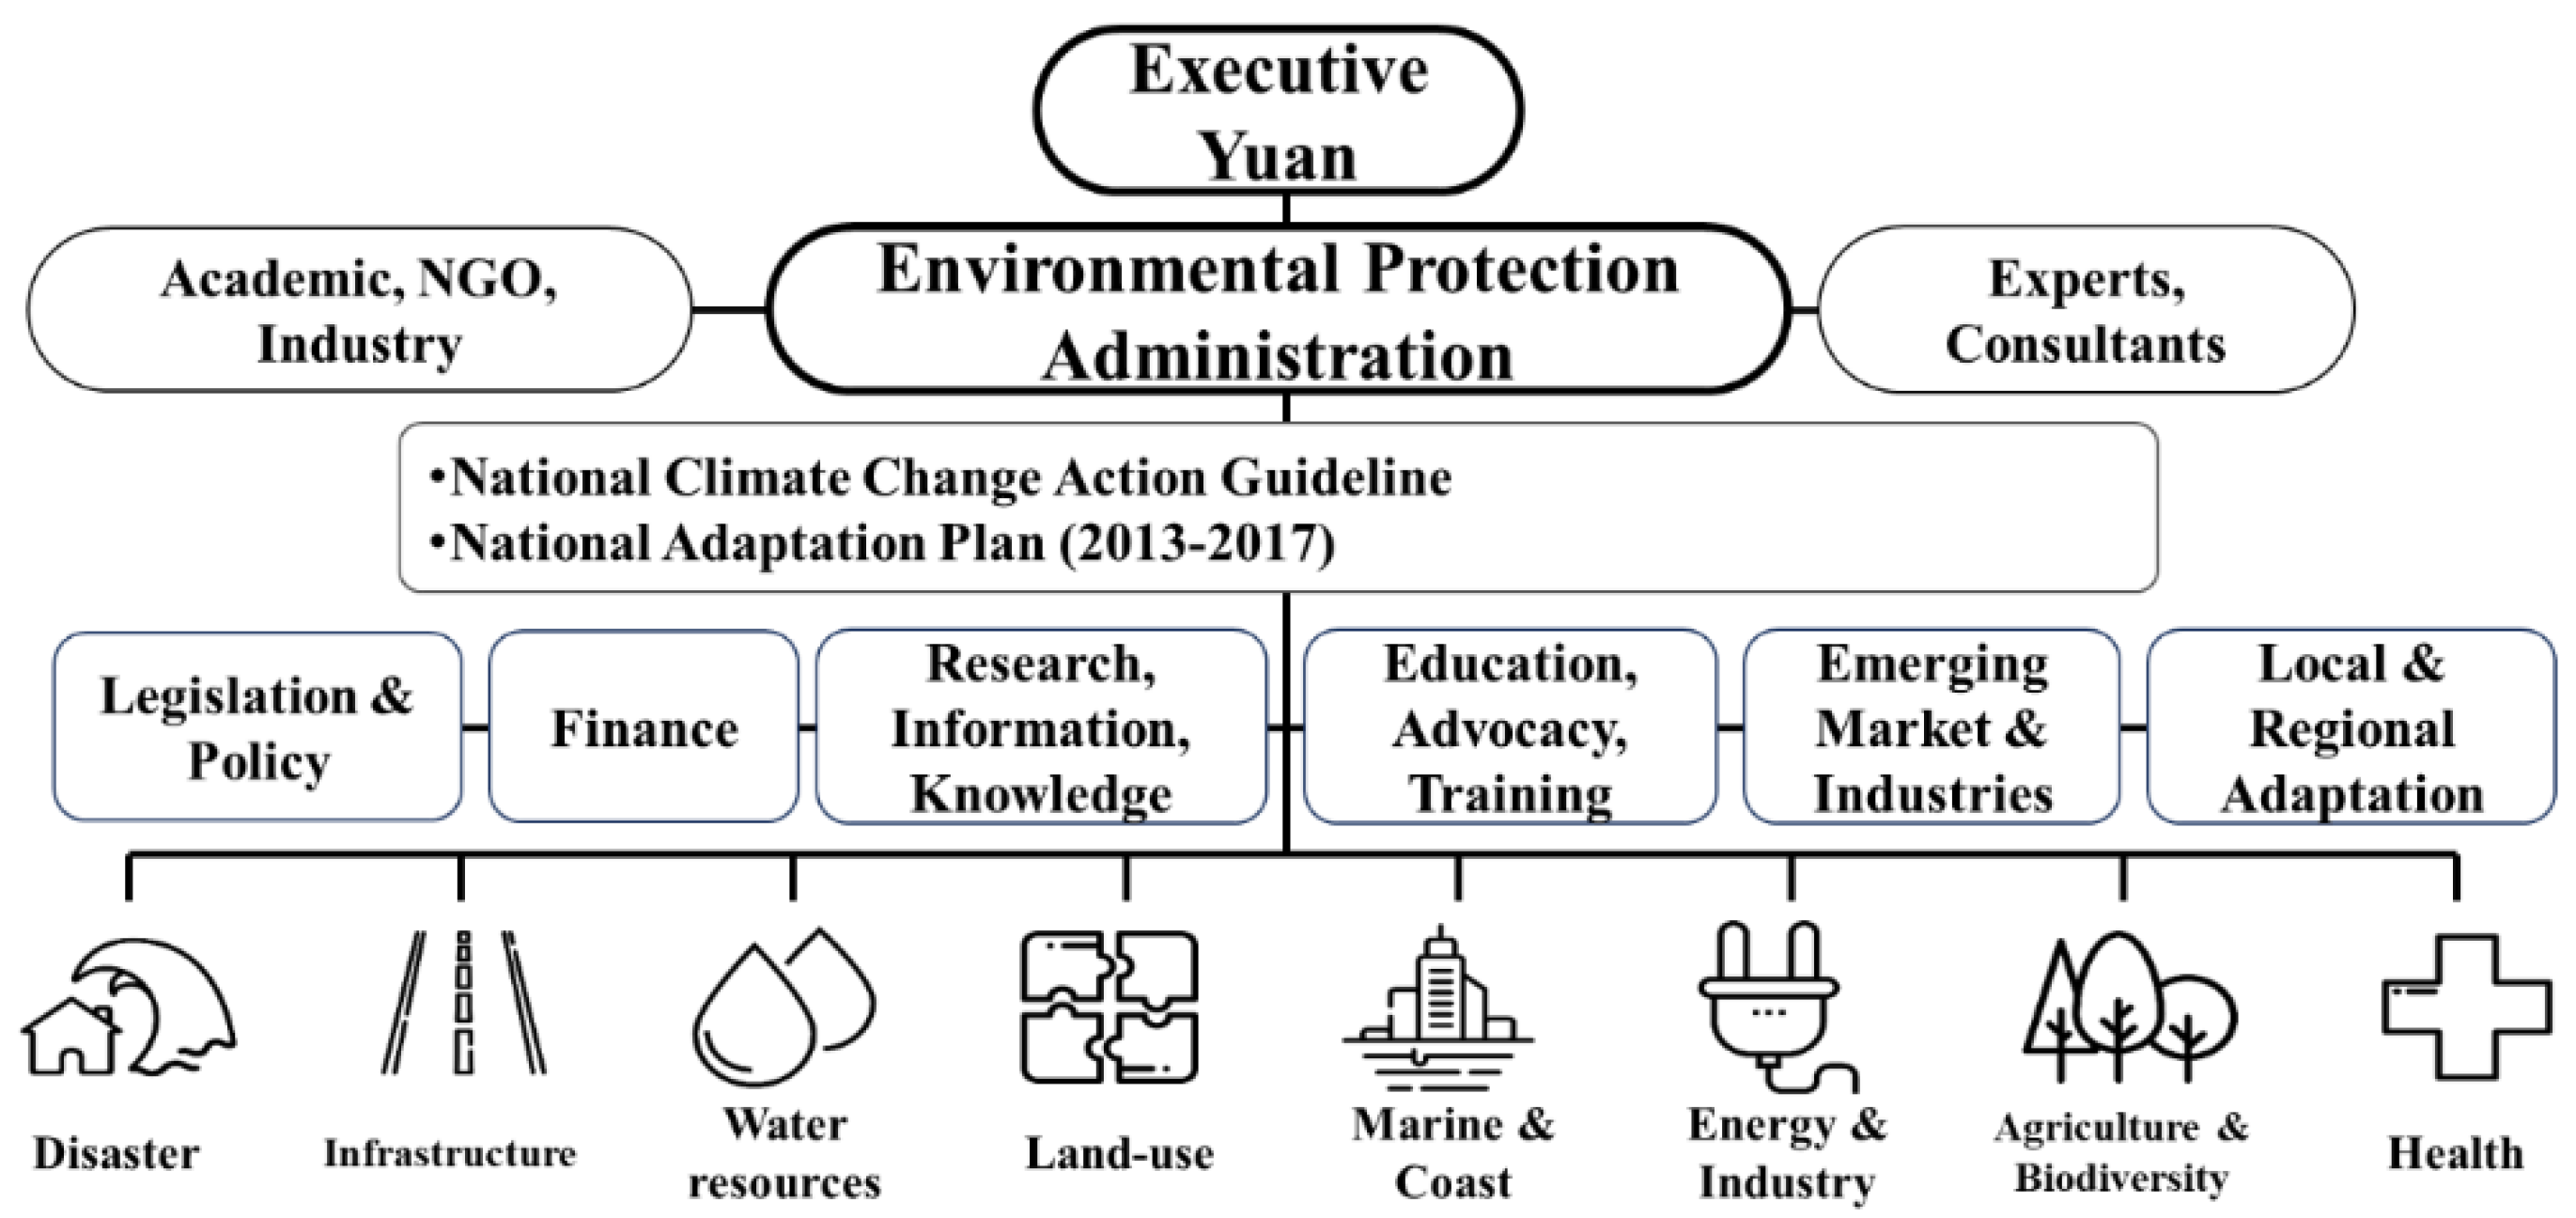
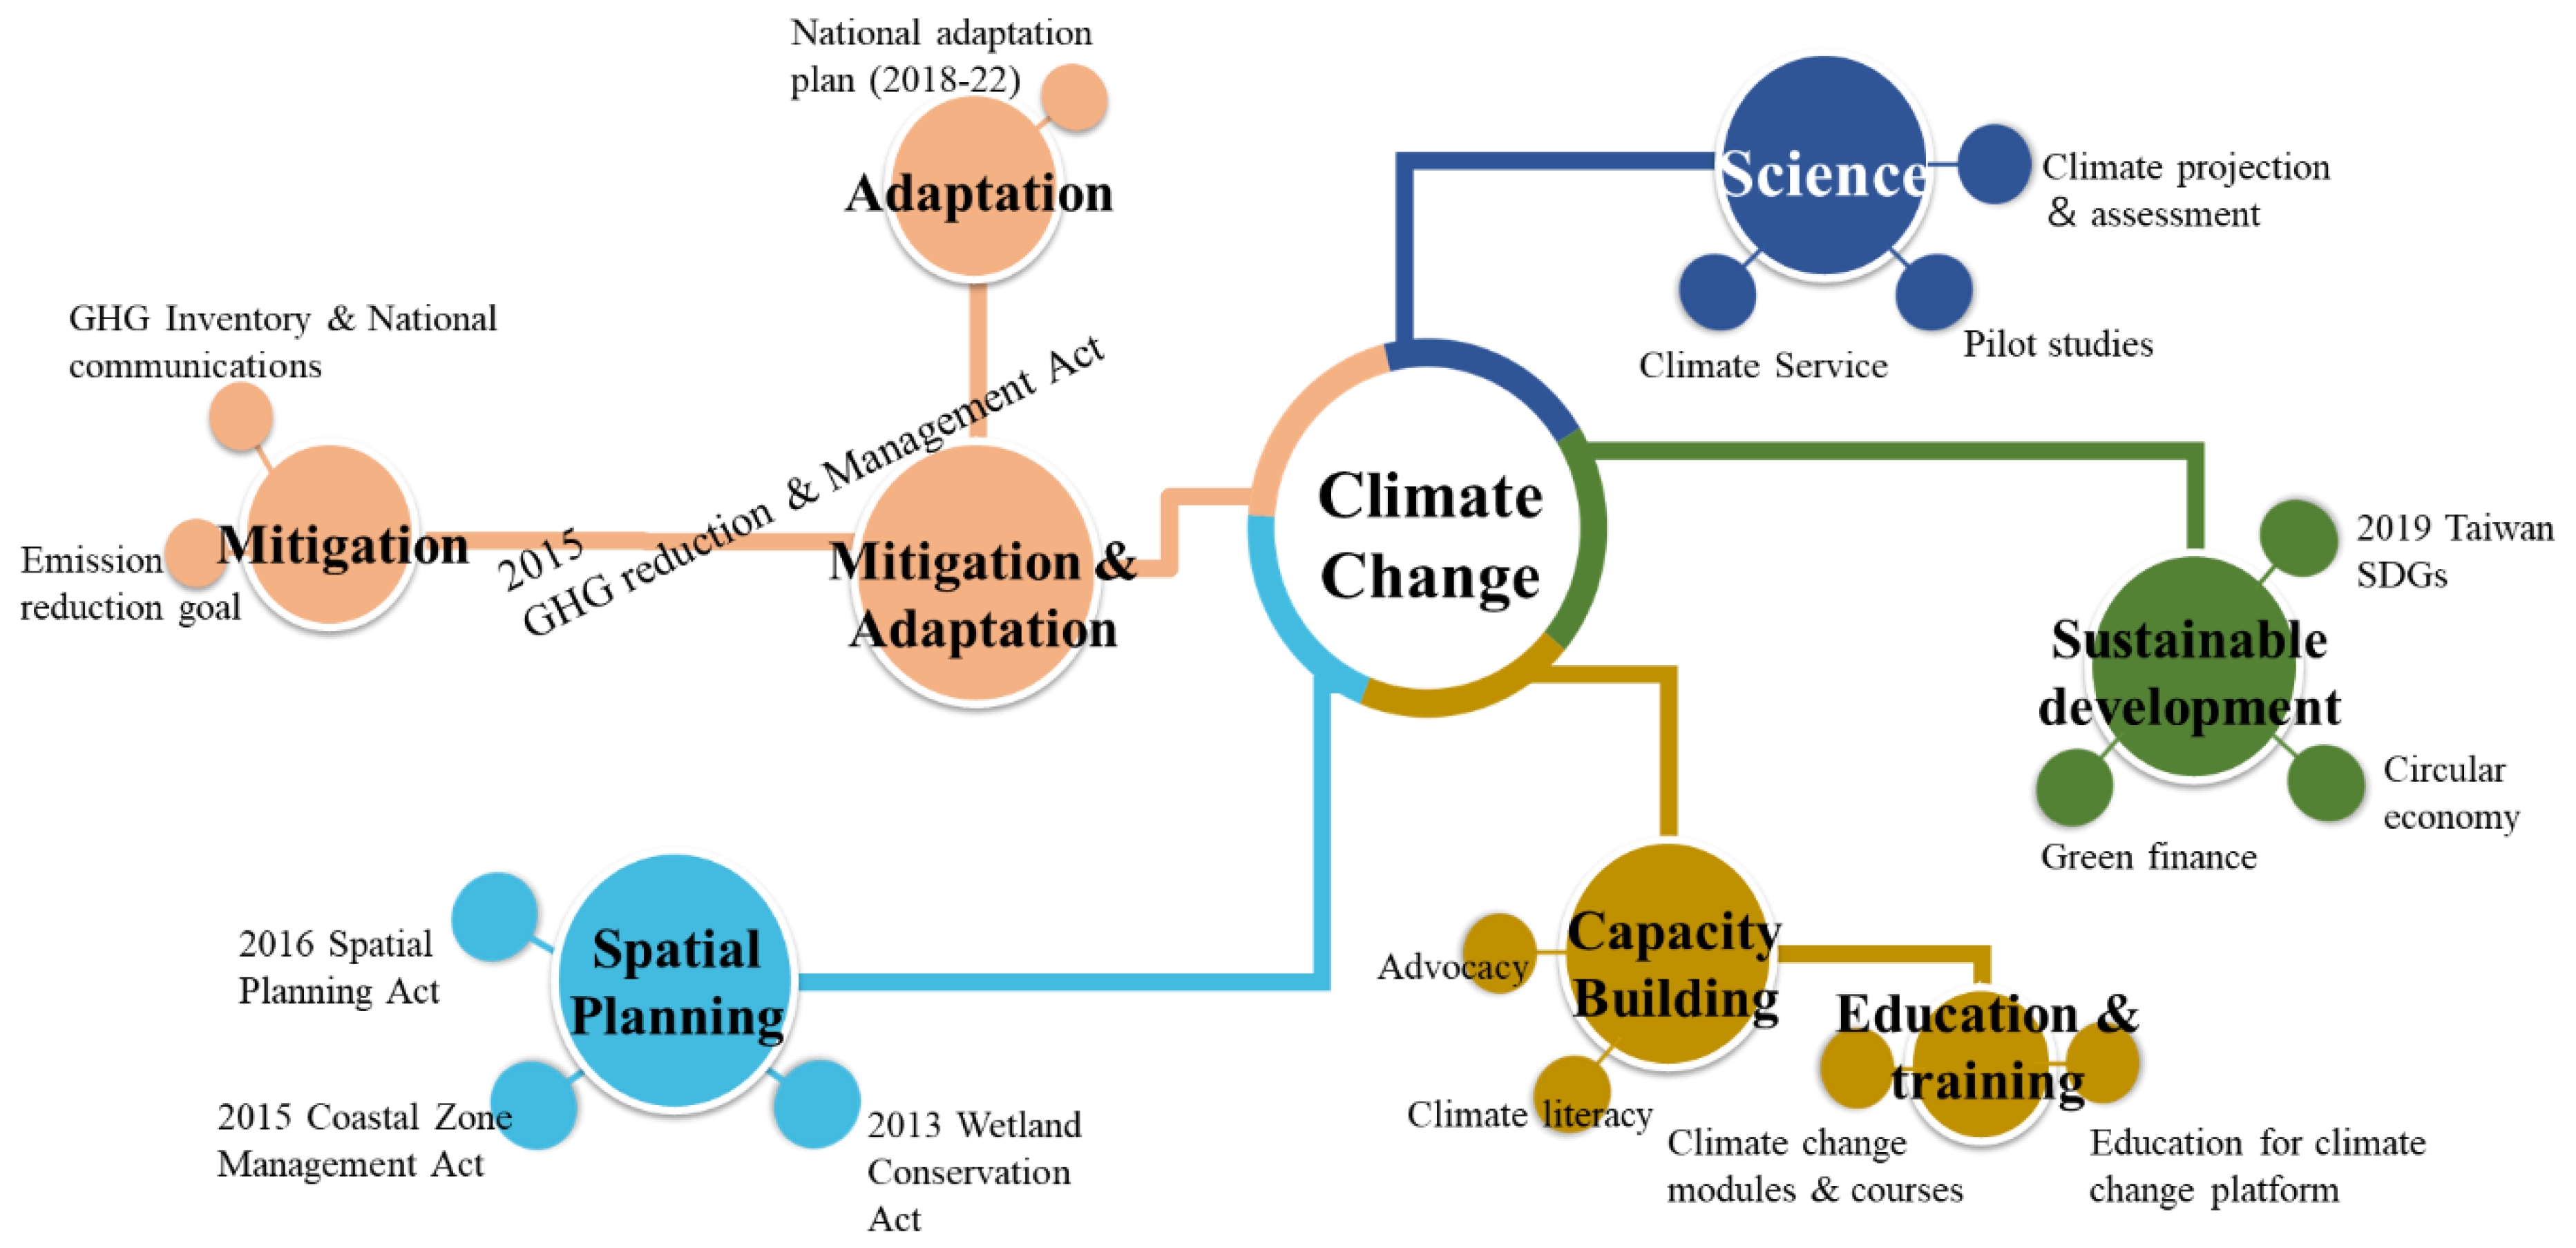
4.1. Adaptation Research, Policy Support and Advocacy

To perform climate change risk assessment in Taiwan was highly challenging due to the country’s complex geography and weather system. As a result, the generation of high-resolution downscaled climate data was an essential investment by the TCCIP project so that it could foster further research into critical themes such as flooding and landslides. The physical mechanisms of natural systems were investigated using different approaches in an attempt to achieve a more accurate climate projection. Precipitation is one of the critical parameters that climate change will influence and that will induce risk, hence the following were studied in great detail in Taiwan: the land–sea breeze system that that facilitates the formation of diurnal rainfall events [34,35,36], and seasonal monsoon events, including Madden–Julian oscillation impacts on winter rainfalls, and the East Asian summer monsoon (aka Meiyu), under different climate scenarios [37,38]. The preliminary study of watershed typhoon rainfalls and extreme precipitation under climate change found that the 24-h duration precipitation depth for 20-year and 100-year extreme events are likely to increase, suggesting concerns about the current hydrologic designs of critical infrastructures [39,40,41,42]. The secondary effects of precipitation on several factors, such as landslides, where critical precipitation is a characteristic that triggers large-scale landslide events, were studied and considered in conjunction in order to understand the cause/effect relationships; they were also impact assessed using climate projection [43,44,45,46,47]. Other parameters such as solar activities [1], typhoon-induced storm wave [48], tidal energy [49], and storm tides during typhoon events [50,51,52] were also studied.
The TCCIP project has also utilized climate data and downscale technologies in several different contexts, in particular with regard to rainfall-related topics. Simulations of summer monsoons and mei-yu seasons using statistical and dynamical downscaling methodologies have all indicated a more extreme trend of precipitation in the future under climate change scenarios [53,54]. The effect of extreme precipitation on rivers is prominent, resulting in very high annual sediment discharge [55], and studies have focused on several key catchments in Taiwan, as listed below:
  • Flood disasters at the Choshui River catchment may occur in a shorter time duration, and river catchment will face more severe degradation [56].
  • The risk from overbank and pier scour disasters in the Kaoping River catchment will increase in the future [57,58], where over 80% of the affected facilities related to the public and industry [59].
  • In the Shihmen Reservoir and Xindian River catchment, the severity and frequency of landslide events will increase due to climate change [60,61]; a preliminary estimate suggests a total economic loss of USD 358.25 million from the cascading impacts of slope land disasters [62].
  • The overflow risk of the Tsengwen River under extreme events was initially studied [63]. This was extended into a more comprehensive impact assessment of the surrounding regions [64] and coupled with assessment tools to conclude that approximately 7 billion NTD of loss may be reduced by implementing adaptation measures [65].
Furthermore, themes such as hydrological design [40,66] and water resources vulnerability were also investigated, where adaptation options were explored [67,68], and a cost-benefit analysis was performed to demonstrate the advantage of adaptation actions [69].
During various stages of adaptation strategy in Taiwan, the TCCIP project has always provided scientific insights by publishing dedicated scientific reports that consider the most recent IPCC reports while extracting the most recent literature and studies available in Taiwan. The first report, An Introduction to Climate Change in Taiwan: Scientific Report 2011, described climate change and its potential influence on existing hazards and emerging impacts, targeting academic researchers and adaptation policymakers. In addition, the SPM of reports was also translated as a potential reference for local policymakers. The “Climate Change in Taiwan 2017: Scientific Reports” was published by adopting methodologies published in the IPCC fifth assessment report and consisted of two reports: the Physical Scientific Basis and Impact and Adaptation. These reports have all become an integral part of Taiwan’s adaptation policy-making process, and both stages of the National Adaptation Plan [3,5] have included scientific evidence stated by the reports.
Research outcomes, reports, and knowledge extracted at different stages of the TCCIP project were demonstrated on an integrated website [70]. As the variety and volume of climate projection grew, the concept of climate service was adopted, and data were made available to academics and other sectors for further study and analysis. The website has undergone various modifications, and the current and third version is an interactive site that consists of a dataset of 1.5 billion climate data available for various applications, as well as over 180 publications and 150 media materials. The most recent update involves a beta demonstration of climate change hazards and the impact on thematic sectors, including flooding, landslides, water resources, agriculture, coasts, fishing, and health. The website has also filed attempts to put academic climate research into practice in the form of storylines.

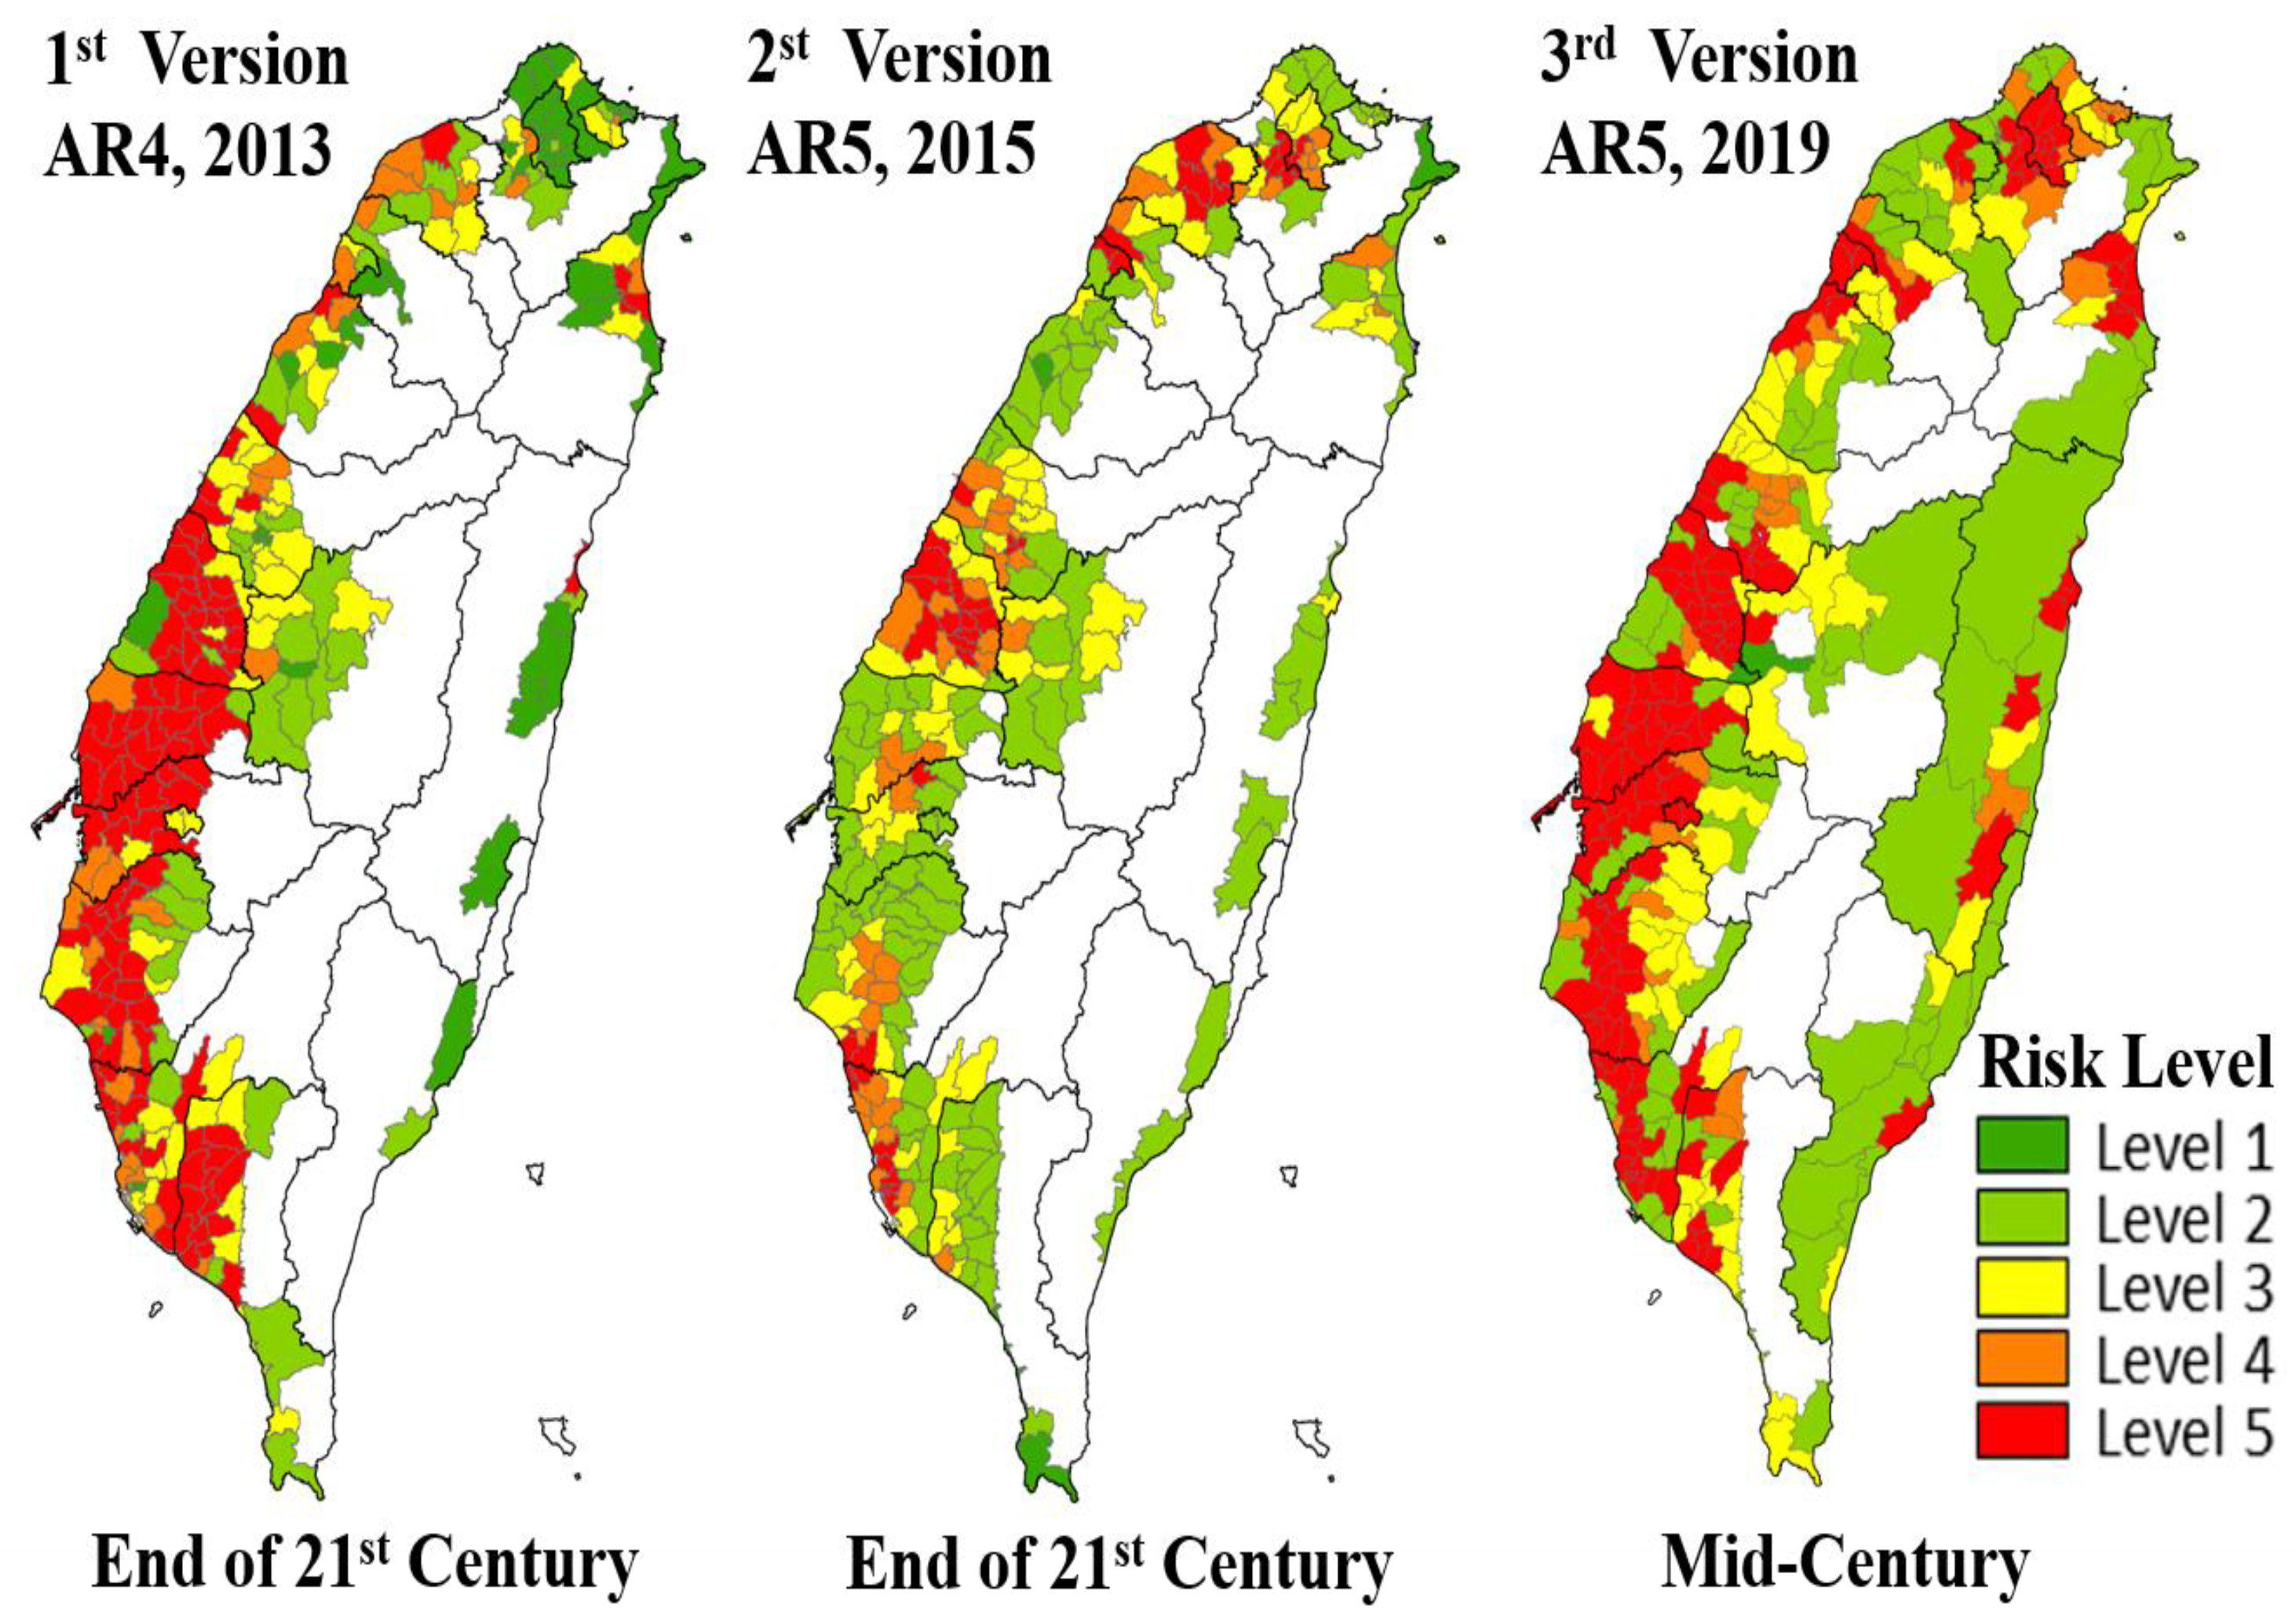
4.2. Application of Climate Data: The Risk Maps

An example for the application of climate data generated by the project is the disaster risk maps under climate change which were established by the National Science and Technology Center for Disaster Reduction (NCDR) and adopted in various policies, such as the local adaptation plan and local spatial plan, acting as fundamental materials for the identification and scoping of risk hotspots for corresponding action plans. The risk maps have undergone various transitions and are currently updated to the third version.
The first version utilized 5 km hi-resolution data from the 1st TCCIP project phase, adopting the MRI GCM coupled with WRF to assess the occurrence of extreme precipitations above 350 mm and 600 mm per day, respectively, storm surges caused by typhoons, and the characteristics of droughts, and to establish indicators for different disasters. Vulnerability is estimated using environmental (inundation, drought characteristics, average tidal differences) and socio-economic (population density, human development index, productivity) indexes. The calculated risk is then mapped using GIS during three time periods, the historical baseline, the near future, and end of the 21st century, for four specific disasters, including flooding, storm surges, drought, and landslides. These maps attempt to assess disaster risks under future climate change scenarios instead of relying on historical observations, even though only one model was used for the analysis. The second version of the risk maps demonstrates flooding and landslide disaster risks under the influence of climate change. The risk maps were generated by adopting IPCC AR5 RCP scenario projections and updating other parameters such as elevation and subsidence observational data for vulnerability calculations. The segregation of calculated risk was analyzed using statistical Z-Score methods into five different levels. The evolution of the third version includes adopting statistical downscaling methodologies [71], multiple GCMs for climate projections, and updates on parameters such as the current and projected 2036 demographic data. In addition, the risk maps were demonstrated in spatial scales of national, county, township, and essential statistical areas. A comparison of the three versions of risk maps is shown in Figure 6.

4.3. Comparison with Existing Studies

The main task of the TCCIP was to develop useable climate projection data for the nation, and was latter evolved to address impacts in sectors of major concern, such as flooding, landslides and water resources, whilst establishing knowledge brokering approaches, as mentioned in the previous sections. The TCCIP share similarities to projects, such as the SOUSEI in Japan [72] and SWECLIM in Sweden [73], that developed regional models and downscaled projection data for hi-resolution analyses on potential climate hazards at national and local scales. However, the TCCIP attempted thematic studies based on existing impact models without an effective integrative approach, so the project’s current capacity to address multidisciplinary analyses is limited to preliminary pilot or case studies. Compared to studies that target cross-sector and socio-economic issues, such as the CLIMSAVE platform, which adopted a meta-modelling approach [74], or the RESCCUE project, which was able to execute systematically thorough eight work packages of specific functions [75], there are some key gaps that the TCCIP should consider in the future.

5. Conclusions

The TCCIP project has played a vital role in the climate adaptation research of Taiwan, simulating projections under different climate scenarios according to the most recent CMIP phases and providing high-resolution 5 km grid data that are downscaled statistically or dynamically for various research needs, including impact analysis for crucial topics. In addition, the project has supported national adaptation policies by publishing scientific reports, which have formed the scientific basis for two phases of five-year national adaptation plans, and through the provision of climate services, knowledge brokering, and promoted adaptation case studies by providing stakeholders with climate and counseling expertise.
However, gaps, especially weakness when it comes to integrating socio-economic factors, should also be addressed for more comprehensive support while linking science and practice. In Taiwan, most resources emphasize short-term disaster risk reduction; these actions have successfully enhanced resilience, mainly from natural disasters and current extreme events, though only in the shorter term. Previous studies by the TCCIP have addressed vital topics, but addressing the national climate change risk in the long term still requires a more integrated effort from both public and private sectors, including inter-disciplinary resource scaling, the mobilization of resources and funding, and stakeholder collaboration in the socio-economic sector. The immediate actions that are required to address the gap between science and policymaking include establishing a national scenario to accelerate policymaking amongst governmental institutions, establishing multidisciplinary meta-modeling that systematically projects future impacts, and exploring viable solutions through collaboration with practitioners, industries, and local indigenous communities, with linkage to the nation’s Sustainable Development Goals.
The TCCIP project aims to engage various stakeholders in promoting user-oriented practical research that enhances capacity building and encourages learning towards an adaptation community with a consensus towards the country’s sustainable development.

Author Contributions

For this research article, C.-T.L. wrote the draft of the paper; previous outcomes of climate projection studies were provided by C.-T.C.; H.-C.L. contributed to the impact and benefit assessment; L.-Y.L. supervised climate projection researches; W.-B.C. and Y.-M.C. edited the paper and supervised the entire research. All authors have read and agreed to the published version of the manuscript.

Funding

This research was supported by the Ministry of Science and Technology (MOST), Taiwan, grant No. MOST-109-2621-M-865-001.

Institutional Review Board Statement

Not applicable.

Informed Consent Statement

Not applicable.

Conflicts of Interest

The authors declare no conflict of interest.

References

  1. Hung, C.-W. A 300-Year Typhoon Record in Taiwan and the Relationship with Solar Activity. Terr. Atmos. Ocean. Sci. 2013, 24, 737. [Google Scholar] [CrossRef] [Green Version]
  2. National Development Council. Adaptation Strategy to Climate Change in Taiwan; National Development Council, Taiwan: Taipei, Taiwan, 2012.
  3. National Development Council. National Climate Change Adaptation Action Plan (2013–2017); National Development Council, Taiwan: Taipei, Taiwan, 2014.
  4. Environmental Protection Administration. Greenhouse Gas Reduction and Management Act 2015; Environmental Protection Administration, E.Y.: Taipei, Taiwan, 2015.
  5. Environmental Protection Administration. National Climate Change Adaptation Action Plan (2018–2022); Environmental Protection Administration, E.Y.: Taipei, Taiwan, 2019.
  6. Ministry of Interior. Wetland Conservation Act; Ministry of Interior, Taiwan: Taipei, Taiwan, 2013.
  7. Ministry of Interior. Coastal Zone Management Act; Ministry of Interior, Taiwan: Taipei, Taiwan, 2015.
  8. Ministry of Interior. Spatial Planning Act; Ministry of Interior, Taiwan: Taipei, Taiwan, 2016.
  9. Environmental Protection Administration. Taiwan Sustainable Development Goals; Environmental Protection Administration, E.Y.: Taipei, Taiwan, 2019.
  10. Climate Change Education. Available online: https://climatechange.tw/en-us/ (accessed on 15 April 2021).
  11. Glasbey, C.A.; Nevison, I.M. Rainfall Modelling Using a Latent Gaussian Variable. In Modelling Longitudinal and Spatially Correlated Data; Springer: New York, NY, USA, 1997; pp. 233–242. [Google Scholar]
  12. Simolo, C.; Brunetti, M.; Maugeri, M.; Nanni, T. Improving estimation of missing values in daily precipitation series by a probability density function-preserving approach. Int. J. Clim. 2010, 30, 1564–1576. [Google Scholar] [CrossRef]
  13. Gobiet, A.; Suklitsch, M.; Heinrich, G. The effect of empirical-statistical correction of intensity-dependent model errors on the temperature climate change signal. Hydrol. Earth Syst. Sci. 2015, 19, 4055–4066. [Google Scholar] [CrossRef] [Green Version]
  14. Maurer, E.P. Uncertainty in hydrologic impacts of climate change in the Sierra Nevada, California, under two emissions scenarios. Clim. Chang. 2007, 82, 309–325. [Google Scholar] [CrossRef] [Green Version]
  15. Wood, A.; Maurer, E.; Kumar, A.; Lettenmaier, D.P. Long-range experimental hydrologic forecasting for the eastern United States. J. Geophys. Res. Earth Surf. 2002, 107, ACL 6-1–ACL 6-15. [Google Scholar] [CrossRef]
  16. Wood, A.; Leung, L.R.; Sridhar, V.; Lettenmaier, D.P. Hydrologic Implications of Dynamical and Statistical Approaches to Downscaling Climate Model Outputs. Clim. Chang. 2004, 62, 189–216. [Google Scholar] [CrossRef]
  17. IPCC. Climate Change 2007: Synthesis Report. Contribution of Working Groups I, II and III to the Fourth Assessment Report of the Intergovernmental Panel on Climate Change; Core Writing Team, Pachauri, R.K., Reisinger, A., Eds.; IPCC: Geneva, Switzerland, 2007; p. 104. [Google Scholar]
  18. Mizuta, R.; Yoshimura, H.; Murakami, H.; Matsueda, M.; Endo, H.; Ose, T.; Kamiguchi, K.; Hosaka, M.; Sugi, M.; Yukimoto, S.; et al. Climate Simulations Using MRI-AGCM3.2 with 20-km Grid. J. Meteorol. Soc. Jpn. 2012, 90, 233–258. [Google Scholar] [CrossRef] [Green Version]
  19. Skamarock, W.C.; Klemp, J.B.; Dudhia, J.; Gill, D.O.; Barker, D.M.; Duda, M.G.; Huang, X.Y.; Wang, W.; Powers, J.G. A Description of the Advanced Research WRF Version 3; NCAR Technical Note, NCAR/TN-475+STR; Mesoscale and Microscale Meteorology Division, National Center for Atmospheric Research: Boulder, CO, USA, 2008; Available online: https://opensky.ucar.edu/islandora/object/technotes:500 (accessed on 15 April 2021).
  20. IPCC. Climate Change 2014: Synthesis Report. Contribution of Working Groups I, II and III to the Fifth Assessment Report of the Intergovernmental Panel on Climate Change; Core Writing Team, Pachauri, R.K., Meyer, L.A., Eds.; IPCC: Geneva, Switzerland, 2014; p. 151. [Google Scholar]
  21. Chen, J.-H.; Lin, S.-J. Seasonal Predictions of Tropical Cyclones Using a 25-km-Resolution General Circulation Model. J. Clim. 2013, 26, 380–398. [Google Scholar] [CrossRef]
  22. Hong, N.-M.; Lee, T.-Y.; Chen, Y.-J. Daily weather generator with drought properties by copulas and standardized precipitation indices. Environ. Monit. Assess. 2016, 188, 383. [Google Scholar] [CrossRef] [PubMed]
  23. Liu, H.-W.; Yu, J.-Y.; Chen, C.-A. Changes of tropical precipitation and convective structure under global warming projected by CMIP5 model simulations. Terr. Atmos. Ocean. Sci. 2018, 29, 429–440. [Google Scholar] [CrossRef] [Green Version]
  24. Lin, C.-Y.; Chua, Y.-J.; Sheng, Y.-F.; Hsu, H.-H.; Cheng, C.-T.; Lin, Y.-Y. Altitudinal and latitudinal dependence of future warming in Taiwan simulated by WRF nested with ECHAM5/MPIOM. Int. J. Climatol. 2015, 35, 1800–1809. [Google Scholar] [CrossRef]
  25. Tsou, C.-H.; Huang, P.-Y.; Tu, C.-Y.; Chen, C.-T.; Tzeng, T.-P.; Cheng, C.-T. Present Simulation and Future Typhoon Activity Projection over Western North Pacific and Taiwan/East Coast of China in 20-km HiRAM Climate Model. Terr. Atmos. Ocean. Sci. 2016, 27, 687–703. [Google Scholar] [CrossRef] [Green Version]
  26. Su, Y.-F.; Cheng, C.-T.; Liou, J.-J.; Chen, Y.-M.; Kitoh, A. Bias Correction of MRI-WRF Dynamic Downscaling Datasets. Terr. Atmos. Ocean. Sci. 2016, 27, 649–657. [Google Scholar] [CrossRef] [Green Version]
  27. Huang, W.; Chang, Y.; Hsu, H.; Cheng, C.; Tu, C. Dynamical downscaling simulation and future projection of summer rainfall in Taiwan: Contributions from different types of rain events. J. Geophys. Res. Atmos. 2016, 121, 13973–13988. [Google Scholar] [CrossRef]
  28. Huang, W.-R.; Chang, Y.-H.; Cheng, C.-T.; Hsu, H.-H.; Tu, C.-Y.; Kitoh, A. Summer Convective Afternoon Rainfall Simulation and Projection Using WRF Driven by Global Climate Model. Part I: Over Taiwan. Terr. Atmos. Ocean. Sci. 2016, 27, 659–671. [Google Scholar] [CrossRef] [Green Version]
  29. Huang, W.-R.; Chang, Y.-H.; Hsu, H.-H.; Cheng, C.-T.; Tu, C.-Y. Summer convective afternoon rainfall simulation and projection using WRF driven by global climate model. Part II: Over South China and Luzon. Terr. Atmos. Ocean. Sci. 2016, 27, 673–685. [Google Scholar] [CrossRef] [Green Version]
  30. Kimura, N.; Chiang, S.; Wei, H.-P.; Su, Y.-F.; Chu, J.-L.; Cheng, C.-T.; Liou, J.-J.; Chen, Y.-M.; Lin, L.-Y. Tsengwen Reservoir Watershed Hydrological Flood Simulation under Global Climate Change Using the 20 km Mesh Meteorological Research Institute Atmospheric General Circulation Model (MRI-AGCM). Terr. Atmos. Ocean. Sci. 2014, 25, 449–461. [Google Scholar] [CrossRef] [Green Version]
  31. Kimura, N.; Tai, A.; Chiang, S.; Wei, H.-P.; Su, Y.-F.; Cheng, C.-T.; Kitoh, A. Hydrological Flood Simulation Using a Design Hyetograph Created from Extreme Weather Data of a High-Resolution Atmospheric General Circulation Model. Water 2014, 6, 345–366. [Google Scholar] [CrossRef] [Green Version]
  32. Hoogenboom, G.; Porter, C.H.; Boote, K.J.; Shelia, V.; Wilkens, P.W.; Singh, U.; White, J.W.; Asseng, S.; Lizaso, J.I.; Moreno, L.P.; et al. The DSSAT crop modeling ecosystem. In Advances in Crop Modeling for a Sustainable Agriculture; Boote, K.J., Ed.; Burleigh Dodds Science Publishing: Cambridge, UK, 2019; pp. 173–216. [Google Scholar]
  33. Jones, J.W.; Hoogenboom, G.; Porter, C.H.; Boote, K.J.; Batchelor, W.D.; Hunt, L.A.; Wilkens, P.W.; Singh, U.; Gijsman, A.J.; Ritchie, J.T. The DSSAT cropping system model. Eur. J. Agron. 2003, 18, 235–265. [Google Scholar] [CrossRef]
  34. Bui, H.X.; Yu, J.-Y.; Liu, H.-W.; Tu, C.-Y.; Chiu, P.-G.; Hsu, H.-H. Convective Structure Changes over the Equatorial Pacific with Highly Increased Precipitation under Global Warming Simulated in the HiRAM. SOLA 2019, 15, 119–124. [Google Scholar] [CrossRef] [Green Version]
  35. Ho, C.-H.; Yagi, N.; Tian, Y. An impact and adaptation assessment of changing coastal fishing grounds and fishery industry under global change. Mitig. Adapt. Strat. Glob. Chang. 2020, 25, 1073–1102. [Google Scholar] [CrossRef]
  36. Huang, W.-R.; Wang, S.-Y. Impact of land–sea breezes at different scales on the diurnal rainfall in Taiwan. Clim. Dyn. 2014, 43, 1951–1963. [Google Scholar] [CrossRef]
  37. Hung, C.-W.; Lin, H.-J.; Hsu, H.-H. Madden–Julian Oscillation and the Winter Rainfall in Taiwan. J. Clim. 2014, 27, 4521–4530. [Google Scholar] [CrossRef]
  38. Tung, Y.; Wang, S.S.; Chu, J.; Wu, C.; Chen, Y.; Cheng, C.; Lin, L. Projected increase of the East Asian summer monsoon (Meiyu) in Taiwan by climate models with variable performance. Meteorol. Appl. 2020, 27, e1886. [Google Scholar] [CrossRef] [Green Version]
  39. Wu, Y.-C.; Hou, J.-C.; Liou, J.-J.; Su, Y.-F.; Cheng, K.-S. Assessing the impact of climate change on basin-average annual typhoon rainfalls with consideration of multisite correlation. Paddy Water Environ. 2011, 10, 103–112. [Google Scholar] [CrossRef]
  40. Chu, H.; Pan, T.-Y.; Liou, J.-J. Change-point detection of long-duration extreme precipitation and the effect on hydrologic design: A case study of south Taiwan. Stoch. Environ. Res. Risk Assess. 2012, 26, 1123–1130. [Google Scholar] [CrossRef]
  41. Liu, R.; Liu, S.C.; Cicerone, R.J.; Shiu, C.-J.; Li, J.; Wang, J.; Zhang, Y. Trends of extreme precipitation in eastern China and their possible causes. Adv. Atmos. Sci. 2015, 32, 1027–1037. [Google Scholar] [CrossRef] [Green Version]
  42. Tung, Y.-S.; Chen, C.-T.; Min, S.-K.; Lin, L.-Y. Evaluating Extreme Rainfall Changes over Taiwan Using a Standardized Index. Terr. Atmos. Ocean. Sci. 2016, 27, 705. [Google Scholar] [CrossRef] [Green Version]
  43. Wu, T.; Shih, H.-J.; Li, H.-C.; Su, Y.-F.; Chen, Y.-M. Landslide Impact Assessment Using Projection Rainfall Data from Climate Change Scenario. Terr. Atmos. Ocean. Sci. 2016, 27, 729–740. [Google Scholar] [CrossRef] [Green Version]
  44. Chen, C.-W.; Oguchi, T.; Hayakawa, Y.S.; Saito, H.; Chen, H. Relationship between landslide size and rainfall conditions in Taiwan. Landslides 2017, 14, 1235–1240. [Google Scholar] [CrossRef]
  45. Chen, C.-W.; Saito, H.; Oguchi, T. Analyzing rainfall-induced mass movements in Taiwan using the soil water index. Landslides 2017, 14, 1031–1041. [Google Scholar] [CrossRef]
  46. Wu, S.-J.; Hsiao, Y.-H.; Yeh, K.-C.; Yang, S.-H. A probabilistic model for evaluating the reliability of rainfall thresholds for shallow landslides based on uncertainties in rainfall characteristics and soil properties. Nat. Hazards 2017, 87, 469–513. [Google Scholar] [CrossRef]
  47. Kuo, H.-L.; Lin, G.-W.; Chen, C.-W.; Saito, H.; Lin, C.-W.; Chen, H.; Chao, W.-A. Evaluating critical rainfall conditions for large-scale landslides by detecting event times from seismic records. Nat. Hazards Earth Syst. Sci. 2018, 18, 2877–2891. [Google Scholar] [CrossRef] [Green Version]
  48. Shih, H.-J.; Chen, H.; Liang, T.-Y.; Fu, H.-S.; Chang, C.-H.; Chen, W.-B.; Su, W.-R.; Lin, L.-Y. Generating potential risk maps for typhoon-induced waves along the coast of Taiwan. Ocean Eng. 2018, 136, 1–14. [Google Scholar] [CrossRef]
  49. Chen, W.-B.; Chen, H.; Lin, L.-Y.; Yu, Y.-C. Tidal Current Power Resources and Influence of Sea-Level Rise in the Coastal Waters of Kinmen Island, Taiwan. Energies 2017, 10, 652. [Google Scholar] [CrossRef] [Green Version]
  50. Chen, W.-B.; Chen, H.; Hsiao, S.-C.; Chang, C.-H.; Lin, L.-Y. Wind forcing effect on hindcasting of typhoon-driven extreme waves. Ocean Eng. 2019, 188, 106260. [Google Scholar] [CrossRef]
  51. Hsiao, S.-C.; Chen, H.-E.; Chen, W.-B.; Chang, C.-H.; Lin, L.-Y. Quantifying the contribution of nonlinear interactions to storm tide simulations during a super typhoon event. Ocean. Eng. 2019, 194, 106661. [Google Scholar] [CrossRef]
  52. Yu, Y.-C.; Chen, H.; Shih, H.-J.; Chang, C.-H.; Hsiao, S.-C.; Chen, W.-B.; Chen, Y.-M.; Su, W.-R.; Lin, L.-Y. Assessing the Potential Highest Storm Tide Hazard in Taiwan Based on 40-Year Historical Typhoon Surge Hindcasting. Atmosphere 2019, 10, 346. [Google Scholar] [CrossRef] [Green Version]
  53. Tung, Y.L.; Tam, C.-Y.; Sohn, S.-J.; Chu, J.-L. Improving the seasonal forecast for summertime South China rainfall using statistical downscaling. J. Geophys. Res. Atmos. 2013, 118, 5147–5159. [Google Scholar] [CrossRef]
  54. Freychet, N.; Hsu, H.-H.; Chou, C.; Wu, C.-H. Asian Summer Monsoon in CMIP5 Projections: A Link between the Change in Extreme Precipitation and Monsoon Dynamics. J. Clim. 2015, 28, 1477–1493. [Google Scholar] [CrossRef]
  55. Chen, C.-W.; Oguchi, T.; Hayakawa, Y.S.; Saito, H.; Chen, H.; Lin, G.-W.; Wei, L.-W.; Chao, Y.-C. Sediment yield during typhoon events in relation to landslides, rainfall, and catchment areas in Taiwan. Geomorphology 2018, 303, 540–548. [Google Scholar] [CrossRef]
  56. Chao, Y.-C.; Chen, C.-W.; Li, H.-C.; Chen, Y.-M. Riverbed Migrations in Western Taiwan under Climate Change. Water 2018, 10, 1631. [Google Scholar] [CrossRef] [Green Version]
  57. Chao, Y.-C.; Li, H.-C.; Liou, J.-J.; Chen, Y.-M. Extreme Bed Changes in the Gaoping River under Climate Change. Terr. Atmos. Ocean. Sci. 2016, 27, 717–727. [Google Scholar] [CrossRef] [Green Version]
  58. Wei, H.-P.; Su, Y.-F.; Cheng, C.-T.; Yeh, K.-C. Levee Overtopping Risk Assessment under Climate Change Scenario in Kao-Ping River, Taiwan. Sustainability 2020, 12, 4511. [Google Scholar] [CrossRef]
  59. Li, H.-C.; Wu, T.; Wei, H.-P.; Shih, H.-J.; Chao, Y.-C. Basinwide disaster loss assessments under extreme climate scenarios: A case study of the Kaoping River basin. Nat. Hazards 2016, 86, 1039–1058. [Google Scholar] [CrossRef]
  60. Chen, C.-W.; Tung, Y.-S.; Liou, J.-J.; Li, H.-C.; Cheng, C.-T.; Chen, Y.-M.; Oguchi, T. Assessing landslide characteristics in a changing climate in northern Taiwan. Catena 2019, 175, 263–277. [Google Scholar] [CrossRef]
  61. Chen, Y.-M.; Chen, C.-W.; Chao, Y.-C.; Tung, Y.-S.; Liou, J.-J.; Li, H.-C.; Cheng, C.-T. Future Landslide Characteristic Assessment Using Ensemble Climate Change Scenarios: A Case Study in Taiwan. Water 2020, 12, 564. [Google Scholar] [CrossRef] [Green Version]
  62. Wei, S.-C.; Li, H.-C.; Shih, H.-J.; Liu, K.-F. Potential impact of climate change and extreme events on slope land hazard—A case study of Xindian watershed in Taiwan. Nat. Hazards Earth Syst. Sci. 2018, 18, 3283–3296. [Google Scholar] [CrossRef] [Green Version]
  63. Wei, H.-P.; Yeh, K.-C.; Liou, J.-J.; Chen, Y.-M.; Cheng, C.-T. Estimating the Risk of River Flow under Climate Change in the Tsengwen River Basin. Water 2016, 8, 81. [Google Scholar] [CrossRef] [Green Version]
  64. Wu, T.; Li, H.-C.; Wei, S.-P.; Chen, W.-B.; Chen, Y.-M.; Su, Y.-F.; Liu, J.-J.; Shih, H.-J. A comprehensive disaster impact assessment of extreme rainfall events under climate change: A case study in Zheng-wen river basin, Taiwan. Environ. Earth Sci. 2016, 75, 597. [Google Scholar] [CrossRef]
  65. Wei, H.-P.; Li, H.-C.; Yeh, K.-C.; Liou, J.-J.; Chen, Y.-M.; Lin, H.-J. Using Structural Measures to Reduce Flood Losses in a Future Extreme Weather Event. Terr. Atmos. Ocean. Sci. 2016, 27, 757–767. [Google Scholar] [CrossRef] [Green Version]
  66. Chen, W.-B.; Liu, W.-C.; Huang, L.-T. The influences of weir construction on saltwater intrusion and water quality in a tidal estuary—assessment with modeling study. Environ. Monit. Assess. 2013, 185, 8169–8184. [Google Scholar] [CrossRef] [PubMed]
  67. Chen, P.-Y.; Huang, S.-J.; Yu, C.-Y.; Chiang, P.-C.; Liu, T.-M.; Tung, C.-P. Study on the Climate Adaption Planning for an Industrial Company with Regional Risk of the Water Supply System—A Case in Taiwan. Water 2017, 9, 682. [Google Scholar] [CrossRef] [Green Version]
  68. Li, M.-H.; Tseng, K.-J.; Tung, C.-P.; Shih, D.-S.; Liu, T.-M. Assessing water resources vulnerability and resilience of southern Taiwan to climate change. Terr. Atmos. Ocean. Sci. 2017, 28, 67–81. [Google Scholar] [CrossRef] [Green Version]
  69. Li, H.-C.; Kuo, S.-Y.; Chen, W.-B.; Lin, L.-Y. Benefit analysis of flood adaptation under climate change scenario. Nat. Hazards 2018, 95, 547–568. [Google Scholar] [CrossRef]
  70. Taiwan Climate Change Projection Information and Adaptation Knowledge Platform (TCCIP). Available online: https://tccip.ncdr.nat.gov.tw/index_eng.aspx (accessed on 15 April 2021).
  71. Chen, Y.-J.; Chu, J.-L.; Tung, C.-P.; Yeh, K.C. Climate Change Impacts on Streamflow in Taiwan Catchments Based on Statistical Downscaling Data. Terr. Atmos. Ocean. Sci. 2016, 27, 741–755. [Google Scholar] [CrossRef] [Green Version]
  72. Takemi, T.; Okada, Y.; Ito, R.; Ishikawa, H.; Nakakita, E. Assessing the impacts of global warming on meteorological hazards and risks in Japan: Philosophy and achievements of the SOUSEI program. Hydrol. Res. Lett. 2016, 10, 119–125. [Google Scholar] [CrossRef] [Green Version]
  73. Rummukainen, M.; Bergström, S.; Persson, G.; Rodhe, J.; Tjernström, M. The Swedish Regional Climate Modelling Programme, SWECLIM: A Review. AMBIO A J. Hum. Environ. 2004, 33, 176–182. [Google Scholar] [CrossRef]
  74. Holman, I.; Brown, C.; Janes, V.; Sandars, D. Can we be certain about future land use change in Europe? A multi-scenario, integrated-assessment analysis. Agric. Syst. 2017, 151, 126–135. [Google Scholar] [CrossRef]
  75. Velasco, M.; Russo, B.; Martínez, M.; Malgrat, P.; Monjo, R.; Djordjevic, S.; Fontanals, I.; Vela, S.; Cardoso, M.A.; Buskute, A. Resilience to Cope with Climate Change in Urban Areas—A Multisectorial Approach Focusing on Water—The RESCCUE Project. Water 2018, 10, 1356. [Google Scholar] [CrossRef] [Green Version]
Figure 1. Framework of Taiwan’s 2nd National Adaptation Plan (2018–2022). The “Yuan” is the same as the “Department of State” in the United States.
Water 14 00358 g001
Figure 2. An indicative map of climate-related actions in Taiwan.
Water 14 00358 g002
Figure 3. Evolution of the TCCIP project.
Water 14 00358 g003
Figure 4. Framework of the TCCIP project.
Water 14 00358 g004
Figure 5. An overview on the evolution of TCCIP project.
Water 14 00358 g005
Figure 6. Evolution of the flooding disaster risk map.
Water 14 00358 g006
Table 1. Comparison between statistical and dynamical downscaling.
Statistical DownscalingWRF Dynamical Downscaling
GCM
(resolution)
33 CMIP5 ocean-atmosphere coupled model (~250 km)MRI·HiRAM AMIP
(25~60 km)
ScenarioIPCC AR5
RCP2.6, RCP4.5,
RCP6.0, RCP8.5
IPCC AR5
RCP8.5
(Specific scenario only)
Time periodcontinualSpecific time periods only
Time resolutiondaily averagehourly
MethodStatistics
(ECDF)
Atmospheric physics
(thermodynamic equations)
Time efficiencySimple method with relatively rapid data generationRequires ample computing resources, data generation is time-consuming
ParameterTemperature, precipitationTyphoon precipitation, wind field, pressure, radiation, relative humidity
ApplicationOverall analysis of climate based on temperature and precipitation trendsAnalysis of extreme events and subsequent impacts
Table 2. Comparison of statistical downscaled data from two project phases.
TCCIP 1st PhaseTCCIP 2nd Phase
CMIP3 precipitation (monthly data)
CMIP3 daily mean temperature (monthly)
CMIP3 extreme indicators for precipitation (annual)
CMIP3 daily max. temperature (monthly)
CMIP3 daily min. temperature (monthly)
CMIP5 precipitation (monthly)
CMIP5 daily mean temperature (monthly)
CMIP5 daily max. temperature (monthly)
CMIP5 daily min. temperature (monthly)
CMIP5 extreme indicators for precipitation (annual)
CMIP5 extreme indicators for temperature (annual)
CMIP5 daily precipitation (daily)
Baseline: 1980–1999
Near-future: 2020–2039
21st end of century: 2080–2099
Baseline: 1986–2005
Near future: 2021–2030
2041–2060
2061–2080
end of 21st century: 2081–2100
Southeast Asia: 25 km grid data
Taiwan: 5 km and 25 km grid data
CMIP3 scenarios: B1, A1B, and A2
CMIP5 scenarios: RCP2.6, 4.5, 6.0, and 8.5
Publisher’s Note: MDPI stays neutral with regard to jurisdictional claims in published maps and institutional affiliations.

