Article

Municipal-to-Industrial Water Reuse via Multi-Stage and Multi-Pass Reverse Osmosis Systems: A Step from Water Scarcity towards Sustainable Development

1
Department of Resources Engineering, National Cheng Kung University, Tainan 701, Taiwan
2
Water Resources Bureau of Tainan City Government, Tainan 701, Taiwan
*
Author to whom correspondence should be addressed.
Water 2022, 14(3), 362; https://doi.org/10.3390/w14030362
Submission received: 7 December 2021 / Revised: 15 January 2022 / Accepted: 23 January 2022 / Published: 26 January 2022
(This article belongs to the Special Issue Membrane Filtration for Water Reuse)

Abstract

:
Wastewater reclamation is a promising solution to growing pressure on limited water resources. In this study we evaluated the efficiency of boron removal from effluent at a water resource recovery facility (WRRF) using a two-stage/two-pass RO membrane system. We propose using measurements of electrical conductivity (EC) as a proxy for boron concentration. We tested our approach to boron estimation and the proposed split partial second pass (SPSP) system at an established WRRF and a pilot plant we constructed at the same location. Results showed that boron in the effluent was directly related to the concentration of EC. The proposed regression equation (y = 4.959 × 10⁻⁵x + 0.138) represents a rule of thumb for wastewater plant operators. The proposed SPSP system was optimized through manipulation of operating conditions, achieving a promising total water recovery of 64% at maximum boron rejection (over 85% removal) in a manner that was both cost-effective and flexible. This study demonstrates that two-stage/two-pass split-partial permeate treatment with a high pH for boron removal offers a sustainable freshwater supply option suitable for use by the semiconductor industry.

1. Introduction

Water is one of the world’s most valuable resources and unprecedented population and economic growth have imposed growing pressure on limited supplies [1]. Projections of climate change predict a future of chronic water scarcity [2,3]. This critical issue has brought attention to the concept of reusing water to support sustainable water resource management and the promotion of a circular economy [4,5,6]. Indeed, improved wastewater management has become imperative [7,8], and wastewater reclamation has been recommended as a potential solution to the problem of water scarcity [9,10,11]. By reclaiming wastewater, the circulation of water through the natural water cycle can be short-circuited, thereby contributing to human water needs while limiting environmental impacts [12,13].
Taiwan has ample water resources compared to other regions of the world, and here water has long been considered an inexhaustible resource. However, the uneven spatial and temporal distribution of water resources, increased demand, difficulty with water storage, and low water tariffs have led to low water-use efficiency, as well as shortages, in southern Taiwan. Meanwhile, the semiconductor industry has become a crucial contributor to Taiwan’s economy. According to World Semiconductor Trade Statistics (WSTS), revenue from the international semiconductor industry totaled US$440.4 billion in 2020. In Taiwan, revenue from the integrated-circuit industry (including design, manufacturing, packaging, and testing) is expected to reach US$137.0 billion in 2021, representing growth of 25.9% from 2020 [14]. This rapid development has contributed to the current environmental crisis through the high consumption of clean water and high generation of wastewater [15]. In 2021, Taiwan’s 70 water resource recovery facilities (WRRFs) discharged 3.3 million tons per day of treated wastewater [16]. Reclamation and reuse of this treated effluent have been shown to be critical components of the maintenance of sustainable water resources [17,18]. This ‘new’ source of a stable water supply is key to development in water-short communities. Water reuse is therefore set to become an integral factor in fostering optimal planning and the efficient use of water resources in areas with limited freshwater sources [19,20,21].
Reverse osmosis (RO) is a membrane separation technology for producing pure water. Due to continuous improvement in the design and fabrication of membranes [22,23], RO can be regarded as key to advanced wastewater reclamation and reuse. The water that passes through a membrane is called product water or permeate. In semiconductor manufacturing, the final stages involve rinsing the semiconductor to ensure that it is free of contaminants. This process relies on ‘ultra-pure’ water (UPW), i.e., water that is free of ions and particles. RO plays a major role in the production of water for the semiconductor industry, and this is set to grow as demands for pure water continue to increase [24]. In fact, many contaminants with small particle sizes or uncharged species (such as boron) remain a challenge to RO systems [25]. RO membranes are less efficient at reducing boron content than other ions. Not only is boron difficult to remove, it is also suspected of lowering the yield of semiconductor production. Therefore, controlling the amounts of boron in semiconductor process water is a challenge which poses significant obstacles to the reuse of water for the semiconductor industry [26,27,28].
In addition to the development of new RO membranes, applied seawater reverse osmosis (SWRO) with improved boron rejection, and producing permeate water with appropriate boron concentrations, there are other avenues to achieving the required permeate quality. Specifically, multi-passes and increased pH have been widely applied to the deboronation of wastewater in RO systems [29,30,31,32,33,34,35,36,37,38]. Due to enhancements in RO membrane technology, the efficiency of RO use has been constantly improving. However, the costs of SWRO are significantly higher than the costs of brackish water RO (BWRO). High-pressure RO consumes significantly more energy than does low-pressure RO. The infrastructure required for SWRO is significantly greater too. Moreover, the performance of SWRO is limited by factors, such as operating conditions, the membrane boron permeability coefficient, and the fouling effect [39,40,41,42,43]. Furthermore, under variable operating conditions restrictions increase [44]. The aim of the current study was to find alternative methods for the rapid estimation of boron concentration to optimize its removal, meeting process water standards for semiconductor manufacturing. This study evaluates the efficiency and feasibility of boron removal from WRRF effluent using a two-stage and two-pass RO system. Further, to make the proposed approach applicable to the treatment of municipal wastewater at a market scale, we implemented a split partial second pass (SPSP), in which some of the first-pass RO permeate bypasses the second pass and then is mixed with the permeate derived from the second pass, to obtain final product of required quality. This saves on energy consumption, minimizing the overall treatment cost. For cases with zero increase in tap water, the proposed approach represents an effective means of expanding municipal-to-industrial water reuse: treated domestic wastewater can be supplied to the semiconductor industry as process water in water stressed areas to reduce impacts on production and operation, as well as to decrease the threat of water scarcity.

2. Materials and Methods

2.1. Experimental Procedure

WRRF wastewater is usually collected by gravity, and most WRRFs are located in coastal areas or depressions. Compared with the sewage indicators of typical WRRFs, the measured values of electrical conductivity (EC), total dissolved solids (TDS), pH levels, and boron of sewage from coastal WRRFs are higher due to seawater intrusion. Other parameters remain in the typical range for treated municipal wastewater. When using RO systems to reclaim and reuse treated effluent for semiconductor manufacturing, the key trace pollutant is boron. Boron concentrations must be controlled to below 0.05 ppb to 1 ppb in process water systems. As routine chemical analysis is time-consuming, for the purposes of the semiconductor industry, measurements of boron concentrations must be simple, rapid, and capable of determining direct cause-and-effect relationships.
The first aim of this study was to use regression analysis to assess factors of water quality. With on-site EC measurement using a universal multi-parameter portable meter (WTW ProfiLine pH/Cond 3320, Germany), samples were consistently taken mid-morning every day. Data were subjected to regression analysis by SPSS statistics 17.0. Regression equations were constructed with boron constituents as the dependent variables and EC as the independent variable. We focused on finding a flexible and quick means of using EC measurements as a proxy for boron concentration. This resulted in identification of significant correlation coefficients which could be used to estimate boron concentration [45].
At normal pH levels, boron occurs in the form of boric acid. The molecules of boric acid are small and uncharged, which makes them difficult to remove by RO [46]. Indeed, elimination of boric acid by single-pass RO is around 43% [47]. Therefore, roughly one third of the boron content usually remains in the permeate [48]. This study sought to lower boron concentrations in the permeate of two-pass RO systems. We added 45% sodium hydroxide (in liquid form) to adjust the pH before the second pass inflow, to optimize the removal of boron. This process was tested through construction of an RO pilot plant based on the concept of SPSP with regression equations based on EC to estimate the concentration of boron and select the optimal ratio between the first and second passes.

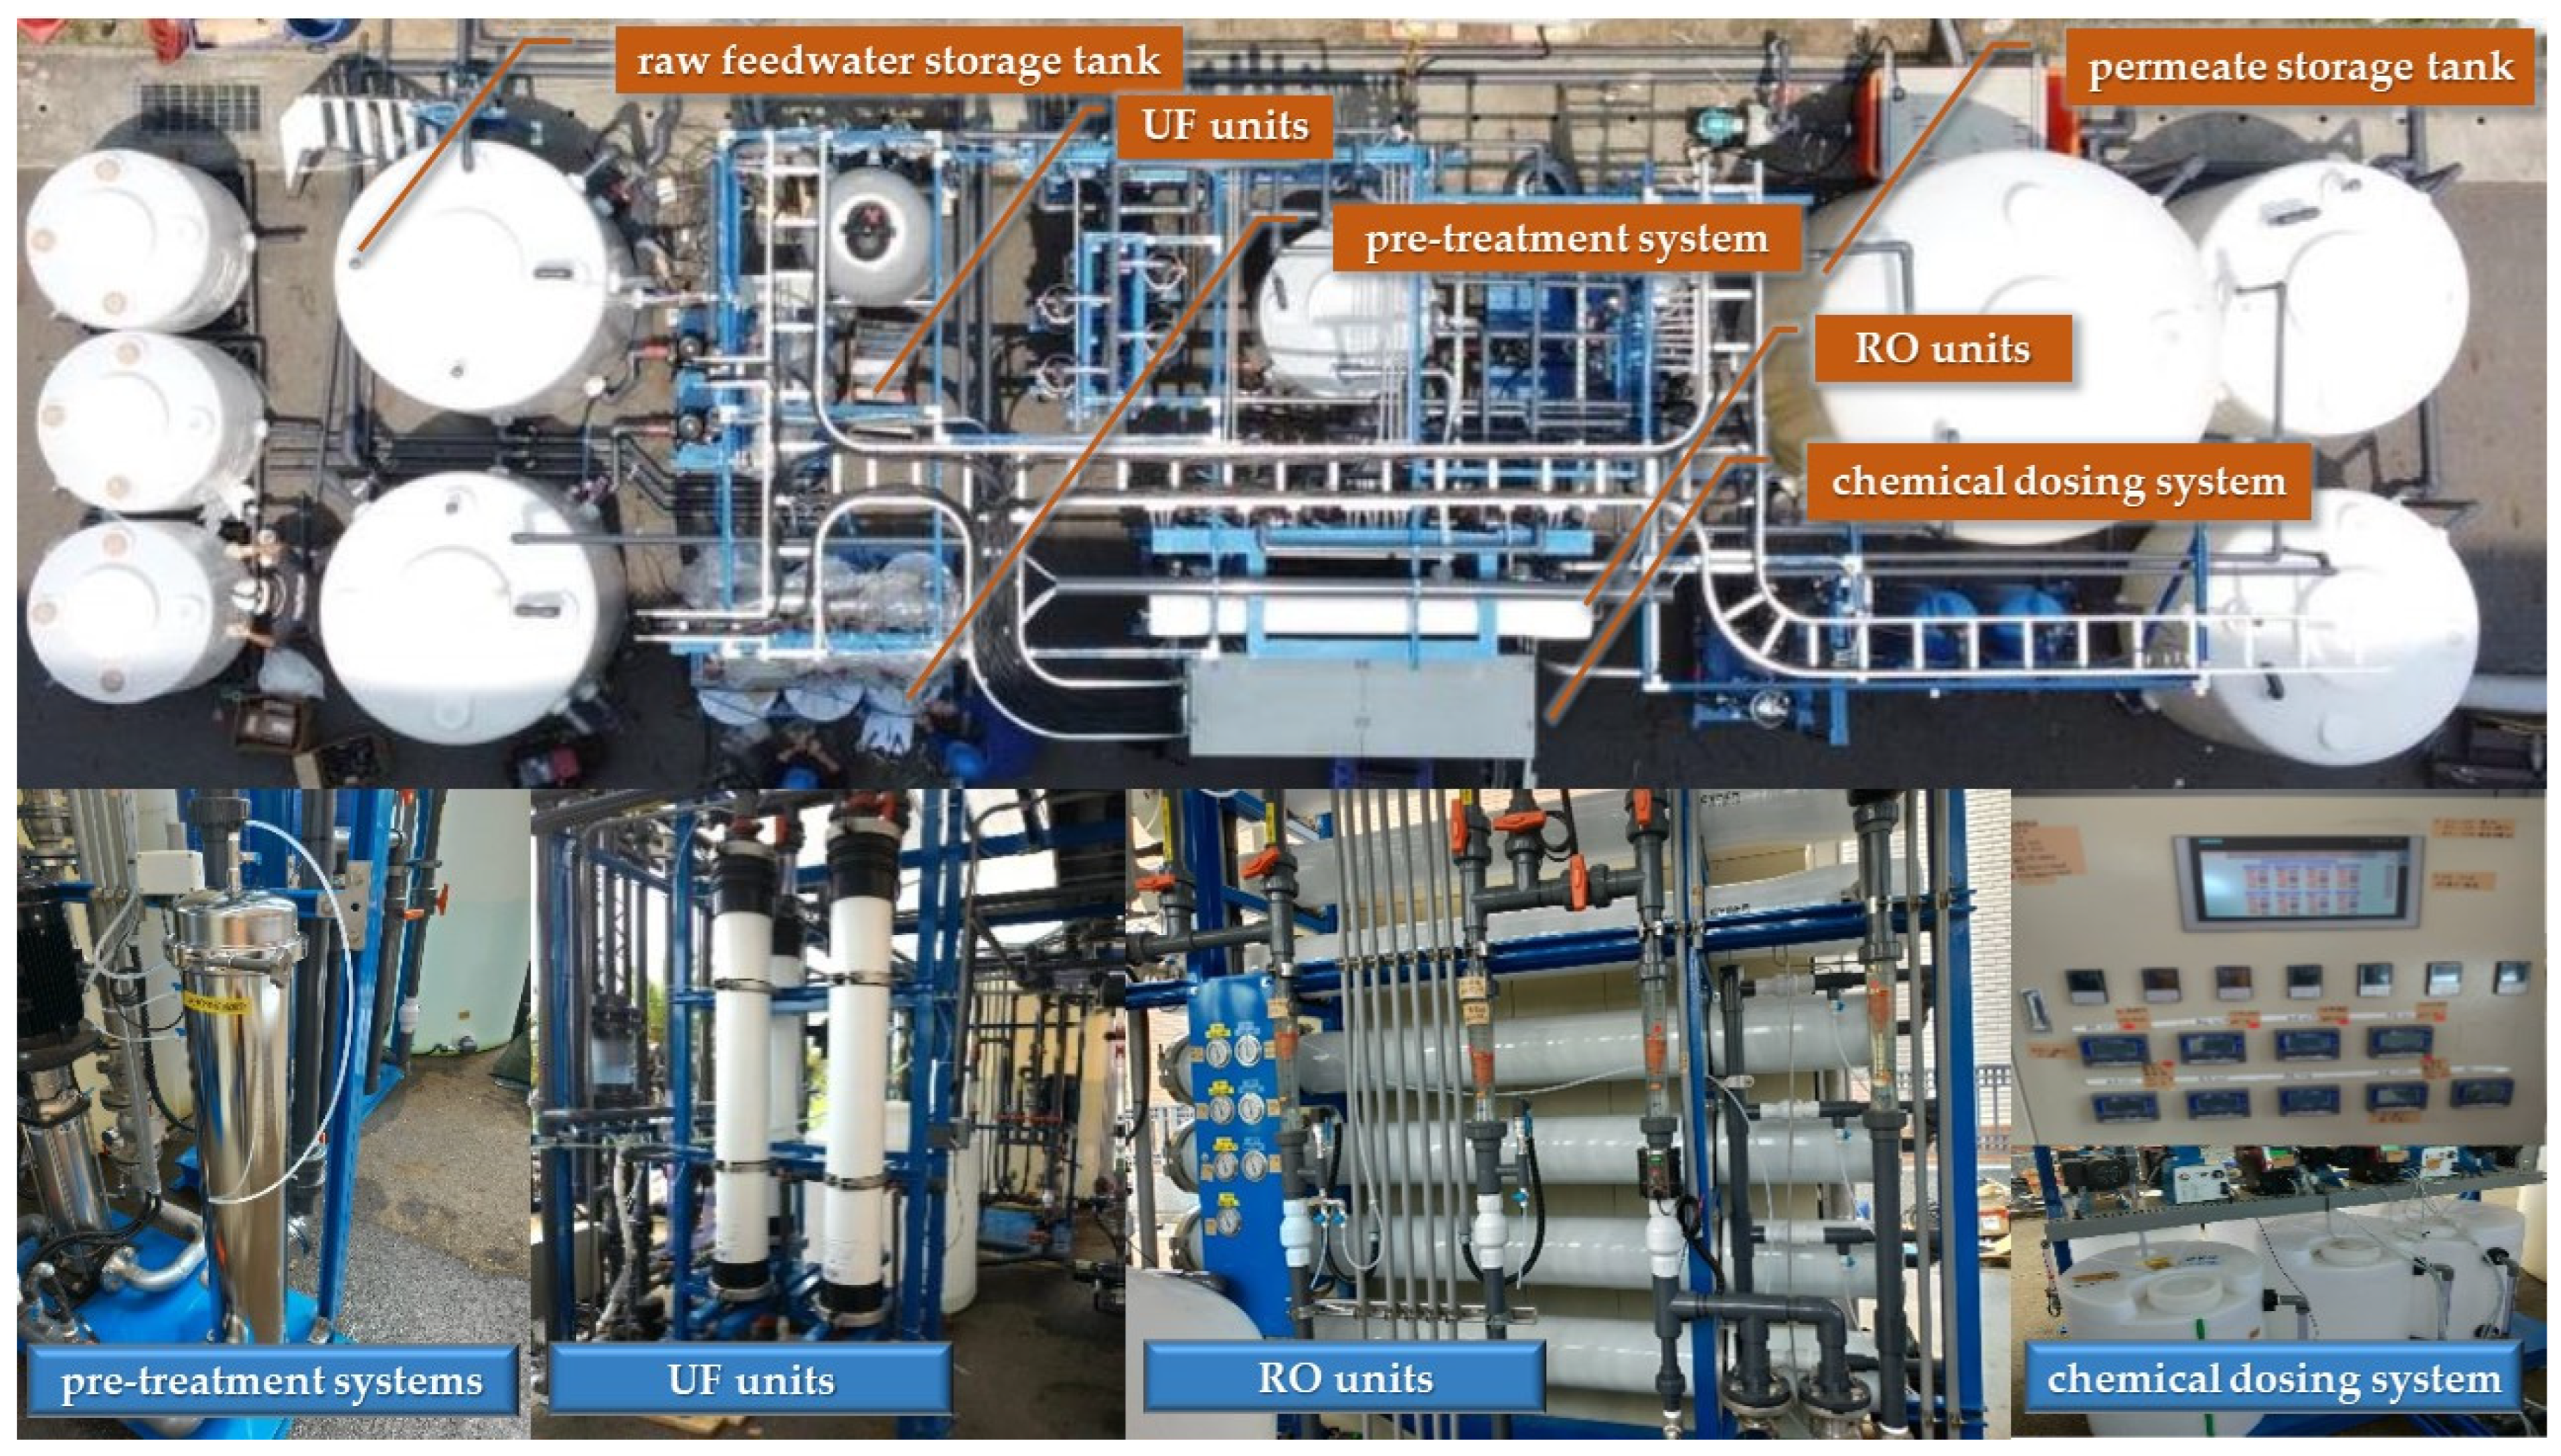
2.2. Description of WRRF and Constructed Pilot Plant

In our experiments, we worked with an established WRRF and also constructed a pilot plant. We refer to these, respectively, as plant A and plant B. The WRRF is located offshore in Tainan (southern Taiwan), on the right bank of a canal. It covers an area of approximately 10.31 hectares, with a capacity of 16,000 tons per day. It features secondary-activated sludge treatment, five interception stations, and approximately 79.9 km of trunk and lateral sewer lines. Plant A applies the following treatment processes: raw wastewater pumping, preliminary treatment using fine bar screens and girt chambers, preliminary sedimentation, aeration, secondary sedimentation, disinfection, and discharge into the harbor. The origin of the wastewater is 2/5 interception and 3/5 domestic [16].
Plant B was installed at the outlet of the secondary settling tank of the WRRF. It comprises six units, for which the average permeate flow is 8.6 m3/h (i.e., 206 cubic meters per day). It includes the following equipment: a raw feedwater storage tank, pre-treatment systems, ultra-filtration (UF) units, RO units, a chemical dosing system, and a permeate storage tank. The pilot plant components are shown in Figure 1.
A schematic block diagram of the two-stage and two-pass RO pilot plant (i.e., plant B) is presented in Figure 2. SPSP improves product quality and energy efficiency by treating only a portion of the permeate from the first pass. A diagram of a typical SPSP system is presented in Figure 3.
Plant B features a series configuration of 2:2 pressure vessels, where the wastewater is directly fed to two pressure vessels. This constitutes the first pass. The pH of the resulting permeate streams are adjusted before they are sent for the second pass. There are two high-pressure pumps at the entrance of the plant keeping the feed pressure stable. The two pumps deliver a maximum of 600 psi. Augmentation of the permeate streams resulting from the first pass has the advantage of keeping the permeate produced by the second pass at a low concentration.
Membrane characteristics and physical dimensions for the UF and RO membranes are summarized in Table 1 [49,50]. Feedwater, permeate, and concentrate water flow rates were measured using Kingtai® LZSLZS--25E, LZE25E and LZE--50E online flow meters. The feedwater flow rate was adjusted by controlling the feed pumps. The feedwater of the second pass is the permeate produced in the first pass. We adjusted the pH level of this feedwater using a blending line and reject concentrate water recycling.
In this study, experiments were carried out with commercial membranes, the Asahi Kasei MICROZA UNA-620A and Hydranautics Nitto CPA5-LD for the UF and RO membranes, respectively. Benchmark values for the UF membrane were based on the following conditions: maximum transmembrane pressure of 45 psi, pH range 1.0–10.0 (for normal operation), and available free-chlorine concentration for cleaning of 5000 ppm. Benchmark values for the RO membranes were based on the following conditions: permeate flow 41.6 m3/day, salt rejection 99.7%, maximum applied pressure 600 psig, operating pH 2.0–11.0, and maximum brine flow 64.8 m3/day. A real-time monitoring system was mounted in the facilities on the equipment to continuously measure power consumption.

2.3. Data Collection and Analysis

All samples were collected manually. Samples from plant A were collected from the raw wastewater pumping station and the wastewater outfall. Samples from plant B were collected from the feedwater inlet, first RO permeate, second RO inlet, and second RO permeate. Clean polyethylene gloves were used during the sampling procedure. All samples were collected in 1-L contaminant-free (i.e., trace-clean) amber glass bottles or polyethylene bottles. The collected samples were kept in a refrigerator at 4 °C and delivered to the laboratory within 8 h to ensure that the samples did not deteriorate or become contaminated or compromised [51].
To compare differences in concentrations during the RO process at the inlet (feedwater) and at the outlet (permeate) of the pilot plant, we analyzed the following: suspended solids (SS), turbidity, chemical oxygen demand (COD), total organic carbon (TOC), ammonia-N, nitrogen, nitrite nitrogen, nitrate nitrogen, boron, orthophosphate, chloride, total dissolved solids (TDS), sulfate, arsenic, cadmium, alkalinity, total hardness, and coliform group. These analyses were carried out using atomic absorption spectrometry (Hitachi, ZA-3000, Tokyo, Japan), UV-visible spectroscopy (Hitachi, U-2900, Tokyo, Japan), and ion chromatography (Thermo Scientific Dionex ICS-6000, Sunnyvale, CA, USA). Field measurements of temperature, EC, dissolved oxygen (DO), and pH were made by water quality sonde (WTW ProfiLine pH/Cond 3320, Weilheim in Oberbayern, Germany). The collected water samples were tested using physical and chemical analysis methods. Calculation of boron in effluents and reclaimed water was conducted using the spectrophotometric curcumin method, according to The Environmental Analysis Laboratory (EAL) Standard Methods for the Examination of Water and Wastewater [52]. Distilled and deionized water was used for stock solution preparations and dilutions, and all chemicals used were reagent grade.
Laboratory analyses of all samples were conducted by SGS Taiwan Ltd. and Eurofins Blue Formosa Environmental Technical Co. Ltd. in Kaohsiung and Tainan, Taiwan. All test procedures were performed according to the EAL Data Quality System, method NIEA PA101~PA108, and standard procedures [52,53]. Sample collection was conducted from August 2015 to July 2016 (totaling 22 times), 15 April to 14 May 2020 (continuously for 30 days), and 20 April to 26 May 2020 (continuously for 7 days).
Removal efficiency R (%) was calculated as follows:
R = ( C 0 C ) C 0 × 100
where C0 and C are the initial and final concentrations of analyte in the solution (mg/L).

3. Results

3.1. Correlation between Boron and Conductivity in Effluent from Plant A

The average concentration of boron in seawater is approximately 4.8 mg/L [54]. The boron concentration in WRRF effluent ranges from 0.5 to 2.0 mg/L [48,55]. Therefore, contact with seawater increases the concentration of boron in coastal WRRFs. Regression analysis is a well-established tool for the analysis of water quality parameters [56,57]. This study applied regression analysis to 22 samples taken from August 2015 to July 2016 to identify the correlation between boron and EC in effluent from plant A. Details are presented in Figure 4 and Table 2. In this regression equation, EC is the independent variable and boron is the dependent variable. Table 3 presents the results of regression analysis. The regression equation is statistically significant with an F-value of 170.018 and a significance level (p-value) of 0.000. This confirms that the proposed equations offer effective predictive power. The concentrations for the predicted value of boron vary from 0.287 to 0.564 mg/L, with a mean of 0.388 mg/L and standard deviation of 0.086. The regression coefficient (R2 = 0.895) showed that boron in the effluent was directly related to the concentration of EC (Figure 5).
In general, the data are approximately normally distributed and the results show a good correlation and a strong and positive relationship. The regression equation represent a rule of thumb for wastewater plant operators. They succinctly describe the relationship between boron and EC in raw municipal wastewater (affected by seawater intrusion). This statistical description is represented by the following equation: y = 4.959 × 10⁻⁵x + 0.138. The convenience and accuracy of this approach make it suitable for the estimation of WRRF wastewater reuse potential.

3.2. Optimization of Plant B

In recent years, many post-treatment methods for boron elimination have emerged, but only a few have been successful [58]. Even fewer have demonstrated high performance and economic efficiency [59]. There remains no easy method for removing boric acid and borates from an aqueous solution. As it is difficult to achieve low boron concentrations using a single-stage RO system, production of ultra-pure water is usually carried out using two-stage RO systems [60]. In this study, two-stage and two-pass RO systems were operated in continuous feed mode for 30 days. During the period from 15 April to 14 May in 2020, the cumulative flow of raw water influent reached 7192 m3, the cumulative flow of RO feed reached 6194 m3, and the cumulative flow of RO permeate reached 3961 m3. Furthermore, the UF-RO total water recovery was 55%, the first-pass RO recovery rate was 69.4%, the second-pass RO recovery rate was 92.1%, the RO total water recovery was 63.9%, and the production capacity was 206 m3/d. This performance meets the requirements for reclaimed water without any signs of membrane deterioration. The results of the optimization process are detailed in Figure 6 and Table 4 and Table 5. Under typical pH levels, boron is especially difficult to remove using membrane technology, due to its neutral charge and small hydrated radius compared to other elements [57,61]. Past studies have shown that the efficiency of boron rejection is just 40–60% for a pH range of 5.0–9.0 [54,62]. At 25 °C, the acid dissociation constant of boric acid (pka = 9.24) allows it (and other borate forms) to exist in equilibrium at a pH range of 7.0–11.5. This means that the uncharged ion predominates up to a pH level of 9.24, and increasing the pH enables the ionization of boric acid, thereby improving its rejection by membranes [27,63,64,65]. The success of boron removal by RO therefore depends on the pH of the feedwater. It has been found that boron can be effectively removed at a pH level of 11.0 [66]. In this study we achieved a noticeable increase in boron rejection following the second pass of pH-adjusted permeate (from pH = 10.0 to 10.5). We added 45% sodium hydroxide (in liquid form) to adjust the pH to 10.5 before the second pass inflow. The normal usage is about 3.96 kg/day. The pH adjustment increased the overall cost of the treatment system, so that converting a unit of water cost about USD 0.041 per m3. Low rejection can be attributed to the use of arbitrary (i.e., non-optimized) values of permeate pH levels and temperatures.
The two-stage and two-pass RO systems established in the current study effectively remove boron and other contaminants from wastewater. This study demonstrates that the proposed configuration of a two-pass RO systems yields results superior to those of previous studies in terms of boron removal. In RO, pressure is applied to a partially-permeable membrane to overcome the osmotic pressure of water [67]. This allows water to pass through while unwanted particles are left behind. This process removes 99% of organic compounds and more than 97% of TDS [68,69,70]. Details are provided in Figure 7. Generally, the data prove that the quality of RO effluents in terms of organic content, EC, turbidity, TOC, ammonia-N, chloride, total hardness, and TDS meets the requirements for reclaimed water [71], and for use by the semiconductor industry in particular.
The next section deals with process optimization (based on SPSP) to achieve a higher rejection rate and operational flexibility. We sought to maintain a high recovery rate while minimizing costs.

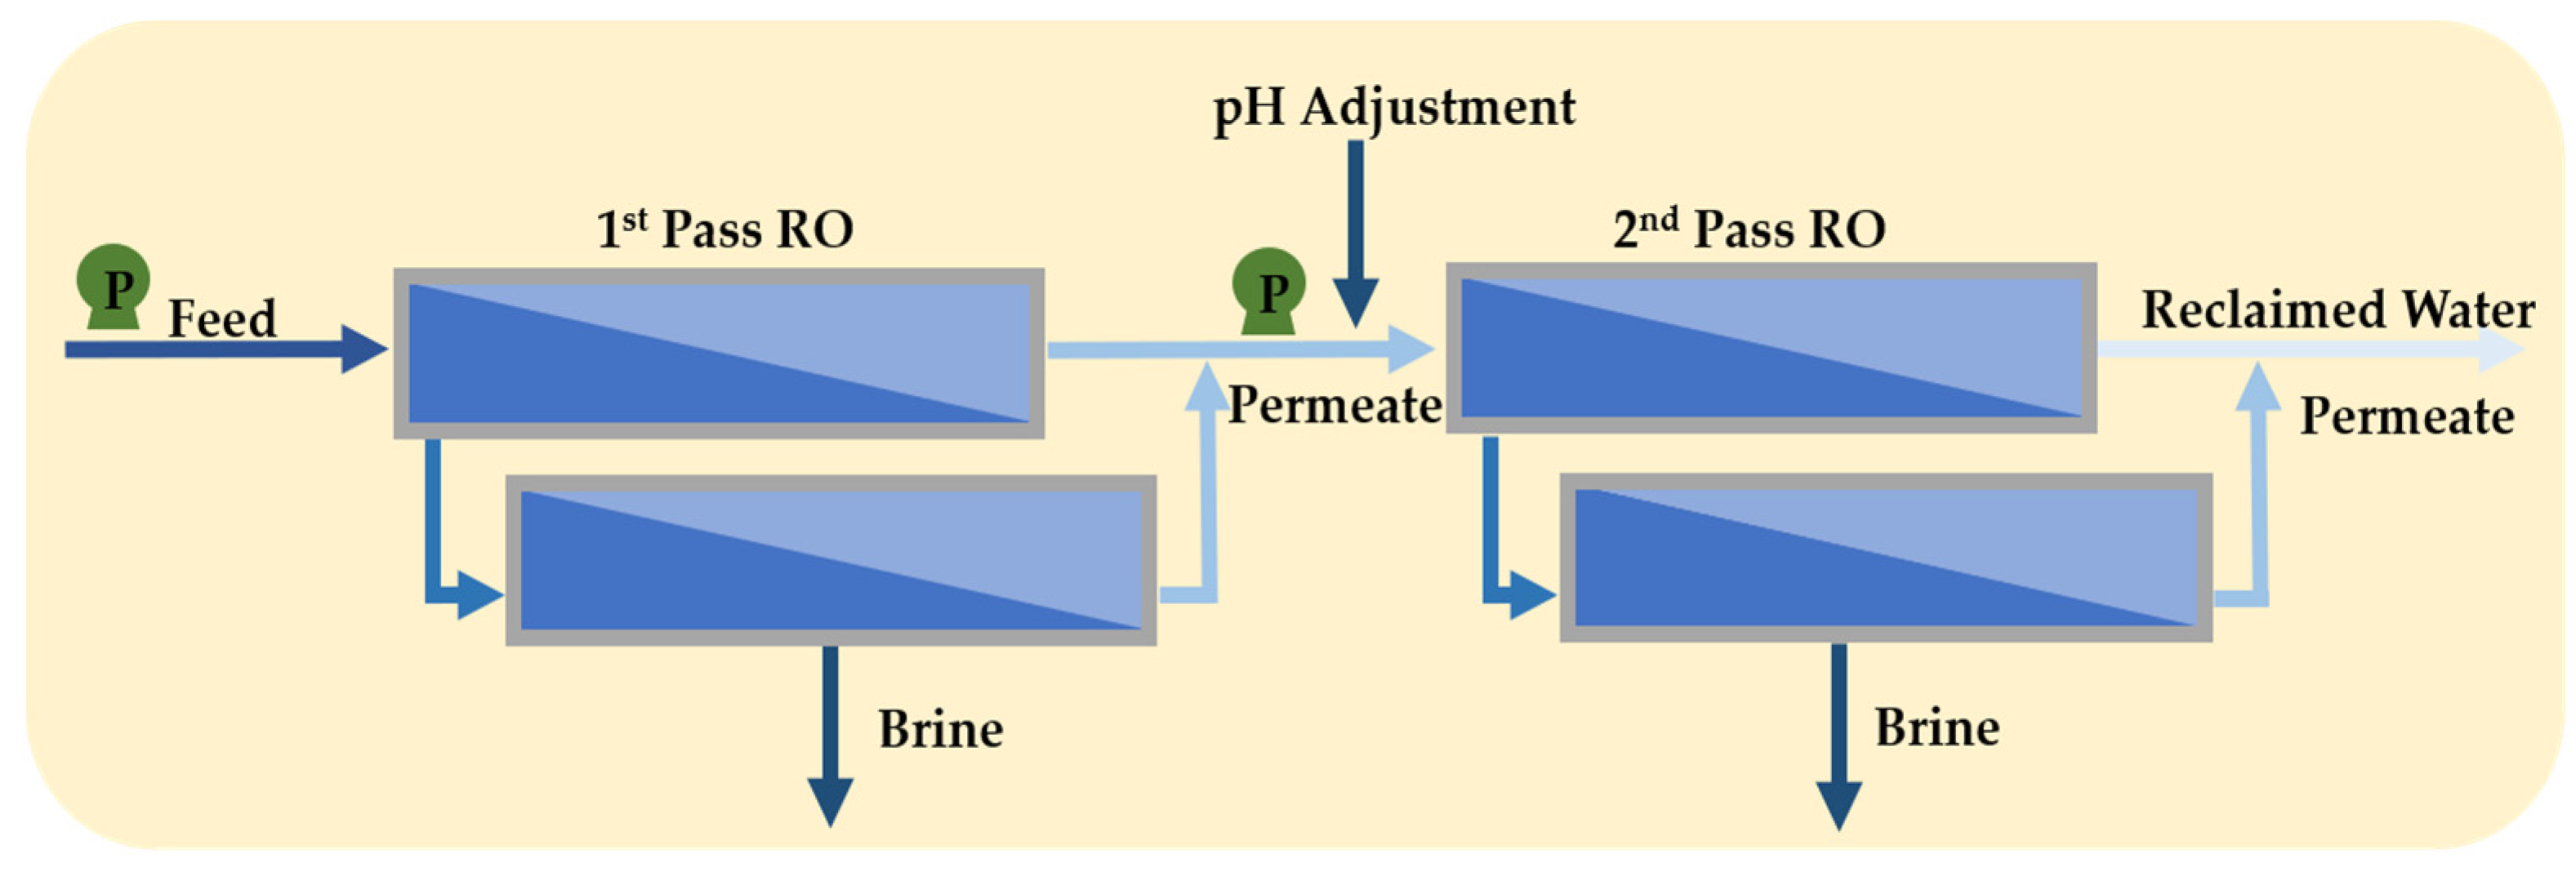
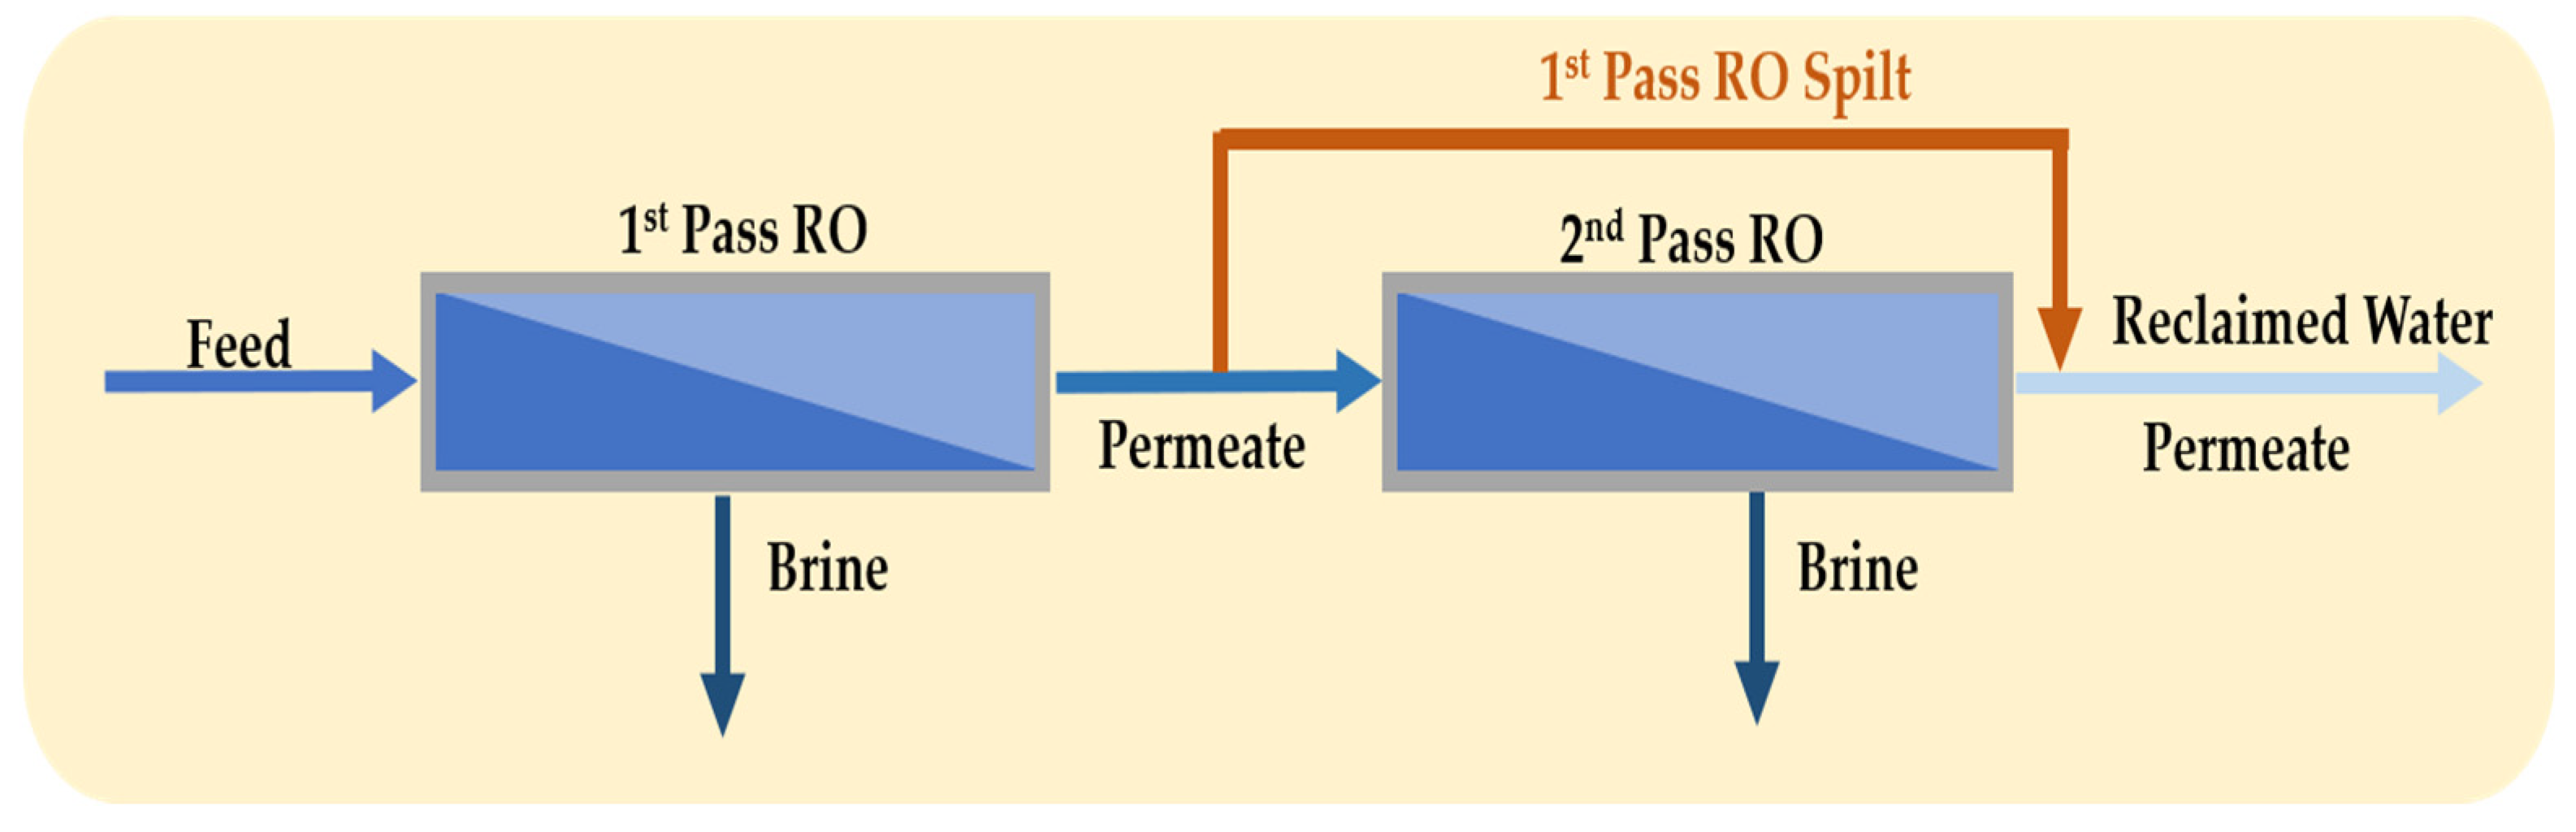
3.3. Full Second-Pass RO and Partial Second-Pass RO

Previous studies have indicated that SPSP offers substantial savings on both capital investment and operating cost. The concept of SPSP is to split permeate streams within the RO networks to maximize efficiency [72]. Compared with the conventional design, an SPSP system offers savings of 1.07–4.39% on the unit production cost and 1.15–4.30% on energy consumption [73].
Process optimization entails the manipulation of operating conditions [74]. Without exceeding operating limits, we managed to achieve a promising total water recovery of 64% at maximum boron rejection (over 80% removal). This was achieved by inputting EC measurements to our regression equation to predict boron concentrations, and a linear interpolation method was used to determine the split ratios. Table 6 provides statistics related to varying EC values (during January 2020 to March 2021 a total of 444 days). Table 7 presents the results. We manipulated the split ratios of feedwater with different EC measurements to obtain a boron concentration of less than 0.1 mg/L in the reclaimed water. Table 8 presents the results obtained during the sample period from 20 May to 26 May in 2020 with the interpolation method using split ratio values with different feed concentrations. The real-time monitoring system measured power consumption from 15 April to 14 May in 2020 (i.e., 30 days). The average of power consumption was 2.85 kW-h/m3. Compared to operation of the SPSP process from 20 May to 26 May in 2020, where the average of power consumption was 2.65 kW-h/m3, the energy consumption of the RO pumping system was reduced by 7.0% while removal rates were maintained at 84.06%. The resulting boron concentration was less than 0.046 mg/L. This indicates the successful elimination of boron to achieve the required quality and quantity of reclaimed water, meeting the requirements for semiconductor manufacturing. Furthermore, RO operation was enhanced and prolonged without deterioration in product quality or increases in energy or chemical consumption.

4. Discussion

In the collected samples, EC measurements varied from 3,000 to 8,580 μS/cm, with an average of 5,035 μS/cm, indicating seawater affected the WRRF influents and effluents. In regression analysis, R2 and adjusted R2 indicate the predictive power of the independent variable [75]. The correlation coefficients identified in this study were close to 1 (specifically, R = 0.946). Furthermore, the R² and adjusted R² was 0.895 and 0.889, which means that the proposed regression equation can explain 88.9% of the variance in boron concentrations. The equation indicated that boron concentration is directly related to the concentration of EC in the effluents, and seawater intrusion and interception sewage directly affects the quality of influents and effluents from coastal WRRFs. Semiconductor manufacturing must control boron concentrations at levels ranging from 0.05 ppb to 1 ppb in UPW systems. To achieve these requirements, there is a need for on-line boron measurements, since boron is a compound that must be determined a posteriori, creating difficulties for field applications. However, measuring EC in-situ is simple, rapid, and precise. EC measurement therefore offers a convenient, feasible, sustainable, and cheap substitute for boron estimation. The regression equation proposed in this study can be effectively used to provide an acceptable approximation of the boron concentration.
This study adjusted the pH level of the permeate to convert boron to an ionized form prior to a partial second pass. It has been shown that boron removal can be remarkably improved through the optimization of operating conditions. A previous study indicated that while maintaining a recovery rate of 50%, shifting the pH level from 10.0 to 10.5 achieves favorable results [33]. In the current study, the operation of plant B in continuous feed mode from 15 April to 29 April in 2020 (i.e., 15 days) at pH = 10.0 produced permeate that meets the standards required for semiconductor manufacturing. Figure 5 shows that boron values were constantly below 0.095 mg/L, RO removal rates were constantly above 62.24%, and the mean of boron rejection was more than 74.7%. Operation of the plant in continuous feed mode from 30 April to 14 May in 2020 (i.e., 15 days) at pH = 10.5 produced boron values constantly below 0.065 mg/L, RO removal rates constantly above 80.76%, and a mean of boron rejection of more than 85.4%. The recovery rates for both sets of samples were 50% and boron rejection from the membranes was more than 80.1% for all samples. The boron values remained below 0.1 mg/L throughout operation. These results indicate that WRRFs offer a water source of stable quality and quantity, which, under the proposed design and conditions, can be fruitfully applied for process water.
Membrane engineering offers an important route towards the reuse of industrial water. Our results further demonstrate that the configuration of the RO units has a significant effect on performance and efficiency. Although two-pass RO systems have previously been applied to boron removal from WRRF effluents, introduction of an SPSP design represents a novel contribution. During periods with lower feed conductivity, front permeate with low boron concentrations is sent directly to the final product vessel, while back permeate with higher boron concentrations is treated by the second pass. By selecting the right ratio between the front and back permeate, a final product of the required quality in terms of boron quality parameters can be obtained when they are mixed together. This is achieved while saving on energy consumption, thus minimizing the overall treatment cost and providing additional flexibility for plant operations. Overall, implementation of the proposed system achieves substantial savings on capital investment as well as operating cost. It must be noted that these results were achieved on a demonstration plant, and the effects for large-scale operation need to be confirmed. It is likely however that savings on a large-scale operation might be considerably increased, as pilot-scale plants consume between two and ten times more energy than a full-scale plant [76].
Semiconductor fabrication plants located in water-stressed regions must ensure a stable and solid water supply, especially during periods of drought. In one such region, the proposed pilot plant could be implemented by individual factories as well as on a larger governmental scale, and a plant that is estimated to be able to supply 37,500 CMD of reclaimed water is under construction. It is expected to be operational by the beginning of 2023. This plant will represent a key opportunity to implement the design and optimization of the operating parameters discussed in this study.

5. Conclusions

Based on EC measurements of effluent from plant A, the proposed regression equation was able to successfully predict the trend of boron concentration in. Apparent boron rejection rates of more than 74% and 85% were obtained for pH levels of 10.0 and 10.5, respectively. This indicates high removal efficiency and confirms the feasibility of using RO in the treatment of domestic wastewater to achieve ultra-pure water quality. The proposed SPSP approach proved both cost-effective and flexible. In addition to effectively lowering boron concentrations, the application of the SPSP design to the pilot plant reduced the energy consumption of the RO pumping systems by around 7.0%.
This study demonstrates that two-stage and two-pass split-partial permeate treatment combined with a high pH for boron removal offers a cost-effective sustainable freshwater supply option to alleviate water scarcity. Wastewater reclaimed through ‘fit-for-purpose’ treatment offers opportunities for application in the semiconductor industry. Since freshwater resources are assumed to be invariant, the reuse potential of WRRF effluents is likely to become increasingly competitive. Future research will include explorations of real productivity, total cost during long-term operations, and optimization of energy consumption.

Author Contributions

Conceptualization, methodology, investigation, data curation, writing—original draft preparation, visualization, S.-S.C.; software, writing—review and editing, supervision, J.-H.W.; validation, formal analysis, resources, S.-S.C. and J.-H.W. All authors have read and agreed to the published version of the manuscript.

Funding

This research received no external funding.

Institutional Review Board Statement

Not applicable.

Informed Consent Statement

Not applicable.

Data Availability Statement

Data are contained within the article.

Acknowledgments

This research was supported by the Water Resources Bureau of Tainan City Government through the Job number (no. wat103168, and wat108129), and sincerely grateful to anonymous reviewers for their suggestions to improve the quality of the manuscript.

Conflicts of Interest

The authors declare no conflict of interest.

References

  1. Gómez-Coma, L.; Ortiz-Martínez, V.M.; Fallanza, M.; Ortiz, A.; Ibañez, R.; Ortiz, I. Blue energy for sustainable water reclamation in WWTPs. J. Water Process Eng. 2020, 33, 101020. [Google Scholar] [CrossRef]
  2. Mancosu, N.; Snyder, R.L.; Kyriakakis, G.; Spano, D. Water Scarcity and Future Challenges for Food Production. Water 2015, 7, 975–992. [Google Scholar] [CrossRef]
  3. Balfaqih, H.; Al-Nory, M.T.; Nopiah, Z.M.; Saibani, N. Environmental and economic performance assessment of desalination supply chain. Desalination 2017, 406, 2–9. [Google Scholar] [CrossRef]
  4. Shannon, M.A.; Bohn, P.W.; Elimelech, M.; Georgiadis, J.G.; Mariñas, B.J.; Mayes, A.M. Science and technology for water purification in the coming decades. Nature 2008, 452, 301–310. [Google Scholar] [CrossRef]
  5. Hibbs, M.R.; McGrath, L.K.; Kang, S.; Adout, A.; Altman, S.J.; Elimelech, M.; Cornelius, C.J. Designing a biocidal reverse osmosis membrane coating: Synthesis and biofouling properties. Desalination 2016, 380, 52–59. [Google Scholar] [CrossRef] [Green Version]
  6. Zhang, R.; Liu, Y.; He, M.; Su, Y.; Zhao, X.; Elimelechc, M.; Jiang, Z. Antifouling membranes for sustainable water purification: Strategies and mechanisms. Chem. Soc. Rev. 2016, 45, 5888–5924. [Google Scholar] [CrossRef]
  7. UNESCO World Water Assessment Programme. 2017 UN World Water Development Report: Wastewater, the Untapped Resource; United Nations Educational, Scientific and Cultural Organization: Paris, France, 2017. [Google Scholar]
  8. Shoushtarian, F.; Negahban-Azar, M. Worldwide Regulations and Guidelines for Agricultural Water Reuse: A Critical Review. Water 2020, 12, 971. [Google Scholar] [CrossRef] [Green Version]
  9. Oertlé, E.; Hugi, C.; Wintgens, T.; Karavitis, C.A. Poseidon—Decision Support Tool for Water Reuse. Water 2019, 11, 153. [Google Scholar] [CrossRef] [Green Version]
  10. Cui, B.; Liang, S. Monitoring Opportunistic Pathogens in Domestic Wastewater from a Pilot-Scale Anaerobic Biofilm Reactor to Reuse in Agricultural Irrigation. Water 2019, 11, 1283. [Google Scholar] [CrossRef] [Green Version]
  11. Dingemans, M.M.L.; Smeets, P.W.M.H.; Medema, G.; Frijns, J.; Raat, K.J.; van Wezel, A.P.; Bartholomeus, R.P. Responsible Water Reuse Needs an Interdisciplinary Approach to Balance Risks and Benefits. Water 2020, 12, 1264. [Google Scholar] [CrossRef]
  12. Wintgens, T.; Melin, T.; Schäfer, A.; Khan, S.; Muston, M.; Bixio, D.; Thoeye, C. The role of membrane processes in municipal wastewater reclamation and reuse. Desalination 2005, 178, 1–11. [Google Scholar] [CrossRef]
  13. Garcia-Cuerva, L.; Berglund, E.Z.; Binder, A.R. Public perceptions of water shortages, conservation behaviors, and support for water reuse in the U.S. Resour. Conserv. Recycl. 2016, 113, 106–115. [Google Scholar] [CrossRef] [Green Version]
  14. TSIA. Review and Outlook of Taiwan’s Semiconductor Industry in the First Quarter of 2021; Taiwan Semiconductor Industry Association Newsletter: Hsinchu, Taiwan, 2021; pp. 32–33. [Google Scholar]
  15. Huang, H.; Liu, J.; Zhang, P.; Zhang, D.; Gao, F. Investigation on the simultaneous removal of fluoride, ammonia nitrogen and phosphate from semiconductor wastewater using chemical precipitation. Chem. Eng. J. 2017, 307, 696–706. [Google Scholar] [CrossRef]
  16. Sewage System Office Construction and Planning Agency Ministry of the Interior. Public Sewage Treatment Plant. Available online: https://www.cpami.gov.tw/home.html (accessed on 12 August 2021).
  17. Levine, A.; Asano, T. Recovering sustainable water from wastewater. Environ. Sci. Technol. 2004, 38, 201A–208A. [Google Scholar] [CrossRef] [PubMed] [Green Version]
  18. Keremane, G.B.; McKay, J. Successful wastewater reuse scheme and sustainable development: A case study in Adelaide. Water Environ. J. 2007, 21, 83–91. [Google Scholar] [CrossRef]
  19. Asano, T.; Levine, A.D. Wastewater reclamation, recycling and reuse: Past, present, and future. Water Sci. Technol. 1996, 33, 1–14. [Google Scholar] [CrossRef]
  20. Michetti, M.; Raggi, M.; Guerra, E.; Viaggi, D. Interpreting Farmers’ Perceptions of Risks and Benefits Concerning Wastewater Reuse for Irrigation: A Case Study in Emilia-Romagna (Italy). Water 2019, 11, 108. [Google Scholar] [CrossRef] [Green Version]
  21. Fighir, D.; Teodosiu, C.; Fiore, S. Environmental and Energy Assessment of Municipal Wastewater Treatment Plants in Italy and Romania: A Comparative Study. Water 2019, 11, 1611. [Google Scholar] [CrossRef] [Green Version]
  22. Ng, L.Y.; Mohammad, A.W.; Leo, C.P.; Hilal, N. Polymeric membranes incorporated with metal/metal oxide nanoparticles: A comprehensive review. Desalination 2013, 308, 15–33. [Google Scholar] [CrossRef]
  23. Lalia, B.S.; Kochkodan, V.; Hashaikeh, R.; Hilal, N. A review on membrane fabrication: Structure, properties and performance relationship. Desalination 2013, 326, 77–95. [Google Scholar] [CrossRef]
  24. Singh, R. Production of high-purity water by membrane processes. Desalin. Water Treat. 2009, 3, 99–110. [Google Scholar] [CrossRef] [Green Version]
  25. Cho, B.-Y.; Kim, H.-W.; Shin, Y.-S. A Study on boron removal for seawater desalination using the combination process of mineral cluster and RO membrane system. Environ. Eng. Res. 2015, 20, 285–289. [Google Scholar] [CrossRef] [Green Version]
  26. Koseoglu, H.; Kabay, N.; Yüksel, M.; Sarp, S.; Arar, Ö.; Kitis, M. Boron removal from seawater using high rejection SWRO membranes—Impact of pH, feed concentration, pressure, and cross-flow velocity. Desalination 2008, 227, 253–263. [Google Scholar] [CrossRef]
  27. Mendoza-Grimón, V.; Fernández-Vera, J.R.; Hernández-Moreno, J.M.; Palacios-Díaz, M.d.P. Sustainable Irrigation Using Non-Conventional Resources: What has Happened after 30 Years Regarding Boron Phytotoxicity? Water 2019, 11, 1952. [Google Scholar] [CrossRef] [Green Version]
  28. Sauer, R.; Gensbittel, D.; Bartz, R.; Rompf, F.; Ziemer-Popp, C.; Wilcox, D.; Malhotra, S. Boron removal experiences at AMD. Ultrapure Water. 2000, 17, 62–68. [Google Scholar]
  29. Redondo, J.; Busch, M.; De Witte, J.-P. Boron removal from seawater using FILMTECTM high rejection SWRO membranes. Desalination 2003, 156, 229–238. [Google Scholar] [CrossRef]
  30. Farhat, A.; Ahmad, F.; Hilal, N.; Arafat, H. Boron removal in new generation reverse osmosis (RO) membranes using two-pass RO without pH adjustment. Desalination 2013, 310, 50–59. [Google Scholar] [CrossRef]
  31. Freger, V.; Shemer, H.; Sagiv, A.; Semiat, R. Chapter 8—Boron Removal Using Membranes. In Boron Separation Processes; Kabay, N., Bryjak, M., Hilal, N., Eds.; Elsevier: Amsterdam, The Netherlands, 2015; pp. 199–217. [Google Scholar] [CrossRef]
  32. Najid, N.; Kouzbour, S.; Ruiz-García, A.; Fellaou, S.; Gourich, B.; Stiriba, Y. Comparison analysis of different technologies for the removal of boron from seawater: A review. J. Environ. Chem. Eng. 2021, 9, 105133. [Google Scholar] [CrossRef]
  33. Rybar, S.; Boda, R.; Bartels, C. Split partial second pass design for SWRO plants. Desalin. Water Treat. 2010, 13, 186–194. [Google Scholar] [CrossRef] [Green Version]
  34. Jiang, B.; Zhang, X.; Zhao, X.; Li, F. Removal of high level boron in aqueous solutions using continuous electrodeionization (CEDI). Sep. Purif. Technol. 2018, 192, 297–301. [Google Scholar] [CrossRef]
  35. Goncharuk, V.V.; Babak, Y.V.; Melńik, L.A.; Trachevskii, V.V. Removal of boron compounds in the course of pressure-driven demineralization. J. Water Chem. Technol. 2011, 33, 307–314. [Google Scholar] [CrossRef]
  36. Nadav, N. Boron removal from seawater reverse osmosis permeate utilizing selective ion exchange resin. Desalination 1999, 124, 131–135. [Google Scholar] [CrossRef]
  37. Chillón Arias, M.F.; Valero i Bru, L.; Prats Rico, D.; Varó Galvañ, P. Approximate cost of the elimination of boron in desalinated water by reverse osmosis and ion exchange resins. Desalination 2011, 273, 421–427. [Google Scholar] [CrossRef]
  38. Taniguchi, M.; Kurihara, M.; Kimura, S. Boron reduction performance of reverse osmosis seawater desalination process. J. Membr. Sci. 2001, 183, 259–267. [Google Scholar] [CrossRef]
  39. Hyung, H.; Kim, J.-H. A mechanistic study on boron rejection by sea water reverse osmosis membranes. J. Membr. Sci. 2006, 286, 269–278. [Google Scholar] [CrossRef]
  40. Sagiv, A.; Semiat, R. Analysis of parameters affecting boron permeation through reverse osmosis membranes. J. Membr. Sci. 2004, 243, 79–87. [Google Scholar] [CrossRef]
  41. Ruiz-García, A.; Nuez, I. Performance evaluation and boron rejection in a SWRO system under variable operating conditions. Comput. Chem. Eng. 2021, 153, 107441. [Google Scholar] [CrossRef]
  42. Wang, S.; Zhou, Y.; Gao, C. Novel high boron removal polyamide reverse osmosis membranes. J. Membr. Sci. 2018, 554, 244–252. [Google Scholar] [CrossRef]
  43. Ruiz-García, A.; León, F.A.; Ramos-Martín, A. Different boron rejection behavior in two RO membranes installed in the same full-scale SWRO desalination plant. Desalination 2019, 449, 131–138. [Google Scholar] [CrossRef]
  44. Ruiz-García, A.; Nuez, I.; Carrascosa-Chisvert, M.D.; Santana, J.J. Simulations of BWRO systems under different feedwater characteristics. Analysis of operation windows and optimal operating points. Desalination 2020, 491, 114582. [Google Scholar] [CrossRef]
  45. Joarder, M.A.M.; Raihan, F.; Alam, J.B.; Hasanuzzaman, S. Regression analysis of ground water quality data of Sunamganj district, Bangladesh. Int. J. Environ. Res. 2008, 2, 291–296. [Google Scholar]
  46. Li, Y.; Wang, S.; Gu, K.; Zhou, Y.; Gao, C. Progress in the development of boron removal by reverse osmosis membrane technology. Chem. Ind. Eng. Prog. 2020, 39, 596–604. [Google Scholar] [CrossRef]
  47. Mariñas, B.J. Reverse osmosis technology for wastewater reuse. Water Sci. Technol. 1991, 24, 215–227. [Google Scholar] [CrossRef]
  48. Kabay, N.; Bryjak, M.; Schlosser, S.; Kitis, M.; Avlonitis, S.; Matejka, Z.; Al-Mutaz, I.; Yuksel, M. Adsorption-membrane filtration (AMF) hybrid process for boron removal from seawater: An overview. Desalination 2008, 223, 38–48. [Google Scholar] [CrossRef]
  49. Asahi Kasei Corporation Products. Available online: https://www.asahi-kasei.com/services_products/search/ (accessed on 8 May 2021).
  50. Hydranautics—A Nitto Group Company. Available online: https://membranes.com/product-selection-tools/ (accessed on 8 May 2021).
  51. American Public Health Association. Standard Method for the Examination of Water and Wastewater, 20th ed.; American Water Works Association & Water Pollution Control Federation: Washington, DC, USA, 1998. [Google Scholar]
  52. Environmental Protection Administration. Environmental Analysis Laboratory. Available online: https://www.epa.gov.tw/niea/A048BA729D1F7D58 (accessed on 21 May 2021).
  53. Association, A.P.H. Standard Methods for the Examination of Water and Wastewater, 23rd ed.; American Water Works Association & Water Environment Federation: Washington, DC, USA, 2017. [Google Scholar]
  54. Hilal, N.; Kim, G.J.; Somerfield, C. Boron removal from saline water: A comprehensive review. Desalination 2011, 273, 23–35. [Google Scholar] [CrossRef]
  55. Bouguerra, W.; Mnif, A.; Hamrouni, B.; Dhahbi, M. Boron removal by adsorption onto activated alumina and by reverse osmosis. Desalination 2008, 223, 31–37. [Google Scholar] [CrossRef]
  56. Stillwell, A.S.; Webber, M.E. Predicting the Specific Energy Consumption of Reverse Osmosis Desalination. Water 2016, 8, 601. [Google Scholar] [CrossRef]
  57. Khlaif, O.A.; Abdulrazzaq, K.; Mohammed, A.H. Electrical Conductivity as a General Predictor of Multiple Parameters in Tigris River Based on Statistical Regression Model. J. Eng. 2021, 27, 73–82. [Google Scholar] [CrossRef]
  58. Alkhudhiri, A.; Bin Darwish, N.; Hakami, M.W.; Abdullah, A.; Alsadun, A.; Abu Homod, H. Boron Removal by Membrane Distillation: A Comparison Study. Membranes 2020, 10, 263. [Google Scholar] [CrossRef]
  59. Xu, J.; Gao, X.; Chen, G.; Zou, L.; Gao, C. High performance boron removal from seawater by two-pass SWRO system with different membranes. Water Supply 2010, 10, 327–336. [Google Scholar] [CrossRef]
  60. Lee, H.; Jin, Y.; Hong, S. Recent transitions in ultrapure water (UPW) technology: Rising role of reverse osmosis (RO). Desalination 2016, 399, 185–197. [Google Scholar] [CrossRef]
  61. Tu, K.L.; Nghiem, L.D.; Chivas, A.R. Boron removal by reverse osmosis membranes in seawater desalination applications. Sep. Purif. Technol. 2010, 75, 87–101. [Google Scholar] [CrossRef]
  62. Prats, D.; Chillon-Arias, M.F.; Rodriguez-Pastor, M. Analysis of the influence of pH and pressure on the elimination of boron in reverse osmosis. Desalination 2000, 128, 269–273. [Google Scholar] [CrossRef]
  63. Hem, J.D. Study and Interpretation the Chemical of Natural of Characteristics Natural Water, 3rd ed.; USGS: Washington, DC, USA, 1985. [Google Scholar]
  64. Busch, M.; Mickols, W.E. Reducing energy consumption in seawater desalination. Desalination 2004, 165, 299–312. [Google Scholar] [CrossRef]
  65. Bick, A.; Oron, G. Post-treatment design of seawater reverse osmosis plants: Boron removal technology selection for potable water production and environmental control. Desalination 2005, 178, 233–246. [Google Scholar] [CrossRef]
  66. Cengeloglu, Y.; Arslan, G.; Tor, A.; Kocak, I.; Dursun, N. Removal of boron from water by using reverse osmosis. Sep. Purif. Technol. 2008, 64, 141–146. [Google Scholar] [CrossRef]
  67. Kumar, S.; Baskaran, R. Integrated Membrane Operations for Providing Clean Water for Human Needs and Sustainable Industrial Growth. J. Xi’an Univ. Archit. Technol. 2020, XII, 5411. [Google Scholar]
  68. Urgun-Demirtas, M.; Benda, P.L.; Gillenwater, P.S.; Negri, M.C.; Xiong, H.; Snyder, S.W. Achieving very low mercury levels in refinery wastewater by membrane filtration. J. Hazard. Mater. 2012, 215–216, 98–107. [Google Scholar] [CrossRef]
  69. Doederer, K.; Farré, M.J.; Pidou, M.; Weinberg, H.S.; Gernjak, W. Rejection of disinfection by-products by RO and NF membranes: Influence of solute properties and operational parameters. J. Membr. Sci. 2014, 467, 195–205. [Google Scholar] [CrossRef] [Green Version]
  70. Singapore’s National Water Agency. NEWater Technology. Available online: https://www.pub.gov.sg/ (accessed on 17 August 2021).
  71. Saidan, M.N.; Al-Addous, M.; Al-Weshah, R.A.; Obada, I.; Alkasrawi, M.; Barbana, N. Wastewater Reclamation in Major Jordanian Industries: A Viable Component of a Circular Economy. Water 2020, 12, 1276. [Google Scholar] [CrossRef]
  72. Saif, Y.; Almansoori, A.; Elkamel, A. Optimal design of split partial second pass reverse osmosis network for desalination applications. AIChE J. 2014, 60, 520–532. [Google Scholar] [CrossRef]
  73. Du, Y.; Xie, L.; Liu, Y.; Zhang, S.; Xu, Y. Optimization of reverse osmosis networks with split partial second pass design. Desalination 2015, 365, 365–380. [Google Scholar] [CrossRef]
  74. Bailey, J.R.; Ahmad, S.; Batista, J.R. The Impact of Advanced Treatment Technologies on the Energy Use in Satellite Water Reuse Plants. Water 2020, 12, 366. [Google Scholar] [CrossRef] [Green Version]
  75. Pindyck, R.S.; Rubinfeld, D.L. Econometric Models and Economic Forecasts, 4th ed.; Irwin/McGraw-Hill: Boston, MA, USA, 1997; p. 634. [Google Scholar]
  76. Lesjean, B.; Leiknes, T.O. Final MBR-Network Workshop “Salient Outcomes of the European R&D Projects on MBR Technology. 31 March–1 April 2009, Berlin (Germany). Book of Proceedings; Kompetenzzentrum Wasser Berlin gGmbH: Berlin, Germany, 2009; p. 189. [Google Scholar]
Figure 1. Aerial view of plant B, including raw feedwater storage tank, pre-treatment systems, UF units, RO units, chemical dosing system, and permeate storage tank.
Water 14 00362 g001
Figure 2. Schematic diagram of plant B (two-stage/two-pass RO pilot plant).
Water 14 00362 g002
Figure 3. Schematic diagram of SPSP system.
Water 14 00362 g003
Figure 4. Distribution of boron concentrations and EC measurements in effluent samples from plant A.
Water 14 00362 g004
Figure 5. Linear regression of correlation between conductivity and boron in effluents.
Water 14 00362 g005
Figure 6. Results of boron removal in plant B with pH adjustment.
Water 14 00362 g006
Figure 7. Removal of other contaminants from plant B.
Water 14 00362 g007
Table 1. Specifications of UF and RO membranes based on product data sheets (PDSs).
ParameterAsahi Kasei, MICROZA UNA-620 A
(UF Membrane)
ParameterHydranautics Nitto CPA5-LD
(RO Membrane)
Maximum Operating Temperature40 °CMaximum Operating Temperature45 °C
Maximum Inlet Pressure45 psiMaximum Chlorine Concentration<0.1 ppm
pH Range for Cleaning0.0–14.0Maximum Feedwater Turbidity1.0 NTU
Membrane Area50.0 m2Maximum Feedwater SDI (15 min)5.0
Module Length2418 mmMaximum Feed Flow19.3 m3/h
Module Weight Water Filled60 kgMinimum Brine Flow2.7 m3/h
Module Diameter165 mmMaximum Pressure Drop for Each Element15 psi
Table 2. Corresponding boron concentrations and EC measurements in effluent samples from plant A.
DataElectrical ConductivityBoronDataElectrical ConductivityBoron
μs/cmmg/Lμs/cmmg/L
20-August-201582800.5625-January-201640100.374
8-September-201578500.5028-January-201650500.405
24-September-201574500.49321-January-201653400.374
8-October-201585800.57517-February-201662900.475
29-October-201539800.3153-March-201656700.433
11-November-201541100.36417-March-201631000.273
27-November-201537700.31130-March-201630000.296
3-December-201531500.29814-April-201639000.398
16-December-201541700.31618-May-201635500.265
23-December-201542200.2948-June-201646000.376
29-December-201540100.3786-July-201666800.457
Table 3. Summary of regression analysis results.
Model Summary
ModelRR2Adjusted R2Standard Error of the Estimate
10.946 10.8950.8890.030384
ANOVA 2
ModelSum of SquaresDfMean SquareFSig.
Regression0.15710.157170.0180.000 1
Residual0.018200.001
Total0.17521
Coefficients 2
ModelUnstandardized CoefficientsStandardized Coefficients
BStandard ErrorBetatsignificance probability
(Constant)0.1380.020 6.8410.000
Conductivity4.959 × 10−50.0000.94613.0390.000
1 Predictors: (constant), conductivity. 2 Dependent variable: boron.
Table 4. Boron removal with pH adjustment (adjustment 1st pass RO permeate pH = 10.0).
DateFeed1st Pass RO Permeate2nd Pass RO Permeate1st Pass RO Removal2nd Pass RO RemovalRO System Removal
mg/Lmg/Lmg/L%%%
15-April-20200.2890.2090.07927.6862.2072.66
16-April-20200.2850.2010.08629.4757.2169.82
17-April-20200.2410.1870.09122.4151.3462.24
18-April-20200.3050.2340.09423.2859.8369.18
19-April-20200.2940.1850.09037.0751.3569.39
20-April-20200.3130.2020.09435.4653.4769.97
21-April-20200.3040.2170.07928.6263.5974.01
22-April-20200.3010.2020.09532.8952.9768.44
23-April-20200.3350.2070.05138.2175.3684.78
24-April-20200.4380.2990.07731.7474.2582.42
25-April-20200.3170.2170.06431.5570.5179.81
26-April-20200.2860.2090.05626.9273.2180.42
27-April-20200.2840.2210.06122.1872.4078.52
28-April-20200.2850.2130.05925.2672.3079.30
29-April-20200.3960.2550.07735.6169.8080.56
Table 5. Boron removal with pH adjustment (adjustment 1st pass RO permeate pH = 10.5).
DateFeed1st Pass RO Permeate2nd Pass RO Permeate1st Pass RO Removal2nd Pass RO RemovalRO System Removal
mg/Lmg/Lmg/L%%%
30-April-20200.2940.2150.03726.8782.7987.41
1-May-20200.2970.2220.03325.2585.1488.89
2-May-20200.2860.2160.02524.4888.4391.26
3-May-20200.2790.1850.03833.6979.4686.38
4-May-20200.3040.1990.04034.5479.9086.84
5-May-20200.3930.2540.05135.3779.9287.02
6-May-20200.3110.2060.04533.7678.1685.53
7-May-20200.3170.1990.06137.2269.3580.76
8-May-20200.3040.2250.04925.9978.2283.88
9-May-20200.3220.2390.06125.7874.4881.06
10-May-20200.3530.2170.05838.5373.2783.57
11-May-20200.3970.2590.06534.7674.9083.63
12-May-20200.2940.1990.03932.3180.4086.73
13-May-20200.2730.2060.04224.5479.6184.62
14-May-20200.2960.1980.05033.1174.7583.11
Table 6. EC measurements and boron concentrations in raw wastewater from plant A with 444 samples.
Electrical ConductivityBoron 1Days of OccurrenceProbability
μs/cmmg/LDay%
≤2000≤0.233112.48
2000 < EC ≤ 40000.233 < EC ≤ 0.33333074.32
4000 < EC ≤ 60000.333 < EC ≤ 0.4338018.02
≥6000≥0.433235.18
1 Estimated value.
Table 7. Results of varying split ratios with varying EC values according to regression equations.
Electrical ConductivityBoron 1SPSP Operation
μs/cmmg/L%
≤1000≤0.18870 Split, 30 2nd Pass RO
1000 < EC ≤ 20000.188 < EC ≤ 0.23740 Split, 60 2nd Pass RO
2000 < EC ≤ 30000.237 < EC ≤ 0.28725 Split, 75 2nd Pass RO
3000 < EC ≤ 40000.287 < EC ≤ 0.33615 Split, 85 2nd Pass RO
4000 < EC ≤ 60000.336 < EC ≤ 0.43610 Split, 90 2nd Pass RO
6000 < EC ≤ 80000.436 < EC ≤ 0.5354 Split, 96 2nd Pass RO
≥8000≥0.5350 Split, 100 2nd Pass RO
1 Estimated value.
Table 8. Results of boron concentration in reclaimed water with varying split ratios.
DateFeedBoron Concentration in Reclaimed Water 1SPSP OperationBoron Concentration in Reclaimed WaterBoron Removal
mg/Lmg/L%mg/L%
20-May-202019900.23725 Split, 75 2nd Pass RO0.05278.03
21-May-202026900.27125 Split, 75 2nd Pass RO0.04085.26
22-May-202025600.26525 Split, 75 2nd Pass RO0.04483.39
23-May-202039000.33115 Split, 85 2nd Pass RO0.03988.23
24-May-202034300.30815 Split, 85 2nd Pass RO0.05183.45
25-May-202035800.31615 Split, 85 2nd Pass RO0.05881.62
26-May-202045600.36410 Split, 90 2nd Pass RO0.04288.47
1 Estimated value.
Publisher’s Note: MDPI stays neutral with regard to jurisdictional claims in published maps and institutional affiliations.

