
Developing Flood Vulnerability Functions through Questionnaire Survey for Flood Risk Assessments in the Meghna Basin, Bangladesh


Abstract
:1. Introduction
2. Study Area
3. Methods
3.1. Outline of the Questionnaire Survey
3.1.1. Boro Rice Damage Survey
3.1.2. Household Damage Survey
3.2. Development of Flood Damage Functions
4. Results and Discussions
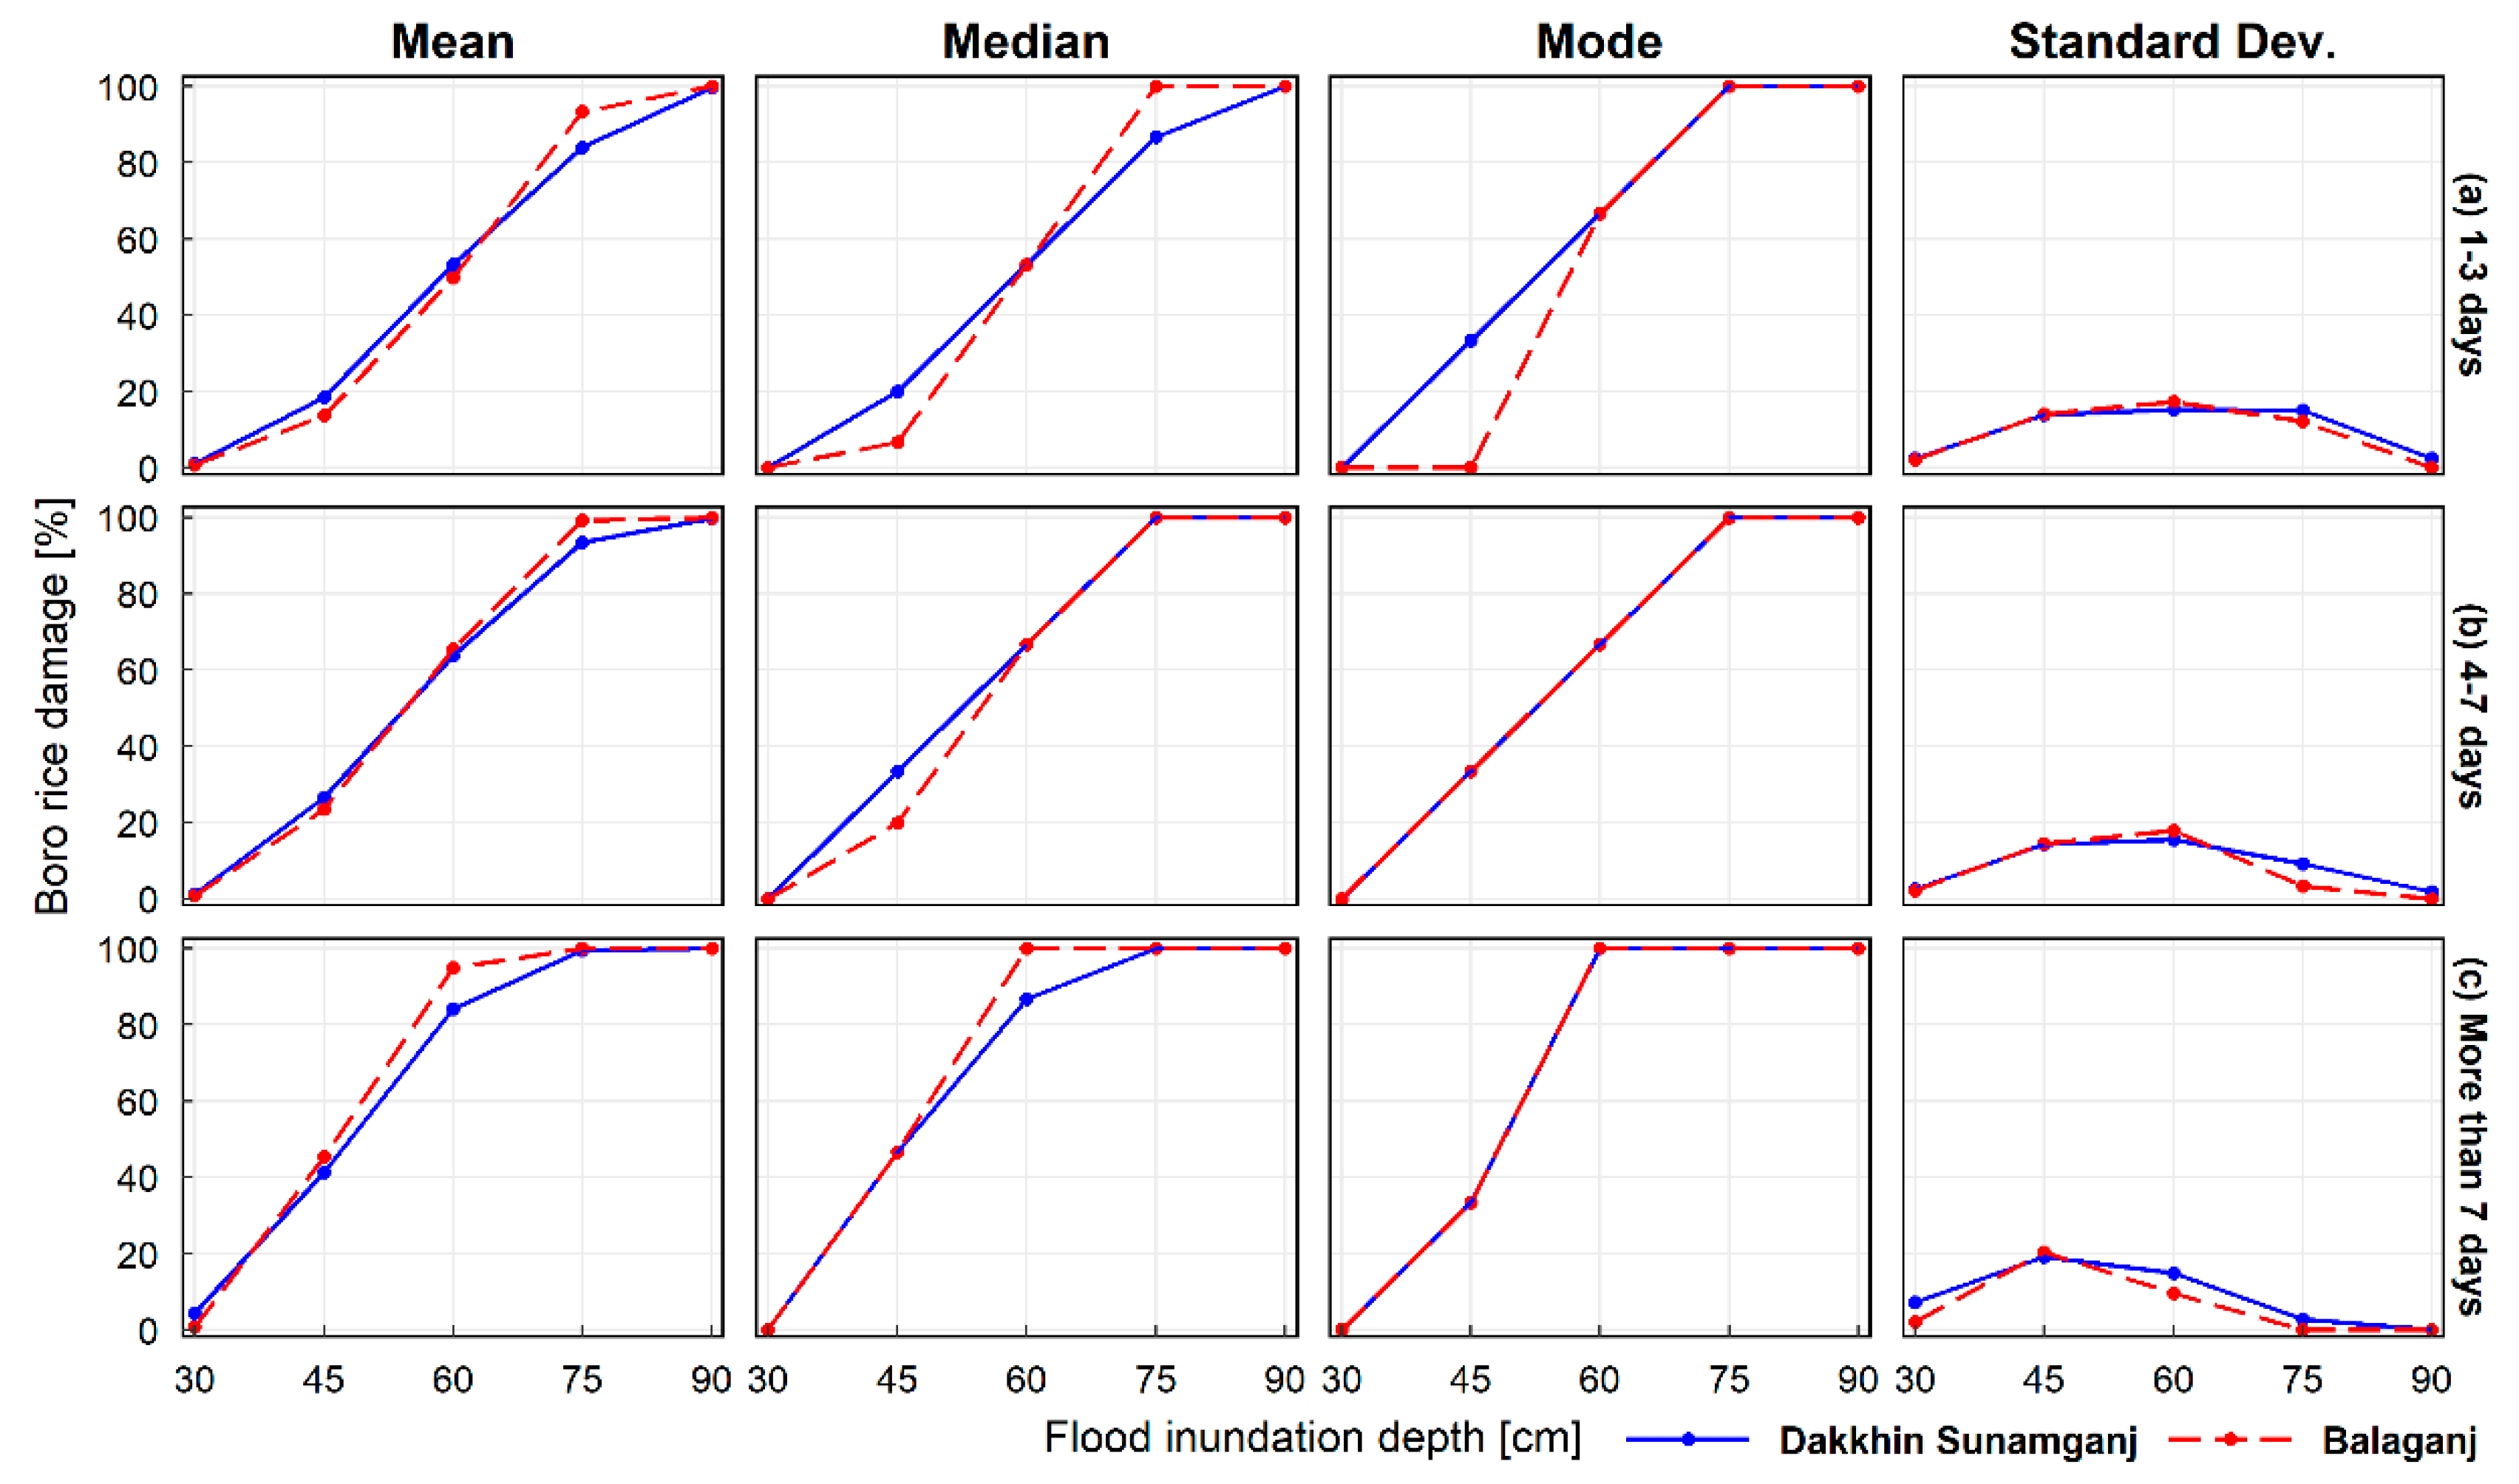
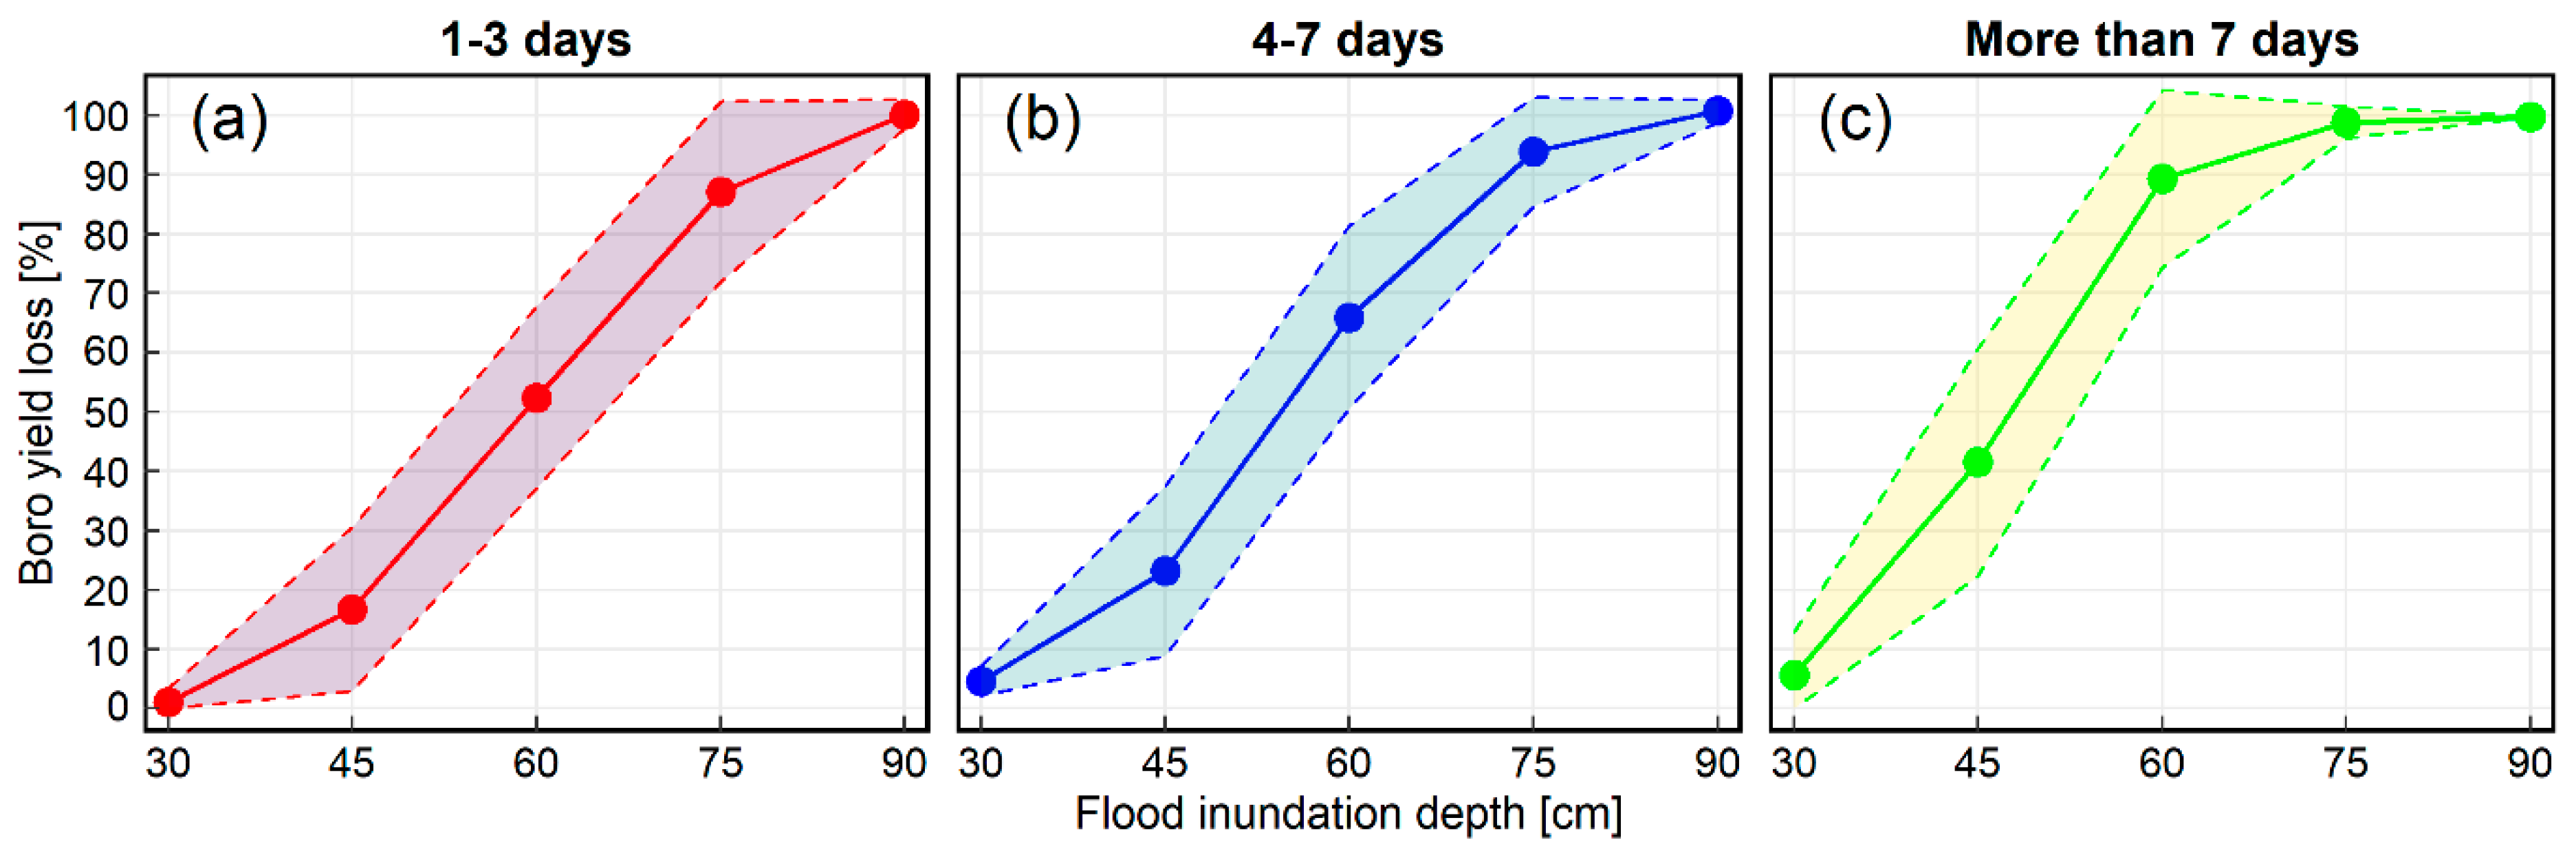
4.1. Development of Agricultural Damage Curves
4.2. Development of Household Damage Curves
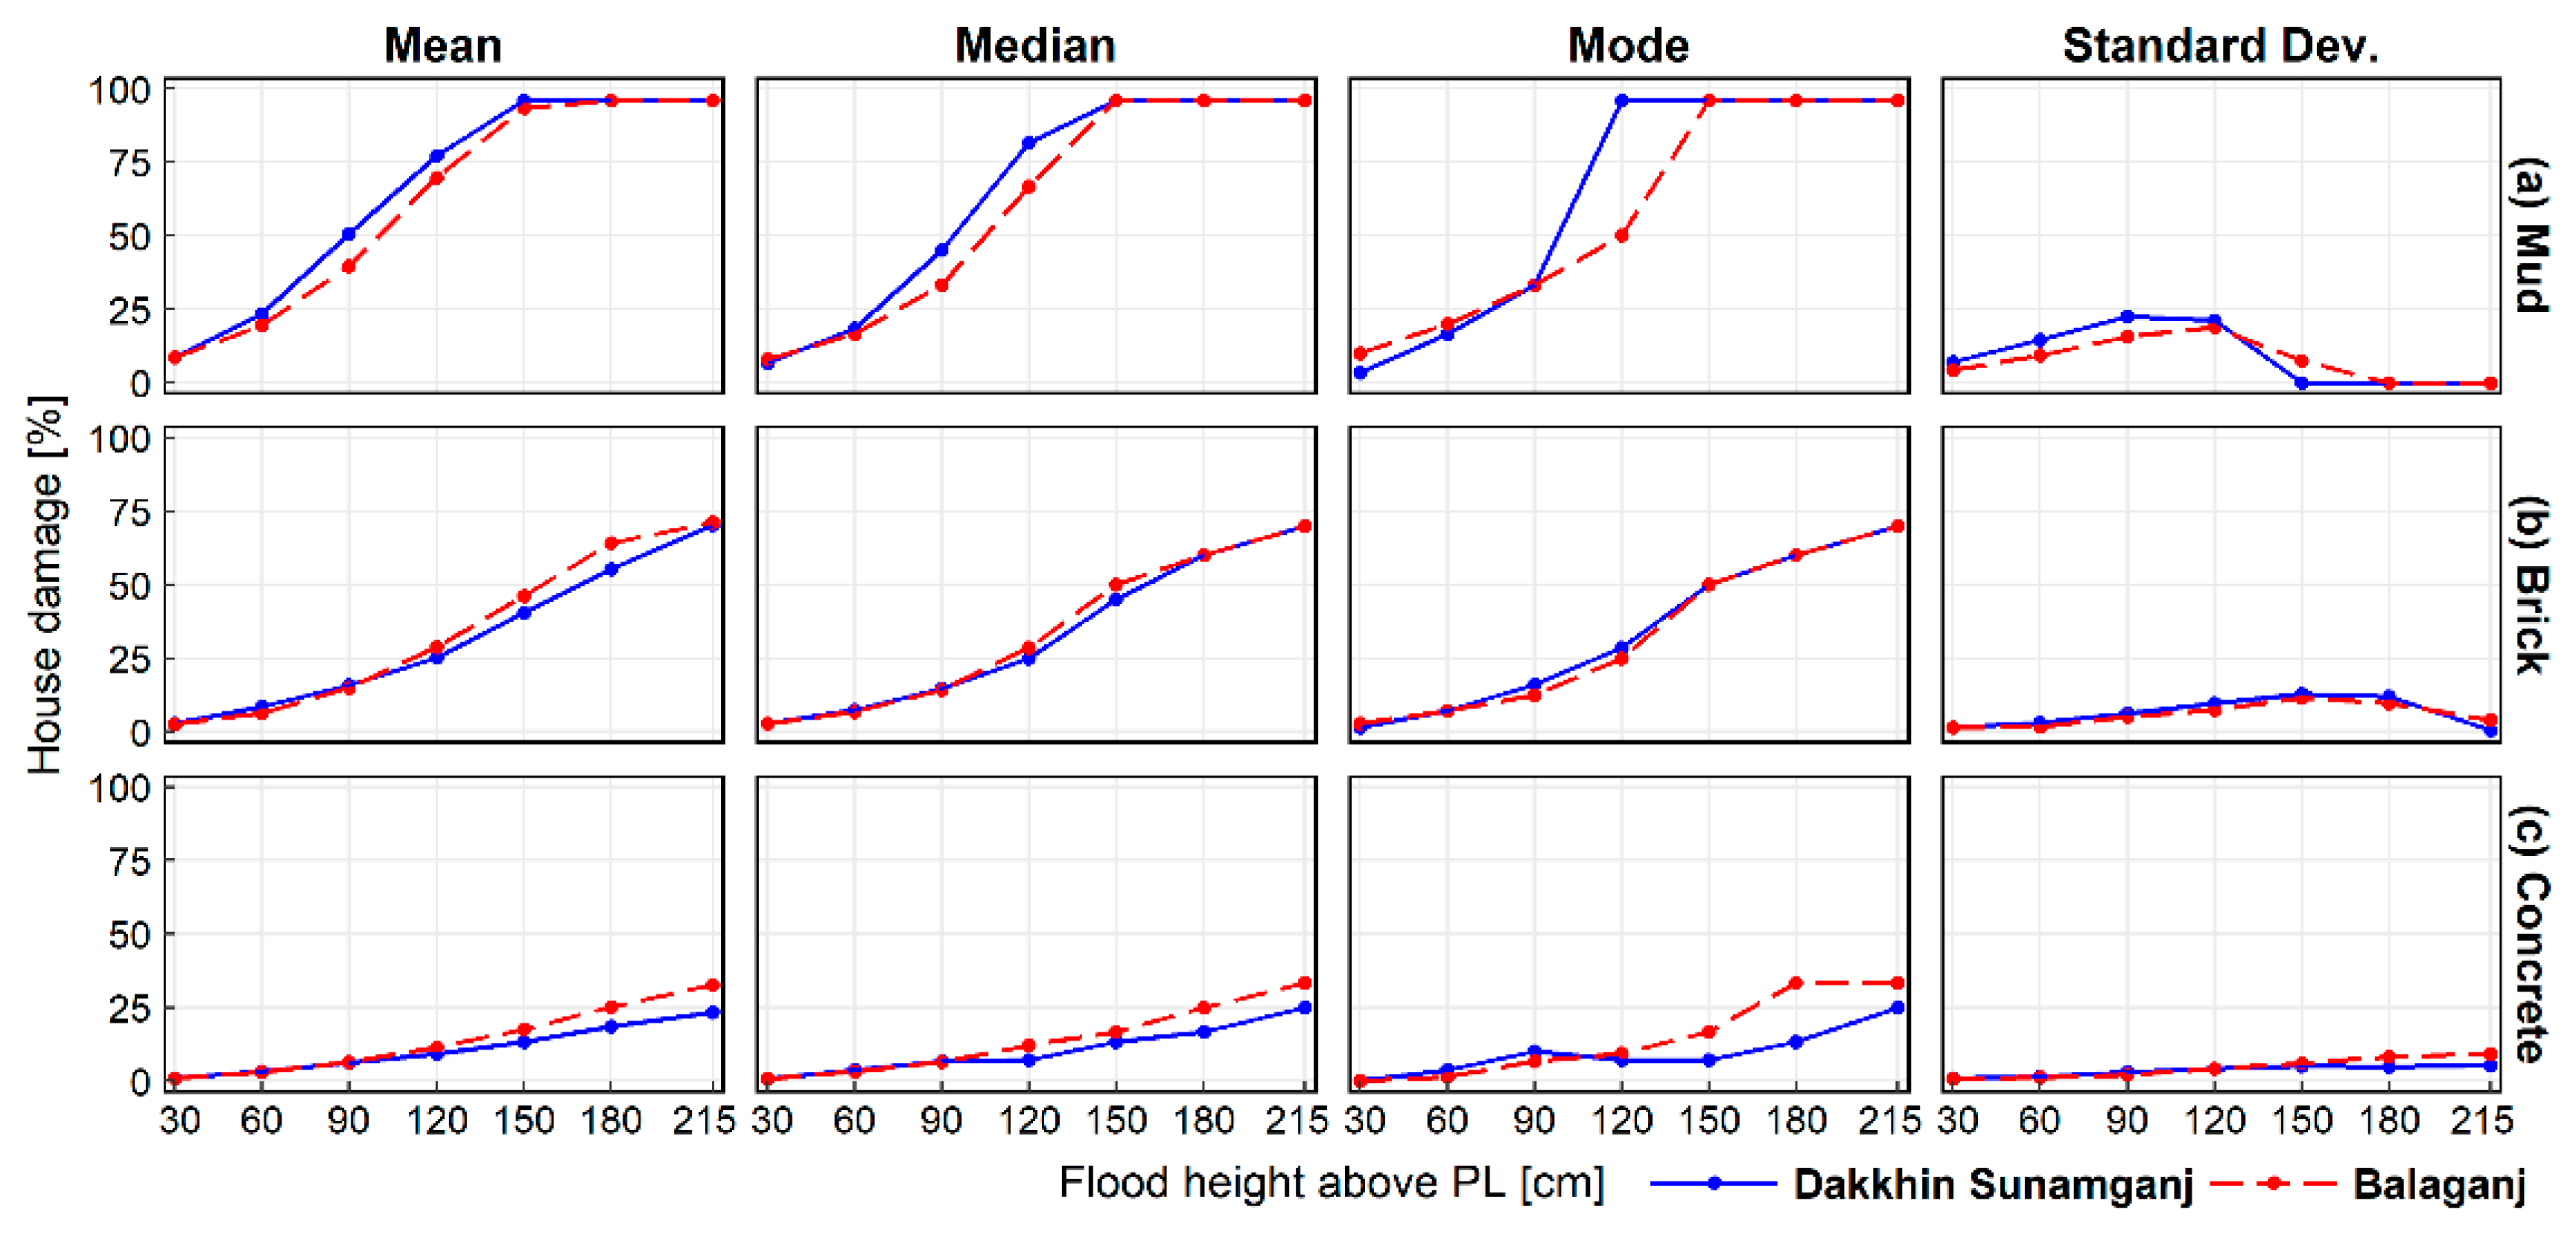
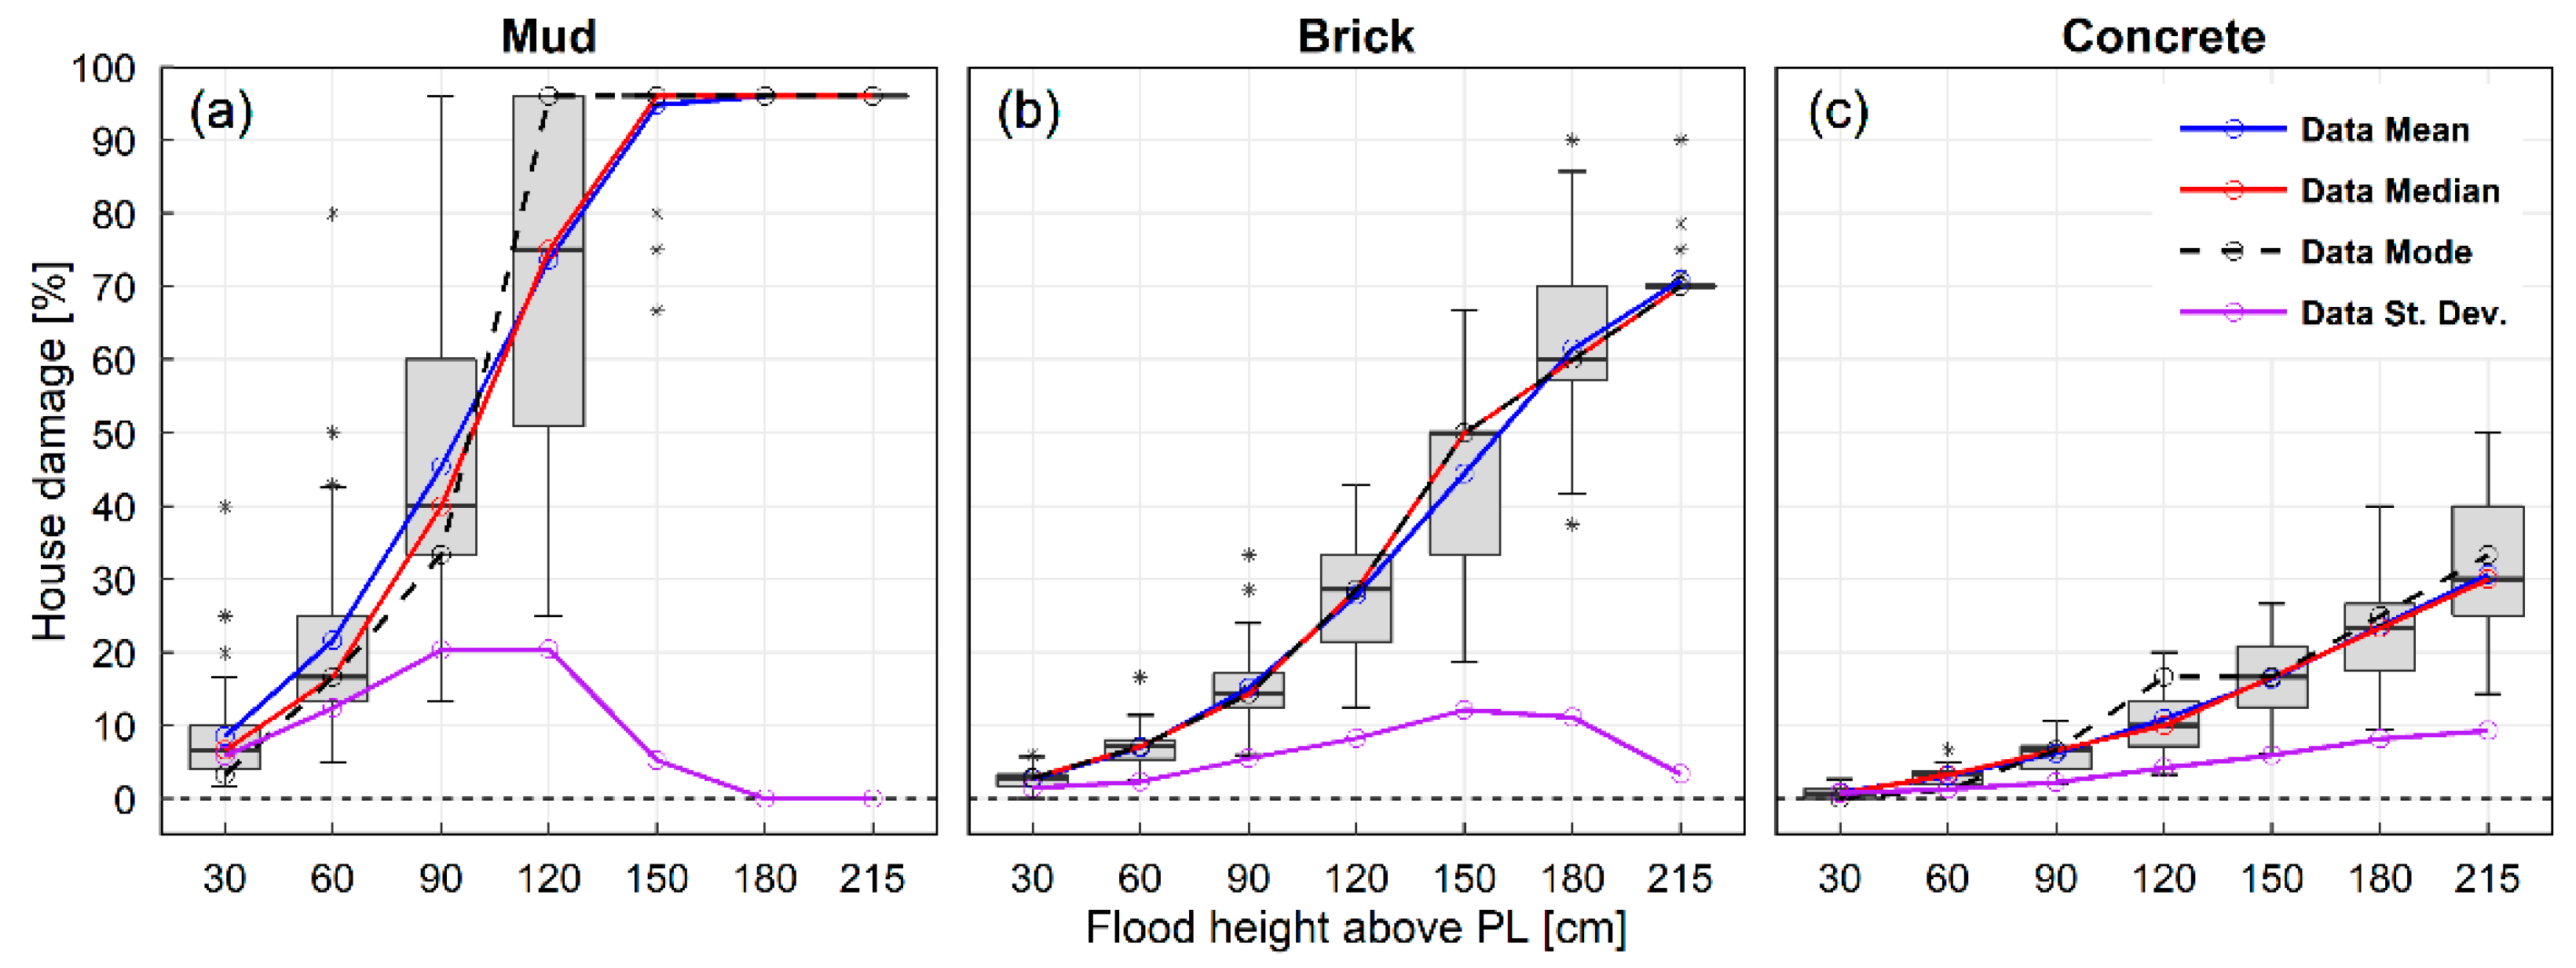
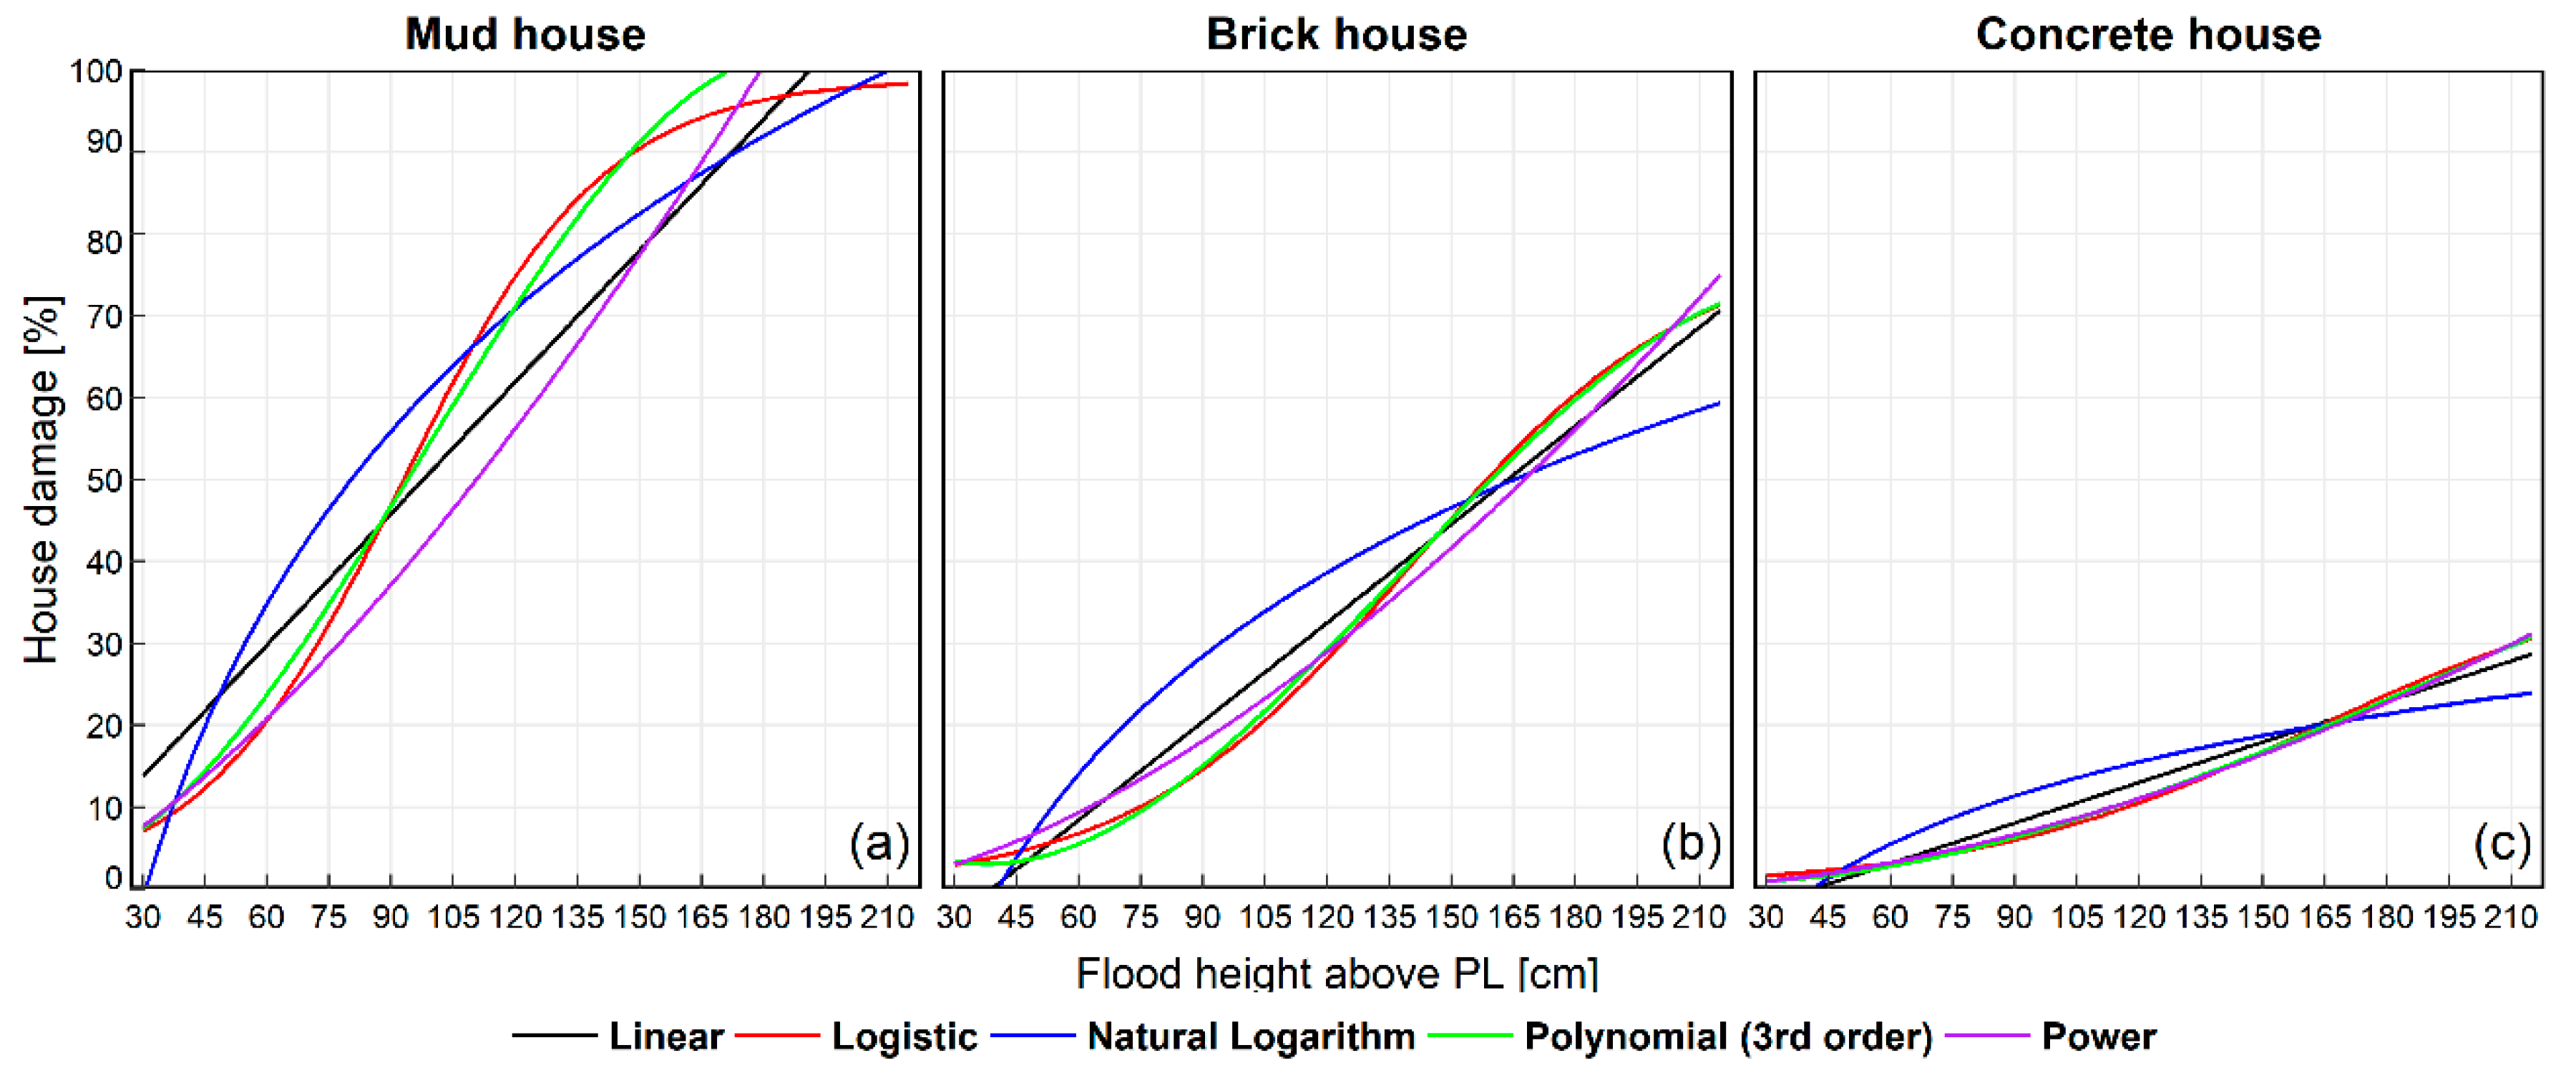
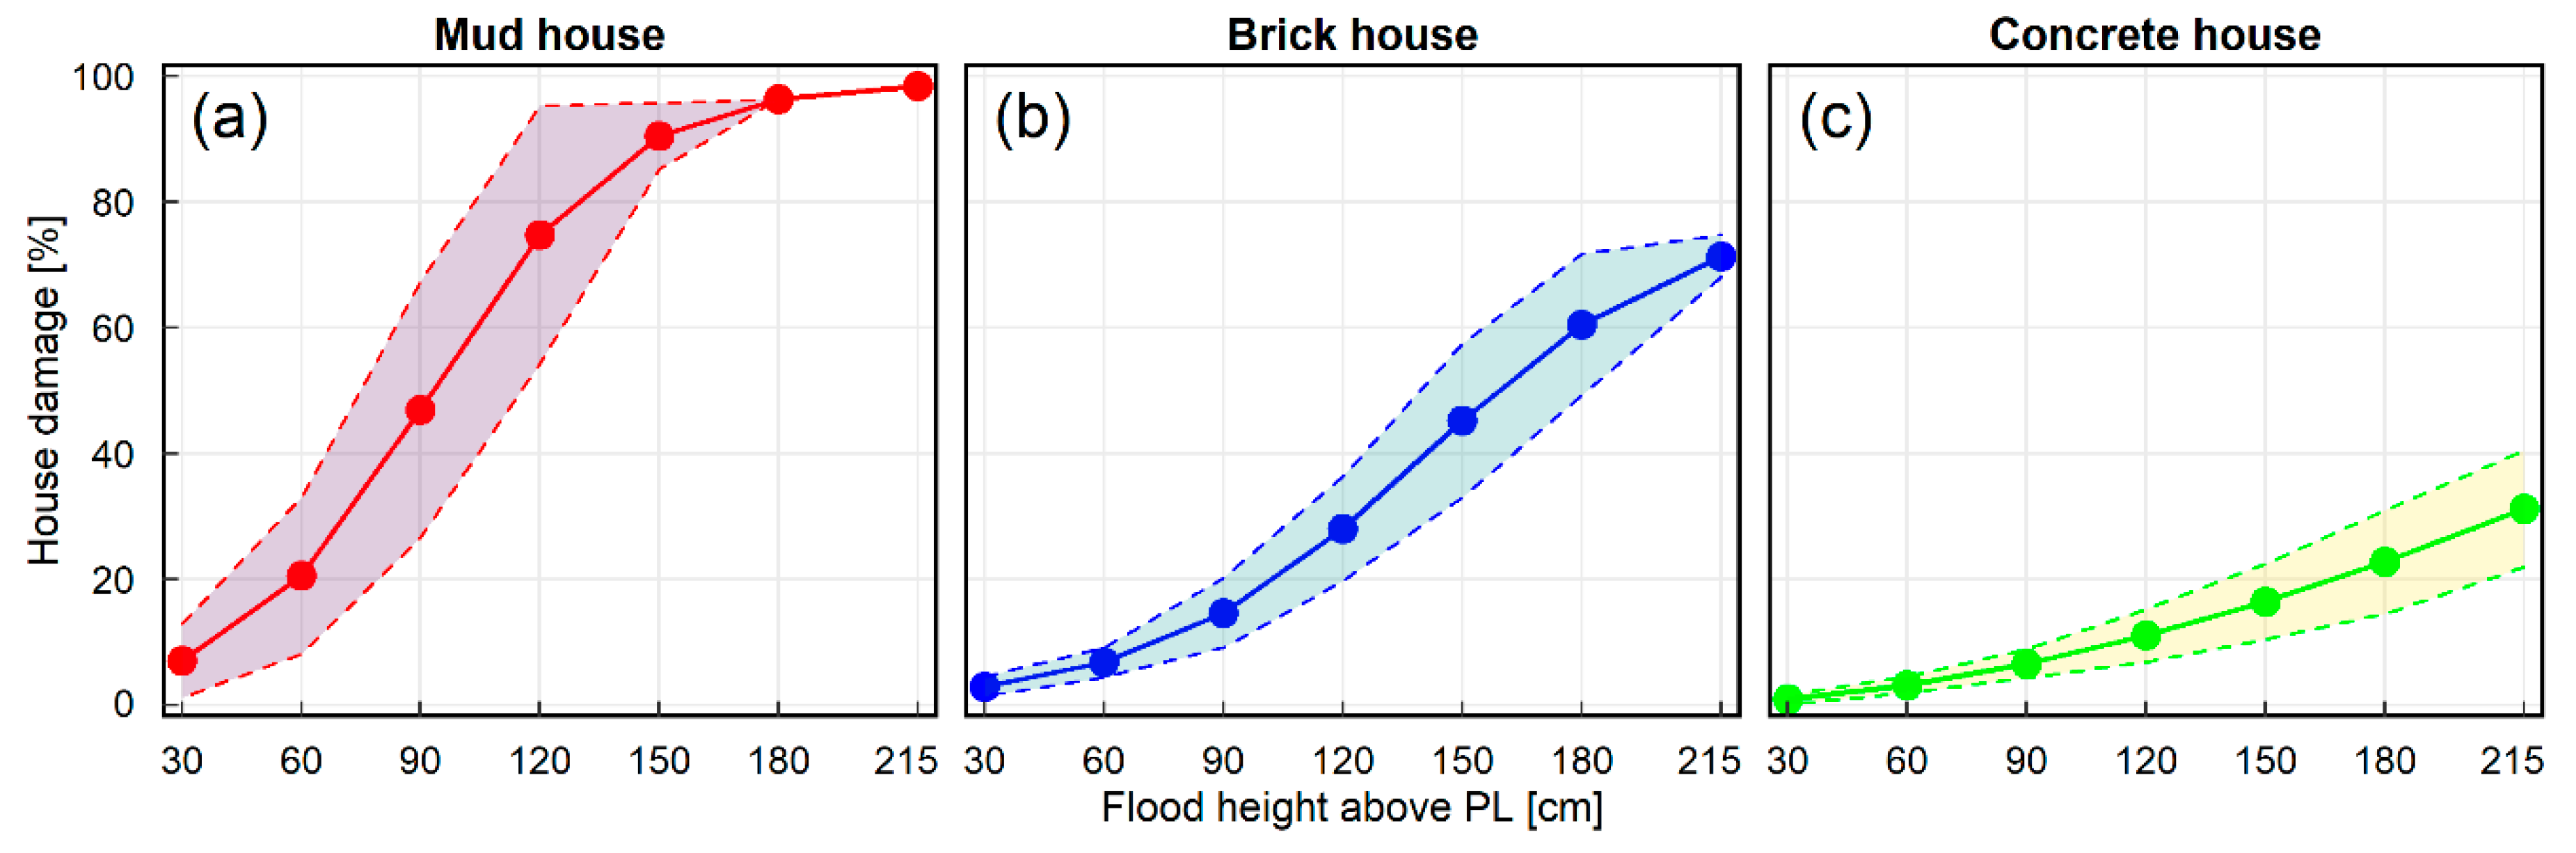
4.2.1. House Building Damage Curves
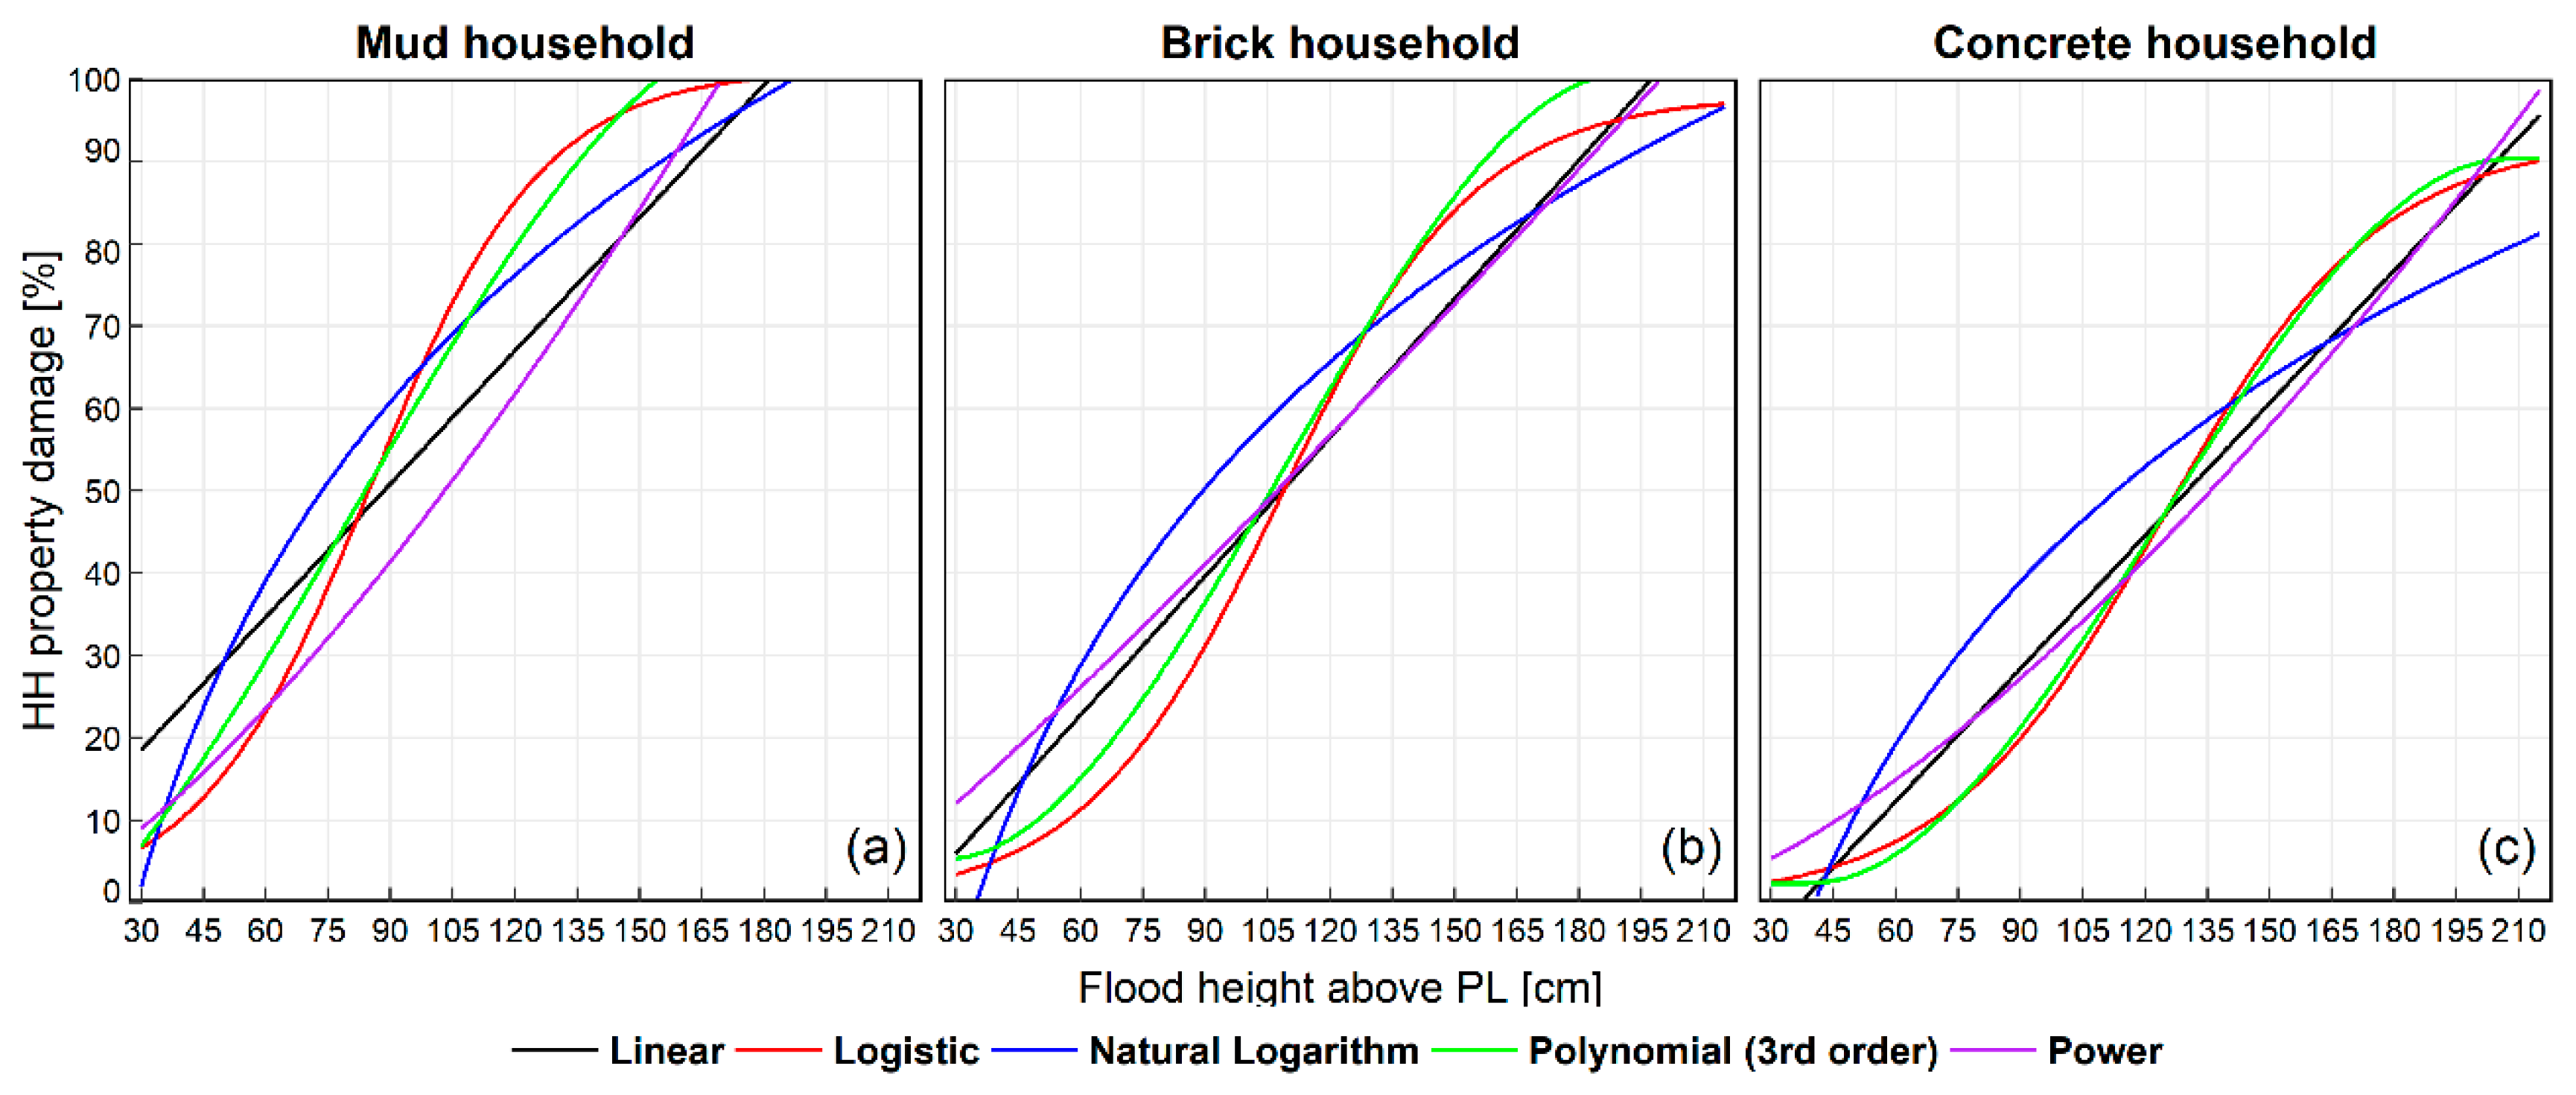
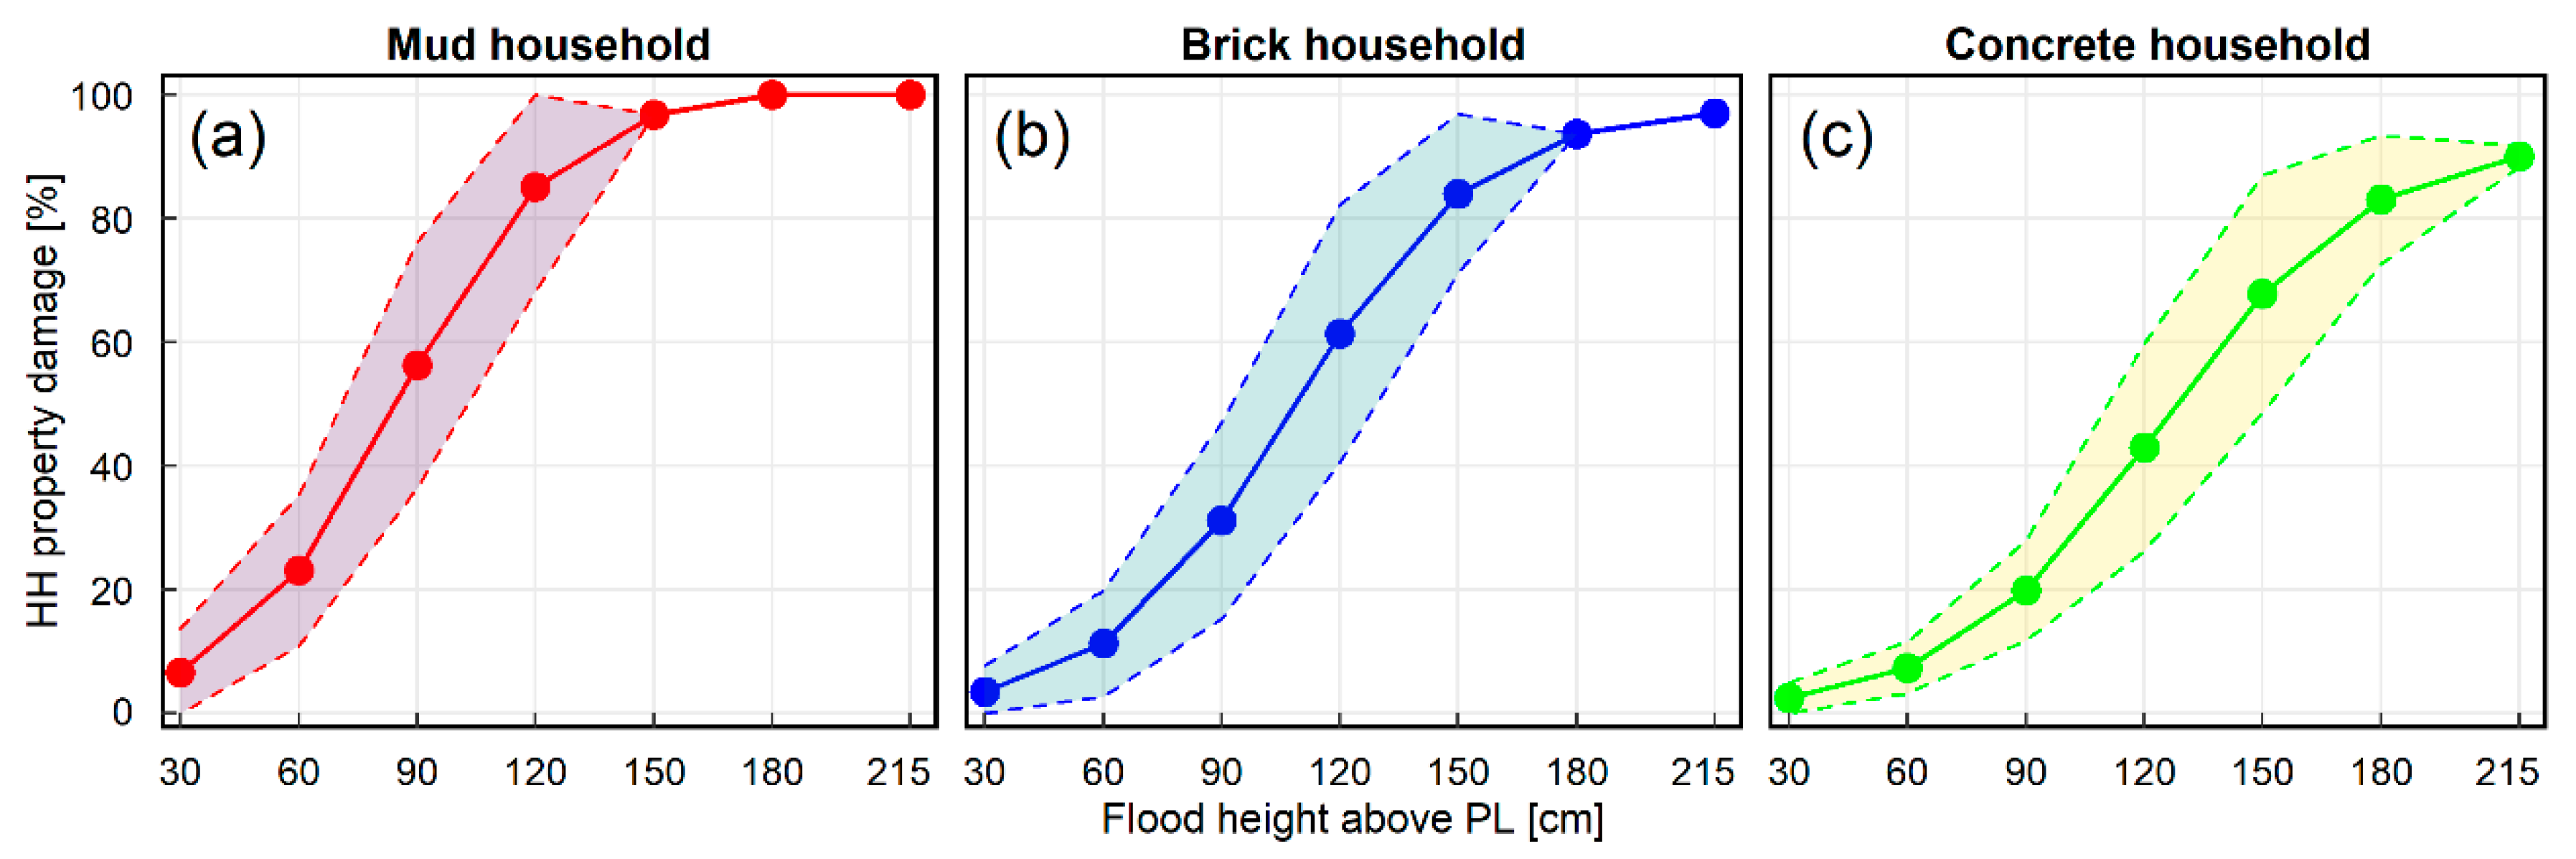
4.2.2. Household Property Damage Curves
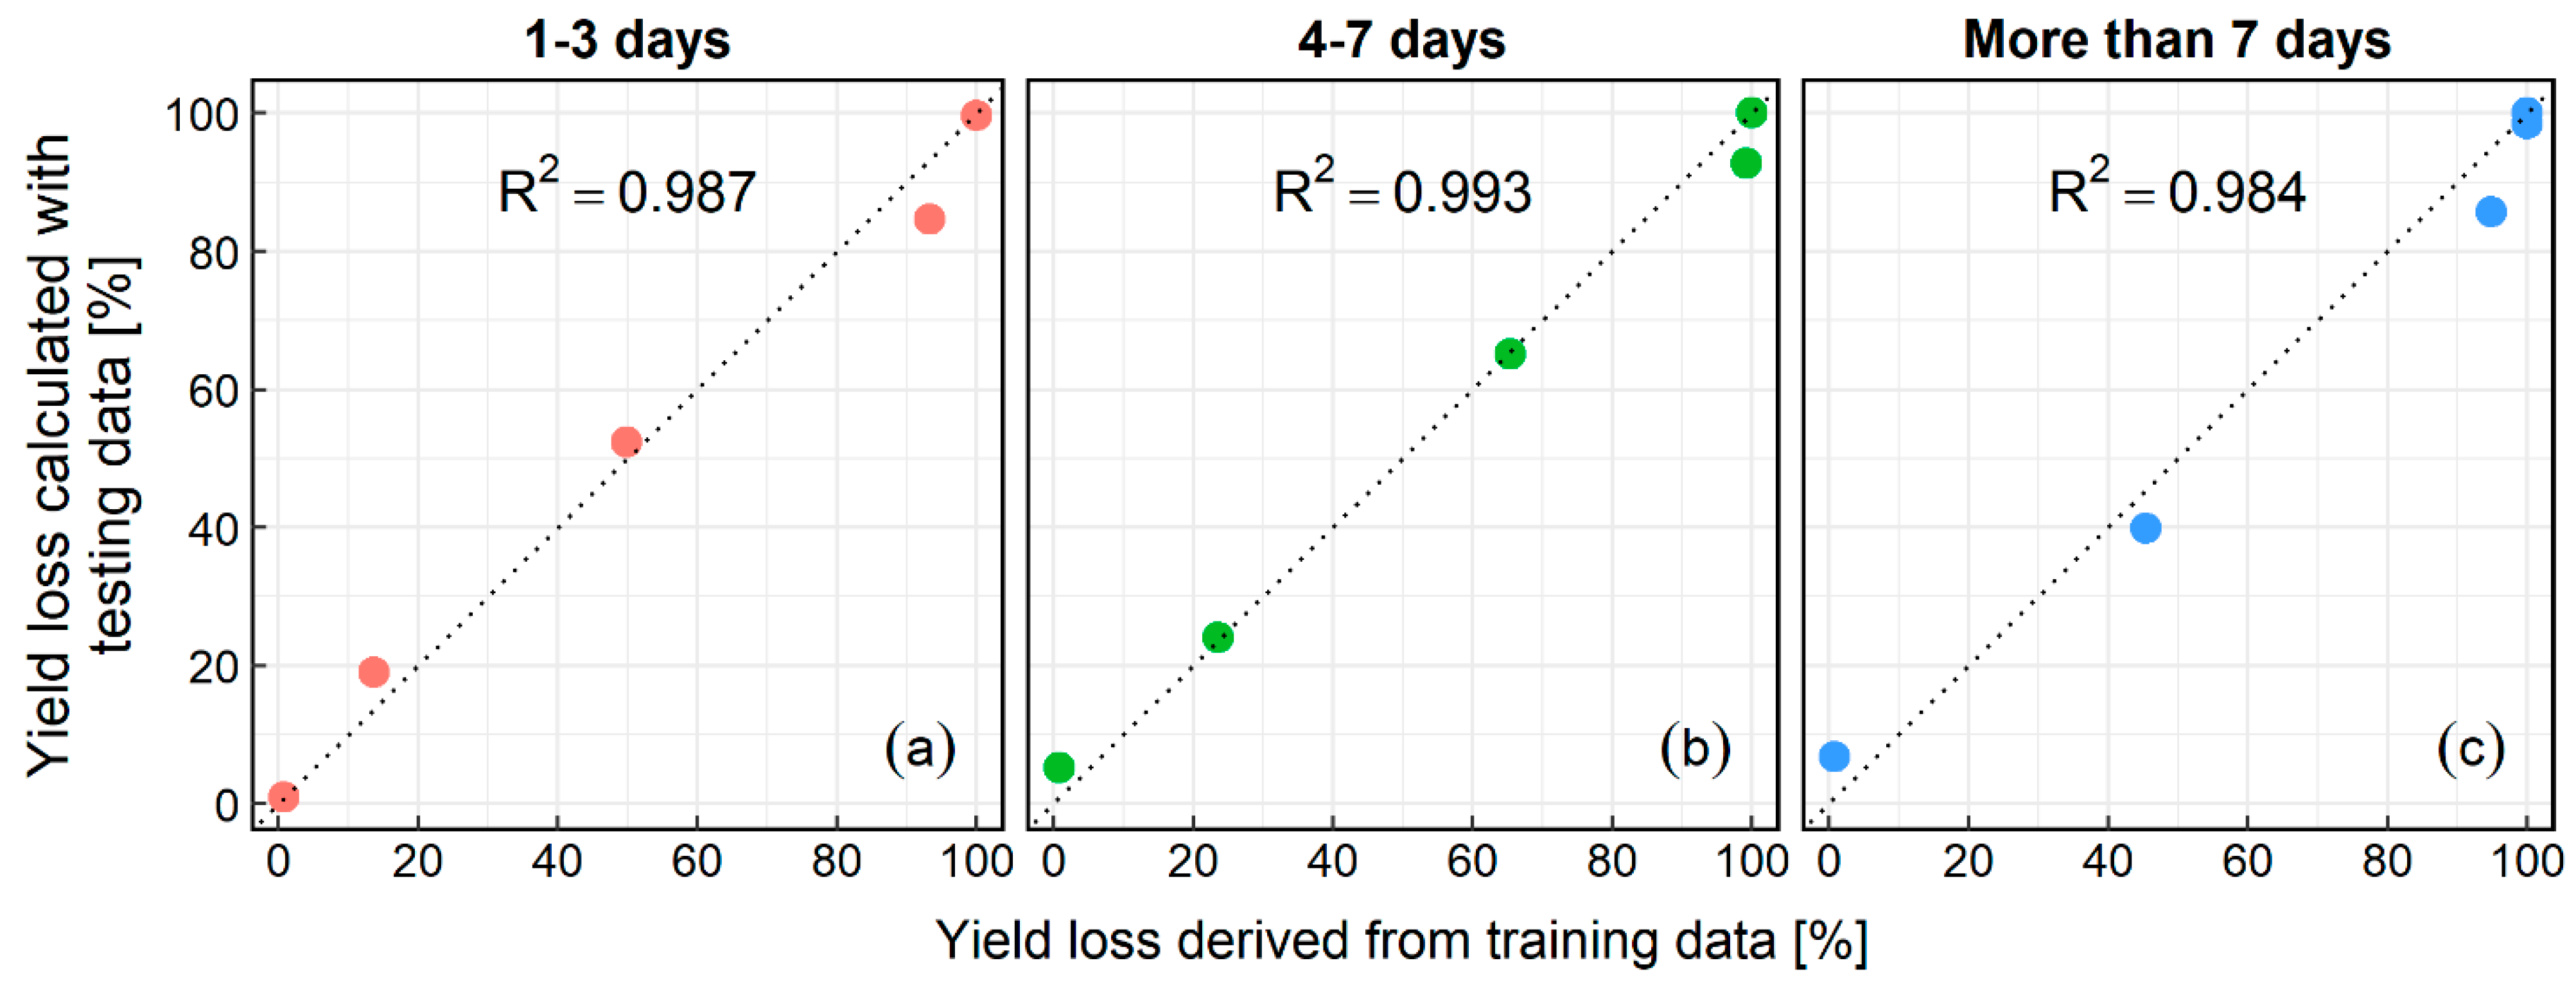
5. Validation of the Damage Curves
6. Conclusions
Author Contributions
Funding
Institutional Review Board Statement
Informed Consent Statement
Data Availability Statement
Acknowledgments
Conflicts of Interest
Appendix A
| Name of interviewee: | District: | |
| Occupation: | Sub-district: | Union: |
- (a)
- Please provide general information of Boro paddy at maturity stage
- Type of Farm holding:□ Small (5–249 decimal of operating land)□ Medium (250–749 decimal of operating land)□ Large (>749 decimal of operating land)
- Full Length/height of Boro paddy = __________ ft. __________ inch
- Average expected yield = ______________ Maund/Bigha
- How many days your Boro paddy was inundated for?
Floods 2004 2010 2016 2017 Comments Days - What was the maximum inundation depth your Boro paddy experienced?
Floods 2004 2010 2016 2017 Comments Depth (ft.) - How much was the actual Boro rice production (Maund/Bigha)?
Floods 2004 2010 2016 2017 Comments Production
- (b)
- Please provide information of reduced Boro production due to inundation depth and duration
Inundation depth (ft.) Reduced Production (Maund/Bigha) Comments 1–3 Days 4–7 Days Above 7 Days 0.75 Average expected yield = _____ Maund/Bigha 1 1.5 2 2.5 >3
Appendix B
| Name of interviewee: | District: | |
| Occupation: | Sub-district: | Union: |
- (a)
- Please provide general information on house and household assets:
- 1.
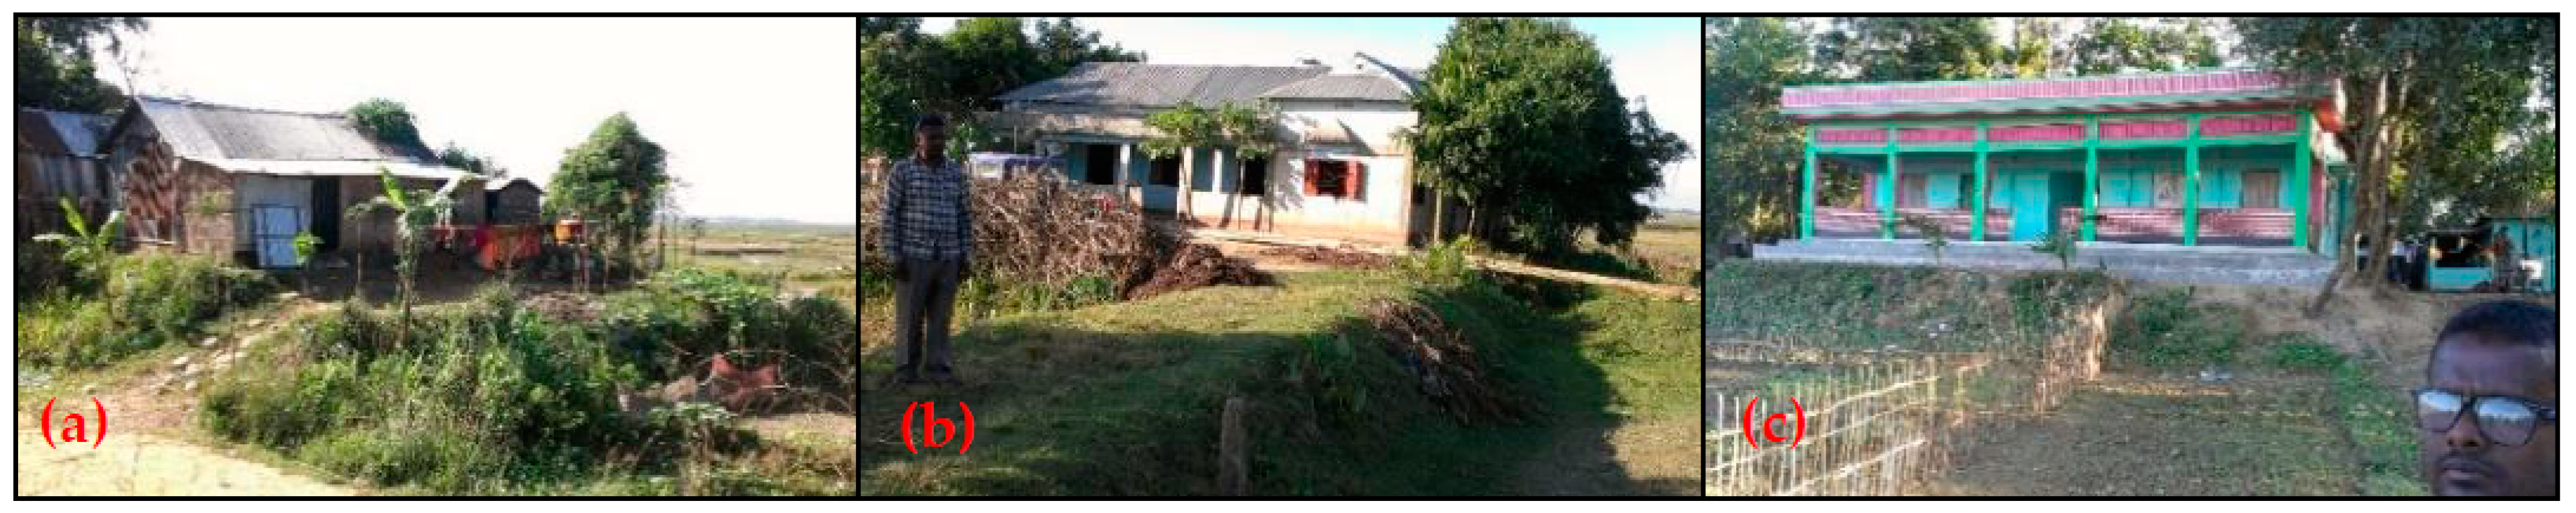
- Type of house (with photograph):□ Packa (made of brick, cement, sand; concrete/CI sheet roof)□ Semi-Packa (made of brick column and CI sheet; CI sheet roof)□ Kaccha (made of mud and clay; Straw/CI sheet roof)
- 2.
- Floor level from ground = _______ ft. _______ inch
- 3.
- Approximate value of house = Thousand taka ___________
- 4.
- Approximate value of household assets = Thousand taka ___________
- 5.
- How many days your house was inundated for?
Floods 2004 2010 2016 2017 2018 Comments Days - 6.
- How maximum the inundation depth above floor level your house was experienced?
Floods 2004 2010 2016 2017 2018 Comments Depth (ft.) - 7.
- How much was the house recovery cost after flood (Thousand taka)?
Floods 2004 2010 2016 2017 2018 Comments Cost - 8.
- How much was the loss of household assets in the flood (Thousand taka)?
Floods 2004 2010 2016 2017 2018 Comments Loss
- (b)
- Please provide information on recovery cost of house according to inundation depth
Inundation depth (ft.) Recovery cost (Thousand taka) after floods Comments <* FL No damage → Value of house = Thousand taka ___________ 1 2 3 4 5 6 7 8 and above - (c)
- Please provide information on loss of household assets according to inundation depth
Inundation depth (ft.) Recovery cost (Thousand taka) after floods Comments <* FL No damage → Value of assets = Thousand taka ___________ 1 2 3 4 5 6 7 and above
References
- Nishat, B.; Rahman, S.M.M. Water Resources Modeling of the Ganges-Brahmaputra-Meghna River Basins Using Satellite Remote Sensing Data1. JAWRA J. Am. Water Resour. Assoc. 2009, 45, 1313–1327. [Google Scholar] [CrossRef]
- FAO—Food and Agriculture Organization of the United Nations. Irrigation in Southern and Eastern Asia in Figures, AQUASTAT Survey-2011; FAO Water Report #37; FAO: Rome, Italy, 2012. [Google Scholar]
- Chowdhury, M.R. An Assessment of Flood Forecasting in Bangladesh: The Experience of the 1998 Flood. Nat. Hazards 2000, 22, 139–163. [Google Scholar] [CrossRef]
- Mirza, M.M.Q. Three Recent Extreme Floods in Bangladesh: A Hydro-Meteorological Analysis. Nat. Hazards 2003, 28, 35–64. [Google Scholar] [CrossRef]
- Quddus, M.A. Crop Production Growth in Different Agro-Ecological Zones of Bangladesh. J. Bangladesh Agric. Univ. 2009, 7, 351–360. [Google Scholar] [CrossRef] [Green Version]
- Alam, M.S.; Quayum, M.; Islam, M. Crop Production in the Haor Areas of Bangladesh: Insights from Farm Level Survey. Agriculturists 2011, 8, 88–97. [Google Scholar] [CrossRef]
- Rabby, T.; Alam, G.M.; Mishra, P.; Hoque, K.; Nair, S. Different Economic and Policy Perspectives in Micro Population for Sustainable Development: A Study of the Haor Livelihood in Bangladesh. Afr. J. Bus. Manag. 2011, 5, 2475–2492. [Google Scholar]
- Kamruzzaman, M.; Shaw, R. Flood and Sustainable Agriculture in the Haor Basin of Bangladesh: A Review Paper. Univers. J. Agric. Res. 2018, 6, 10–49. [Google Scholar] [CrossRef] [Green Version]
- Parry, B.L. Think the Weather Bad’s Here? Spare a Thought for These Indian Villagers Who Live in the Wettest Place in the World with 40 FEET of Rain a Year. Available online: http://www.dailymail.co.uk/news/article-2471421/Indias-Mawsynram-villagers-live-wettest-place-world-40-FEET-rain-year.html (accessed on 2 January 2022).
- Shah. Sustainable Development of the Ganges-Brahmaputra-Meghna Basins—United Nations University. Available online: https://unu.edu/publications/books/sustainable-development-of-the-ganges-brahmaputra-meghna-basins.html (accessed on 12 March 2018).
- Mirza, M.M.Q.; Warrick, R.A.; Ericksen, N.J. The Implications of Climate Change on Floods of the Ganges, Brahmaputra and Meghna Rivers in Bangladesh. Clim. Change 2003, 57, 287–318. [Google Scholar] [CrossRef]
- Chowdhury, M.; Ward, N. Hydro-Meteorological Variability in the Greater Ganges–Brahmaputra–Meghna Basins. Int. J. Climatol. 2004, 24, 1495–1508. [Google Scholar] [CrossRef]
- Kamal, R.; Matin, M.A.; Nasreen, S. Response of River Flow Regime to Various Climate Change Scenarios in Ganges-Brahmaputra-Meghna Basin. J. Water Resour. Ocean Sci. 2013, 2, 15. [Google Scholar] [CrossRef] [Green Version]
- Mohammed, K.; Islam, A.K.M.; Islam, T.; Alfieri, L.; Khan, M.J.U.; Bala, S.; Das, M. Future Floods in Bangladesh under 1.5 °C, 2 °C, and 4 °C Global Warming Scenarios. J. Hydrol. Eng. 2018, 23, 04018050. [Google Scholar] [CrossRef]
- Masood, M.; Yeh, P.J.-F.; Hanasaki, N.; Takeuchi, K. Model Study of the Impacts of Future Climate Change on the Hydrology of Ganges–Brahmaputra–Meghna Basin. Hydrol. Earth Syst. Sci. 2015, 19, 747–770. [Google Scholar] [CrossRef] [Green Version]
- Masood, M.; Takeuchi, K. Climate Change Impacts and Its Implications on Future Water Resource Management in the Meghna Basin. Futures 2016, 78–79, 1–18. [Google Scholar] [CrossRef]
- Masood, M.; Takeuchi, K. Climate Change Impact on the Manageability of Floods and Droughts of the Ganges-Brahmaputra-Meghna Basins Using Flood Duration Curves and Drought Duration Curves. J. Disaster Res. 2015, 10, 991–1000. [Google Scholar] [CrossRef]
- Merz, B.; Kreibich, H.; Schwarze, R.; Thieken, A. Review Article “Assessment of Economic Flood Damage”. Nat. Hazards Earth Syst. Sci. 2010, 10, 1697–1724. [Google Scholar] [CrossRef]
- Emanuelsson, M.A.E.; Mcintyre, N.; Hunt, C.; Mawle, R.; Kitson, J.; Voulvoulis, N. Flood Risk Assessment for Infrastructure Networks. J. Flood Risk Manag. 2014, 7, 31–41. [Google Scholar] [CrossRef]
- Hasanzadeh Nafari, R.; Amadio, M.; Ngo, T.; Mysiak, J. Flood Loss Modelling with FLF-IT: A New Flood Loss Function for Italian Residential Structures. Nat. Hazards Earth Syst. Sci. 2017, 17, 1047–1059. [Google Scholar] [CrossRef] [Green Version]
- Win, S.; Zin, W.W.; Kawasaki, A.; San, Z.M.L.T. Establishment of Flood Damage Function Models: A Case Study in the Bago River Basin, Myanmar. Int. J. Disaster Risk Reduct. 2018, 28, 688–700. [Google Scholar] [CrossRef]
- Romali, N.; Sulaiman, S.; Yusop, Z.; Ismail, Z. Flood Damage Assessment: A Review of Flood Stage—Damage Function Curve. In ISFRAM 2014; Springer: Singapore, 2015. [Google Scholar] [CrossRef] [Green Version]
- Olesen, L.; Löwe, R.; Arnbjerg-Nielsen, K. Flood Damage Assessment – Literature Review and Recommended Procedure; Cooperative Research Centre for Water Sensitive Cities: Melbourne, Australia, 2017. [Google Scholar]
- Dutta, D.; Herath, S.; Musiake, K. A Mathematical Model for Flood Loss Estimation. J. Hydrol. 2003, 277, 24–49. [Google Scholar] [CrossRef]
- Messner, F.; Meyer, V. Flood Damage, Vulnerability and Risk Perception—Challenges for Flood Damage Research; UFZ Discussion Papers; Helmholtz Centre for Environmental Research (UFZ), Division of Social Sciences (ÖKUS): Leipzig, Germany, 2005. [Google Scholar]
- Foudi, S.; Oses-Eraso, N.; Tamayo, I. Integrated Spatial Flood Risk Assessment: The Case of Zaragoza. Land Use Policy 2015, 42, 278–292. [Google Scholar] [CrossRef]
- Kefi, M.; Mishra, B.K.; Kumar, P.; Masago, Y.; Fukushi, K. Assessment of Tangible Direct Flood Damage Using a Spatial Analysis Approach under the Effects of Climate Change: Case Study in an Urban Watershed in Hanoi, Vietnam. ISPRS Int. J. Geo-Inf. 2018, 7, 29. [Google Scholar] [CrossRef] [Green Version]
- Khairul, I.M.; Mastrantonas, N.; Rasmy, M.; Koike, T.; Takeuchi, K. Inter-Comparison of Gauge-Corrected Global Satellite Rainfall Estimates and Their Applicability for Effective Water Resource Management in a Transboundary River Basin: The Case of the Meghna River Basin. Remote Sens. 2018, 10, 828. [Google Scholar] [CrossRef] [Green Version]
- Okazumi, T.; Miyamoto, M.; Shrestha, B.B.; Gusyev, M. Uncertainty Estimation During the Process of Flood Risk Assessment in Developing Countries–Case Study in the Pampanga River Basin–. J. Disaster Res. 2014, 9, 69–77. [Google Scholar] [CrossRef]
- Okazumi, T.; Tanaka, S.; Kwak, Y.; Shrestha, B.B.; Sugiura, A. Flood Vulnerability Assessment in the Light of Rice Cultivation Characteristics in Mekong River Flood Plain in Cambodia. Paddy Water Environ. 2014, 12, 275–286. [Google Scholar] [CrossRef]
- Shrestha, B.B.; Okazumi, T.; Miyamoto, M.; Sawano, H. Flood Damage Assessment in the Pampanga River Basin of the Philippines. J. Flood Risk Manag. 2016, 9, 355–369. [Google Scholar] [CrossRef]
- Jongman, B.; Hochrainer-Stigler, S.; Feyen, L.; Aerts, J.C.J.H.; Mechler, R.; Botzen, W.J.W.; Bouwer, L.M.; Pflug, G.; Rojas, R.; Ward, P.J. Increasing Stress on Disaster-Risk Finance Due to Large Floods. Nat. Clim. Change 2014, 4, 264–268. [Google Scholar] [CrossRef]
- MOC. Outline of River Improvement Economic Research Investigation; Technical Report; River Engineering Bureau, Ministry of Construction (MOC): Tokyo, Japan, 1996.
- MLIT. Ministry of Land, Infrastructure, Transport and Tourism. In Manual for Economic Analysis for Flood Control Projects; Publication of MLIT: Tokyo, Japan, 2005. [Google Scholar]
- Zhai, G.; Fukuzono, T.; Ikeda, S. Modeling flood damage: Case of tokai flood 2000. J. Am. Water Resour. Assoc. 2005, 41, 77–92. [Google Scholar] [CrossRef]
- Velasco, M.; Cabello, À.; Russo, B. Flood Damage Assessment in Urban Areas. Application to the Raval District of Barcelona Using Synthetic Depth Damage Curves. Urban Water J. 2016, 13, 426–440. [Google Scholar] [CrossRef]
- Shrestha, B.B.; Kawasaki, A.; Zin, W.W. Development of Flood Damage Functions for Agricultural Crops and Their Applicability in Regions of Asia. J. Hydrol. Reg. Stud. 2021, 36, 100872. [Google Scholar] [CrossRef]
- Win, S.; Zin, W.W.; Kawasaki, A. Development of Flood Damage Estimation Model for Agriculture – Case Study in the Bago Floodplain, Myanmar. J. Disaster Res. 2020, 15, 242–255. [Google Scholar] [CrossRef]
- Scorzini, A.R.; Di Bacco, M.; Manella, G. Regional Flood Risk Analysis for Agricultural Crops: Insights from the Implementation of AGRIDE-c in Central Italy. Int. J. Disaster Risk Reduct. 2021, 53, 101999. [Google Scholar] [CrossRef]
- Tingsanchali, T.; Karim, M.F. Flood Hazard and Risk Analysis in the Southwest Region of Bangladesh. Hydrol. Processes 2005, 19, 2055–2069. [Google Scholar] [CrossRef]
- Khan, D.; Rahman, S.; Haque, A.K.; Chen, A.; Hammond, M.; Djordjević, S.; Butler, D. Flood Damage Assessment for Dhaka City, Bangladesh. In Proceedings of the 2nd European Conference on Flood Risk Management: Science, Policy and Practice: Closing the Gap, Rotterdam, The Netherlands, 20–22 November 2012. [Google Scholar]
- Masood, M.; Takeuchi, K. Assessment of Flood Hazard, Vulnerability and Risk of Mid-Eastern Dhaka Using DEM and 1D Hydrodynamic Model. Nat. Hazards 2012, 61, 757–770. [Google Scholar] [CrossRef]
- Hussain, S. Decision Support System for Assessing Rice Yield Losses from Annual Flooding in Bangladesh. Ph.D. Thesis, University of Hawhaii, Manoa, HI, USA, 1995. [Google Scholar]
- Gain, A.K.; Hoque, M.M. Flood Risk Assessment and Its Application in the Eastern Part of Dhaka City, Bangladesh. J. Flood Risk Manag. 2013, 6, 219–228. [Google Scholar] [CrossRef]
- Gain, A.K.; Mojtahed, V.; Biscaro, C.; Balbi, S.; Giupponi, C. An Integrated Approach of Flood Risk Assessment in the Eastern Part of Dhaka City. Nat. Hazards 2015, 79, 1499–1530. [Google Scholar] [CrossRef] [Green Version]
- Lehner, B.; Verdin, K.; Jarvis, A. New Global Hydrography Derived from Spaceborne Elevation Data. Eos Trans. Am. Geophys. Union 2008, 89, 2. [Google Scholar] [CrossRef]
- Tateishi, R.; Hoan, N.T.; Kobayashi, T.; Alsaaideh, B.; Tana, G.; Phong, D.X. Production of Global Land Cover Data—GLCNMO2008. J. Geogr. Geol. 2014, 6, 99. [Google Scholar] [CrossRef] [Green Version]
- DDM. Reports of Department of Disaster Management (DDM), Bangladesh on Damage Information and Relief Distribution on Flash Flood: Situation Update. 4 May 2017. Available online: https://Reliefweb.Int/Sites/Reliefweb.Int/Files/Resources/Flash%20Flood%20Report%20With%20Updated%20Map_MAY%2004%2C%202017.Pdf (accessed on 10 January 2022).
- Chakraborty, D.; Mondal, K.P.; Islam, S.; Roy, J. 2017 Flash Flood in Bangladesh: Lessons Learnt. In Disaster Resilience and Sustainability; Elsevier: Amsterdam, The Netherlands, 2021; pp. 591–610. ISBN 978-0-323-85195-4. [Google Scholar]
- BBS. Statistical Year Book of Bangladesh (31st and 37th Edition); Bangladesh Bureau of Statistics (BBS) 2011. 2017. Available online: http://Www.Bbs.Gov.Bd/Site/Page/29855dc1-F2b4-4dc0-9073-F692361112da/Statistical-Yearbook (accessed on 10 January 2022).
- Taherdoost, H. Sampling Methods in Research Methodology; How to Choose a Sampling Technique for Research. Int. J. Acad. Res. Manag. 2016, 5, 18–27. [Google Scholar] [CrossRef]
- Seshadhri, G.; Topkar, V.M. Validation of a Questionnaire for Objective Evaluation of Performance of Built Facilities. Int. J. Earth Sci. Eng. 2015, 8, 972–976. [Google Scholar] [CrossRef]
- FAO. Country Fact Sheet on Food and Agriculture Policy Trends—United Republic of Tanzania; FAO: Rome, Italy, 2016. [Google Scholar]
- Islam, M. Crop Calendar Mapping of Bangladesh Rice Paddy Field with ALOS-2 ScanSAR Data. Adv. Remote Sens. 2021, 10, 115–129. [Google Scholar] [CrossRef]
- Kreibich, H.; Seifert, I.; Merz, B.; Thieken, A.H. Development of FLEMOcs—A New Model for the Estimation of Flood Losses in the Commercial Sector. Hydrol. Sci. J. 2010, 55, 1302–1314. [Google Scholar] [CrossRef]
- Grahn, T.; Nyberg, L. Assessment of Pluvial Flood Exposure and Vulnerability of Residential Areas. Int. J. Disaster Risk Reduct. 2017, 21, 367–375. [Google Scholar] [CrossRef]
- Sayama, T.; Ozawa, G.; Kawakami, T.; Nabesaka, S.; Fukami, K. Rainfall–Runoff–Inundation Analysis of the 2010 Pakistan Flood in the Kabul River Basin. Hydrol. Sci. J. 2012, 57, 298–312. [Google Scholar] [CrossRef]
- Sayama, T.; Tatebe, Y.; Iwami, Y.; Tanaka, S. Hydrologic Sensitivity of Flood Runoff and Inundation: 2011 Thailand Floods in the Chao Phraya River Basin. Nat. Hazards Earth Syst. Sci. 2015, 15, 1617–1630. [Google Scholar] [CrossRef] [Green Version]
- Gumma, K.M.; Nelson, A.; Thenkabail, P.S.; Singh, A.N. Mapping Rice Areas of South Asia Using MODIS Multitemporal Data. J. Appl. Remote Sens. 2011, 5, 053547. [Google Scholar] [CrossRef] [Green Version]
- Recanatesi, F.; Petroselli, A. Land Cover Change and Flood Risk in a Peri-Urban Environment of the Metropolitan Area of Rome (Italy). Water Resour. Manag. 2020, 34, 4399–4413. [Google Scholar] [CrossRef]
- Pellicani, R.; Parisi, A.; Iemmolo, G.; Apollonio, C. Economic Risk Evaluation in Urban Flooding and Instability-Prone Areas: The Case Study of San Giovanni Rotondo (Southern Italy). Geosciences 2018, 8, 112. [Google Scholar] [CrossRef] [Green Version]
- Rajib, A.; Zheng, Q.; Golden, H.; Wu, Q.; Lane, C.; Christensen, J.; Morrison, R.; Annis, A.; Nardi, F. The Changing Face of Floodplains in the Mississippi River Basin Detected by a 60-Year Land Use Change Dataset. Sci. Med. Data 2021, 8, 271. [Google Scholar] [CrossRef]
- DAE. Field Reports on Boro Rice Damage in 2017 Haor Flash Floods, Generated by Department of Agricultural Extension (DAE), Bangladesh, Collected during Field Survey. Sunamganj and Sylhet, Bangladesh; DAE: Dhaka, Bangladesh, 2017. [Google Scholar]
- Kamal, A.S.M.M.; Shamsudduha, M.; Ahmed, B.; Hassan, S.M.K.; Islam, M.S.; Kelman, I.; Fordham, M. Resilience to Flash Floods in Wetland Communities of Northeastern Bangladesh. Int. J. Disaster Risk Reduct. 2018, 31, 478–488. [Google Scholar] [CrossRef] [Green Version]
- Pivot, J.M.; Josien, E.; Martin, P. Farms Adaptations to Changes in Flood Risk: A Management Approach. J. Hydrol. 2002, 267, 12–25. [Google Scholar] [CrossRef]
- Morris, J.; Brewin, P. The Impact of Seasonal Flooding on Agriculture: The Spring 2012 Floods in Somerset, England. J. Flood Risk Manag. 2014, 7, 128–140. [Google Scholar] [CrossRef]
- Molinari, D.; Scorzini, A.R.; Gallazzi, A.; Ballio, F. AGRIDE-c, a Conceptual Model for the Estimation of Flood Damage to Crops: Development and Implementation. Nat. Hazards Earth Syst. Sci. 2019, 19, 2565–2582. [Google Scholar] [CrossRef] [Green Version]


| Item | Sample Class | Sub–Districts | |
|---|---|---|---|
| Dakkhin Sunamganj | Balaganj | ||
| Population size | Farmers | 39,941 | |
| Households | 86,279 | ||
| Calculated minimum sample size | Farmers | 188 | |
| Households | 160 | ||
| Collected sample Size | Farmers | 131 | 65 |
| Households | 67 | 98 | |
| Percentage of collected samples (%) | Farmers | 66.84 | 33.16 |
| Households | 40.60 | 59.40 | |
| Regression Models | Equations of Functions |
|---|---|
| Linear | |
| Logistic | |
| Natural Logarithm | |
| Polynomial (3rd order) | |
| Power |
| Rice Type | Average Height (cm) | Max. Expected Yield (MT/Hectare) | Depth at which Flood Damage Starts (cm) | Duration at which Flood Damage Starts (Day) |
|---|---|---|---|---|
| Boro | 85 | 4.95 | 30 | 2–3 |
| Regression Models | No. of Samples | Flood Duration | Value of Parameters | SE | CC | CD | AICC | |||
|---|---|---|---|---|---|---|---|---|---|---|
| a | b | c | d | |||||||
| Linear | 196 | 1–3 days | −55.77551 | 1.78594 | - | - | 12.98 | 0.95 | 0.90 | 5024.65 |
| 4–7 days | −49.78231 | 1.78367 | - | - | 13.20 | 0.94 | 0.89 | 5057.18 | ||
| Above 7 days | −33.66327 | 1.67166 | - | - | 18.01 | 0.89 | 0.80 | 5666.35 | ||
| Logistic | 196 | 1–3 days | 102.6640 | 943.202 | 0.114664 | - | 11.60 | 0.95 | 0.91 | 4803.59 |
| 4–7 days | 102.1564 | 807.565 | 0.121528 | - | 10.62 | 0.97 | 0.93 | 4631.30 | ||
| Above 7 days | 99.83938 | 2356.29 | 0.165006 | - | 11.52 | 0.96 | 0.92 | 4791.76 | ||
| Natural Logarithm | 196 | 1–3 days | −336.0498 | 96.2824 | - | - | 14.44 | 0.93 | 0.87 | 5233.51 |
| 4–7 days | −337.7718 | 98.1660 | - | - | 12.46 | 0.95 | 0.90 | 4944.93 | ||
| Above 7 days | −317.3191 | 95.4187 | - | - | 14.53 | 0.93 | 0.87 | 5245.88 | ||
| Polynomial (3rd order) | 196 | 1–3 days | −0.001030 | 0.18343 | −8.308795 | 113.05 | 11.54 | 0.96 | 0.92 | 4796.84 |
| 4–7 days | −0.001014 | 0.16730 | −6.569458 | 74.891 | 10.39 | 0.97 | 0.93 | 4590.75 | ||
| Above 7 days | −0.000425 | 0.04119 | 1.647864 | −72.734 | 11.87 | 0.95 | 0.91 | 4851.83 | ||
| Power | 196 | 1–3 days | 0.009635 | 2.07225 | - | - | 14.93 | 0.92 | 0.86 | 5298.01 |
| 4–7 days | 0.041036 | 1.75641 | - | - | 15.89 | 0.92 | 0.84 | 5421.41 | ||
| Above 7 days | 0.275633 | 1.33925 | - | - | 19.77 | 0.87 | 0.75 | 5849.49 | ||
| House Type | Proportion | Avg. Plinth Level (m) | Avg. Building Value (103 BDT/USD) | Avg. Property Value (103 BDT/USD) | |
|---|---|---|---|---|---|
| Size | % | ||||
| Mud | 91 | 55 | 1.5 | 276/3247 | 110/1294 |
| Brick | 41 | 25 | 1.8 | 685/8059 | 191/2247 |
| Concrete | 33 | 20 | 1.8 | 1436/16,894 | 319/3753 |
| Regression Models | No. of Samples | House Type | Value of Parameters | SE | CC | CD | AICC | |||
|---|---|---|---|---|---|---|---|---|---|---|
| a | b | c | d | |||||||
| Linear | 91 | Mud | −2.308075 | 0.5351 | - | - | 16.27 | 0.89 | 0.80 | 3553.63 |
| 41 | Brick | −15.62295 | 0.4010 | - | - | 8.55 | 0.94 | 0.89 | 1231.80 | |
| 33 | Concrete | −6.782667 | 0.1649 | - | - | 5.85 | 0.87 | 0.75 | 815.95 | |
| Logistic | 91 | Mud | 99.00861 | 44.638 | 0.041039 | - | 12.46 | 0.94 | 0.88 | 3215.06 |
| 41 | Brick | 79.30398 | 62.377 | 0.029431 | - | 7.54 | 0.96 | 0.92 | 1160.66 | |
| 33 | Concrete | 39.41865 | 47.180 | 0.023697 | - | 5.60 | 0.88 | 0.77 | 797.24 | |
| Natural Logarithm | 91 | Mud | −177.9507 | 51.972 | - | - | 15.30 | 0.91 | 0.82 | 3474.91 |
| 41 | Brick | −131.2998 | 35.499 | - | - | 12.70 | 0.87 | 0.76 | 1458.76 | |
| 33 | Concrete | −53.69458 | 14.456 | - | - | 7.13 | 0.79 | 0.63 | 907.54 | |
| Polynomial (3rd order) | 91 | Mud | −0.000033 | 0.0097 | −0.118620 | 3.0656 | 12.53 | 0.94 | 0.88 | 3222.89 |
| 41 | Brick | −0.000018 | 0.0073 | −0.476719 | 11.582 | 7.60 | 0.96 | 0.92 | 1165.95 | |
| 33 | Concrete | −0.000002 | 0.0013 | −0.043291 | 1.1611 | 5.61 | 0.88 | 0.77 | 798.68 | |
| Power | 91 | Mud | 0.058441 | 1.4348 | - | - | 16.24 | 0.89 | 0.80 | 3551.03 |
| 41 | Brick | 0.011702 | 1.6321 | - | - | 8.14 | 0.95 | 0.90 | 1203.81 | |
| 33 | Concrete | 0.002243 | 1.7762 | - | - | 5.59 | 0.88 | 0.77 | 795.46 | |
| Regression Models | No. of Samples | Household Type | Value of Parameters | SE | CC | CD | AICC | |||
|---|---|---|---|---|---|---|---|---|---|---|
| a | b | c | d | |||||||
| Linear | 91 | Mud | 2.338476 | 0.5389 | - | - | 17.52 | 0.88 | 0.78 | 3647.89 |
| 41 | Brick | −10.90645 | 0.5616 | - | - | 15.13 | 0.92 | 0.84 | 1559.52 | |
| 33 | Concrete | −19.97812 | 0.5375 | - | - | 12.73 | 0.93 | 0.87 | 1175.30 | |
| Logistic | 91 | Mud | 101.1704 | 60.144 | 0.048048 | - | 11.50 | 0.95 | 0.91 | 3112.44 |
| 41 | Brick | 98.02995 | 98.029 | 0.042513 | - | 11.83 | 0.95 | 0.90 | 1419.41 | |
| 33 | Concrete | 92.86422 | 114.31 | 0.038246 | - | 11.09 | 0.95 | 0.90 | 1112.76 | |
| Natural Logarithm | 91 | Mud | −180.1408 | 53.550 | - | - | 14.95 | 0.92 | 0.84 | 3445.67 |
| 41 | Brick | −188.6330 | 53.116 | - | - | 16.07 | 0.90 | 0.82 | 1594.08 | |
| 33 | Concrete | −179.4930 | 48.546 | - | - | 16.80 | 0.88 | 0.77 | 1303.46 | |
| Polynomial (3rd order) | 91 | Mud | −0.000027 | 0.0067 | 0.323612 | −8.1503 | 12.08 | 0.94 | 0.89 | 3176.80 |
| 41 | Brick | −0.000043 | 0.0143 | −0.685676 | 14.1977 | 11.88 | 0.95 | 0.90 | 1422.68 | |
| 33 | Concrete | −0.000037 | 0.0139 | −0.937985 | 19.9961 | 11.14 | 0.95 | 0.90 | 1115.94 | |
| Power | 91 | Mud | 0.079741 | 1.3896 | - | - | 17.05 | 0.91 | 0.82 | 3469.94 |
| 41 | Brick | 0.270495 | 1.1164 | - | - | 15.68 | 0.91 | 0.83 | 1579.81 | |
| 33 | Concrete | 0.034920 | 1.4796 | - | - | 13.17 | 0.93 | 0.86 | 1190.88 | |
Publisher’s Note: MDPI stays neutral with regard to jurisdictional claims in published maps and institutional affiliations. |
© 2022 by the authors. Licensee MDPI, Basel, Switzerland. This article is an open access article distributed under the terms and conditions of the Creative Commons Attribution (CC BY) license (https://creativecommons.org/licenses/by/4.0/).
Share and Cite
Khairul, I.M.; Rasmy, M.; Ohara, M.; Takeuchi, K. Developing Flood Vulnerability Functions through Questionnaire Survey for Flood Risk Assessments in the Meghna Basin, Bangladesh. Water 2022, 14, 369. https://doi.org/10.3390/w14030369
Khairul IM, Rasmy M, Ohara M, Takeuchi K. Developing Flood Vulnerability Functions through Questionnaire Survey for Flood Risk Assessments in the Meghna Basin, Bangladesh. Water. 2022; 14(3):369. https://doi.org/10.3390/w14030369
Chicago/Turabian StyleKhairul, Islam M., Mohamed Rasmy, Miho Ohara, and Kuniyoshi Takeuchi. 2022. "Developing Flood Vulnerability Functions through Questionnaire Survey for Flood Risk Assessments in the Meghna Basin, Bangladesh" Water 14, no. 3: 369. https://doi.org/10.3390/w14030369