Abstract
Although runoff from trafficked urban areas is recognized as a potentially significant pathway of micropollutants, runoff pollution remains poorly documented, except for relatively few historical pollutants such as some metals and hydrocarbons. Therefore, in this work, road and parking lot runoff from four sites with contrasting traffic levels were analyzed for a very broad spectrum of molecules and elements. A total of 128 pollutants and micropollutants were monitored, including inorganic (n = 41) and organic (n = 87) pollutants. Both the dissolved and particulate phases were considered. For a reduced number of samples, non-targeted screening by high-resolution mass spectrometry (HRMS) was carried out. For targeted screening, the contamination profiles were quite homogeneous, but the concentrations significantly differed between the different sites. Sites with the highest traffic density exhibited the highest concentrations for polycyclic aromatic hydrocarbons (PAHs), some traffic-related metals, alkylphenols and phthalates. Overall, for most micropollutants, the parking lot runoff exhibited the lowest concentrations, and the specificity of this site was confirmed by its HRMS fingerprint. Non-target screening allowed the sites to be discriminated based on the occurrence of specific compounds. Unlike the results of targeted screening, the HRMS intra-site variability was lower than its inter-site variability. Unknown substances were tentatively identified, either characteristic of each site or ubiquitous of all samples.
1. Introduction
Since the 1980s, numerous studies have demonstrated that urban stormwater contributes to the deterioration of the quality of receiving environments [1,2]. Among the various urban surfaces, traffic areas are especially likely to emit a wide range of micropollutants into the runoff. They may originate from multiple sources [3,4]: exhaust gases; abrasion of tires, brakes and other mechanical parts of vehicles; leakage of various automotive fluids; leaching from exterior metallic or polymeric materials of vehicles and erosion or leaching from pavement coating, road paints and urban furniture.
Traffic area runoff [5] has been extensively documented for aggregate parameters like total suspended solids (TSS); chemical oxygen demand (COD); oils and grease; nutrients; a range of trace metals, including Cu, Pb and Zn and polycyclic aromatic hydrocarbons (PAHs). Most studies have focused on densely trafficked highways; less information is available for urban roads with lower traffic and for parking lots [3,6,7]. Moreover, while the contamination of stormwater by a wide range of metallic and organic micropollutants has been identified [6,7,8], there is very little information on the range of micropollutants composing the runoff matrix from trafficked areas and their concentration levels. In order to develop road and parking lot runoff management strategies that limit the diffuse contamination of receiving water bodies, more in-depth knowledge about the sources and concentrations of these contaminants is needed.
This study was performed within the framework of the “Roulépur” research program, funded by the French Agency for Biodiversity and Seine-Normandie Water Agency. This project aimed at evaluating innovative solutions for controlling micropollutant loads generated by road runoff. The first task of the project was dedicated to an extended screening of traffic area runoff contamination.
By coupling targeted and non-targeted screening, this study aimed to investigate a broad range of pollutants, including historical (PAH and metals) but also emerging micropollutants, as well as poorly documented pollutants in road runoff. This holistic approach, covering a wide range of micropollutants, allowed for a better assessment of the problem road runoff poses to receiving waters and a better identification of pollutant sources and, thus, guides source control or treatment strategies.
The following questions were addressed: (i) What is the frequency of occurrence of the investigated micropollutants and pollutant concentration ranges in roads and parking lots? (ii) What is the inter-site variability concentration? (iii) How can non-targeted screening contribute to the knowledge of runoff water quality?
2. Materials and Methods
2.1. Study Sites and Sampling Methods
Runoff was collected from three urban roads with contrasting traffic levels and conditions and one residential parking, all situated within the Paris metropolitan area (France). The main characteristics of this study sites are given in Table 1.

Table 1.
Sampling sites characteristics.
Runoff was collected from a storm drain (sites P and R) or from a gully (sites C and V). Flow conditions at the sampling point at sites P, C and V allowed for a good mixing of the effluent in the flow section. At site R, however, the sampling point was under backwater influence, leading to periods of low velocity and possible stratification of the TSS, which could have induced an overestimation of the particle-bound concentrations for some samples. Event mean samples were collected with automatic refrigerated samplers (Sigma SD900P, Hach Lange, Lognes, France or Bühler 1029, Hach Lange, Lognes, France or Sigma AS950, Hydreka, Lyon, France or Isco 3700, Teledyne Isco, Lincoln NE, USA) controlled by a flowmeter (P: tipping bucket, Précis Mécanique, Bezons, France and PCM4+POA, Nivus, Bischoffsheim, France, C: tipping bucket, UFT, Rosheim, France, R: Tidalflux 4300F, Khrone, Romans-sur-Isère, France, V: triangular weir + pressure sensor Unik5000, GE M&C, France). At sites P, C and V, flow proportional samples were collected over the periods of non-zero flow at fixed volume steps. At site R, subsamples were collected when a given water level threshold was exceeded and collected at fixed time steps. This sampling procedure allowed for a good representation of sites P, C and V, with event mean samples covering usually more than 90% of the rain event volume, except for some events with very high rainfall amounts. For site R, the representativity of the event mean samples could not be evaluated, as the flow measurements were not reliable during the backwater periods. Samples were collected in 20-L PEHD bottles for inorganic elements and global pollutants analyses and in 20-L glass bottles for organic micropollutants. Between each event, all bottles were washed with detergent (Extran for plastic bottles and TDF4 for glass bottles, Merck, France) and rinsed several times with tap water, thrice with deionized water and twice with ultrapure water. When possible, two samplers were used in parallel (sites C and V). When only one sampler could be used due to space limitation (sites P and R), glass and PEHD bottles were alternated between rain events. Samples were retrieved as soon as possible after the rain event (usually less than 12 h) and were pretreated within 24 h. A representative sample of fresh sediment was also collected manually where it could be found: along the road shoulder (C), in the storm drain (R) and in the settler collecting the road runoff (P)—no sediment was available at the V site.
2.2. Screening Methodology
2.2.1. Targeted Screening Methodology
Based on a multicriteria approach combining the available analytical capacities and a review of molecules potentially leached from road infrastructures and car materials and consumables, a list of organic and inorganic pollutants was selected, similar to that of Markiewicz et al. [9]. A total of 128 pollutants and micropollutants were selected and monitored in the runoff, including 41 inorganic and 87 organic pollutants or groups of substances. The full list of pollutants analyzed is provided in Table S1. Pollutants analyzed during the targeted screening can be divided into 5 groups, based on the analytical procedures and the laboratories in charge of the chemical analysis, as well as on the number of rain events sampled. The compounds analyzed and usual abbreviations are given in the respective tables. Group 1 and group 2 corresponded to inorganic compounds. Group 1 encompassed 10 trace metals (As, Cd, Cr, Co, Cu, Mo, Ni, Pb, V and Zn) and 11 major elements (Al, Ba, Ca, Fe, Mg, Mn, P, K, Na, Sr and Ti), while group 2 comprised Sb, Ag, Cs, Rb, Se and 15 Rare Earth Elements (REE). Groups 3, 4 and 5 corresponded to organic micropollutants. Group 3 consisted of 19 polycyclic aromatic hydrocarbons (PAHs), including 16 US-EPA PAHs; 2 methyl-PAHs and coronene; total hydrocarbons (THC) and 7 alkylphenols (APs), including nonylphenol, octylphenol and their polyethoxylates (NPnEOs and OPnEOs), bisphenol A and 15 phthalic acid esters (PAEs). Group 4 consisted of 18 perfluoroalkyl sulfonates (PFASs), 10 polybromo diphenyl ethers (PBDEs), hexabromocyclododecane (HBCDD) and tetrabromobisphenol A (TBBPA). Group 5 comprised 3 organotins, 4 benzotriazoles, 3 oxygenated ethers, chloroalkanes (C10-C13), benzophenone and linear alkylbenzene sulfonate (LAS).
For most organic compounds and metals, the dissolved and particulate phases were analyzed separately as recommended in the literature (Zgheib et al. 2011) after filtration on 0.7-µm fiberglass filters (Whatman, Sigma Aldrich, France) for organics and 0.45-µm cellulose acetate filters (Whatman®) for inorganics. The total concentrations were calculated as the sum of the dissolved and the particle-bound concentrations. The elements from group 5 were analyzed in the dissolved and total phases.
For the analyses from groups 2, 3 and 4, the samples were filtered immediately after collection and freeze-dried. For group 3, the filtrates were extracted immediately after filtration and stored at 4 °C before analysis. For group 4, the filtrate was set on ice and sent by express to the corresponding laboratory, where it was extracted upon reception. For group 2 (inorganic elements), the filtrate was acidified at pH <2 with HNO3 and stored at 4 °C before analysis. For group 1, an aliquot of the total sample was set on ice and sent by express to the corresponding laboratory, where it was filtered upon reception and handled similarly to group 2.
The particulate inorganic elements (groups 1 and 2) underwent total solubilization by concentrated acid digestion (HF + HNO3 or HF + HClO4 + HCl + HNO3) and were analyzed by either inductively coupled plasma mass spectrometry (ICP-MS) or inductively coupled plasma optical emission spectrometry (ICP-OES). Dissolved organic micropollutants were either liquid–liquid-extracted (TPH and PAHs) or solid-phase-extracted, while the filters were either solid–liquid-extracted (TPH and PAHs) or microwave-extracted. PAHs and PAEs, as well as PBDEs, were analyzed using gas chromatography coupled to mass spectrometry (GC-MS). Bisphenol A, APs and PFAS were analyzed by liquid chromatography coupled to tandem mass spectrometry (LC-MS/MS). More information on the analytical methods can be found in Reference [10] for pollutants from group 1 and 3, Reference [11] for group 2 and adapted from References [12,13,14,15] for group 4.
Compared to the analytical uncertainties, the field blanks did not show significant contamination by the sampling devices and pretreatment procedures for most pollutants. The limits of quantification (LQ) for each individual substance are provided in Supplementary Materials Tables S2–S10.
2.2.2. Non-Targeted Screening Methodology
Non-targeted screening was performed on the dissolved phase of selected runoff samples following a protocol detailed elsewhere [16]. Briefly, 1 L of filtered and acidified (pH 2) samples were extracted on Oasis HLB cartridges (Waters); eluted with 3-mL dichloromethane, 5-mL ethyl acetate and 5-mL methanol; concentrated under a stream of N2 and reconstituted in a final volume of 1-mL methanol/Milli-Q water (20/80; v/v). Extracts were filtered through a 0.2-µm PTFE filter before analysis by ultra-performance liquid chromatography (UPLC) coupled to ion mobility time-of-flight mass spectrometry (IMS-QToF—Vion, Waters). UPLC separation was performed on an Acquity BEH C18 column (1.7 µm, 2.1 mm × 100 mm, Waters) after injection of 10 µL of each sample with a mobile phase constituting (A) Milli-Q water + 0.1% formic acid and (B) acetonitrile + 0.1% formic acid at a rate of 0.45 mL/min. The gradient was: 1-min isocratic with 98% A, a 25-min linear decrease to 2% A, 5-min isocratic with 2% A and a 4-min equilibration time with 98% A. IMS-ToF-MS data-independent acquisition was carried out in positive (ESI+) and negative (ESI-) modes between 100 and 1000 Da (HDMSE mode). Samples were analyzed in randomized triplicates to minimize the intra-sequence variability caused by the instrument. Data were acquired and analyzed using UNIFI software (Waters). All detected features (i.e., triplets of the m/z ratio, retention time and ion mobility drift time) were aligned across the samples and exported as a csv file for further processing (i.e., visualization of HRMS fingerprints and multivariate statistical analyses) in R software (R Core Team, v.3.6.2, Vienna, Austria).
Suspect screening was performed using a homemade library created in UNIFI software (Waters, Milford, USA)). Each suspect entry in the library contained the name of the molecule, its exact mass, its raw formula and its molecular structure, allowing in silico fragmentation. Suspects were targeted by their exact mass with a tolerance of 5 ppm, and the detected fragments were compared to the predicted ones using a tolerance window of 2 mDa. 1,4-diphenylguanidine (DPG), a rubber vulcanization accelerator, was identified as a major peak in most samples and purchased as an analytical standard for unambiguous detection (see Reference [16] submitted to the same special issue). Another guanidine compound, 1,3-di-o-tolylguanidine (DTG), was also selected. DTG and DPG have previously been quantified at 10–100 ng/L levels, respectively, in European water resources [17]. DPG was also reported at up to 300 µg/L in stormwater in Canada [18]. 6PPD, a common tire rubber antioxidant, was recently discovered as the precursor of 6PPD-quinone, a product responsible for the high mortality of Pacific Northwest coho salmon exposed to urban runoff [19]. Other compounds selected for suspect screening were additives used in the vulcanization process; plasticizers or antioxidants such as tertiary butylphenols [9,20]: bisphenol S, benzotriazole, benzothiazole, 2-mercaptobenzothiazole, 2-aminobenzothiazole, 2-methylbenzothiazole, 2,4-di-t-butylphenol, 2,6-di-t-butylphenol, 4-t-butylphenol, methyl-thiobenzothiazole, t-butylhydroquinone, butylated hydroxytoluene and tolyltriazole.
2.3. Sample Characteristics
Sampling. The sampling period ranged from November 2015 to June 2019. The sampling periods differed between sites and between pollutant groups due to the periods of availability of both the sites and the analytical laboratories (Table 2). For groups 2, 4 and 5, which corresponded to the enlarged targeted screening, between two and four runoff samples were collected per site. For groups 1 and 3, corresponding to pollutants for which a presence in urban runoff was already established, a larger number of samples were analyzed (9–19 for group 1 and 4–12 for group 3) in order to better characterize the event mean concentration distributions and variations between the sampling sites. A limited number of event mean samples out of those collected for the group 3 analysis were used for non-targeted screening: three from P site, four from C site, one from R site and three from V site.
Table 2.
Number of rain events analyzed per site and per pollutant group—targeted screening.
Rain event characteristics. The main characteristics of the sampled rain events are given in Table 3 for the four study sites. While rain depth, duration and maximum intensity varied in a wide range, most sampled events corresponded to frequent rain events that represented most of the annual rainfall volume. In the Paris region, a daily rainfall of less than 10 mm makes up for 84% of the annual rainfall, and 80% of the annual rainfall is associated with rainfall intensities inferior to 9 mm/h.
Table 3.
Sampled rain event characteristics—median (min–max).
3. Results
3.1. Physical–Chemical Characteristics
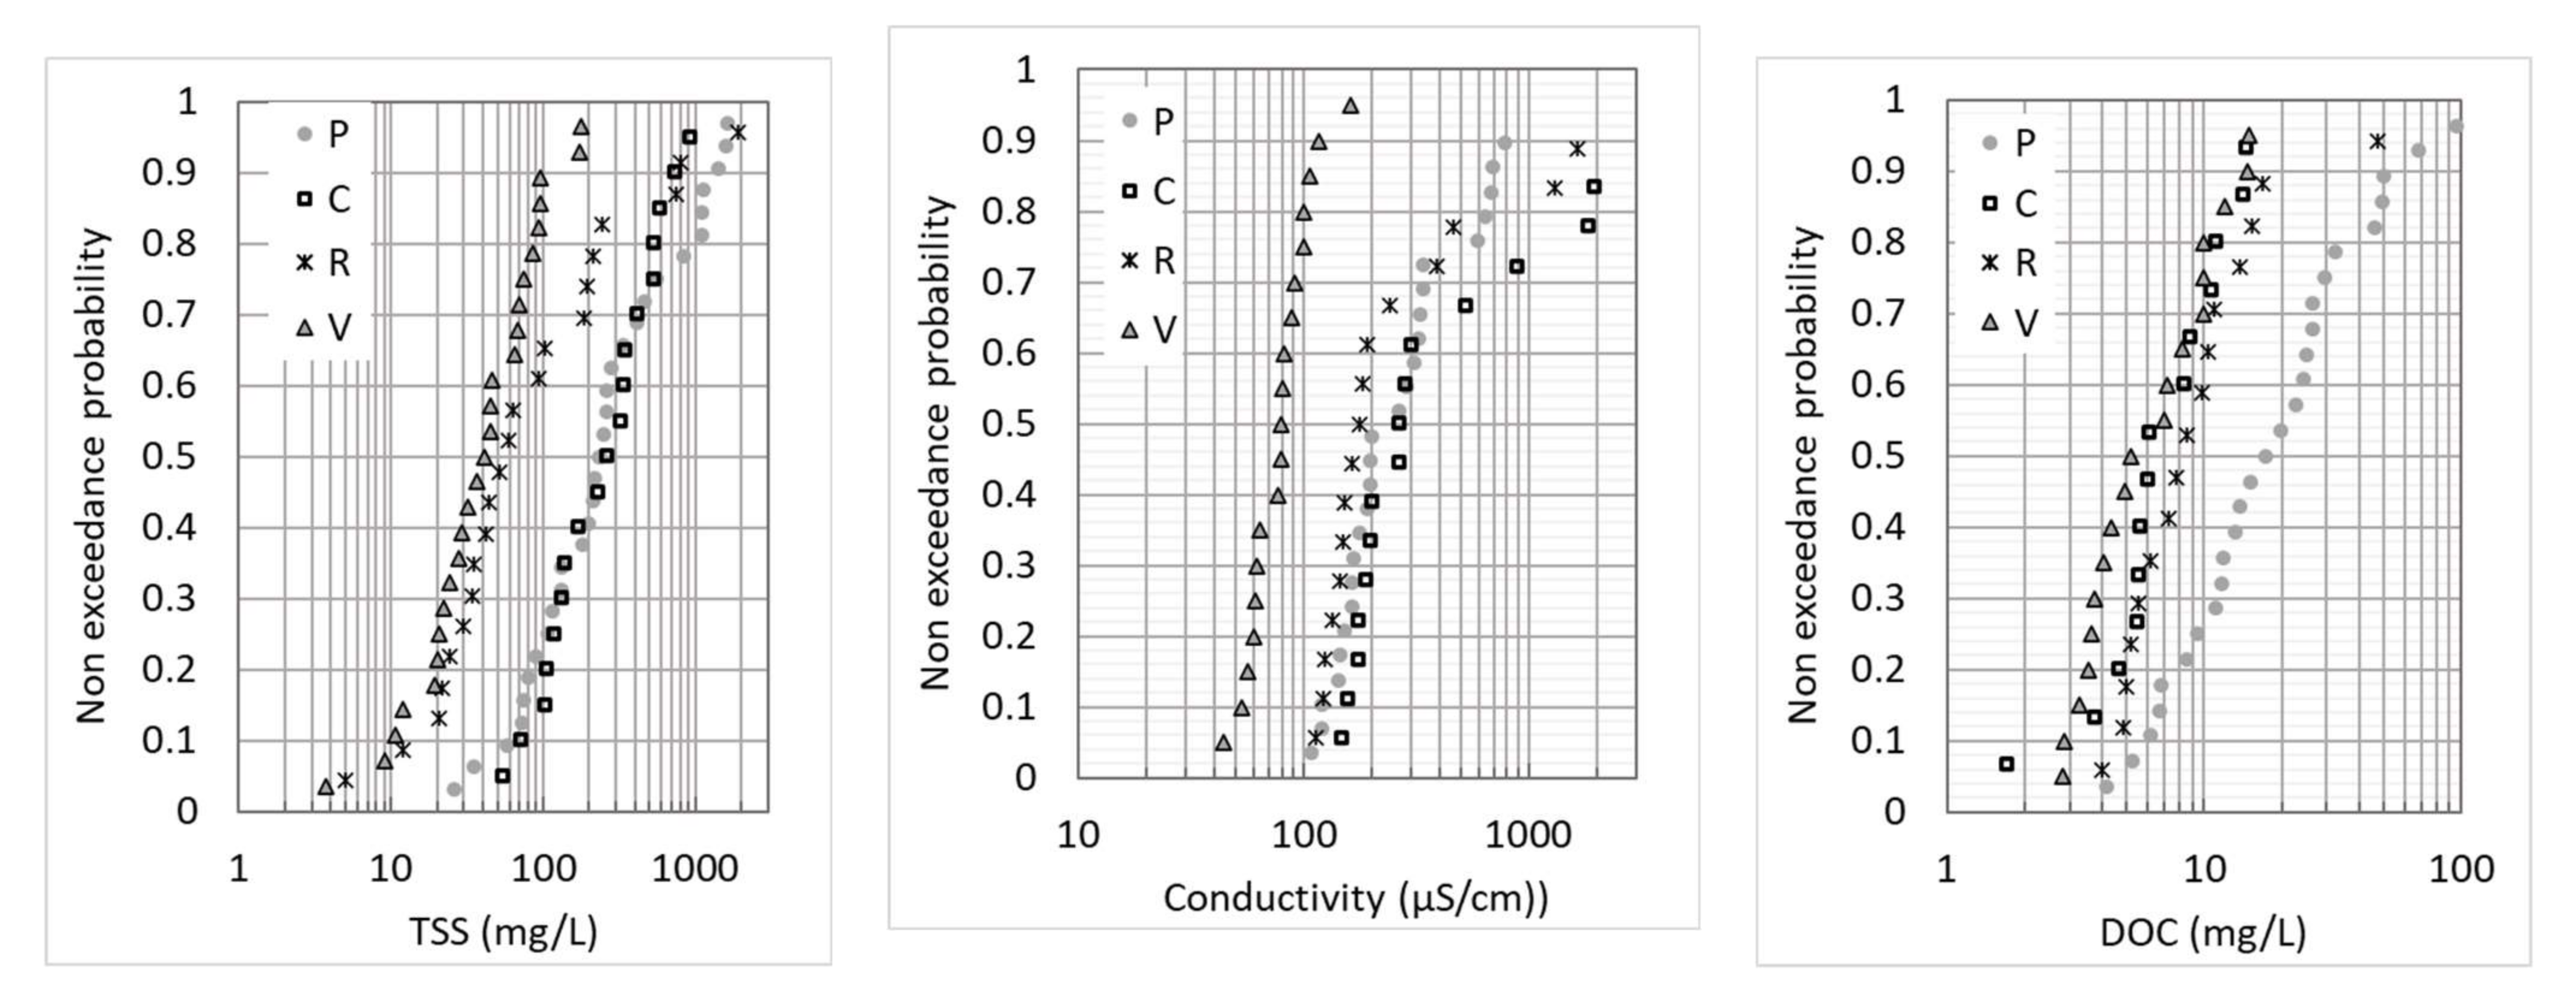
Table 4 summarizes the range of event mean concentrations (EMCs) for the total suspended solids (TSS), dissolved organic carbon (DOC) and particulate organic carbon (POC), as well as pH and electrical conductivity, for the four sites. The data were given separately for the enlarged screening (groups 2, 4 and 5) and for the focused screening (groups 1 and 3). The slightly basic pH measured at all four sites is typical of urban runoff in the Paris region and can be explained by the pH of natural soils in this region, as well as the buffering effect of road construction materials. It is consistent with the range of pH values usually measured at roads and parking lots [5,21]. The conductivity, TSS and DOC concentrations varied in a wide range from one rain event to another, which is typical for urban runoff due to the variability of antecedent dry weather duration, rain depth and rain intensity [5,22], but also variations over time at sources, e.g., road salt application in winter. Though the number of sampled rain events was very limited for groups 2, 4 and 5, the range of observed concentrations was as large as that observed for groups 1 and 3. The two sites with high traffic loads (P and C) showed much higher TSS concentrations. This was confirmed by the exceedance probability distributions (Figure 1), which were similar for P and C. In the case of R site, the TSS distribution covered a wide range; very high TSS EMCs were observed for some events, which could be explained by the influence of nearby construction work and resuspension of sediment in the stormwater pipe. V site showed the lowest TSS and DOC concentrations, as well as conductivities. Some outliers in the conductivity distributions were noticeable for C and R. They corresponded to salt application in the winter for C, while illegal spills from construction work were suspected for R, as we also noticed very high pH values (>9.0) for these events. The DOC distributions were quite similar between V, R and C, while P showed higher concentrations. This could be linked to the very dense urban context of the Paris site.
Table 4.
Physicochemical characteristics of runoff samples—median (min–max) concentrations.
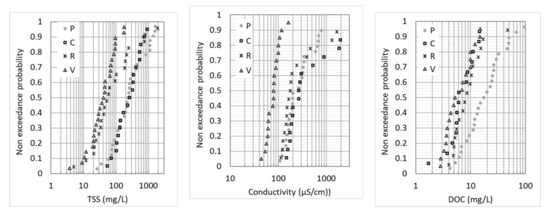
Figure 1.
Non-exceedance probability distributions of EMCs for the TSS, conductivity and DOC at the four study sites.
3.2. Micropollutants in the Road and Parking Lot Runoff—Prevalence and Concentration Ranges in the Targeted Screening
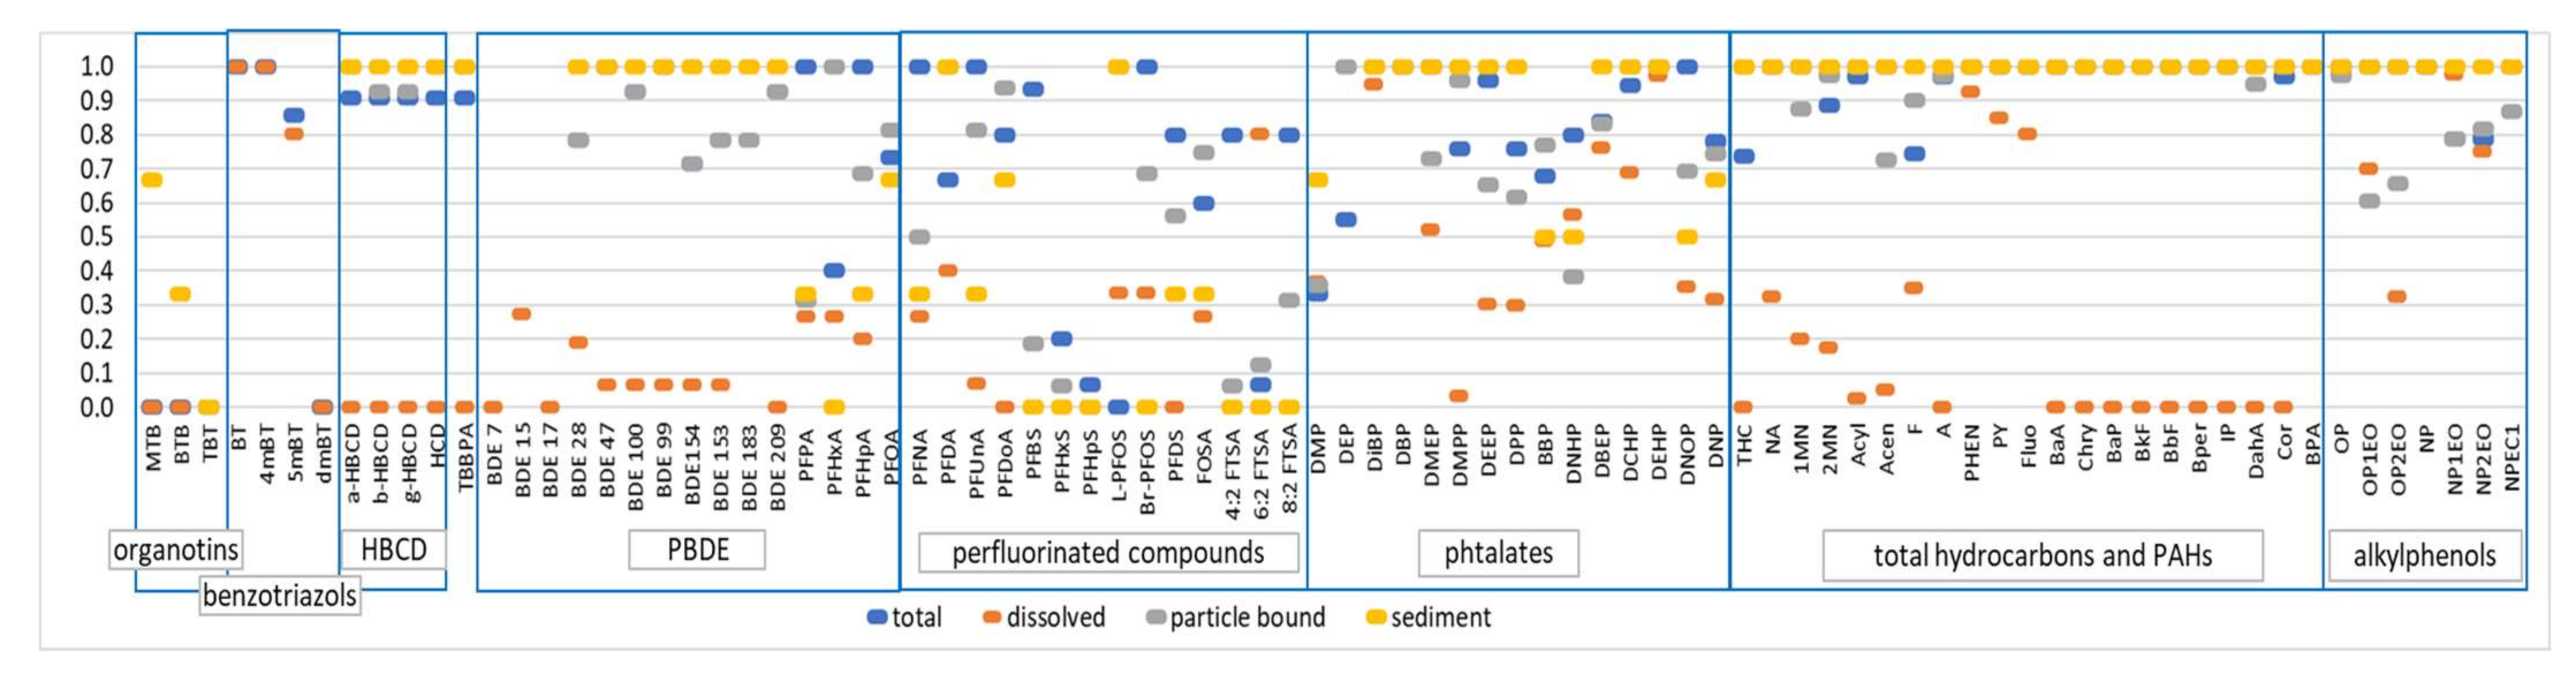
The median total concentrations, as well as the first and last deciles (Q10 and Q90) of quantified EMCs over all rainfall events and sites, are given in Table 5, Table 6 and Table 7 for the different groups of chemicals monitored. The quantification frequency in the total fraction is also provided. Figure 2 illustrates more precisely the quantification frequency of the target organic pollutants in the dissolved and particulate phases or in sediment.
Table 5.
Inorganic elements analyzed in the runoff; environmental quality standards (EQS); quantification frequency and range of quantified total EMC concentrations (first decile Q10, median and last decile Q90) over the 4 study sites.
Table 6.
Organic micropollutants (group 3) analyzed in the runoff, quantification frequency and range of quantified total EMC concentrations.
Table 7.
Organic micropollutants (groups 4 and 5) analyzed in the runoff, quantification frequency and EMC total concentrations.
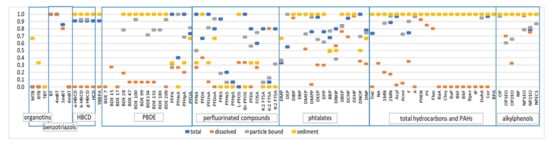
Figure 2.
Quantification frequency (y-axis, in a fraction of the collected samples) of the targeted organic pollutants in the dissolved phase, particulate-bound phase and sediment.
For inorganic elements, almost all major elements, trace metals and REE were detected in the runoff. For the trace metals, all elements were quantified except selenium. For most metals, an occurrence close to 100% was observed. Only Cd and Cr showed slightly lower occurrences, which remained above 90%. For elements such as Zn (36–932 µg/L, Q10-Q90), Cu (15–570 µg/L), Pb (5.3–98 µg/L) or Ni (2.4–32.3 µg/L), the concentration ranges varied by one or more orders of magnitude from one sample to another but were consistent with those reported in the literature [23]. The abrasion of tires (Zn, Cu and Cd) and brakes (Cu, Zn, Ni, Pb, Sb and Cd) is a major traffic-related source of these metals, as well as engine and vehicle body wear (Cr and Ni) [4,23,24]. This study provided relatively new information for previously little documented metals such as Co (0.3–6.5 µg/L), Mo (0.6–21.8 μg/L), Sb (1.3–39.8 μg/L), Sr (44–246 μg/L), V (3.6–36 µg/L) and Ti (75–1594 µg/L). Co and Ti are potentially emitted from traffic areas [23] due to their use in diesel (Co) and white road marking paint (Ti). Sb is especially relevant, as it has a clear traffic-related source from brake pad wear and is recognized for its toxicity [23,24]. Gietl et al. [25] showed that Ba (25–361µg/L) could be considered a tracer of brake dust in urban air and that it correlated highly with Cu and Sb. It is thus also likely to be a tracer of traffic contamination in runoff.
For organic pollutants, out of the 87 pollutants searched for, only a few compounds were not detected, i.e., three organotin (MBT, DBT and TBT, LQ = 0.02 µg/L); the three oxygenated ethers (MTBE, ETBE and LAME, LQ = 1 µg/L); chloroalkanes (C10–C14, LOQ = 50 µg/L); LAS (LQ = 10 µg/L) and two PFASs (PFHxS and PFHpS, LQ = 0.6 ng/L). Organotins were, however, detected in sediments (Figure 2). The non-detection of these molecules resulted from the relatively high quantification limits and/or their low presence in the runoff. The non-quantification of oxygenated ethers in the runoff, although they are potentially emitted following the combustion of fuels, could be linked to their very rapid volatilization due to their physical–chemical properties. Previously reported concentrations of MTBE ranged from 0.03 to 1.9 µg/L [26,27,28]. A recent study indicated that the concentrations of oxygenated ethers were below 0.03 µg/L [20]. The concentration differences between these studies could be related to changes in the composition of the petrol. Since 2009, the European directive on specifications for petrol, diesel and gas oils has limited the maximum concentration of MTBE to 15% by volume. It is possible that the change in fuel composition has led to a decrease in MTBE emissions from vehicles in Europe, which explains the low occurrence observed in this study. Despite a relatively low LQ (0.02 µg/L), organotins were not detected. These compounds are not often studied in runoff. According to Zgheib et al. [8], concentrations in stormwater from larger catchments typically vary between 14 and 572 ng/L for MBT, between <10 and 516 ng/L for DBT and between <10 and 78 ng/L for TBT. MBT was quantified by Stachel et al. [29] in the road runoff at a median concentration of 20 ng/L, while the TBT concentrations were <1 ng/L. An environmental quality standard (EQS) for TBT was set at 0.2 ng/L [30], which is very low compared to the usual LQs. LAS were also not detected in runoff water. Like organotins, this family of molecules, potentially used in certain automotive oils, is very poorly documented. To date, only one study has analyzed LAS in road runoff and pointed out much higher concentrations (43–590 µg/L) [28]. As expected, due to their physical-chemical properties, PAHs and PBDE are mainly detected in the particulate fractions (suspended solids or sediments) rather than the dissolved phase (Figure 2). For PFASs, important differences in quantification frequencies are observed between congeners, as well as between dissolved or particulate fractions.
Phthalates, followed by benzotriazoles, PAHs, bisphenol A and alkylphenols, exhibited the highest concentrations, ranging from a few µg/L up to 20 µg/L. For phthalates, DEHP (4–53 µg/L) dominated the profiles. A previous study where more congeners within this family were monitored also observed significant concentrations of DEHP (mean concentration of 3.7 µg/L for street runoff) but indicated that the patterns were dominated by diisodecyl + diisononyl phthalates (DIDP + DINP), a technical mixture of phthalates replacing DEHP with an average concentration of 17 µg/L for street runoff [20]. For DMP, DBP, BBP and DNOP, the concentrations previously measured in road runoff [29] were an order of magnitude lower than those measured in the present study. The levels of the benzotriazoles were in the same order of magnitude than those reported [20] in Berlin, Germany.
Extensive literature indicates that PAHs are emitted by vehicle traffic via gas exhaust, tire wear and spilled oil [32]. In this study, the PAH fingerprints were relatively similar between sites and were also comparable with patterns reported in the literature, i.e., featuring a predominance of heavy molecular weight PAHs (HMW; i.e., 5 to 6 aromatic rings) over low molecular weight PAHs (LMW; 2–4 aromatic rings). The assessments of the different PAH indexes commonly mentioned in the literature (HMW/LWM ratio, PHEN/A or BaA/Chry, etc.) confirm a mixture of pyrolytic and petrogenic sources. The Σ16 PAH concentration was within the range of EMCs values reported in the literature for urban roads and motorways [20,22]. Parking lot runoffs exhibited lower concentrations than those reported for mixed stormwater from larger urban catchments in France [7,8], while runoff concentrations from the heavy trafficked sites (C and P) were comparable or superior to the urban scale values. Very high concentrations of PAHs were occasionally observed at the R site but are related to exceptionally high TSS concentrations (>700 mg/L). As previously mentioned in the section dedicated to global parameters, these high concentrations are linked to the formation of deposits in the pipe and to the resuspension of these deposits during certain rain events. Similar to metals, the differences in the concentrations observed for PAHs or total hydrocarbons are partly due to the difference in TSS concentrations but also due to the differences in particle contaminations. Much lower PAH contents were observed for TSS from R site (median Σ16 PAH = 6750-ng/g dry weight, dw) compared to the P and C sites (median Σ16 PAH, respectively, 12,378 and 15,397-ng/g dw) and V site (median Σ16 PAH = 19,398-ng/g dw), which might indicate a different source of suspended solids at R site, which may be linked to construction work.
The PFASs, PBDEs, HBCDD and TBBPA were in the 0.1–10 ng/L range with the exception of BDE-209, which presented much higher concentrations (3.0–72.1 ng/L). The concentrations of HBCDD and TBBPA ranged from 1.5 to 13.8 ng/L and 0.1 to 1.7 ng/L, respectively. As TBBPA and HBCCD were, for the first time, studied in runoff, a deeper explanation is here provided. TBBPA and HBCCD are flame retardants and were investigated here for the first time in runoff. TBBPA is used for its flame-retardant properties in plastics, resins and printed circuit boards. HBCDD is used mainly in thermal insulation foams and in textiles. Its production leads to a mixture of three diastereomers named alpha (α), beta (β) and gamma (γ). In general, commercial HBCDD has a γ-isomer at about 80–85%, an α-isomer at 8 or 9% and a β-isomer at 6%. Other commercial forms of HBCDD are available, each form containing different proportions of the three stereoisomers [33]. In runoff, the observed pattern is dominated by a significant contribution from the α-isomer (on average 64%), followed by the γ-isomer (25%) and, finally, the β-isomer at 10%. In Europe, from a regulatory point of view, HBCDD is part of the group of brominated flame retardants on the list of priority substances established by the Commission of the Convention for the Protection of the Marine Environment of the Northeast Atlantic (OSPAR Commission 11). For the European Union, HBCDD is one of the PBT (persistent, bioaccumulative and toxic) substances of very high concern referred to in article 57 d) of the REACH regulation and is one of the candidate substances for the authorization procedure.
Traffic-related materials are considered to be a potential source of PFASs in road dust [34]. PFASs, including carboxylic acids and sulfonates, have been detected in automotive grease and other parts of automobiles, including seats, steering systems, suspension and brakes. In the present work, PFASs were ubiquitous, with concentrations of individual compounds in the range <LQ 125 ng/L. In most samples, the PFAS molecular pattern is dominated by PFOA, followed by 6:2 FTSA, PFOS and long-chain carboxylic acids, albeit at low levels. This is in good agreement with Kim and Kannan [35], who reported a similar pattern in urban surface runoff water. In this study, the authors reported higher concentrations of PFOA at a site influenced by heavy traffic. It is noteworthy, however, that, when the short-chain carboxylic acid PFPeA was detected, it was by far the dominant compound. Such a finding might be related to local, distinct sources or to the transformation of precursors such as FTSAs. PFPeA was also detected in street sweeping from the US, although its contribution was lower than in the present work [34].
3.3. Inter-Site Variability of Concentrations—Targeted Screening
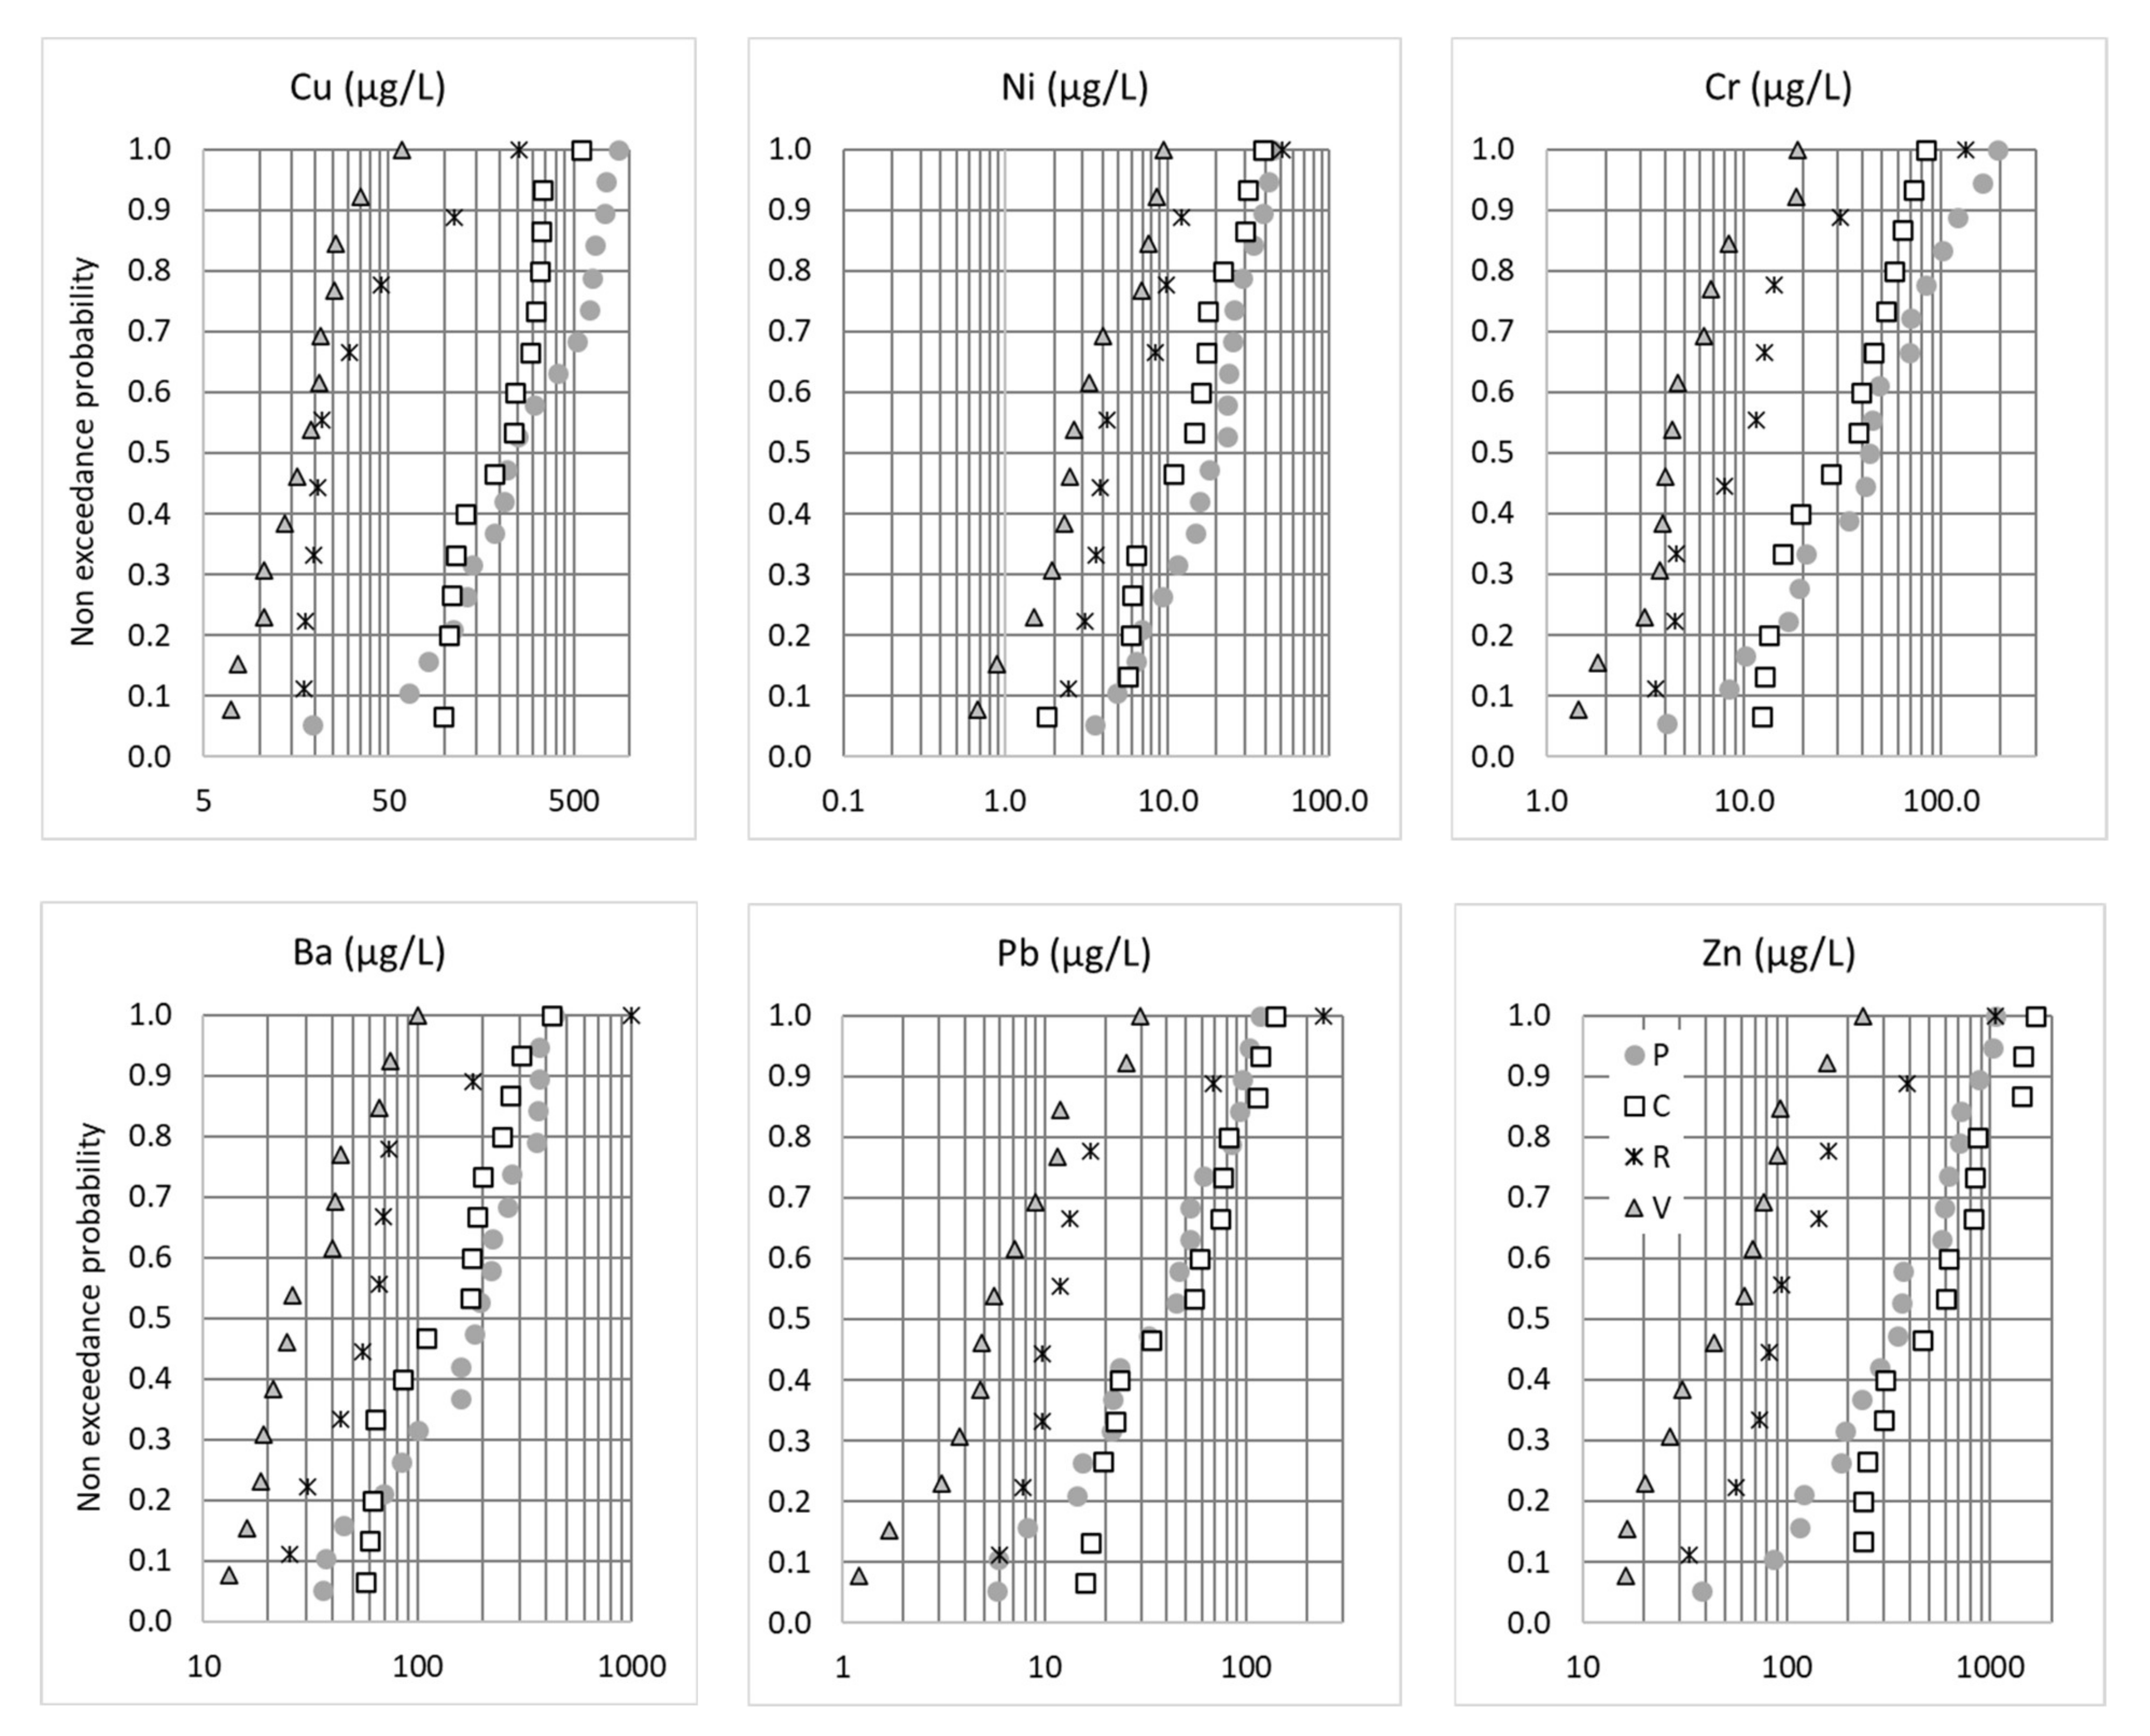
For a significant proportion of the metals known to be tracers of car traffic, including Cu, Zn, Pb, Ni, Cr, Sb and Ti [36], the concentrations at the P and C sites were the highest, while the concentrations at V site (i.e., the parking lot) were the lowest (Figure 3). These findings are consistent with the traffic area categories and traffic density of the different sites [23]. While the P site, which has the highest daily traffic loads, showed the highest concentrations for Cu, Ni, Cr and Ba, this was not true for Pb and, especially, Zn, for which the highest concentrations were observed for the C site. This may be explained by the differences in traffic fluidity: frequent braking and restarting due to traffic jams at the P site can enhance the brake pad, tire wear and exhaust-related emissions, while at C site, where traffic was fluid, increased Pb and Zn emissions might be linked to the high rate of lories and the presence of a galvanized guardrail. The Zn/Cu ratio was lowest for P (median 1.21), higher for V and C (respective medians 2.9 and 2.6) and highest for R (median 3.6). These ratios appeared low compared to what is usually measured in traffic areas (usual range cited by Reference [23] was 3–5), which could be linked to the total extraction of the particulate phase used in our study. Lower Zn/Cu in Paris could be an indicator of a higher contribution from brake pads. For the R site, non-traffic-related contributions were suspected for some samples. Indeed, contrary to all the other sites and pollutants, the Cu and Ba distributions at this site did not follow a log-normal distribution. As already noted for the conductivity and TSS distributions, outliers in the distribution curve were observed that might be linked to construction work.
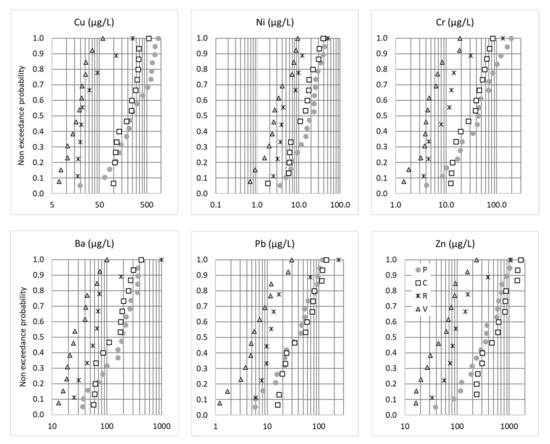
Figure 3.
Non-exceedance probability distributions of the total EMCs (µg/L) for Cu, Ni, Cr, Ba, Pb and Zn. P = Paris, C = Compans, R = Rosny-sous-Bois and V = Villeneuve-le-Roi.
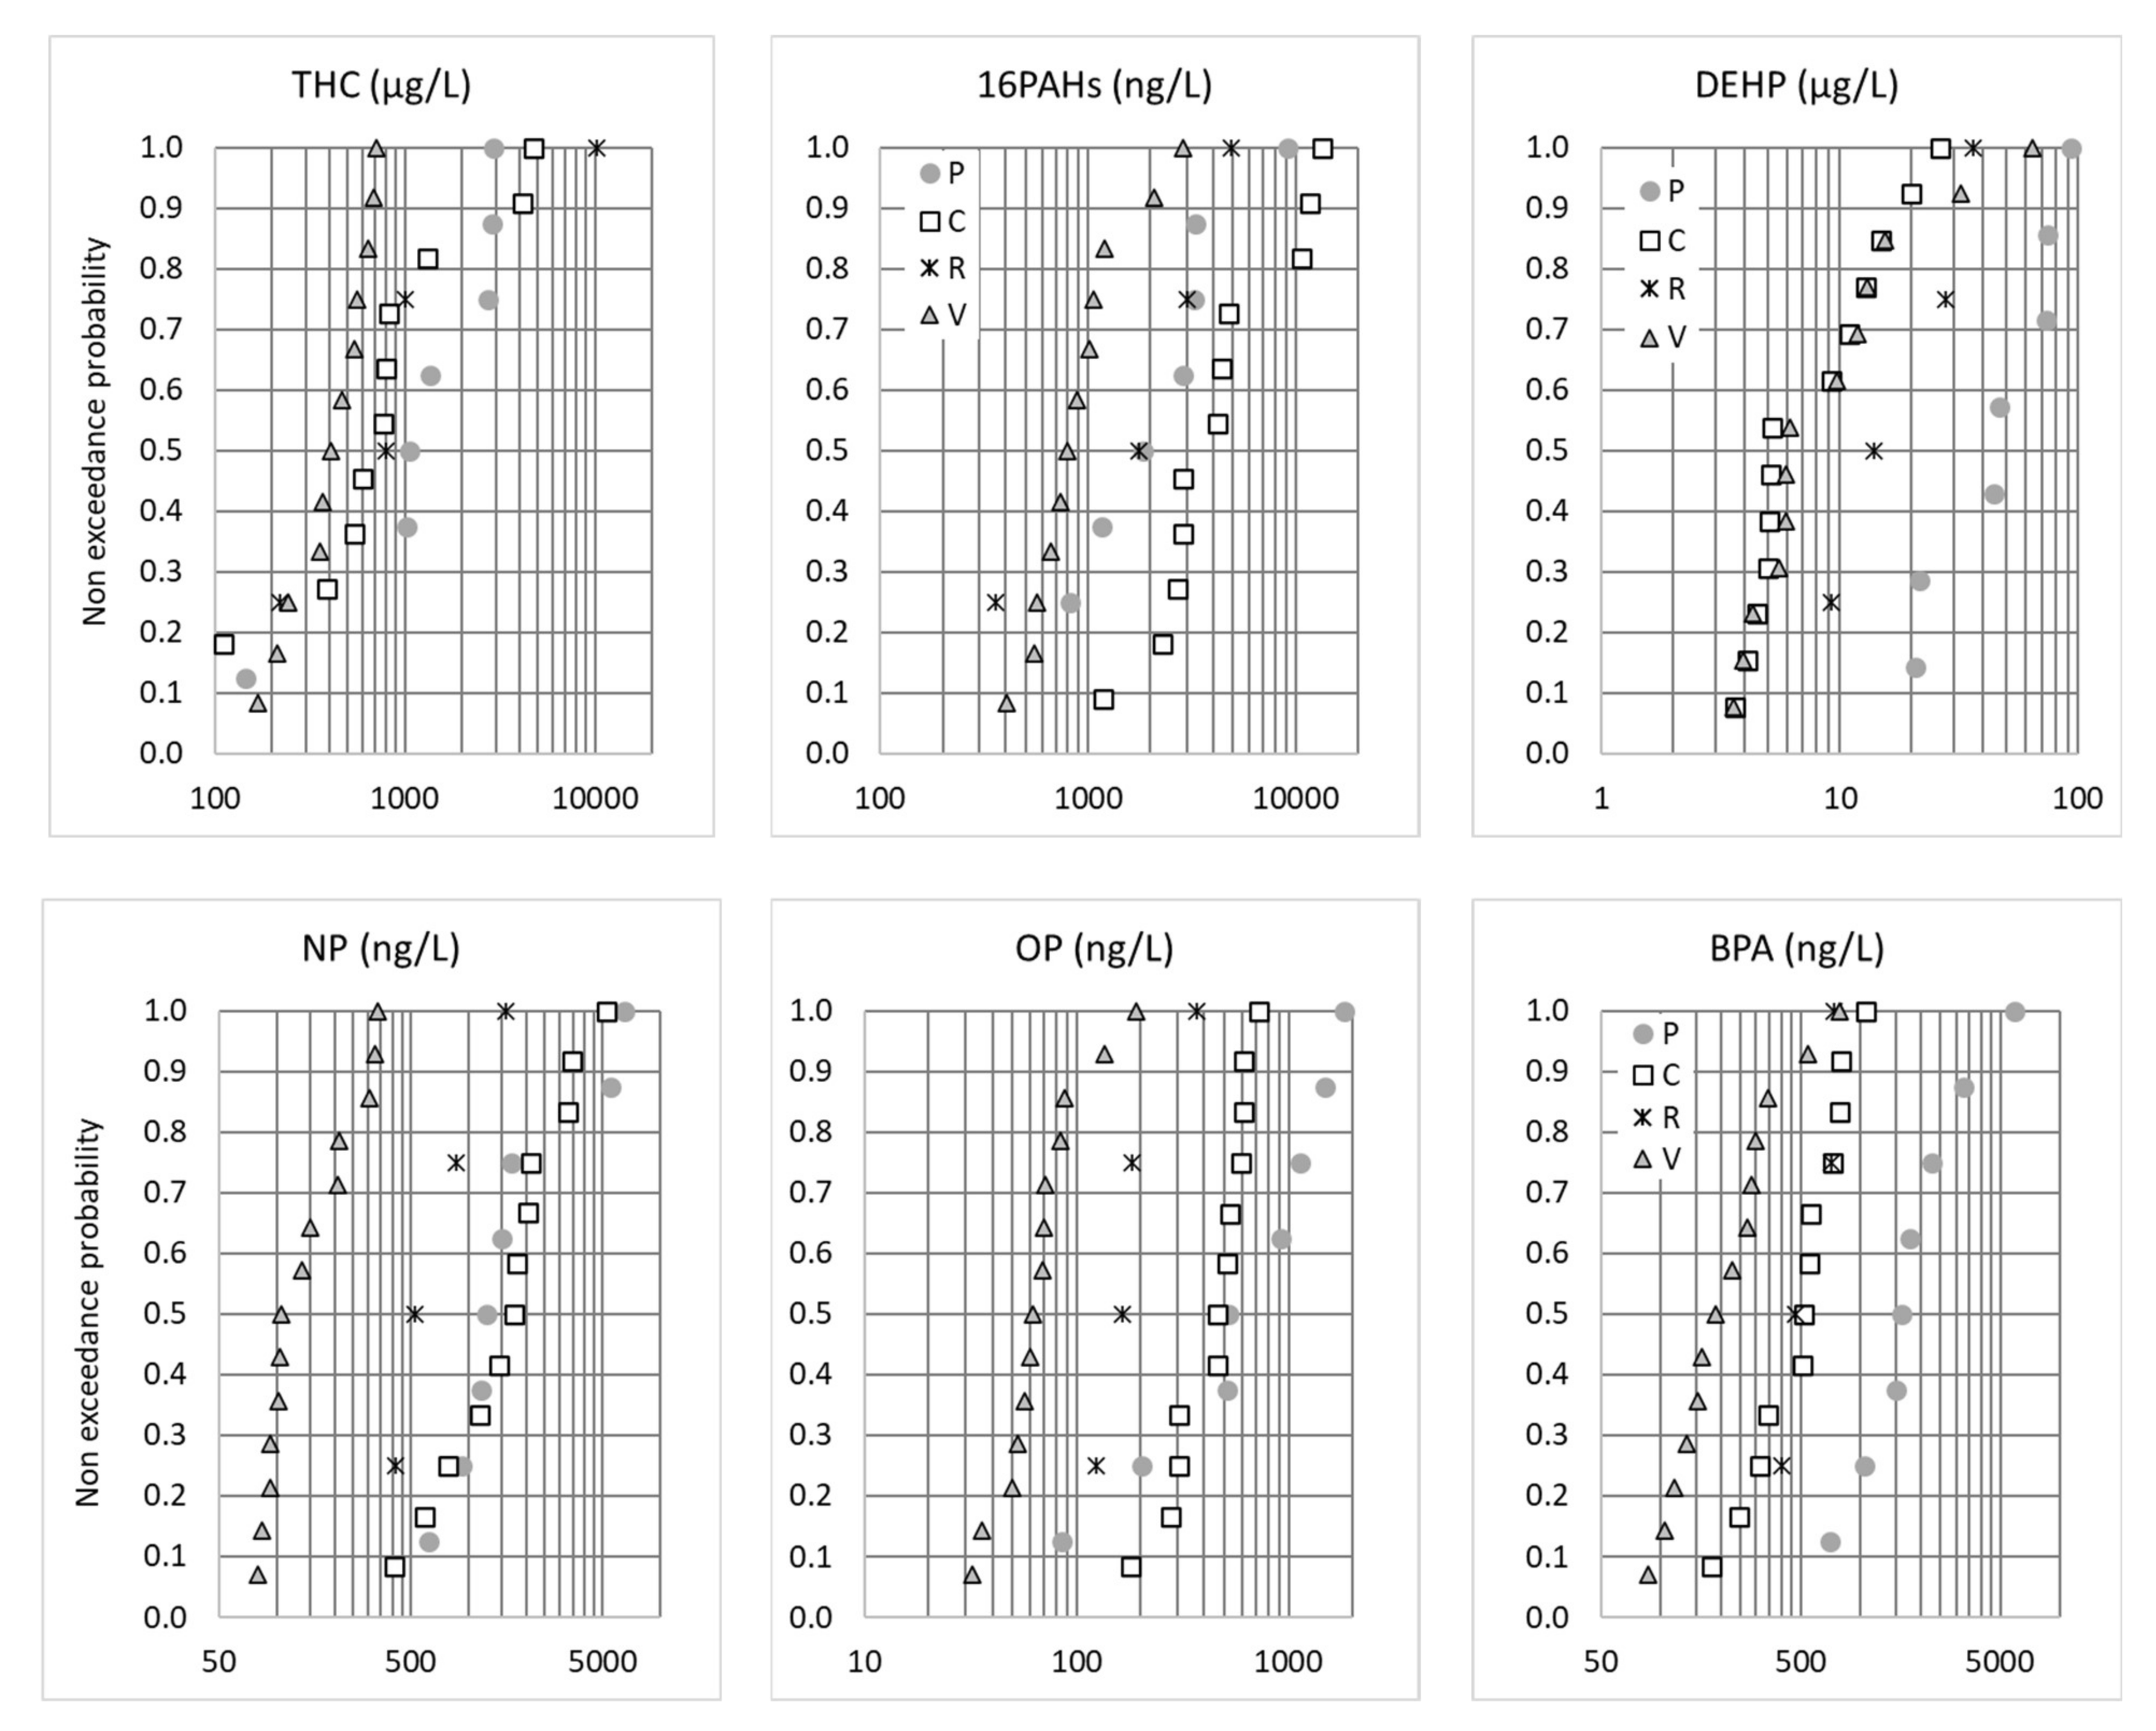
Some organic pollutants—BPA, alkylphenols, PAHs and PBDEs—presented inter-site profiles similar to what was observed for traffic-related metals, i.e., the highest concentrations at the P and C sites and the lowest concentrations at the V site. Figure 4 illustrates the distributions of the EMC concentrations for the THC, Σ16 PAHs, DEHP, BPA, NP and OP. The C and P sites had the highest vehicle traffic densities (2 × 11,000 and 40,000 vehicles/day, respectively) in comparison with the R and V sites (<3000 vehicles/d and one to three rotations per day, respectively). As such, higher concentrations were expected for organic micropollutants for which significant traffic-related emissions have been documented: total hydrocarbons and PAHs emitted by exhaust gases, tire wear and motor lubricant oils [9] and BPA, NP and OP emitted by brake fluids, car bodies and tires [37,38], as well as phthalates, especially DEHP, emitted by car exhaust [39] and tire abrasions [39,40]. As recently proposed by Wicke et al., who observed correlations between some phthalates and traffic, the release of phthalates could also be linked to the application of plastisol for the protective undercoating of vehicles [20]. However, the concentration profiles of these micropollutants cannot be explained by traffic density alone. For PAHs and, to a lesser extent, NP, the highest concentrations were measured at C site, which had a lower traffic density than P site but higher heavy goods vehicle (HGV) traffic. On the contrary, much lower BPA concentrations (similar to R site) and DEHP concentrations (similar to V site) were measured in C compared to P. These pollutants could be influenced not only by traffic but also by the immediate environment (buildings, street furniture, etc.) of the road. The C highway is situated in a suburban area, and the immediate surroundings mainly consist of green areas, while the P site is in a very dense city center. BPA is mainly used as a monomer in the manufacturing of polycarbonate plastics, as well as in epoxy resins [41]. It is also an additive introduced during the production of PVC, varnishes and paints. Similarly, DEHP is a common plasticizer that is used to produce polymers and, especially, polyvinyl chloride (PVC).
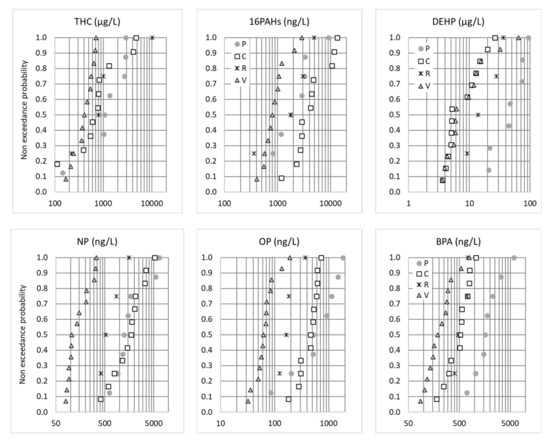
Figure 4.
Non-exceedance probability distributions of the total EMCs (µg or ng/L) for THC, 16PAHs, DEHP, BPA, NP and OP. P = Paris, C = Compans, R = Rosny-sous-Bois and V = Villeneuve-le-Roi.
For PFASs, despite the limited number of rain events sampled, the R site stands out from the other sites as having much higher concentrations but also very different profiles than the other sites. Previous studies have demonstrated the importance of road traffic in the contamination of runoff by PFAS [35,42]; this trend was not observed here. PFAS emissions at R site may be linked to both potential sources and/or illegal dumping from nearby construction work. Due to the limited number of published studies and the intra-site variability linked to the type of rain events sampled, no significant trend can be drawn between the other sites.
3.4. Non-Target Screening: Comparison of Site Signatures and New Compounds of Interest
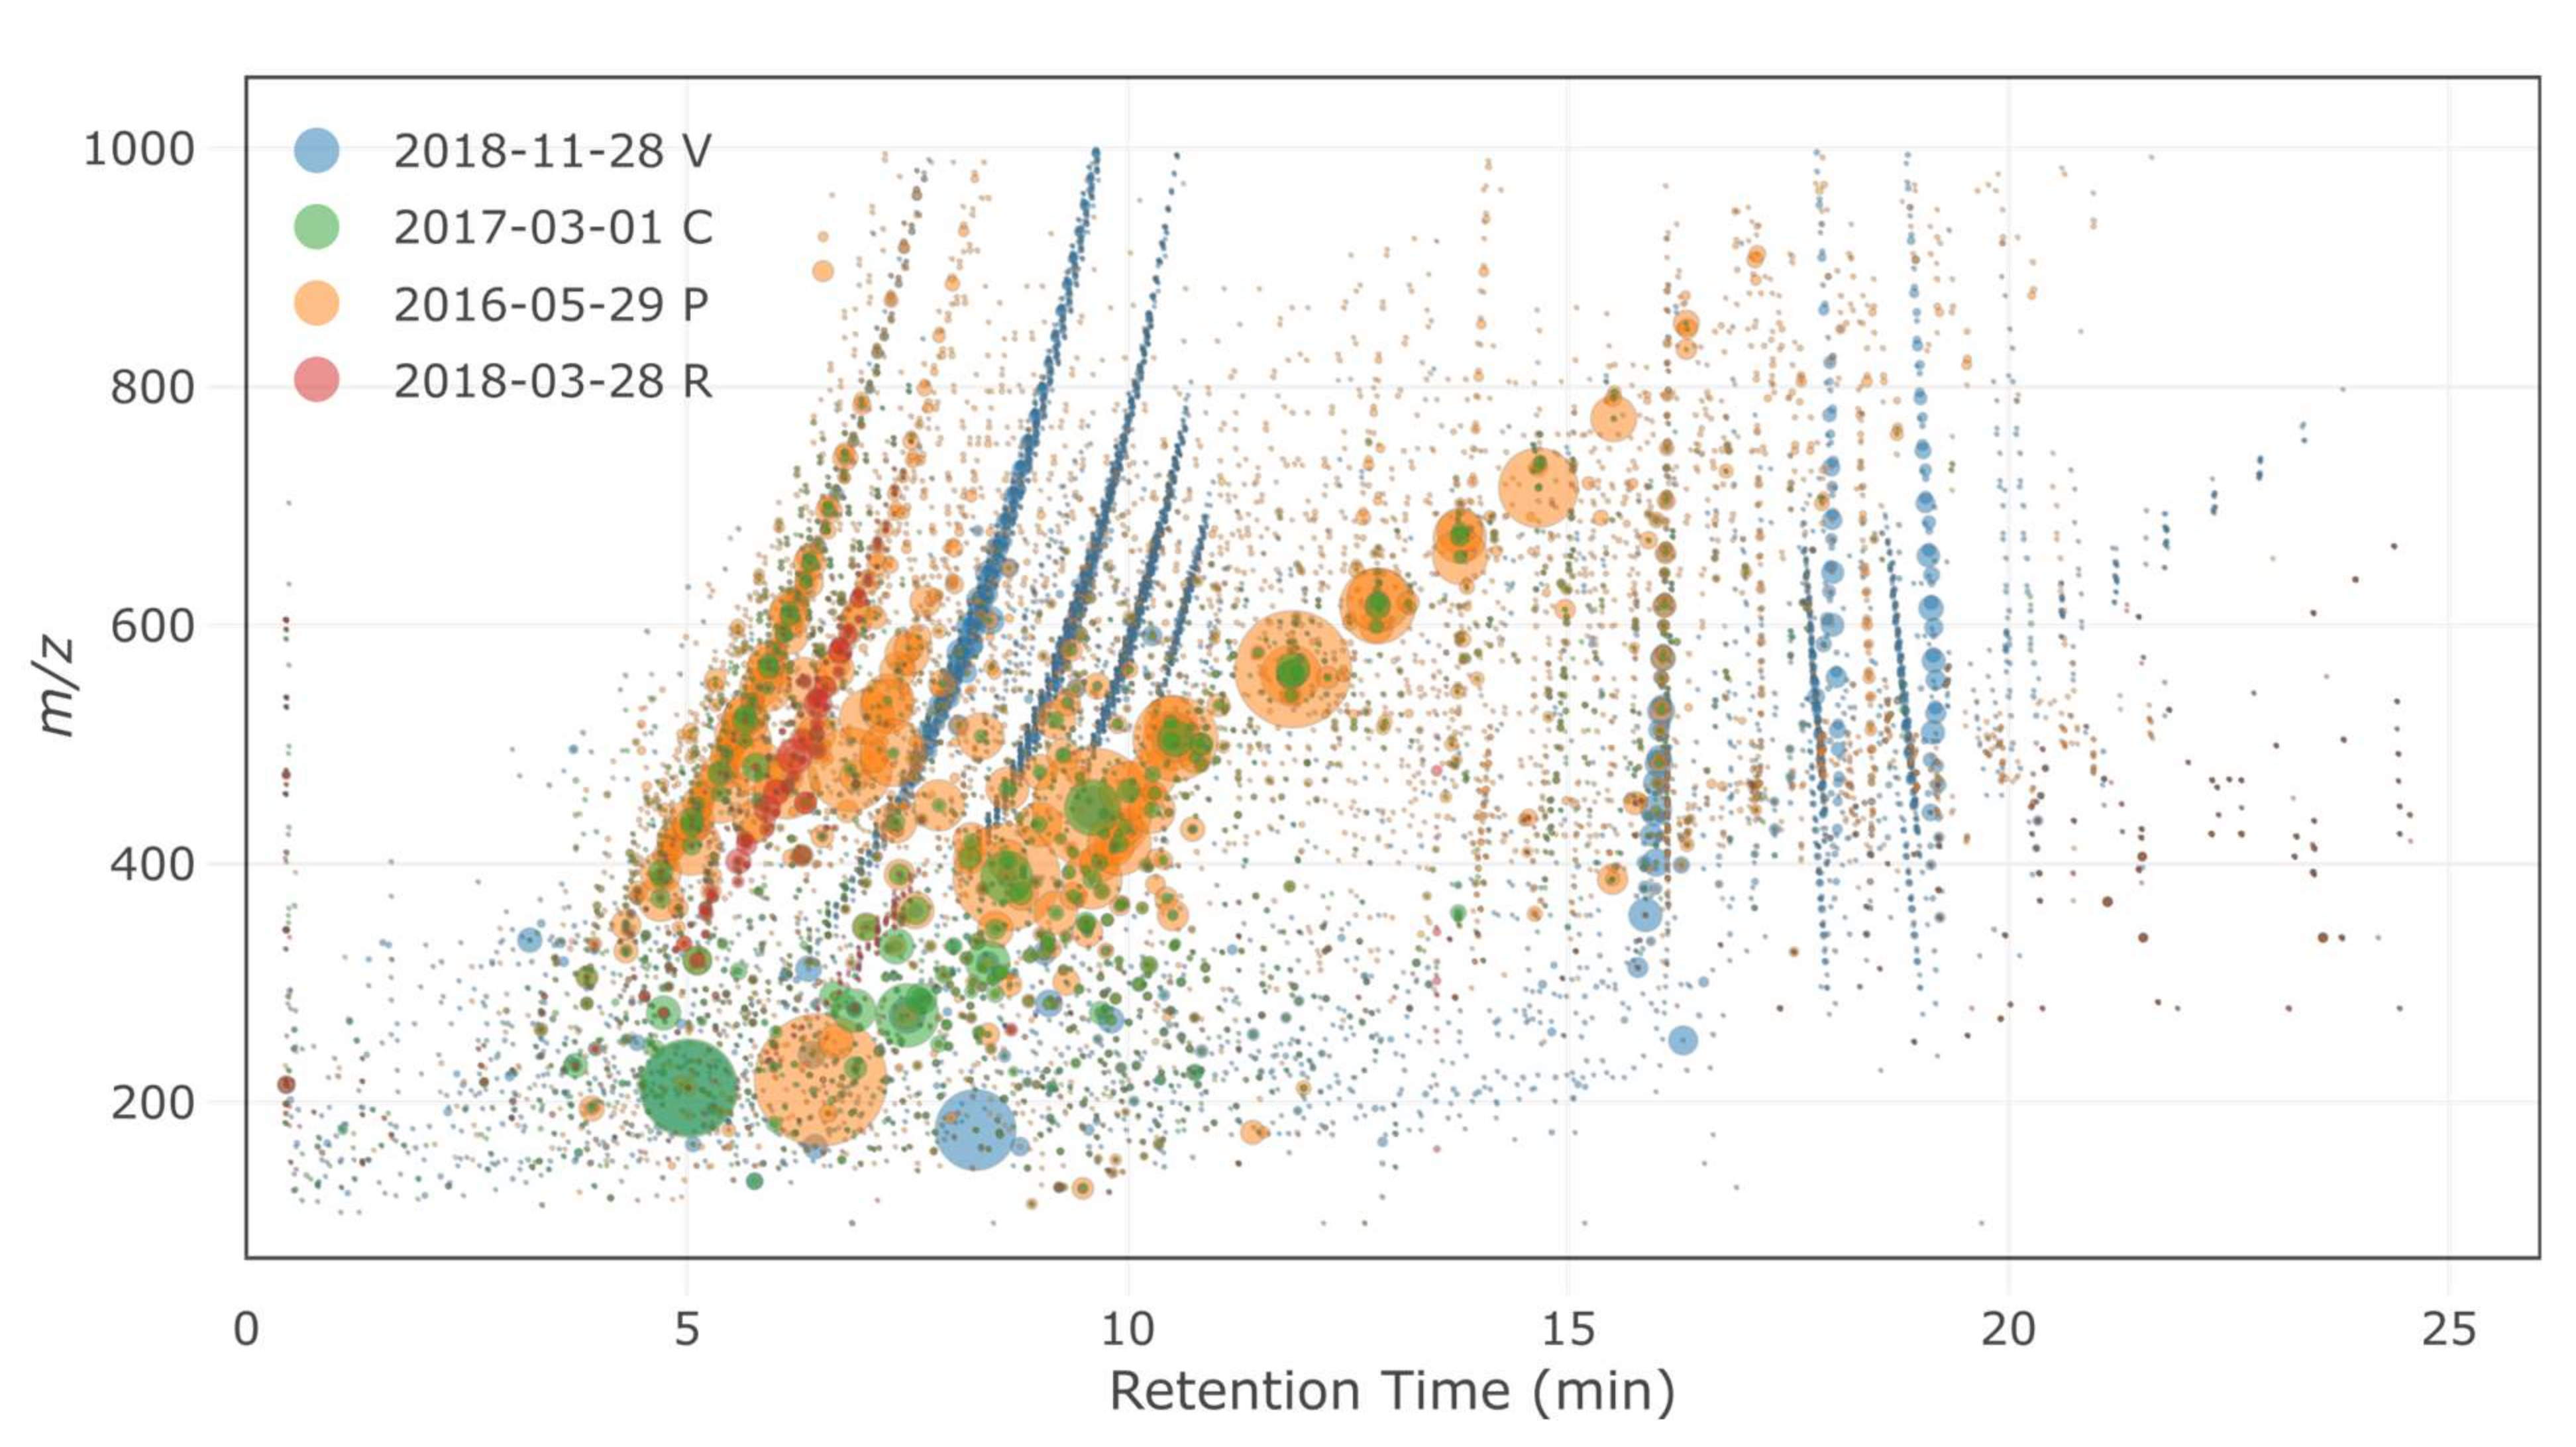
For the four sites considered (P, C, R and V), HRMS fingerprints (i.e., bubble plots of all detected features) were first compared to visualize the differences between samples in terms of compound diversity and signal intensity (Figure 5). Each site exhibited specific features (i.e., a specific chemical composition), and a low proportion of features was generally common between several samples and/or sites. The highest proportion of common features was found between the C samples and the P samples, which might be attributed to high-traffic-related compounds. These features only represented half the number of features of each site, indicating that site-specific features were still important. The number and total intensity of the features generally followed the respective intensities of traffic at each site (i.e., more intense and more numbers of features with higher traffic). Sites V and R each showed very distinct features, with only a minor proportion of markers present at the other sites.
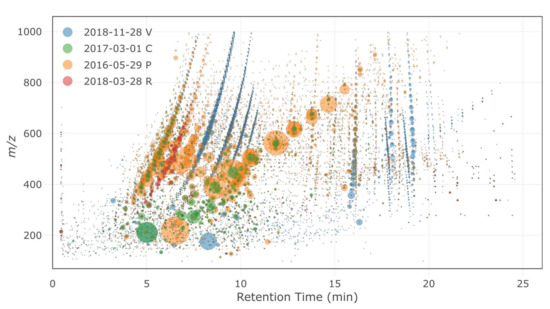
Figure 5.
HRMS fingerprints of the selected samples (P = Paris, C = Compans, R = Rosny-sous-Bois and V = Villeneuve-le-Roi). The sizes of the bubbles are proportional to the area of the feature.
A suspect screening approach was applied to search for compounds of interest, including the rubber vulcanization accelerator DPG and other additives. DPG was detected in all samples, with the highest intensities at the C site, which might be related to the higher proportion of HGV present at this site. While the rubber antioxidant 6PPD itself was not detected in the samples, its toxic decomposition product 6PPD-quinone was present in most samples.
Benzotriazole was mostly present at the P and C sites, in accordance with the traffic density and the related emission of particles from tires [43]. Benzothiazole was not detected, which could be related to a higher proportion of this compound in the particulate phase. Most benzothiazole derivatives and butylphenols were not detected, except 2-hydroxybenzothiazole, aminobenzothiazole and t-butylhydroquinone, although their presence was not definitely confirmed (i.e., by injection of the corresponding analytical standards). DPG and benzotriazole were unambiguously confirmed, and semi-quantification was performed (Table 8).
Table 8.
Organic micropollutants potentially detected by HRMS suspect screening in ESI+ mode.
In the second phase, non-targeted screening approaches were followed using multivariate analyses to tentatively identify HRMS features that were the most specific to each site. A principal component analysis was first performed with all features detected at the four sites (Figure S1). The first principal components (PC1 and PC2) clearly discriminated between the sites and some rain events (Figure S1). PC1 was especially representative of the very specific features obtained from the R site, while PC2 mostly separated the samples from the low-traffic sites (V and R) from the high-traffic ones (C and P). The C and P samples were very close, except for one rain event at the P site (16-05-29). This rain event was especially discriminated within the third component (PC3) and showed features of much higher intensity as compared to other rain events at the P site. Some of the most discriminant features were tentatively identified (Table S11). Some fluorinated compounds were found at the R site (proposed structures ethyl-4,4,4-trifluoro-3-hydroxybutanoate and 1-(2,2-difluoroethoxy)-3-decanol). A series of polyethylene glycols (PEGs) were identified at the high-traffic sites (P and C) and were present at high intensities at those two sites. A more detailed identification of the features specific to the R and C sites (e.g., PEGs series) was described in Reference [16] (submitted to the same Special Issue).
4. Discussion
On the basis of the new knowledge gained by this study on poorly investigated compounds in runoff, the relevance of this contamination and the partitioning of these micropollutants between dissolved and particulate fractions, as well as the on-site depollution strategy, are discussed in the following section.
4.1. How Significant Is Road Runoff Contamination?
As initially proposed by Zgheib et al. [8] and more recently by Wicke et al. and Brudler et al. [20,44], the EMC concentrations in runoff can be compared with environmental quality standards, as reported in Table 9. The annual average EQS (AA-EQS) defined by European and French regulation [30], as well as environmental guideline values suggested in France by INERIS (https://substances.ineris.fr (accessed on 16 December 2021)) for some micropollutants that are not targeted by the regulation, were taken into account. The AA-EQS were compared to the site mean EMCs. The most significant exceedances of the EQS were observed for two HMW PAHs, BaP and Fluo (EMC/AA-EQS >100). Exceedances by more than a factor of 10 were also observed for Cu and DEHP. Ten substances showed exceedances of the EQS by a factor between 1 and 10, namely three metals (As, Sb and Zn); BPA; NP and OP; HBCDD, the sum of PBDE; PFOS and one PAH (A).
Table 9.
Importance of the EMC/AA-EQS ratio, with the EMC:highest site mean EMC (the total concentrations are considered for organic micropollutants and dissolved concentrations for metals) and AA-EQS environmental quality standard expressed as the annual average concentration. (French regulatory values [30] or INERIS suggested guidance values).
With the exception of HBCDD, Sb and PFOS, which were not measured in their study, similar conclusions were drawn for urban stormwater from large urban catchments [8]. In the case of organotins, which were not detected in this project, Zgheib et al. [8] pointed to a significant potential risk, with exceedances of between 100 and 200 for TBT and above 1000 for MBT and DBT. However, Wicke et al. [20] confirmed our results, as they found the TBT, MBT and DBT concentrations to be inferior to 10 ng/L in their urban runoff samples. They also compared micropollutant contamination profiles of stormwaters from different urban land uses, including streets with traffic densities superior to 7500 vehicles/d. Similarly, they found EQS exceedance for four PAHs, DEHP, Cu and Zn, but for PFOS, NP, OP, BDE and HBCDD, their LQ was superior to the EQS. For land uses other than streets, some biocides also showed EQS exceedance. Brudler et al. [44] evaluated the EQS exceedances, as well as toxic impacts, of urban stormwaters based on a review of international data and LCIA calculations. Metals, especially Cu, followed by Zn, were identified as the main contributor to ecotoxicity impacts.
In Berlin [20], road runoff was found to be the major source of contamination for PAH, benzothiazole, benzotriazole, DEHP, Ni, Cr, Ti and V, as well as a strong contributor to Cu and Zn. This is consistent with the substance flow analysis performed for PAH, Cu and Zn [45] and/or phthalates [6]. Construction materials (roofs, facades and urban furniture) and catenaries are another important urban source for Cu and Zn [46]. For alkylphenols, important contributions, from traffic emissions to urban stormwater loads, have been highlighted [6].
As we noticed, based on the comparison of the four traffic areas studied in this paper, the contamination levels may vary in a wide range, depending on the traffic density and fluidity, as well as the surroundings. The trends observed with results from targeted micropollutants analyses were confirmed by non-target screening, providing additional information about traffic-related markers (e.g., DPG) but also allowing the identification of site-specific compounds. Yet, even at the V site, which is a residential parking lot with very limited traffic showing much lower concentrations than the densely trafficked roads of P and C, some micropollutants exceeded the AA-EQS thresholds. This means that even low-trafficked areas have to be considered as contributing to the diffuse pollution of freshwater-receiving bodies. As indicated by both target and non-target screening, a high variability of contaminations can also be expected across different rain events at the same site.
For some metals for which local geochemical background values are available [47,48], the enrichment factors for TSS transported by runoff can be assessed [49]. The highest enrichment factors were observed for Sb, with a median value of 45 and an average of 74. For this element, the strongest enrichment was observed at the P and C sites (114 and 149, respectively), which were also the sites with the highest traffic intensity compared to the other sites (30 for R and 23 for V). This demonstrated the traffic-related origin of Sb, the most enriched element in the Seine River [50]. A significant, but lesser, enrichment was also observed for Cu (25 and 44 median and average values for all the sites combined) and Zn (22 and 21). Cu and Zn followed the same trend as Sb between the sites, but in the case of Zn, there was less variation in the enrichment factor between the contaminated sites (30 and 26 for the P and C sites) and the sites less impacted by traffic (16 and 12 for the R and V sites). Cu, Zn and Sb have been identified as urban markers, as well as Pb and Cd [47]. The enrichment factors for Pb and Cd were lower (median values of, respectively, 7 and 5) and did not show a clear trend with traffic density, suggesting that Pb and Cd are not univocally related to vehicle emissions. For the other metallic elements, the enrichment factors were quite low. For Ag, As, Ni and Co, this enrichment did not exceed 2. These unique data proved that, in the Seine River Basin, those elements (Ag and As) that are noticeably enriched in the river sediments [51,52] are not related to traffic.
4.2. Distribution of Pollutants between Dissolved and Particulate Phase
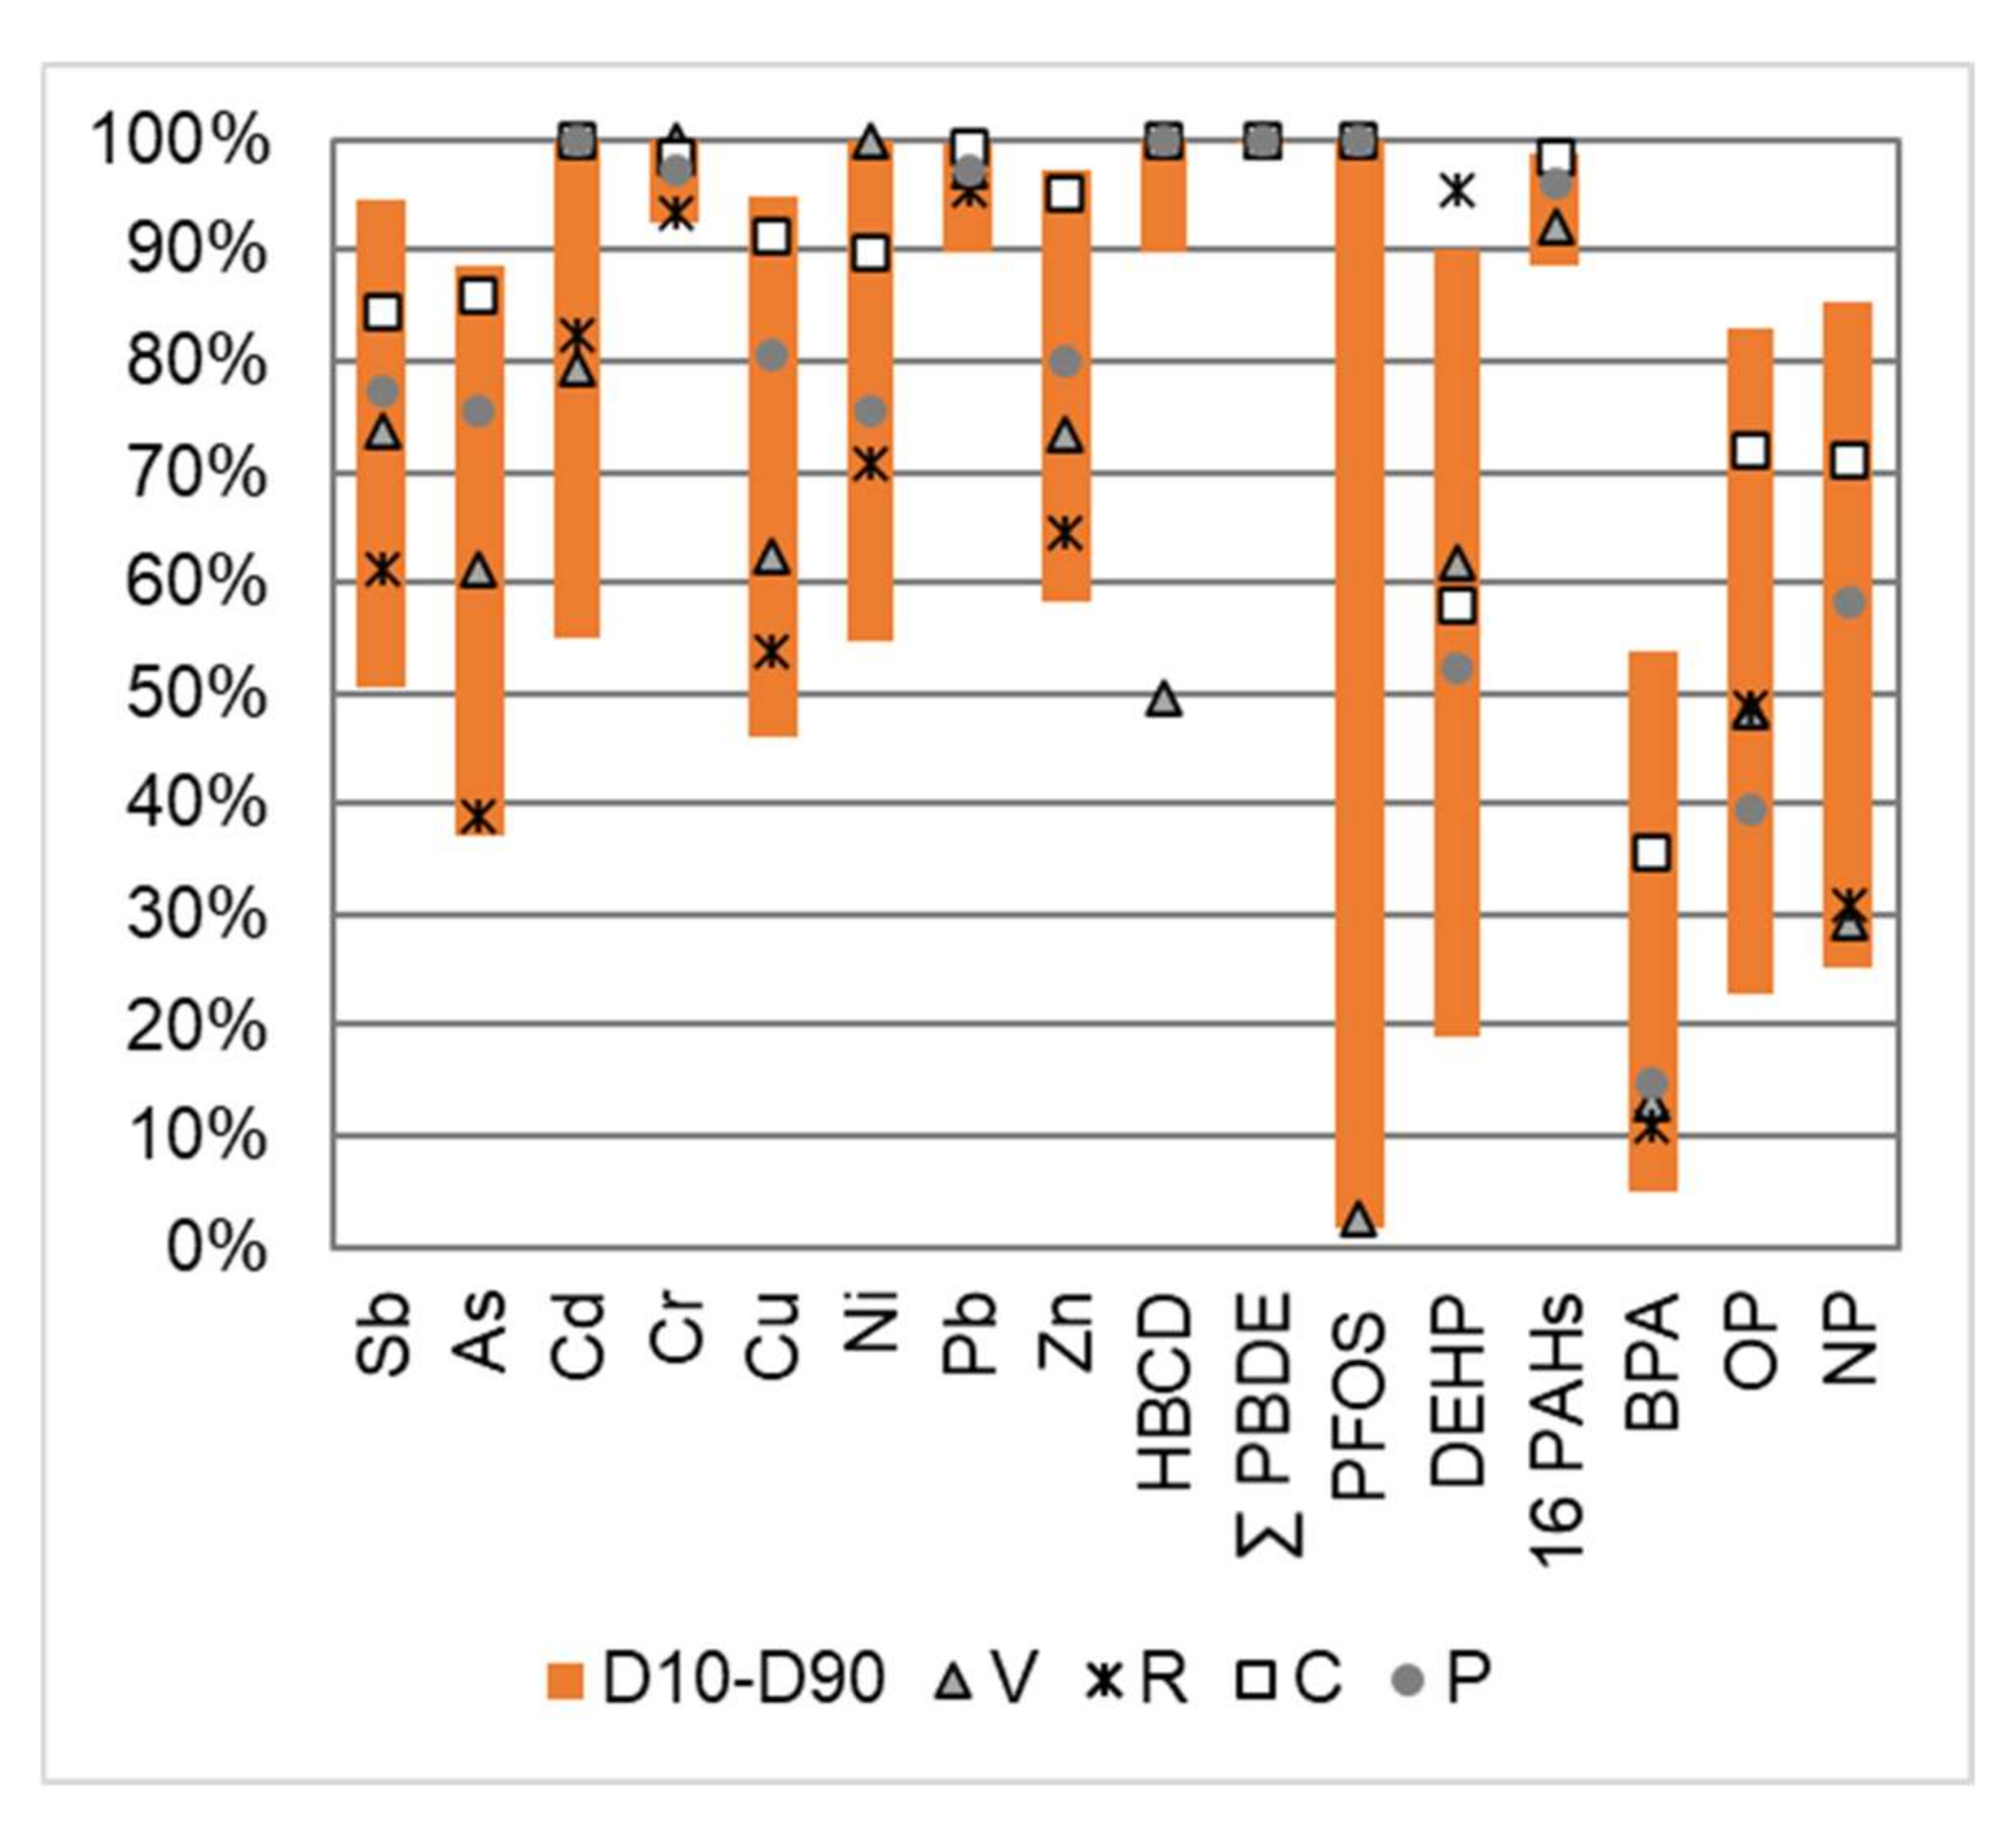
Dissolved particulate distributions are important to characterize, as they can orient and guide the management and reduction strategies of the pollution carried by runoff water. The percentage of the total EMC associated with the particulate phase is presented in Figure 6. The first–last decile (D10–D90) range of all the analyzed samples, as well as the median value for each site, are given.

Figure 6.
Percentage of the total EMC associated with the particulate phase for a selection of micropollutants. First decile (D10) and last decile (D90) over the whole dataset, as well as the median value for each site (V, R, C and P).
Most metals were predominantly bound to the particulate phase (>50%). This tendency was more pronounced for elements such as Cr and Pb and, to a lesser extent, for Zn, As, Sb and Cu. For the previously well-documented elements, these distributions were comparable to those reported for pavement runoff [53] or for stormwater at the outlet of a separate sewer network [7]. The partitioning of Sb was poorly documented. In natural waters, the dissolved fraction contained more than 90% of the total Sb content [54]. In the anthropized Seine River, the dissolved fraction represented 64 ± 12% but fell to 4.3 ± 1.6% in the untreated waste waters [50]. The Sb distribution in the road runoff appeared different than in natural nonimpacted rivers and in the same order of magnitude as in anthropized river waters. Those findings supported the hypothesis that the increase in particulate Sb concentrations in urban areas may be due to traffic-related sources [11].
The distribution of neutrally charged organic pollutants between the dissolved and particulate phases is theoretically strongly dependent on their physical–chemical properties and varies according to the octanol–water partition coefficient (Kow). Although this coefficient does not accurately describe the behavior of pollutants, it can be used as an indicator to predict a “rough” distribution of pollutants between the dissolved and particulate fractions [7]. A large number of organic pollutants were preferentially associated with particulate matter such as PAHs, PBDEs, HBCDD and PFASs, as illustrated for PFOS (with the exception of the V site). The phthalates analyzed in this study covered a wide range of Kow values (log Kow from 2.4 to 8.8); similarly, a gradient in the particulate fraction was observed for this family, with some pollutants predominantly associated with the dissolved phase (DiBP, DBP and DMEP); some predominantly with the particulate fraction (DMPP, DEEP, DPP, BBP and DNP) and some evenly distributed between these two phases (DMP, DEHP, DNOP, DNHP, DBEP and DCHP). While previous work has shown a clear difference between low molecular weight PAHs (50–80% in the particulate fraction) and high molecular weight PAHs (>80%) [7], the latter was not observed in this work, probably due to the higher detection limits in the dissolved fraction. In the case of BPA and alkylphenols, and in agreement with previous observations on stormwater [7], the dissolved phase was significant. It represented more than 45% for all samples for BPA and varied between 15% and 75% for NP and OP.
While Cr, Pb, HBCDD, PBDE and PAHs were mostly particle-bound (>90%) at all four study sites, other pollutants presented site differences. The proportion of particle-bound pollutants was highest for the C site, which was characterized by both high TSS concentrations and relatively low DOC concentrations. The R and V sites, which presented much lower TSS concentrations, also showed a higher dissolved fraction. The V site presented a singular behavior for HBCDD and PFOS; while these two compounds were detected only in the particulate fraction for the P, C and R sites, they showed a dominant dissolved concentration at the V site, which might indicate both a different source of these pollutants on this site or a slightly different nature of the particles.
4.3. Should We Promote On-Site Depollution Systems?
Trafficked areas clearly appear to be a source of a range of micropollutants for which runoff is a vector that may impact freshwater ecosystems. Conventional separate drainage systems collect these waters in drains and discharge them into receiving bodies without any treatment. In urban areas with combined sewer systems, runoff undergoes depollution in the sewage treatment plant for small rainfalls, but it also contributes to combined sewer overflows (CSOs) for larger rainfalls, CSOs that convey not only stormwater micropollutants but also a wider range of compounds originating from domestic and industrial sewage. In order to reduce the diffuse pollution of freshwaters, the on-site control of traffic area runoff should be considered. The control of pollutant loads discharged into receiving water can either be achieved by depollution strategies, i.e., by implementing on-site treatment processes to reduce concentrations of pollutants, or by reducing the runoff volumes discharged. Based on our results, treatment processes should target both the particulate and the dissolved phases of pollutants. Recent research [55,56] has highlighted the very fine particle size distribution of TSS in road runoff, which will limit its ability to settle in facilities such as stormwater ponds. Filtration processes should thus be promoted to trap particulate pollutants and adsorption processes implemented for treating the dissolved fraction. Nature-based solutions (NBS) involving percolation through a vegetated soil or substrate show promising results for the treatment of the particulate phase [10,57]; however, several authors have underlined a more limited efficiency of dissolved pollutants [10,58], which might be linked to colloidal transport or complexation with DOC [55,59] and can be worsened by winter salt application [60]. Moreover, depollution strategies will show a limited efficiency for runoff with relatively low concentrations, such as the V site, as the percent of removal efficiency usually decreases with low influent concentrations levels [61], and the irreducible concentration levels are measured at the outlet of all treatment systems [62]. The reduction of runoff volumes collected into sewer systems appears to be a priority, as it allows both reducing the frequency and importance of CSOs in combined sewer systems and reducing pollutant loads discharged by separate sewer systems, for which systematic centralized treatment seems unaffordable. Limiting runoff by promoting pervious surfaces and on-site infiltration and evapotranspiration in sustainable urban drainage systems (SUDS) appears to be necessary in order to efficiently reduce diffuse inputs to superficial aquatic environments. This will, in turn, induce the accumulation of contaminants in the upper soil layer of SUDS [63]. Further research is needed to assess the long-term behaviors of these systems both in terms of treatment efficiency and the fate of the accumulated contaminants, which can involve the biodegradation of organic micropollutants [64] but, also, the leaching of metals [65].
Supplementary Materials
The following are available online at https://www.mdpi.com/article/10.3390/w14030394/s1: Table S1: Pollutants analyzed in runoff; Table S2: Limit of quantification for inorganic elements—I; Table S3: Limit of quantification for inorganic elements—II; Table S4: Limit of quantification for inorganic elements—III; Table S5: Limit of quantification for organic elements—Total hydrocarbon and PAHs; Table S6:Limit of quantification for organic elements—PBDE; Table S7: Limit of quantification for organic elements—AP, BPA, HBCD and TBBPA; Table S8: Limit of quantification for organic elements—Phthalates; Table S9: Limit of quantification for organic elements—PFAS; Table S10: Limit of quantification for organic elements—Other molecules; Table S11. Specific features tentatively identified by non-target screening at each site; Figure S1: Principal component analysis of HRMS features. (A) Scores plot of first two principal components (PC1 and PC2) showing samples with selected sampling dates for the four sites; (B) Loadings plot showing all features detected in the samples, with the size of bubbles proportional to the highest intensity of a given feature among all samples; (C) Scores plot of third and fourth principal components (PC3 and PC4).
Author Contributions
J.G.: Formal analysis, Writing—Original Draft and Visualization. J.L.R., S.D., P.L., H.B., S.A. and K.F.: Methodology, Validation, Data Curation, Writing—Review and Editing and Supervision. M.S., J.P. and P.N.: Investigation and Resources. L.V. and N.H.: Methodology, Validation and Data Curation. M.G., N.C., E.C., C.P., L.B. (Lila Boudahmane), L.M. and L.B. (Louise Bordier): Investigation and Data Curation. M.-C.G.: Resources, Conceptualization, Writing—Review and Editing, Supervision, Project administration and Funding acquisition. All authors have read and agreed to the published version of the manuscript.
Funding
This research was part of the Roulépur research project funded by the Agence de l’Eau Seine Normandie and Office Français de la Biodiversité.
Institutional Review Board Statement
Not applicable.
Informed Consent Statement
Not applicable.
Data Availability Statement
The full dataset of the concentrations for target screening will be made available as a repository at Mendeley Data, V1, doi: 10.17632/m8kcmthfd2.1. The raw HRMS data files are available at doi: 10.5281/zenodo.4306663.
Acknowledgments
The authors would like to thank Emmanuelle Mebold (PRAMMICS Platform OSU-EFLUVE UMS 3563) for her technical support for the HRMS instruments. We also thank all the partners and collaborators of the Roulépur project for the fruitful collaborations.
Conflicts of Interest
The authors declare no conflict of interest. The funders had no role in the design of the study; in the collection, analyses or interpretation of the data; in the writing of the manuscript or in the decision to publish the results.
References
- Pitt, R.; Clark, S.E. Integrated Storm-Water Management for Watershed Sustainability. J. Irrig. Drain. Eng. 2008, 134, 548–555. [Google Scholar] [CrossRef]
- Clark, S.E.; Burian, S.; Pitt, R.; Field, R. Urban Wet-Weather Flows. Water Environ. Res. 2006, 78, 1133–1192. [Google Scholar] [CrossRef]
- Revitt, D.M.; Lundy, L.; Coulon, F.; Fairley, M. The Sources, Impact and Management of Car Park Runoff Pollution: A Review. J. Environ. Manag. 2014, 146, 552–567. [Google Scholar] [CrossRef]
- Müller, A.; Österlund, H.; Marsalek, J.; Viklander, M. The Pollution Conveyed by Urban Runoff: A Review of Sources. Sci. Total Environ. 2020, 709, 136125. [Google Scholar] [CrossRef] [PubMed]
- Kayhanian, M.; Fruchtman, B.D.; Gulliver, J.S.; Montanaro, C.; Ranieri, E.; Wuertz, S. Review of Highway Runoff Characteristics: Comparative Analysis and Universal Implications. Water Res. 2012, 46, 6609–6624. [Google Scholar] [CrossRef]
- Bjorklund, K. Substance Flow Analyses of Phthalates and Nonylphenols in Stormwater. Water Sci. Technol. 2010, 62, 1154–1160. [Google Scholar] [CrossRef]
- Gasperi, J.; Sebastian, C.; Ruban, V.; Delamain, M.; Percot, S.; Wiest, L.; Mirande, C.; Caupos, E.; Demare, D.; Kessoo, M.D.; et al. Micropollutants in Urban Stormwater: Occurrence, Concentrations, and Atmospheric Contributions for a Wide Range of Contaminants in Three French Catchments. Environ. Sci. Pollut. Res. 2014, 21, 5267–5281. [Google Scholar] [CrossRef]
- Zgheib, S.; Moilleron, R.; Chebbo, G. Priority Pollutants in Urban Stormwater: Part 1 — Case of Separate Storm Sewers. Water Res. 2012, 46, 6683–6692. [Google Scholar] [CrossRef]
- Markiewicz, A.; Björklund, K.; Eriksson, E.; Kalmykova, Y.; Strömvall, A.-M.; Siopi, A. Emissions of Organic Pollutants from Traffic and Roads: Priority Pollutants Selection and Substance Flow Analysis. Sci. Total Environ. 2017, 580, 1162–1174. [Google Scholar] [CrossRef]
- Flanagan, K.; Branchu, P.; Boudahmane, L.; Caupos, E.; Demare, D.; Deshayes, S.; Dubois, P.; Meffray, L.; Partibane, C.; Saad, M.; et al. Field Performance of Two Biofiltration Systems Treating Micropollutants from Road Runoff. Water Res. 2018, 145, 562–578. [Google Scholar] [CrossRef]
- Froger, C.; Ayrault, S.; Evrard, O.; Monvoisin, G.; Bordier, L.; Lefèvre, I.; Quantin, C. Tracing the Sources of Suspended Sediment and Particle-Bound Trace Metal Elements in an Urban Catchment Coupling Elemental and Isotopic Geochemistry, and Fallout Radionuclides. Environ. Sci. Pollut. Res. 2018, 25, 28667–28681. [Google Scholar] [CrossRef] [PubMed]
- Tlili, K.; Labadie, P.; Alliot, F.; Bourges, C.; Desportes, A.; Chevreuil, M. Influence of Hydrological Parameters on Organohalogenated Micropollutant (Polybrominated Diphenyl Ethers and Polychlorinated Biphenyls) Behaviour in the Seine (France). Arch. Environ. Contam. Toxicol. 2012, 62, 570–578. [Google Scholar] [CrossRef] [PubMed]
- Munoz, G.; Giraudel, J.-L.; Botta, F.; Lestremau, F.; Devier, M.-H.; Budzinski, H.; Labadie, P. Spatial Distribution and Partitioning Behavior of Selected Poly- and Perfluoroalkyl Substances in Freshwater Ecosystems: A French Nationwide Survey. Sci. Total Environ. 2015, 517, 48–56. [Google Scholar] [CrossRef] [PubMed]
- Oturan, N.; van Hullebusch, E.D.; Zhang, H.; Mazeas, L.; Budzinski, H.; Le Menach, K.; Oturan, M.A. Occurrence and Removal of Organic Micropollutants in Landfill Leachates Treated by Electrochemical Advanced Oxidation Processes. Environ. Sci. Technol. 2015, 49, 12187–12196. [Google Scholar] [CrossRef] [PubMed]
- Munoz, G.; Fechner, L.C.; Geneste, E.; Pardon, P.; Budzinski, H.; Labadie, P. Spatio-Temporal Dynamics of per and Polyfluoroalkyl Substances (PFASs) and Transfer to Periphytic Biofilm in an Urban River: Case-Study on the River Seine. Environ. Sci. Pollut. Res. 2018, 25, 23574–23582. [Google Scholar] [CrossRef]
- Sandré, F.; Huynh, N.; Gromaire, M.-C.; Varrault, G.; Morin, C.; Moilleron, R.; Le Roux, J.; Garrigue-Antar, L. Road Runoff Characterization: Ecotoxicological Assessment Combined with (Non-)Target Screenings of Micropollutants for the Identification of Relevant Toxicants in the Dissolved Phase. Water 2022. special issue on “Research on Urban Runoff”. [Google Scholar]
- Schulze, S.; Zahn, D.; Montes, R.; Rodil, R.; Quintana, J.B.; Knepper, T.P.; Reemtsma, T.; Berger, U. Occurrence of Emerging Persistent and Mobile Organic Contaminants in European Water Samples. Water Res. 2019, 153, 80–90. [Google Scholar] [CrossRef]
- Challis, J.K.; Popick, H.; Prajapati, S.; Harder, P.; Giesy, J.P.; McPhedran, K.; Brinkmann, M. Occurrences of Tire Rubber-Derived Contaminants in Cold-Climate Urban Runoff. Environ. Sci. Technol. Lett. 2021, 8, 961–967. [Google Scholar] [CrossRef]
- Tian, Z.; Zhao, H.; Peter, K.T.; Gonzalez, M.; Wetzel, J.; Wu, C.; Hu, X.; Prat, J.; Mudrock, E.; Hettinger, R.; et al. A Ubiquitous Tire Rubber–Derived Chemical Induces Acute Mortality in Coho Salmon. Science 2021, 371, 185–189. [Google Scholar] [CrossRef]
- Wicke, D.; Matzinger, A.; Sonnenberg, H.; Caradot, N.; Schubert, R.-L.; Dick, R.; Heinzmann, B.; Dünnbier, U.; von Seggern, D.; Rouault, P. Micropollutants in Urban Stormwater Runoff of Different Land Uses. Water 2021, 13, 1312. [Google Scholar] [CrossRef]
- Göbel, P.; Dierkes, C.; Coldewey, W.G. Storm Water Runoff Concentration Matrix for Urban Areas. J. Contam. Hydrol. 2007, 91, 26–42. [Google Scholar] [CrossRef] [PubMed]
- Lundy, L.; Ellis, J.B.; Revitt, D.M. Risk Prioritisation of Stormwater Pollutant Sources. Water Res. 2012, 46, 6589–6600. [Google Scholar] [CrossRef] [PubMed]
- Huber, M.; Welker, A.; Helmreich, B. Critical Review of Heavy Metal Pollution of Traffic Area Runoff: Occurrence, Influencing Factors, and Partitioning. Sci. Total Environ. 2016, 541, 895–919. [Google Scholar] [CrossRef] [PubMed]
- Peikertova, P.; Filip, P. Influence of the Automotive Brake Wear Debris on the Environment—A Review of Recent Research. SAE Int. J. Mater. Manuf. 2016, 9, 133–146. [Google Scholar] [CrossRef]
- Gietl, J.K.; Lawrence, R.; Thorpe, A.J.; Harrison, R.M. Identification of Brake Wear Particles and Derivation of a Quantitative Tracer for Brake Dust at a Major Road. Atmos. Environ. 2010, 44, 141–146. [Google Scholar] [CrossRef]
- Achten, C.; Kolb, A.; Püttmann, W. Methyl Tert-Butyl Ether (MTBE) in Urban and Rural Precipitation in Germany. Atmos. Environ. 2001, 35, 6337–6345. [Google Scholar] [CrossRef]
- Borden, R.C.; Black, D.C.; McBlief, K.V. MTBE and Aromatic Hydrocarbons in North Carolina Stormwater Runoff. Environ. Pollut. 2002, 118, 141–152. [Google Scholar] [CrossRef]
- Sablayrolles, C.; Breton, A.; Vialle, C.; Vignoles, C.; Montréjaud-Vignoles, M. Priority Organic Pollutants in the Urban Water Cycle (Toulouse, France). Water Sci. Technol. 2011, 64, 541. [Google Scholar] [CrossRef]
- Stachel, B.; Holthuis, J.-U.; Schulz, W.; Seitz, W.; Weber, W.H.; Tegge, K.-T.; Dobner, I. Treatment Techniques and Analysis of Stormwater Run-off from Roads in Hamburg, Germany. In Xenobiotics in the Urban Water Cycle; Fatta-Kassinos, D., Bester, K., Kümmerer, K., Eds.; Springer: Dordrecht, The Netherlands, 2010; Volume 16, pp. 445–461. ISBN 978-90-481-3508-0. [Google Scholar]
- INERIS. Synthèse Des Valeurs Réglementaires Pour Les Substances Chimiques, En Vigueur Dans l’eau, Les Denrées Alimentaires et Dans l’air En France Au 30 Juin 2020; INERIS: Paris, France, 2021; p. 97. [Google Scholar]
- Clara, M.; Windhofer, G.; Hartl, W.; Braun, K.; Simon, M.; Gans, O.; Scheffknecht, C.; Chovanec, A. Occurrence of Phthalates in Surface Runoff, Untreated and Treated Wastewater and Fate during Wastewater Treatment. Chemosphere 2010, 78, 1078–1084. [Google Scholar] [CrossRef]
- Yunker, M.B.; Macdonald, R.W.; Vingarzan, R.; Mitchell, R.H.; Goyette, D.; Sylvestre, S. PAHs in the Fraser River Basin: A Critical Appraisal of PAH Ratios as Indicators of PAH Source and Composition. Org. Geochem. 2002, 33, 489–515. [Google Scholar] [CrossRef]
- Tomy, G.T.; Budakowski, W.; Halldorson, T.; Whittle, D.M.; Keir, M.J.; Marvin, C.; MacInnis, G.; Alaee, M. Biomagnification of α- and γ-Hexabromocyclododecane Isomers in a Lake Ontario Food Web. Environ. Sci. Technol. 2004, 38, 2298–2303. [Google Scholar] [CrossRef] [PubMed]
- Ahmadireskety, A.; Da Silva, B.F.; Robey, N.M.; Douglas, T.E.; Aufmuth, J.; Solo-Gabriele, H.M.; Yost, R.A.; Townsend, T.G.; Bowden, J.A. Per- and Polyfluoroalkyl Substances (PFAS) in Street Sweepings. Environ. Sci. Technol. 2021. [Google Scholar] [CrossRef] [PubMed]
- Kim, S.-K.; Kannan, K. Perfluorinated Acids in Air, Rain, Snow, Surface Runoff, and Lakes: Relative Importance of Pathways to Contamination of Urban Lakes. Environ. Sci. Technol. 2007, 41, 8328–8334. [Google Scholar] [CrossRef] [PubMed]
- Sternbeck, J.; Sjodin, A.; Andreasson, K. Metal Emissions from Road Traffic and the Influence of Resuspension - Results from Two Tunnel Studies. Atmos. Environ. 2002, 36, 4735–4744. [Google Scholar] [CrossRef]
- INERIS. Identification Des Sources Résiduelles d’alkylphénols; INERIS: Paris, France, 2015; p. 57. [Google Scholar]
- Lamprea, K.; Bressy, A.; Mirande-Bret, C.; Caupos, E.; Gromaire, M.-C. Alkylphenol and Bisphenol A Contamination of Urban Runoff: An Evaluation of the Emission Potentials of Various Construction Materials and Automotive Supplies. Environ. Sci. Pollut. Res. 2018, 25, 21887–21900. [Google Scholar] [CrossRef]
- Deshayes, S.; Gasperi, J.; Caupos, E.; Gromaire, M.-C. Evaluation du Potentiel d’Emission d’Alkylphénols, Bisphénol A et Phtalates par les Matériaux et Consommables Automobiles; Roulépur—Livrable 2.4; HAL: Ojhar, India, 2020; p. 49. [Google Scholar]
- Alves, C.A.; Vicente, A.M.P.; Calvo, A.I.; Baumgardner, D.; Amato, F.; Querol, X.; Pio, C.; Gustafsson, M. Physical and Chemical Properties of Non-Exhaust Particles Generated from Wear between Pavements and Tyres. Atmos. Environ. 2020, 224, 117252. [Google Scholar] [CrossRef]
- Staples, C.A.; Guinn, R.; Kramarz, K.; Lampi, M. Assessing the Chronic Aquatic Toxicity of Phthalate Ester Plasticizers. Hum. Ecol. Risk Assess. 2011, 17, 1057–1076. [Google Scholar] [CrossRef]
- Zhao, L.; Zhou, M.; Zhang, T.; Sun, H. Polyfluorinated and Perfluorinated Chemicals in Precipitation and Runoff from Cities Across Eastern and Central China. Arch. Environ. Contam. Toxicol. 2013, 64, 198–207. [Google Scholar] [CrossRef]
- Zhang, J.; Zhang, X.; Wu, L.; Wang, T.; Zhao, J.; Zhang, Y.; Men, Z.; Mao, H. Occurrence of Benzothiazole and Its Derivates in Tire Wear, Road Dust, and Roadside Soil. Chemosphere 2018, 201, 310–317. [Google Scholar] [CrossRef]
- Brudler, S.; Rygaard, M.; Arnbjerg-Nielsen, K.; Hauschild, M.Z.; Ammitsøe, C.; Vezzaro, L. Pollution Levels of Stormwater Discharges and Resulting Environmental Impacts. Sci. Total Environ. 2019, 663, 754–763. [Google Scholar] [CrossRef]
- Petrucci, G.; Gromaire, M.-C.; Shorshani, M.F.; Chebbo, G. Nonpoint Source Pollution of Urban Stormwater Runoff: A Methodology for Source Analysis. Environ. Sci. Pollut. Res. 2014, 21, 10225–10242. [Google Scholar] [CrossRef] [PubMed]
- Chèvre, N.; Gremaud, D.; Guignard, C.; Rossi, L.; De Alencastro, L.; Bader, H.-P.; Scheidegger, R. Substance Flow Analysis: A Management Tool for Heavy Metals in Urban Water Systems. In Proceedings of the International Conference NOVATECH 2010, Lyon, France, 28 June–1 July 2010. [Google Scholar]
- Le Pape, P.; Ayrault, S.; Quantin, C. Trace Element Behavior and Partition versus Urbanization Gradient in an Urban River (Orge River, France). J. Hydrol. 2012, 472–473, 99–110. [Google Scholar] [CrossRef]
- Meybeck, M.; Lestel, L.; Bonté, P.; Moilleron, R.; Colin, J.L.; Rousselot, O.; Hervé, D.; de Pontevès, C.; Grosbois, C.; Thévenot, D.R. Historical Perspective of Heavy Metals Contamination (Cd, Cr, Cu, Hg, Pb, Zn) in the Seine River Basin (France) Following a DPSIR Approach (1950-2005). Sci. Total Environ. 2007, 375, 204–231. [Google Scholar] [CrossRef] [PubMed]
- Zoller, W.H.; Gladney, E.S.; Duce, R.A. Atmospheric Concentrations and Sources of Trace Metals at the South Pole. Science 1974, 183, 198–200. [Google Scholar] [CrossRef]
- Ayrault, S.; Priadi, C.R.; Pape, P.L.; Bonté, P. Occurrence, Sources and Pathways of Antimony and Silver in an Urban Catchment. In Proceedings of the Urban Environment; Rauch, S., Morrison, G., Norra, S., Schleicher, N., Eds.; Springer Netherlands: Dordrecht, The Netherlands, 2013; pp. 425–435. [Google Scholar]
- Ayrault, S.; Priadi, C.R.; Evrard, O.; Lefèvre, I.; Bonté, P. Silver and Thallium Historical Trends in the Seine River Basin. J. Environ. Monit. 2010, 12, 2177–2185. [Google Scholar] [CrossRef]
- Le Cloarec, M.-F.; Bonte, P.H.; Lestel, L.; Lefèvre, I.; Ayrault, S. Sedimentary Record of Metal Contamination in the Seine River during the Last Century. Phys. Chem. Earth Parts ABC 2011, 36, 515–529. [Google Scholar] [CrossRef]
- Gromaire-Mertz, M.C.; Garnaud, S.; Gonzalez, A.; Chebbo, G. Characterisation of Urban Runoff Pollution in Paris. Water Sci. Technol. 1999, 39, 1–8. [Google Scholar] [CrossRef]
- Filella, M.; Belzile, N.; Chen, Y.-W. Antimony in the Environment: A Review Focused on Natural Waters: I. Occurrence. Earth-Sci. Rev. 2002, 57, 125–176. [Google Scholar] [CrossRef]
- Flanagan, K.; Branchu, P.; Boudahmane, L.; Caupos, E.; Demare, D.; Deshayes, S.; Dubois, P.; Meffray, L.; Partibane, C.; Saad, M.; et al. Retention and Transport Processes of Particulate and Dissolved Micropollutants in Stormwater Biofilters Treating Road Runoff. Sci. Total Environ. 2019, 656, 1178–1190. [Google Scholar] [CrossRef]
- Hong, Y.; Bonhomme, C.; Le, M.-H.; Chebbo, G. A New Approach of Monitoring and Physically-Based Modelling to Investigate Urban Wash-off Process on a Road Catchment near Paris. Water Res. 2016, 102, 96–108. [Google Scholar] [CrossRef]
- Li, H.; Davis, A.P. Urban Particle Capture in Bioretention Media. I: Laboratory and Field Studies. J. Environ. Eng.-Asce 2008, 134, 409–418. [Google Scholar] [CrossRef]
- LeFevre, G.H.; Paus, K.H.; Natarajan, P.; Gulliver, J.S.; Novak, P.J.; Hozalski, R.M. Review of Dissolved Pollutants in Urban Storm Water and Their Removal and Fate in Bioretention Cells. J. Environ. Eng. 2015, 141, 04014050. [Google Scholar] [CrossRef]
- Lange, K.; Österlund, H.; Viklander, M.; Blecken, G.-T. Metal Speciation in Stormwater Bioretention: Removal of Particulate, Colloidal and Truly Dissolved Metals. Sci. Total Environ. 2020, 724, 138121. [Google Scholar] [CrossRef]
- Søberg, L.C.; Viklander, M.; Blecken, G.-T. Do Salt and Low Temperature Impair Metal Treatment in Stormwater Bioretention Cells with or without a Submerged Zone? Sci. Total Environ. 2017, 579, 1588–1599. [Google Scholar] [CrossRef]
- GeoSyntec Consultants; Urban Water Resources Research Council of ASCE. Urban Stormwater BMP Performance Monitoring; GeoSyntec Consultants; Washington, DC, USA; Urban Water Resources Research Council of ASCE: Washington, DC, USA, 2002; p. 248. Available online: https://www3.epa.gov/npdes/pubs/montcomplete.pdf (accessed on 16 December 2021).
- Larm, T.; Wahlsten, A. Applying the Parameter “Irreducible Concentration” in Modelling of Stormwater Treatment Facilities. J. Civ. Eng. Archit. 2019, 13, 469–476. [Google Scholar] [CrossRef]
- Tedoldi, D.; Chebbo, G.; Pierlot, D.; Kovacs, Y.; Gromaire, M.-C. Assessment of Metal and PAH Profiles in SUDS Soil Based on an Improved Experimental Procedure. J. Environ. Manag. 2017, 202, 151–166. [Google Scholar] [CrossRef]
- LeFevre, G.H.; Hozalski, R.M.; Novak, P.J. The Role of Biodegradation in Limiting the Accumulation of Petroleum Hydrocarbons in Raingarden Soils. Water Res. 2012, 46, 6753–6762. [Google Scholar] [CrossRef]
- Costello, D.M.; Hartung, E.W.; Stoll, J.T.; Jefferson, A.J. Bioretention Cell Age and Construction Style Influence Stormwater Pollutant Dynamics. Sci. Total Environ. 2020, 712, 135597. [Google Scholar] [CrossRef]
Publisher’s Note: MDPI stays neutral with regard to jurisdictional claims in published maps and institutional affiliations. |
© 2022 by the authors. Licensee MDPI, Basel, Switzerland. This article is an open access article distributed under the terms and conditions of the Creative Commons Attribution (CC BY) license (https://creativecommons.org/licenses/by/4.0/).