Article

Attribution of the Extreme Drought in the Horn of Africa during Short-Rains of 2016 and Long-Rains of 2017

1
National Marine Environmental Forecasting Center, Beijing 100081, China
2
College of Life Sciences and Oceanography, Shenzhen University, Shenzhen 518061, China
3
School of Atmospheric Sciences, Sun Yat-Sen University, Zhuhai 510275, China
*
Author to whom correspondence should be addressed.
Water 2022, 14(3), 409; https://doi.org/10.3390/w14030409
Submission received: 17 November 2021 / Revised: 21 December 2021 / Accepted: 11 January 2022 / Published: 29 January 2022
(This article belongs to the Section Hydrology)

Abstract

:
The Horn of Africa (HOA) is one of the most drought-prone regions in the world with many arid and semiarid areas, and even some extremely arid areas. Primarily affected by the marine continental climate systems, this zone is really sensitive to global warming. Drought is the main type of natural disaster affecting this region, which triggers famine, civil conflict, and even deterioration of food security. The present study examined changes in droughts in the HOA during 1979–2019 based on Standardized Precipitation Evapotranspiration Index (SPEI). Results show that frequency, duration, and intensity of droughts exhibited an increasing trend over the past decades. Moreover, in October to December (called locate “short rains”) 2016 and March to May (called locate “long rains”) 2017, the HOA experienced the most severe drought. Based on Generalized Extreme Value (GEV) fitting, the 2016/2017 SPEI index corresponds to a drought that occurs every 250 years in the observational records. However, considering the precipitation in short rains of 2016 (long rains of 2017) was only 27.1% (11.8%) less than normal, it is hard to explain the formation of this extreme drought only from precipitation anomalies. Further statistical result shows that the evaporation in 2016/2017 corresponds to a 1-in-131 years event in the observed records. The abnormally high temperature (1.02 °C higher than normal) as well as the greatest potential evaporation since 1979 are the more important causes for the formation of drought. Thus, the extreme drought in 2016/2017, probably caused by the combined effect of dry condition and high temperature simultaneously, and the latter, played a leading role. In other words, droughts can be exacerbated by the co-occurrence of extreme high temperature. With continuous warming caused by anthropogenic activities in the next decades, the Horn of Africa may be a hotspot of the compound droughts and, therefore, it is especially important to considering the combined impacts from less precipitation and high temperature when predicting the future drought trend and making adaptation measures.

1. Introduction

Today, climate warming is a global concern. According to the IPCC-AR6, since 1970, global surface temperatures have risen faster than in any other 50-year period for at least the past 2000 years. From 2001 to 2020, global surface temperature was 0.99 °C higher than 1850–1900, with stronger warming over land than over the ocean [1]. If the current rate of growth continues, between 2030 and 2052, global temperatures could be 1.5 °C higher than 1850–1900 [2]. Extreme events, including weather and climate extremes with devastating impacts, have been confirmed to be a result of complicated interactions among a range of physical processes on multiple spatial-temporal scales under global warming [3,4,5]. There has been an increase in the frequency and intensity of some extreme events, particularly droughts, floods, heat waves, and tropical cyclones. In fact, the impacts of extreme events may not be determined by a single factor, but may be associated with a comprehensive synergy among all of factors [6]. Extreme events that occur concurrently or continuously are defined as compound events or compound extreme events, which were first proposed by IPCC-SREX in 2012 [7]. At present, a compound event, which is a combination of multiple forcing factors and/or risks that cause serious damage to society or the environment, has been embedded under the IPCC risk framework [8]. More recently, the IPC-AR6 report noted that many land areas are expected to experience more compound events as global warming increases, with a high likelihood of heat waves and droughts, as well as compound floods. In particular, concurrent heatwaves and droughts are likely to become more frequent on the global scale [1].
Concurrence of multiple hazards (for example, droughts and heatwaves), in combination, causes devastating impacts beyond which any one of these hazards would cause in isolation [8]. Indeed, in recent decades, more drought events have occurred with high temperatures or heatwaves, such as the Millennium Australia drought of 1997–2010 [9], the Texas drought of 2011 [10], and California drought of 2013–2014 [11]. These compound drought events, with drought and high temperature occurring at the same time, have been confirmed to amplify their risks. Therefore, it requires an increased emphasis on identification, analysis, assessment, and prediction of compound events, especially for vulnerable areas that are extremely sensitive to climate change.
The Horn of Africa (HOA) is one of the most environmentally fragile places on earth, where people survive on the traditional farming and animal husbandry on the semi-arid land area. The economy of the HOA is heavily centered around rain-fed agriculture and livestock farming, which are particularly sensitive to variations in climate change. Dry/wet variations have an important influence on its agriculture production, ecological environment, land use, economic structure, and social stability. Due to its topography and land-sea distribution, the HOA has a unique semiarid climate, with approximately the lowest annual rainfall in the tropics. Drought is a serious natural disaster in this region, threatening millions of people and livestock in the HOA, and it has gotten more severe since the 1970s [12,13]. The extreme dry, in particular, fatally impacts the HOA with fragile ecosystems. About 20 million people in the HOA are meanwhile dependent on food aid as a severe drought spreads over the region.
Climatologically, rainfall exhibits bimodal distribution in the southern and eastern parts of the HOA, involving Kenya, Somalia, eastern Ethiopia, and central and northern Tanzania [14]. A “long rains” season typically occurs from March to May (MAM), and a “short rains” season from October to December (OND) [15,16,17]. Because agricultural production in this region is based on traditional rain-fed agriculture, low rainfall can reduce harvests, lead to famine, and spark conflict [18,19,20,21]. For example, drought in 1983/1984 led to a civil conflict and triggered a famine in northern Ethiopia and Sudan [22]. The rainfall deficit both in short rains in 1991 and long rains in 1992, as a “consecutive drought” event, contributed to the deterioration of food security. Another consecutive drought event during the growing season in 2010/2011 was estimated to be the worst in the last 60 years [23,24,25], resulting in declines in agriculture yields, high rates of animal mortality, severe food shortages for 12 million people, and severe humanitarian crisis [26]. Previous studies have analyzed trends of drought on temporal and spatial extent over the HOA [12,13,14,27], and papers have looked at the 2010/2011 drought event [28,29].
The HOA endured an extreme drought during short rains in 2016 and long rains in 2017. Across most regions of the HOA, a persistent lack of precipitation in growing season led to record low vegetation cover and soil moisture conditions. Moreover, in 2016, millions of people suffered severe food and water shortages [30,31]. However, there have been no studies on the causes of this extreme drought event in the scientific literature. To illustrate features and possible causes of the drought event in 2016/2017, our work aimed to: (1) assess and investigate the drought in 2016/2017 of the HOA by applying the Standardize Precipitation Evapotranspiration Index (SPEI); (2) estimate return periods of SPEI and meteorological factors; (3) investigate the attribution of the drought event in 2016/2017 by analyzing anomalies of meteorological factors such as precipitation, temperature, and evaporation; and (4) explore its characteristics by comparing it with historical drought events of HOA.
Extreme drought occurred frequently under the background of global warming, and it has become the most devastating threat of human social security in the HOA. This research can better understand the causes of the extreme drought event and provide reliable and scientific support for planning of adaptation measures to address food insecurity in the HOA.

2. Data and Methodology
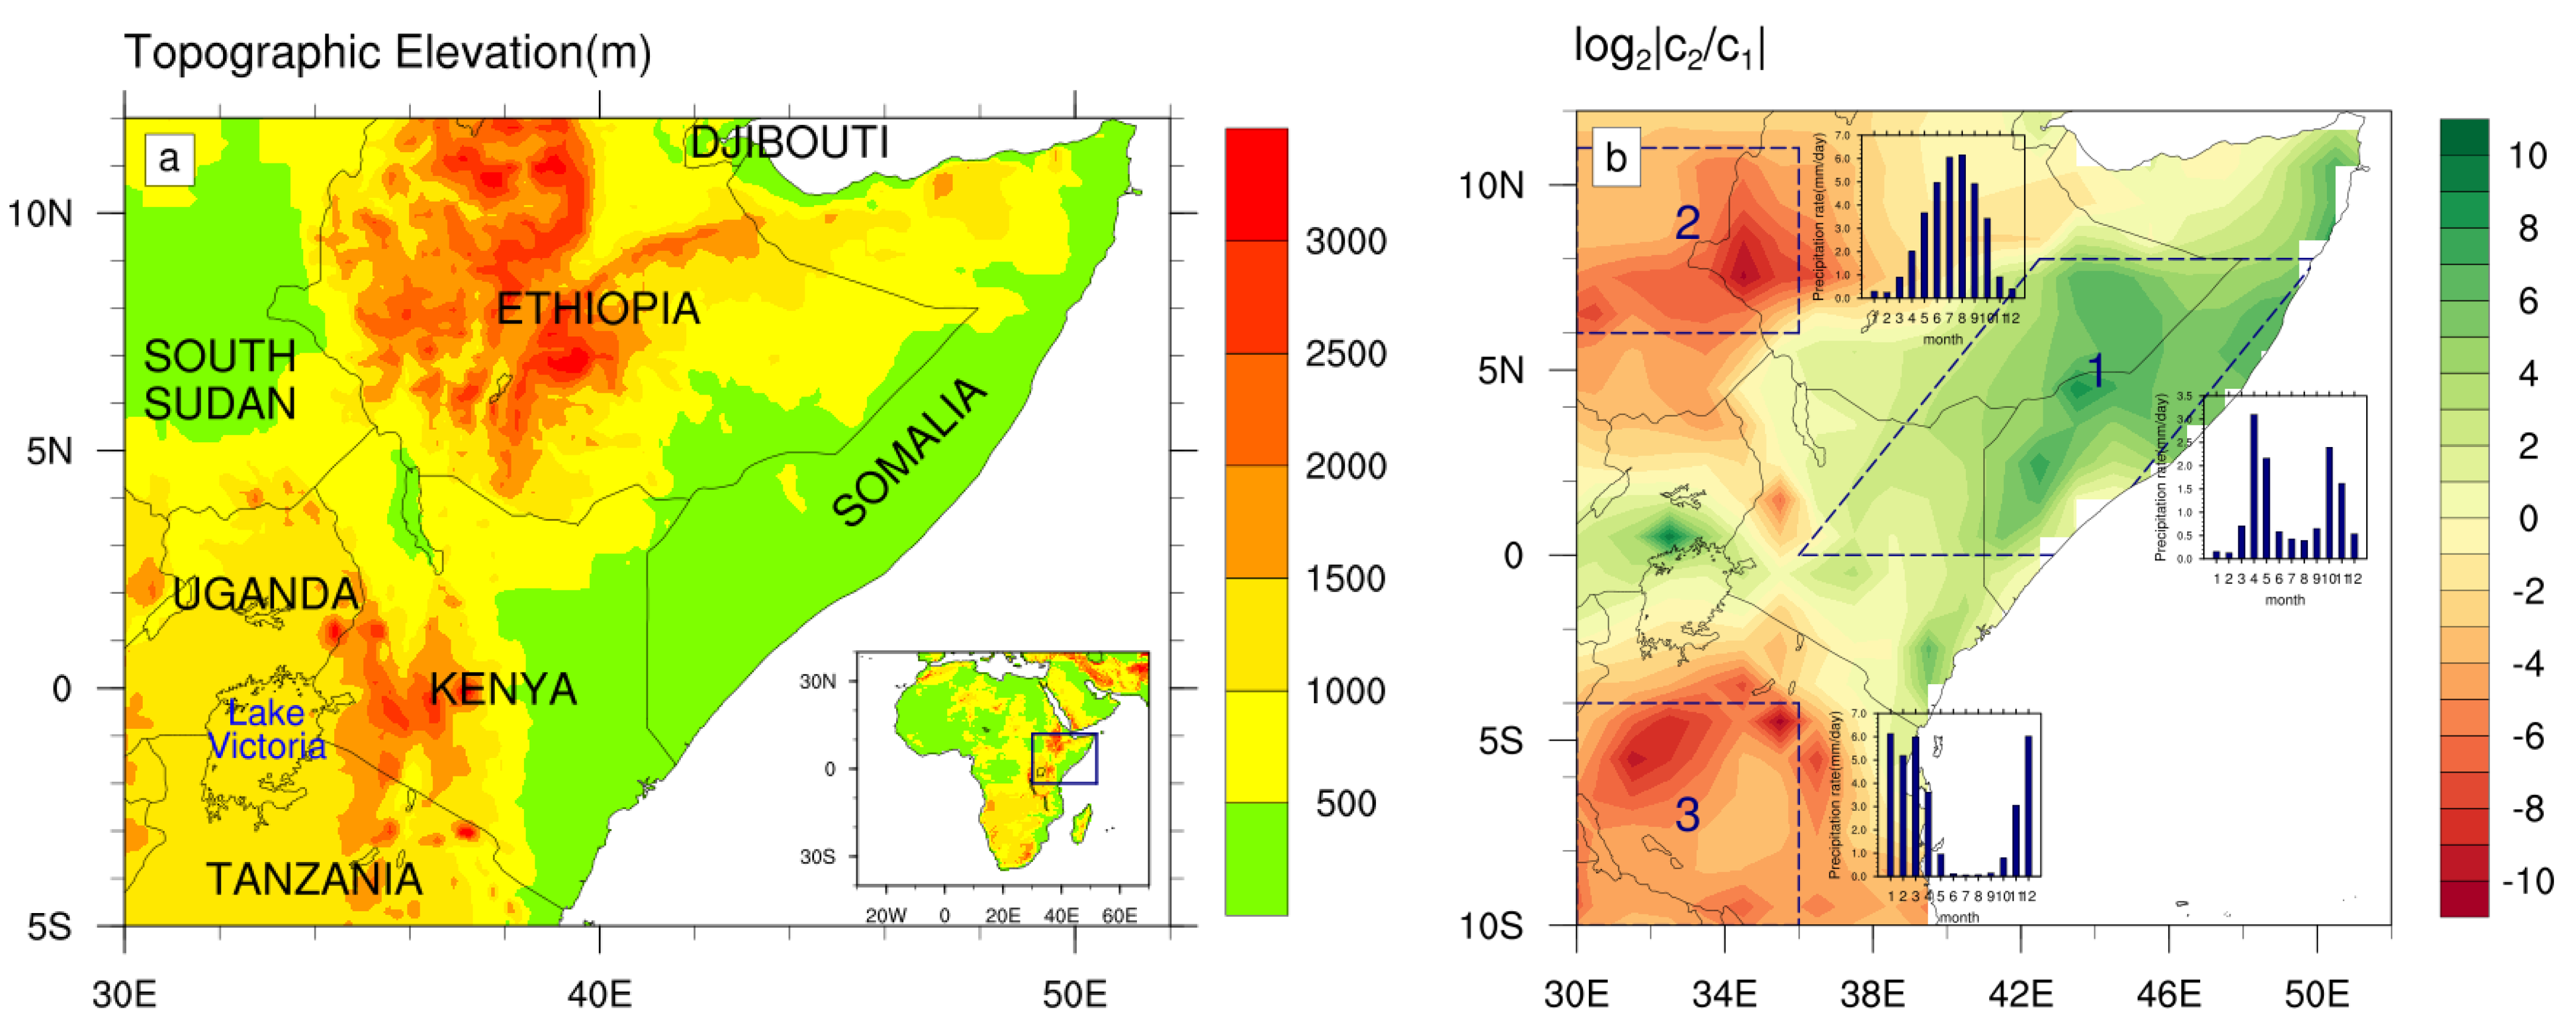
2.1. Study Area

The Horn of Africa (HOA) is located on the easternmost part of the African mainland. It lies along the southern boundary of the Red Sea and extends to the Guardafui Channel, Gulf of Aden, and Indian Ocean. Diverse topographical features around the HOA (Figure 1a), including Ethiopian highlands, Eastern Great Rift, Ogaden desert, and the Somalian and Eritrean coast, influence local climate of the HOA by changing the lower atmospheric circulations and altering water vapor transport [32]. In this study, the HOA refers to the area of positive values in Figure 1b, with a significant annual cycle of bimodal precipitation (as shown in the bar plot next to box 1) mainly dominating the east of the highlands over an approximate extending range of (5° S–12° N, 30° E–52° E). Due to the various topography, the region is characterized by a semiarid climate, which is significantly different from the humid and rainy climate of other tropical regions. The Horn’s arid lowlands are particularly dry because it is under high temperature and receives lower rainfall. It is absolutely accepted that the environment of this region is very sensitive to dry/wet climate changes [33].

2.2. Observation and Reanalysis Datasets

The primary dataset is the monthly analysis precipitation product of Global Precipitation Climatology Centre (GPCC) [34] at 1.0° × 1.0° resolution and covering the period 1901–2019. For this study, GPCC monthly precipitation from 1979 to 2019 was extracted. Considering timely data update and higher spatial resolution, monthly surface air temperature (T2m), evaporation, and potential evaporation (PEV) during 1979–2019 at 0.25° resolution from the fifth generation ECMWF, reanalysis datasets [35] were also analyzed (Table 1). Anomalies of all variables were defined as deviations from the climatological mean of the 30 years (1981–2010).

2.3. Meterological Drought Indices

In order to understand drought, which is considered to be one of the most severe natural disasters, many drought indices are commonly used to quantify and assess drought characteristics, such as the Precipitation Anomaly (PA), Composite Index (CI), Aridity Index (AI), Palmer Drought Severity Index (PDSI), Standardized Precipitation Index (SPI), and Standardized Precipitation Evapotranspiration Index (SPEI) [36,37,38,39,40,41]. Among these, SPEI can be used for multi time scales and take into account both precipitation and temperature in assessing drought conditions. Considering the reliability of data, here the SPEI was performed to study characteristics of drought in the HOA. The SPEI was defined for monthly data, incorporating both precipitation and temperature, to define and monitor drought by quantifying anomalies in accumulated climatic water balance [42]. Generally, a log-logistic distribution is required to standardize the accumulation of D n k   to estimate the SPEI.
D n k = i = 0 k 1 ( P n i PET n i )
where D is monthly water difference between precipitation P and potential evapotranspiration PET in month “n” when the time scale is “k”, whereby the monthly PET is calculated by the Thornthwaite equation [43]:
PET = 16 ( 10 T I ) a , 0   ° C T < 26.5   ° C
I = i = 1 12 ( T 5 ) 1.514 ,   T > 0   ° C
a = 0.49239 + 1.792 × 10 2 I 7.71 × 10 5 I 2 + 6.75 × 10 7 I 3
where T is monthly temperature, and I refers to the total annual value of heat index.
The detailed steps in the SPEI calculation were described by Vicente-Serrano [44]. The SPEI can be calculated at the monthly scale with 1 month, or accumulated at more than 1 month. Typical timescale values are 3, 6, 12, and 24 months, presenting seasonal, semi-annual, annual, and biennial drought conditions respectively. If the accumulated month (time scale “k”) is set, the starting date of the resulting SPEI series will be lagged a number of months equal to k − 1.
In this study, considering the special climatic characteristics of two rainy seasons, and drought spanning 8 months from short rains of 2016 to long rains of 2017, monthly SPEI for multiple time scales of seasonal 3-month, two rainy seasonal 8-month, and annual 12-month based on the period of 1979–2019 were calculated. The classification of SPEI is indicated in Table 2. Generally, the positive (negative) value indicates wet (dry) condition [45].

2.4. Generalized Extreme Value (GEV) Distribution

Generalized extreme value (GEV) distribution can provide an estimation of the probabilities and return periods for extreme events by flexibly combining three maximum extreme value distributions of Gumbel, Frèchet, and Weibull [46]. It can be generally described by:
G ( x , μ , σ , ξ ) = { exp { exp [ x μ σ ] } , ξ = 0 exp { [ 1 + ξ x μ σ ] ξ 1 } , ξ 0 , 1 + ξ x μ σ > 0
where μ, σ and ξ are the location, scale, and shape parameters, respectively. When ξ ≈ 0, ξ > 0, and ξ < 0, the GEV corresponds to the Gumbel, Frèchet, and the negative Weibull distributions, respectively. The details of GEV are summarized by [47,48]. Here, we implemented this GEV analysis to examine the return periods of SPEI index, accumulated precipitation, average temperature, and potential evaporation during the period from OND 2016 to MAM 2017.

3. Results

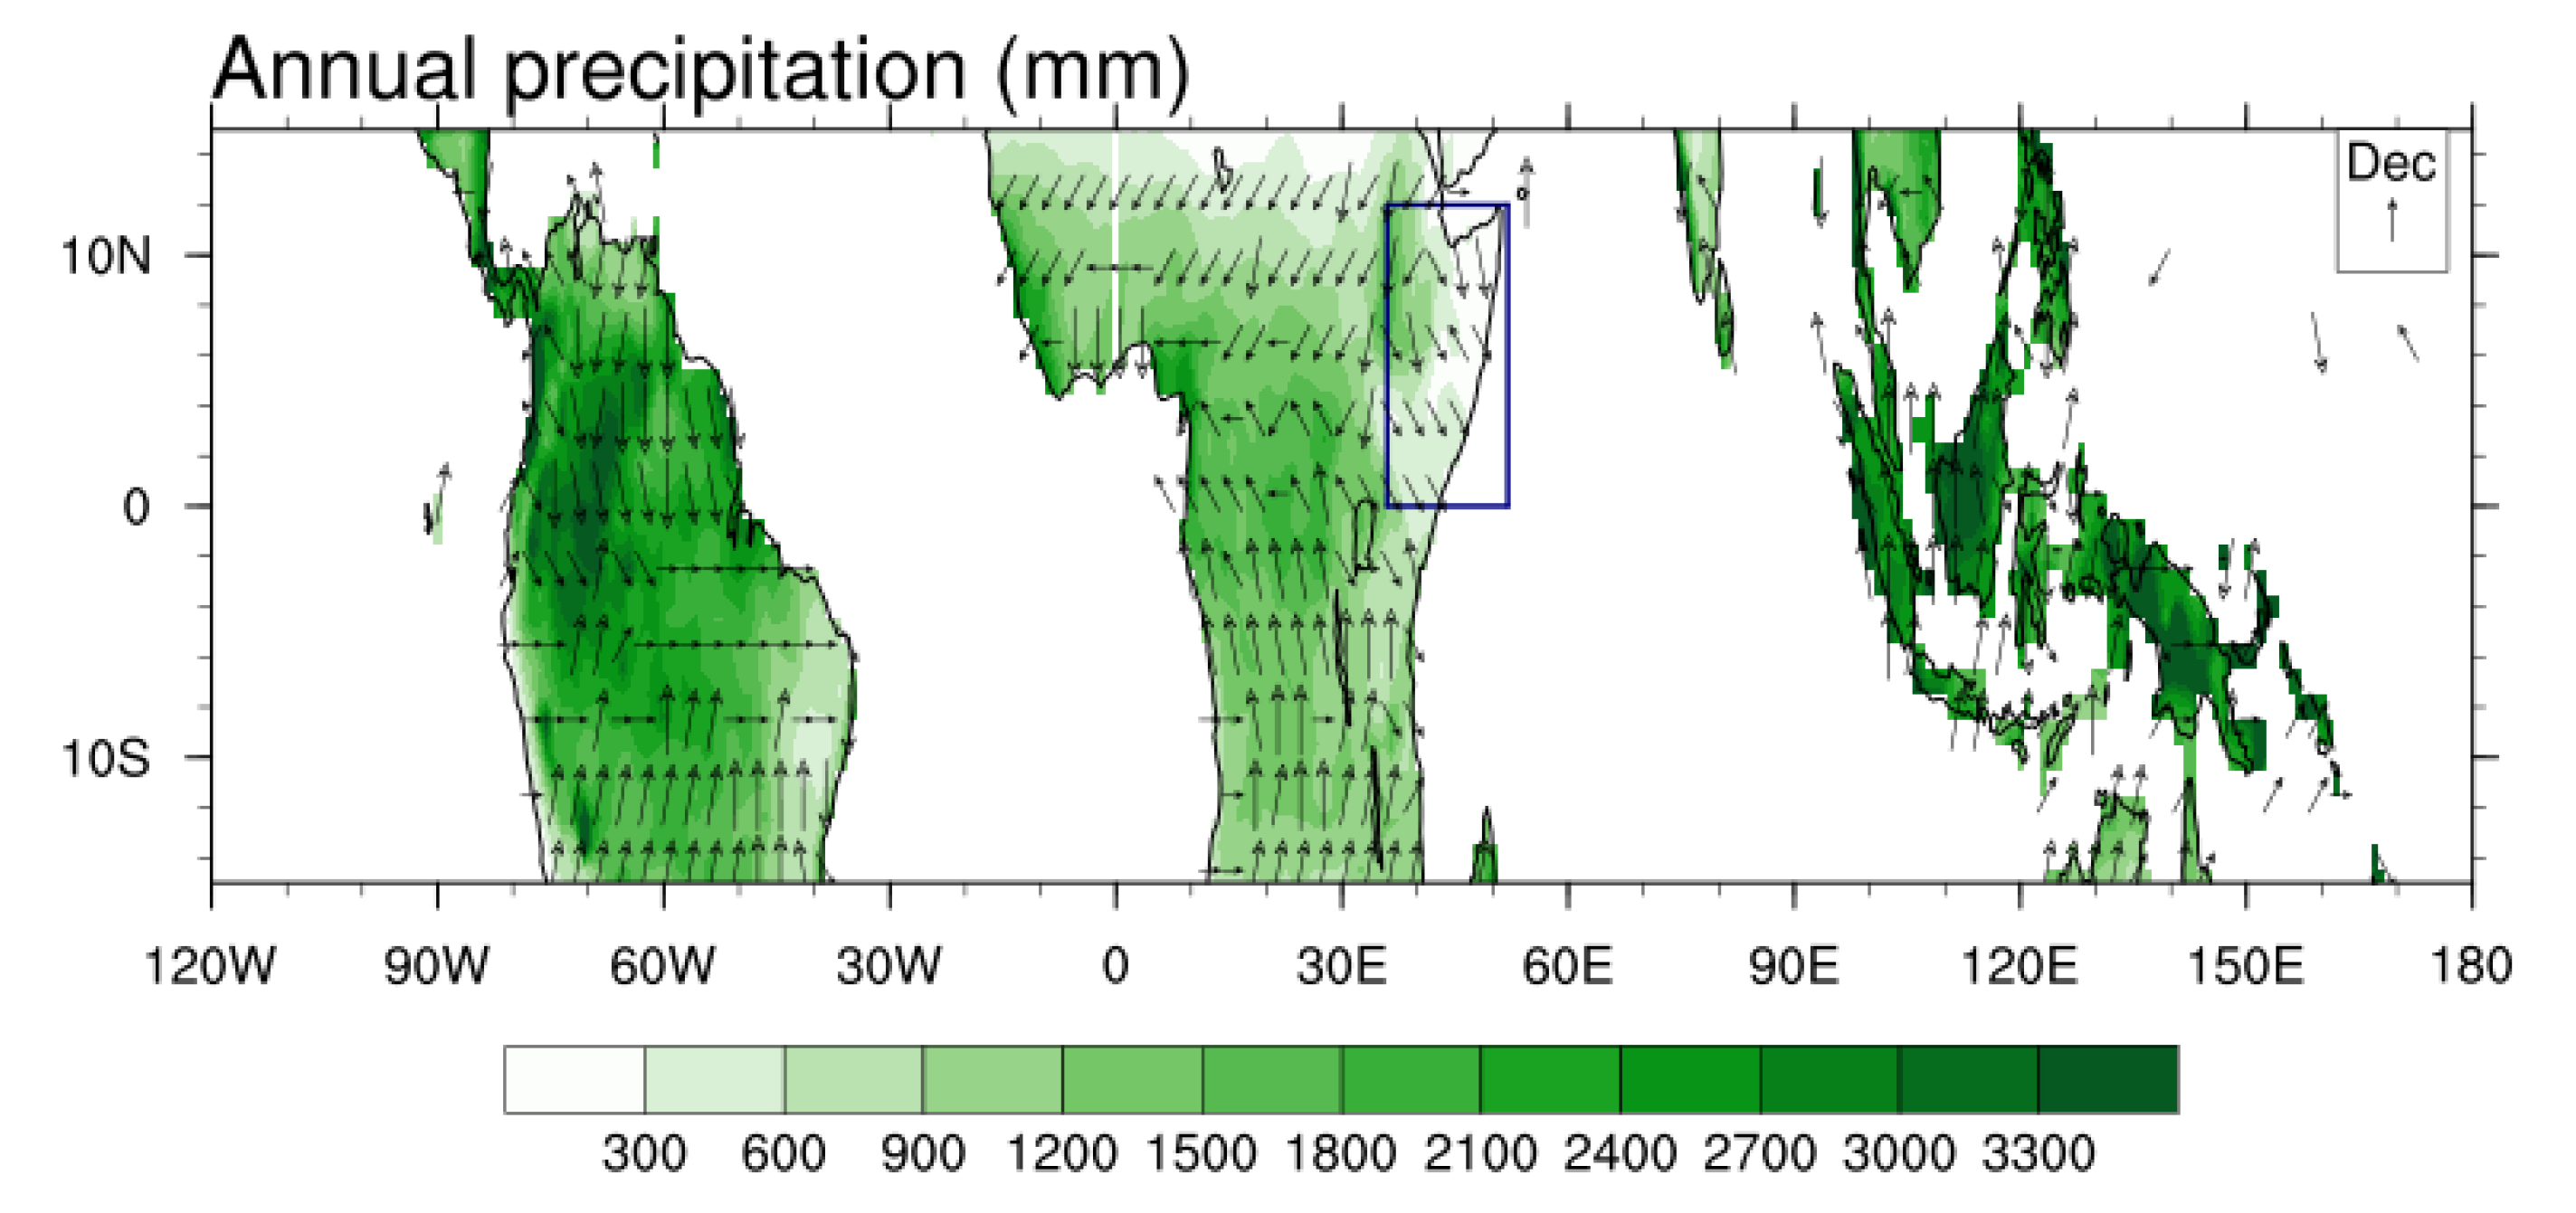
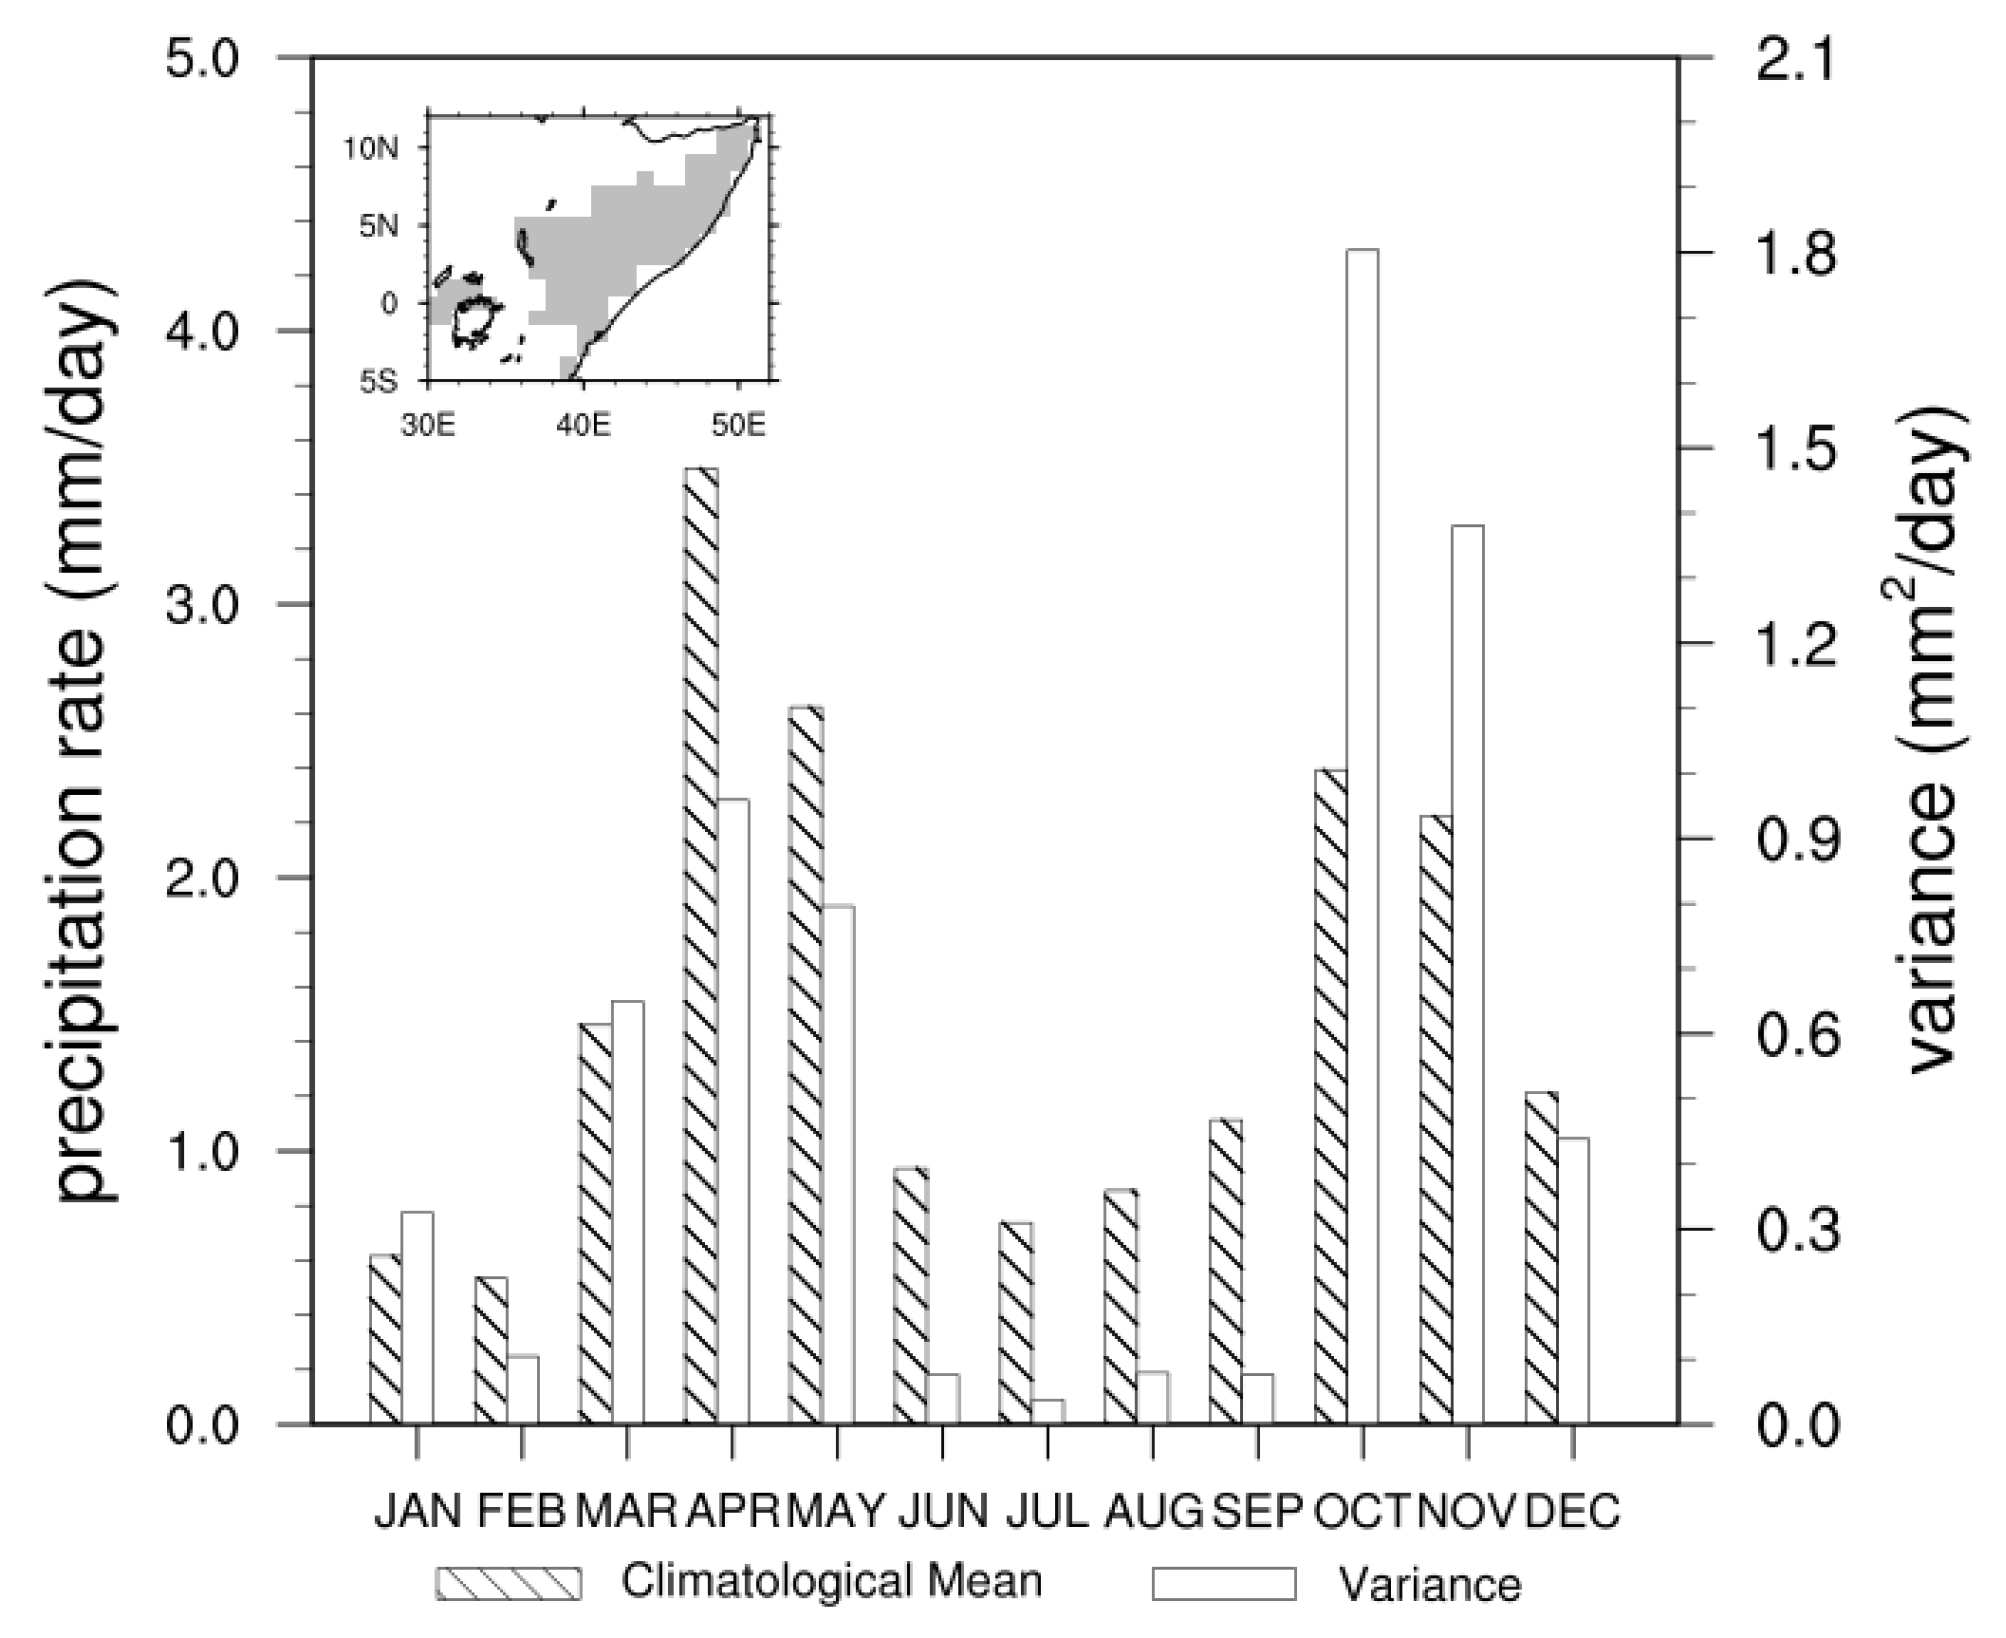
3.1. Climatological Background

The HOA is located in the tropical region. Based on the T2m dataset of ERA5, the characteristics of temperature in the HOA were analyzed. The local annual mean temperature of the HOA is around 25.05 ℃, with a maximum temperature of 26.28 ℃ in February and a minimum temperature of 24.08 ℃ in June. However, comparing with other tropical regions, the uniqueness of precipitation in HOA with significant spatial heterogeneity in its climate characteristics can be seen from Figure 2. Most of the HOA is almost the only semiarid region in the deep tropics with annual precipitation less than 600 mm, while generally tropical regions are characterized by wet and rainy with more than 2000 mm of annual precipitation. Similar to South America at the same latitude, the heaviest precipitation occurs in April, however, the HOA has a precipitation minimum at all longitudes of tropical land. There are several factors contributing to its semiarid climatological characteristics, such as substantial topographic variations, larger-scale flow, and low-level atmospheric circulation and vapor transport [49].
To investigate the spatial pattern of precipitation annual cycle, the binary logarithm of the ratio |C2/C1| at each grid was calculated based on the Fourier harmonics analysis of GPCC data (Figure 1b), while C1 and C2 represent the annual and semi-annual period, respectively. As shown in Figure 1b, positive values that represent bimodal precipitation annual cycle dominate the east of the highlands and near the equator. The average precipitation annual cycle at the right of the box 1 shows two remarkable rainy seasons: The long rains in MAM and the short rains in OND. In contrast, boxes 2 and 3 exhibit a typical monsoon rainfall character with precipitation peaks during boreal summer in box 2 and during austral summer in box 3. The bimodal distribution of annual cycle is the most significant precipitation characteristic over most of the HOA, including Somalia, Kenya, and eastern Ethiopia, which is consistent with previous studies [50].
According to the positive values in Figure 1b, bimodal precipitation areas were highlighted as gray shading in the mini panel of Figure 3. Hereafter, the term “HOA” refers to the area shaded in gray in Figure 3. The bar chart with diagonal lines shows the GPCC precipitation climatological annual cycle over the HOA, and the blank bar chart is the variance (Figure 3). It indicates that the heaviest rainfall amounts occur during long rains and short rains. While the variances of short rains (especially from October to November) are greater than those of long rains, this indicates that the interannual change of precipitation depends mainly on the variation of short rains. Previous researches have discussed that short rains show a close relationship with tropical sea surface temperature anomalies (SSTAs), such as typical ENSO and Indian Ocean dipole (IOD) [51,52,53]. The stronger teleconnection between interannual variability of short rains and long-scale SST forcing helps us understand and predict OND precipitation of HOA better. However, unlike short rains, long rains show barely any correlation with SSTA or any other climate anomalies on interannual and seasonal timescales [54,55]. Therefore, it is hard to predict forecast precipitation in long rains of the HOA.

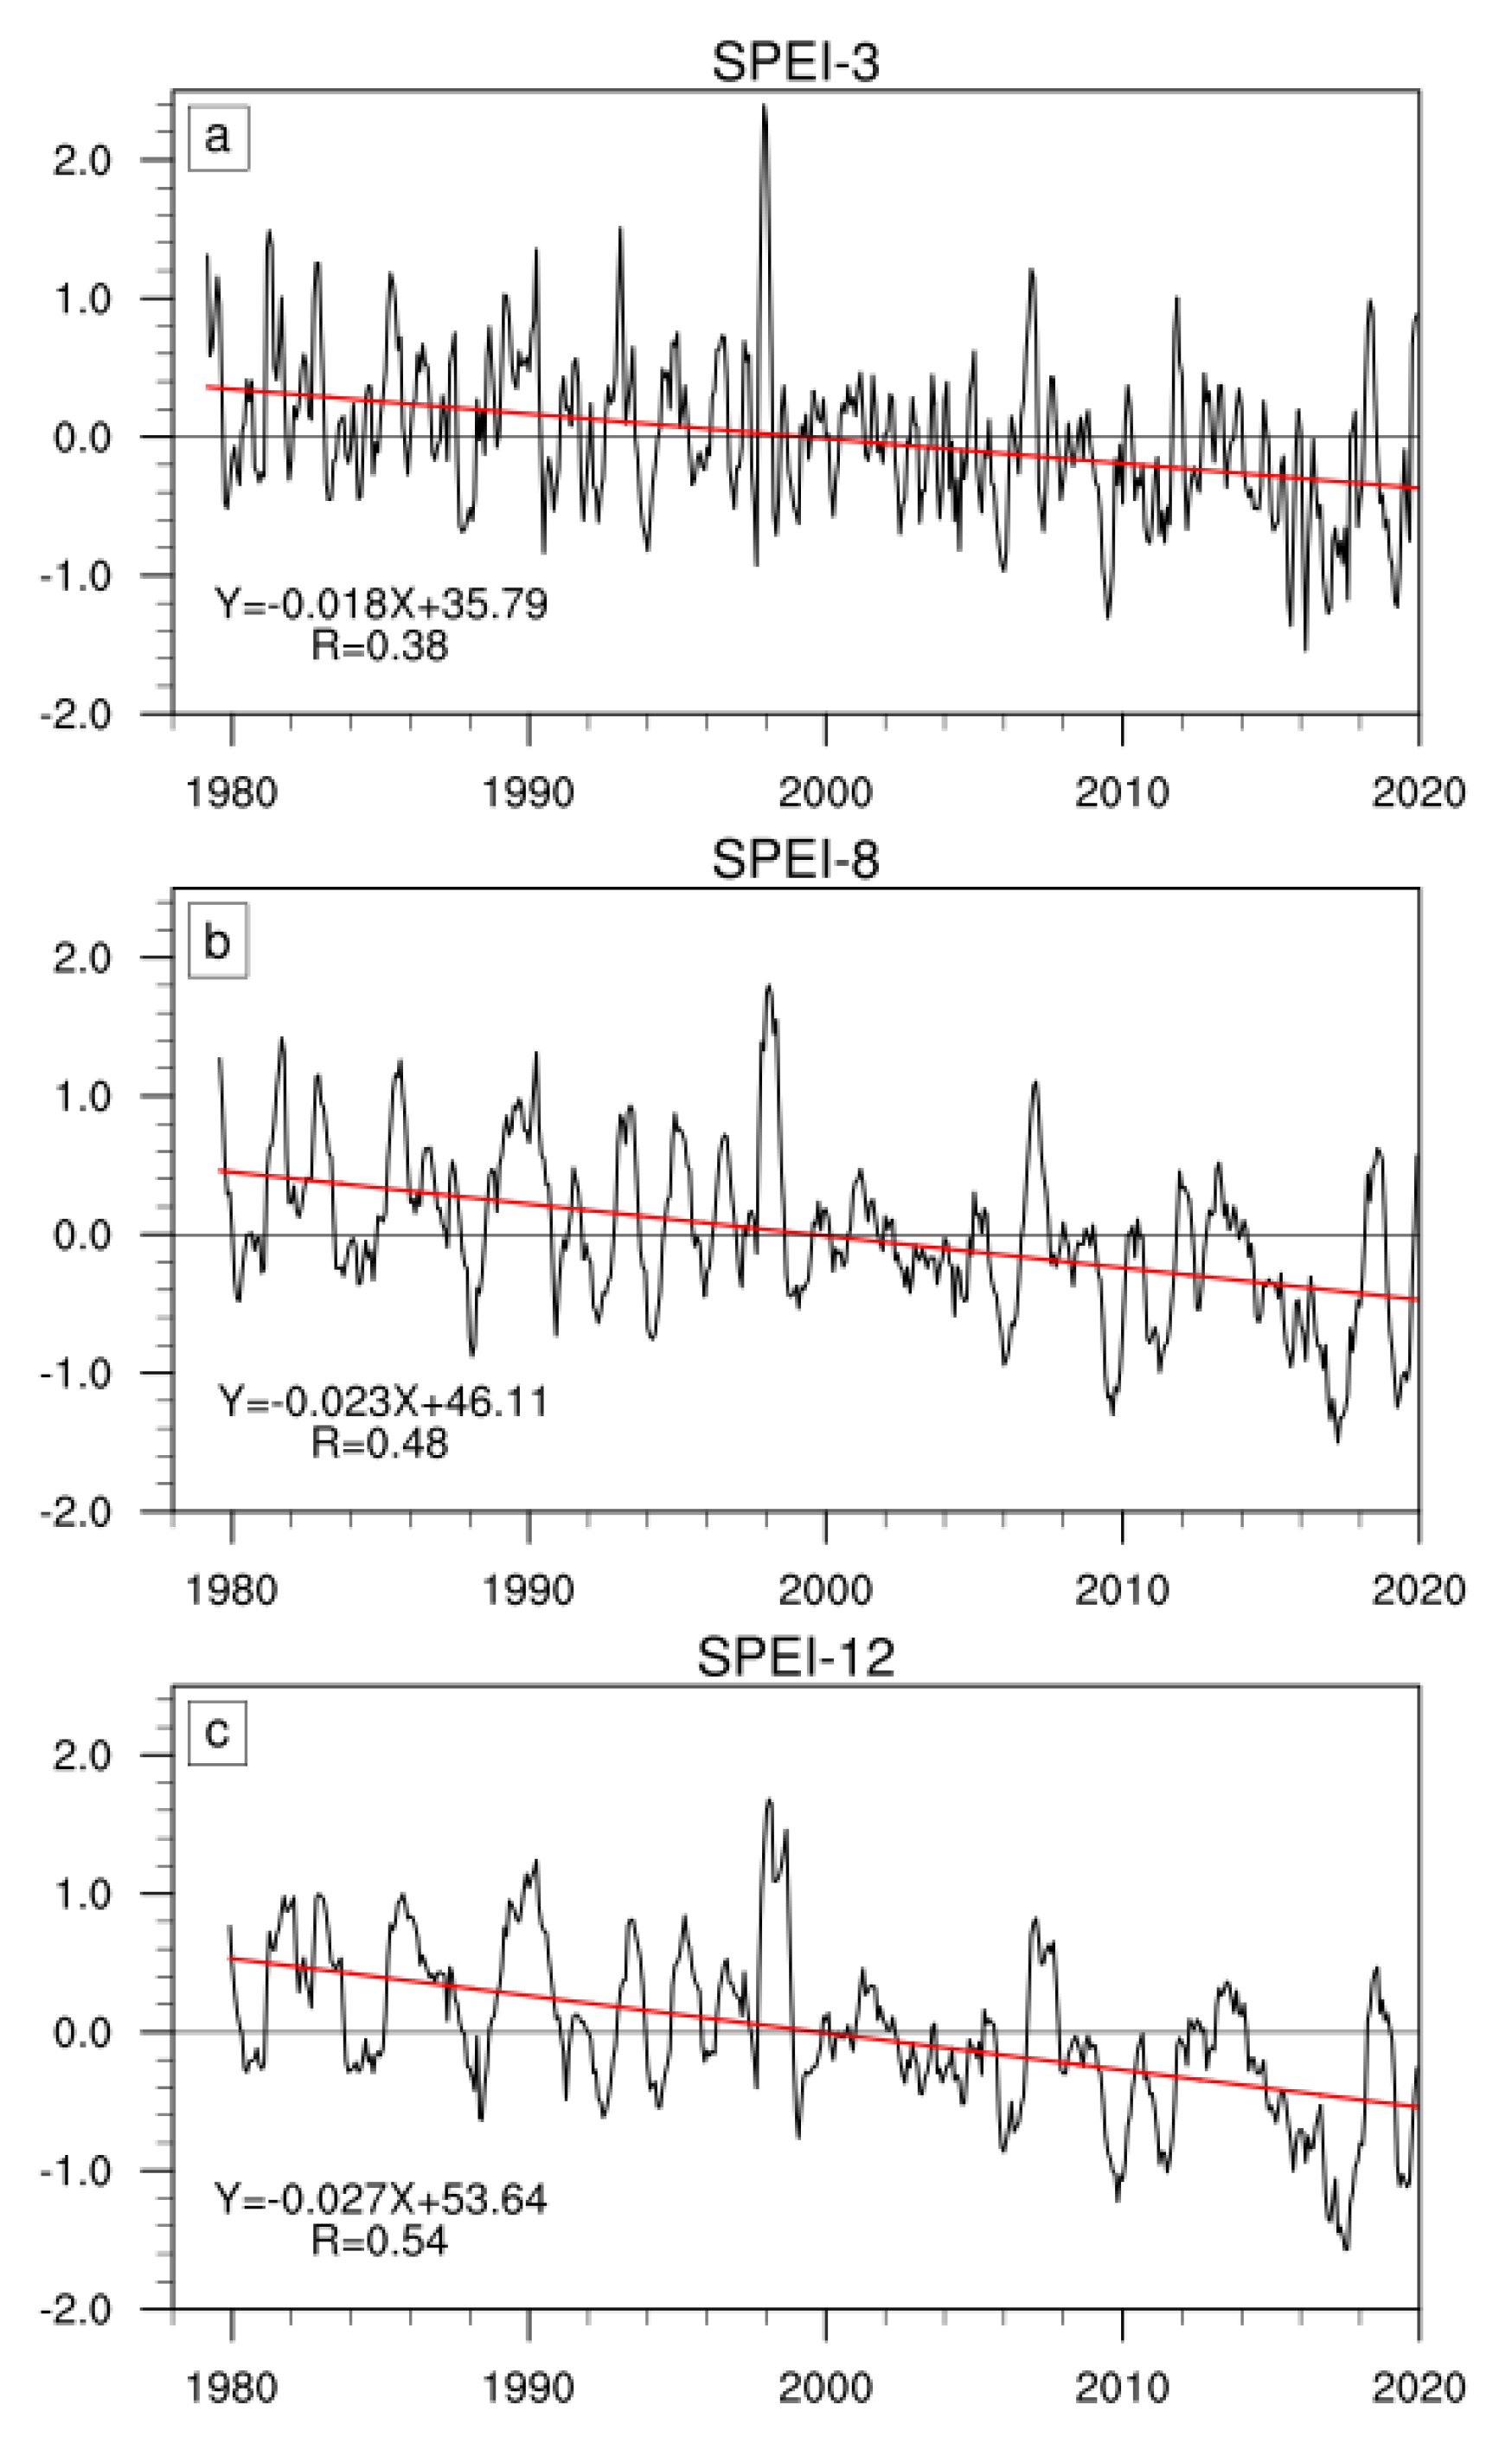
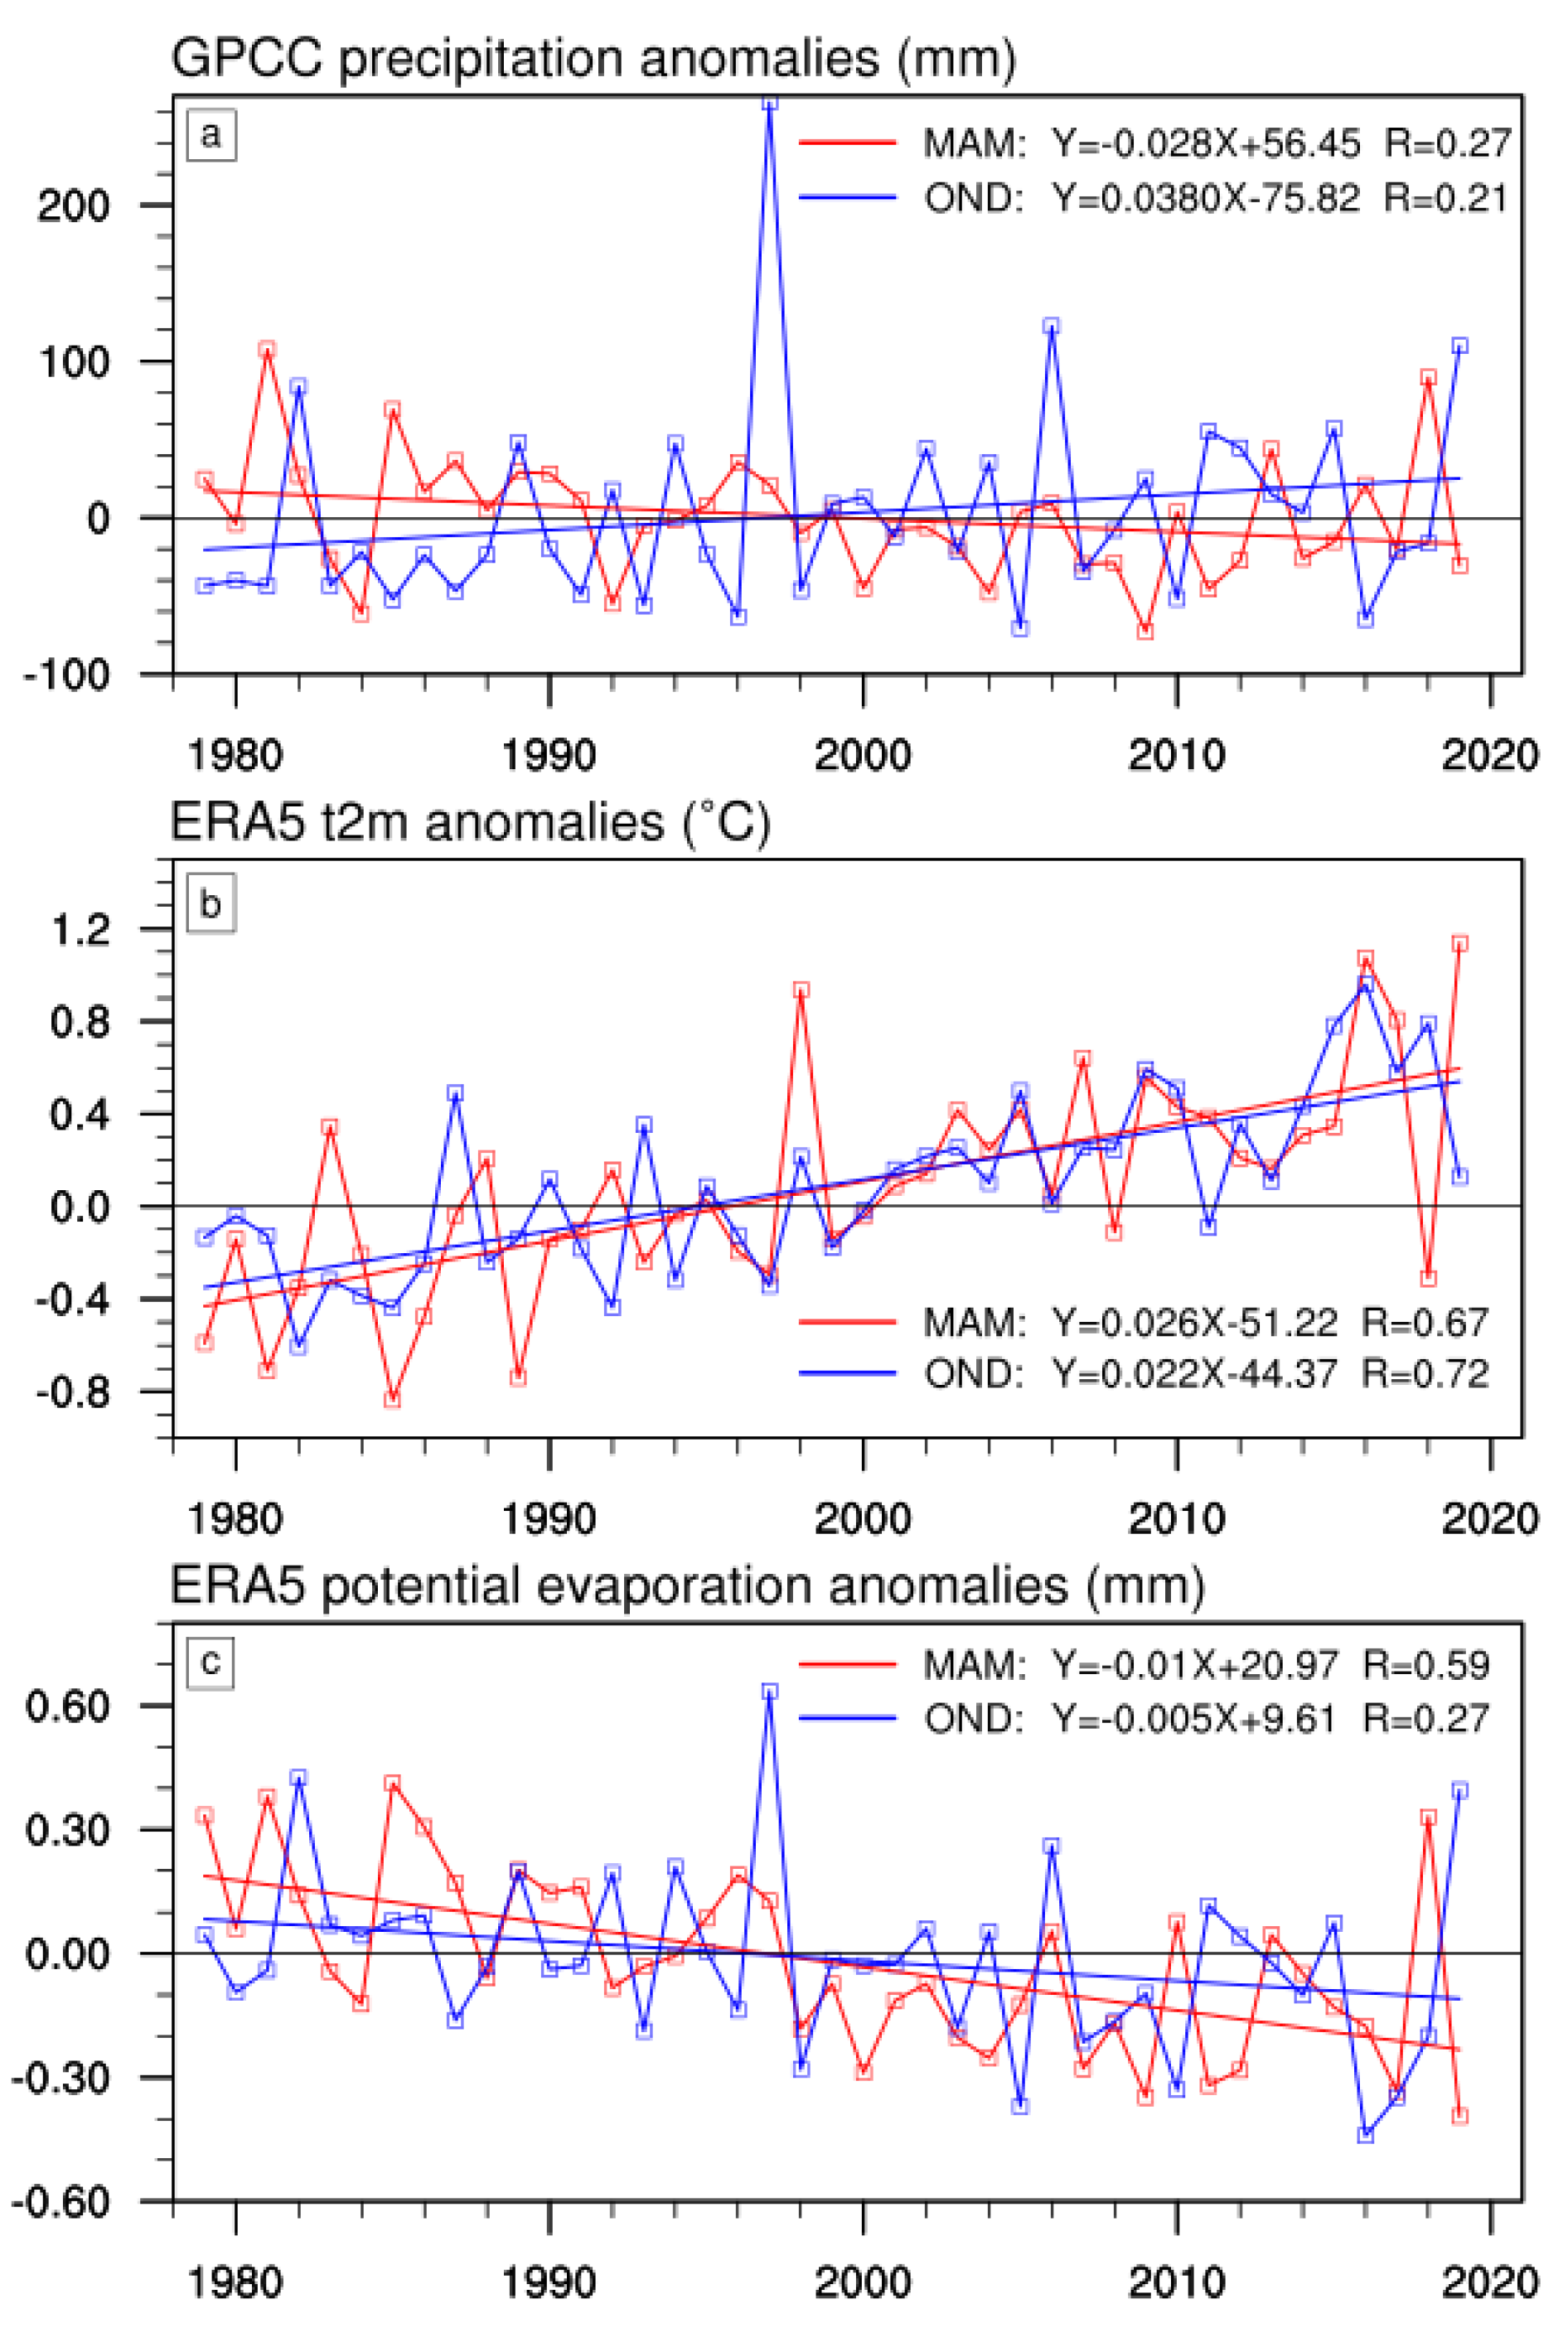
3.2. Characteristics of Long-Term Trends in Drought of HOA

The SPEI is a multi-scalar drought index used to assess the occurrence, duration, and intensity of drought events. In this study, the SPEI at given time intervals based on monthly time series of precipitation and temperature were calculated. Figure 4a–c clearly depicts variations and trends of SPEI in 3-month (SPEI-3), 8-month (SPEI-8), and 12-month (SPEI-12) timescales, reflecting drought characteristics on seasonal, two consecutive rainy seasons (from pre-OND to MAM), and annual timescales, respectively. Results show that variations of frequency, intensity and magnitude of drought events at different time scales are basically consistent. Figure 4a–c reveals that three SPEI at different timescales, respectively, decline at a rate of −0.018/3-month, −0.023/8-month, and −0.027/year. The obvious downward trend of SPEI-3 (Figure 4a) is significant at 95% confidence level (R = 0.38). Relatively, the occurring frequency of drought events on seasonal timescale in the 21st century is higher than that in the past, with the most severe drought occurring around 2016–2017. Figure 4b illustrates that SPEI-8 declines significantly at 99% confidence level (R = 0.48). It shows that the frequency, duration, and intensity of drought events occurring on two consecutive rainy seasons increase significantly. The longest duration of drought event in SPEI-8 is found in the period from 2014 to 2018, with the worst magnitude in 2017. The variation of annual drought described by SPEI-12 (Figure 4c) shows a more significant decreasing trend, reaching 99.9% (R = 0.54) significant level. It successfully identifies mild droughts of 1980–1981, 1984–1985, 1988–1989, 1992–1993, 1994–1995, 1999–2000, 2003–2005, and 2006–2007; moderate droughts of 2010–2011 and 2019–2020; and severe drought of 2016–2017.
The SPEI analyses indicate that the HOA is highly sensitive to climate and has poor tolerance to drought. Mild droughts could result in severe social crises to this region. For instance, in northern Ethiopia and Sudan, the 1983/1984 drought triggered a famine that killed nearly 1 million people [22], and the drought in 1991/1992 led to the deterioration of food security. Since the 21st century, the occurrence of drought has been more frequent with longer duration and greater intensity, as the climate change scientists warmed. In 2010/2011, Kenya, Somalia, and southeastern Ethiopia were struck by a moderate drought, which was estimated to be the worst in the last 60 years [17], placing approximately 12 million people into a humanitarian crisis (http://reliefweb.int/horn-africa-crisis2011, accessed on 13 January 2022). Subsequently, from the short rains of 2016 to the long rains of 2017, severe drought led to significant losses in crop and pasture production, and millions were affected by famine [30,31]. Distributions of the lowest values of SPEI at different timescales indicate that the drought occurring during 2016–2017was the worst in the last 41 years. Worsening drought, to be sure, has exacerbated environmental vulnerability and triggered human social crisis in the HOA.
To further discuss the occurrence probabilities of severe drought event in 2016/2017, the generalized extreme value (GEV) is performed to estimate return periods of drought of two consecutive rainy seasons from short rains to long rains (from October to May in the following year). Thus, GEV distribution is applied respectively to time series of SPEI-8, accumulated precipitation, average temperature of T2m, and the potential evaporation (PEV) of ERA5 in the same period. Based on the current ECMWF Integrated Forecasting System (IFS), PEV is a measure of the extent to which near-surface atmospheric conditions are conducive to the process of evaporation. Negative values indicate evaporation, and positive values indicate condensation. As shown in Figure 5a, according to the fitted curve of scaled GEV distribution, the return period of the SPEI-8 from 2016 October to 2017 May is about 1-in-250 years. Meanwhile, the return periods of low accumulated precipitation (Figure 5b) and high mean temperature (Figure 5c) in this period are about 1-in-9 years and 1-in-33 years, respectively, and the return period of mean PEV (Figure 5d) is 1-in-131 years. The analysis of return periods illuminates that an extreme drought occurred from short rains in 2016 to long rains in 2017, however, precipitation and temperature, as the two main driving factors, presented less degrees of extremes. On the other hand, evaporation presented through PEV shows notable degrees of extreme.
We knew that the occurrence and development of drought depends on the budget variations of precipitation and evaporation, whereas the evaporation is closely related with temperature. Undoubtedly, precipitation and temperature are key drivers of meteorological drought formation [56]. The SPEI is designed to take into account not only precipitation but also temperature when assessing drought conditions, so that it can indicate the crucial effects of temperatures on water budget. To better understand the impacts of meteorologic factors on SPEI, the standardized multiple linear regression analysis is performed on seasonal SPEI and anomalies of precipitation and temperature during the last 41 years. Since the standardized regression coefficients (Table 3) are expressed in units of standard deviation, they may be directly compared with each other to determine the most effective variables. As can be seen from Table 3, an increasing precipitation or decreasing temperature results in an increasing SPEI. The results of the significanc test indicate that the effect of precipitation on seasonal dry/wet condition in HOA is generally more significant than that of temperature. However, return periods analysis shows that precipitation anomalies of extremely severe drought 2016/2017 are not as extreme as temperature anomalies. Therefore, the attribution of this extreme drought event is unique and particular, which deserves further analysis.

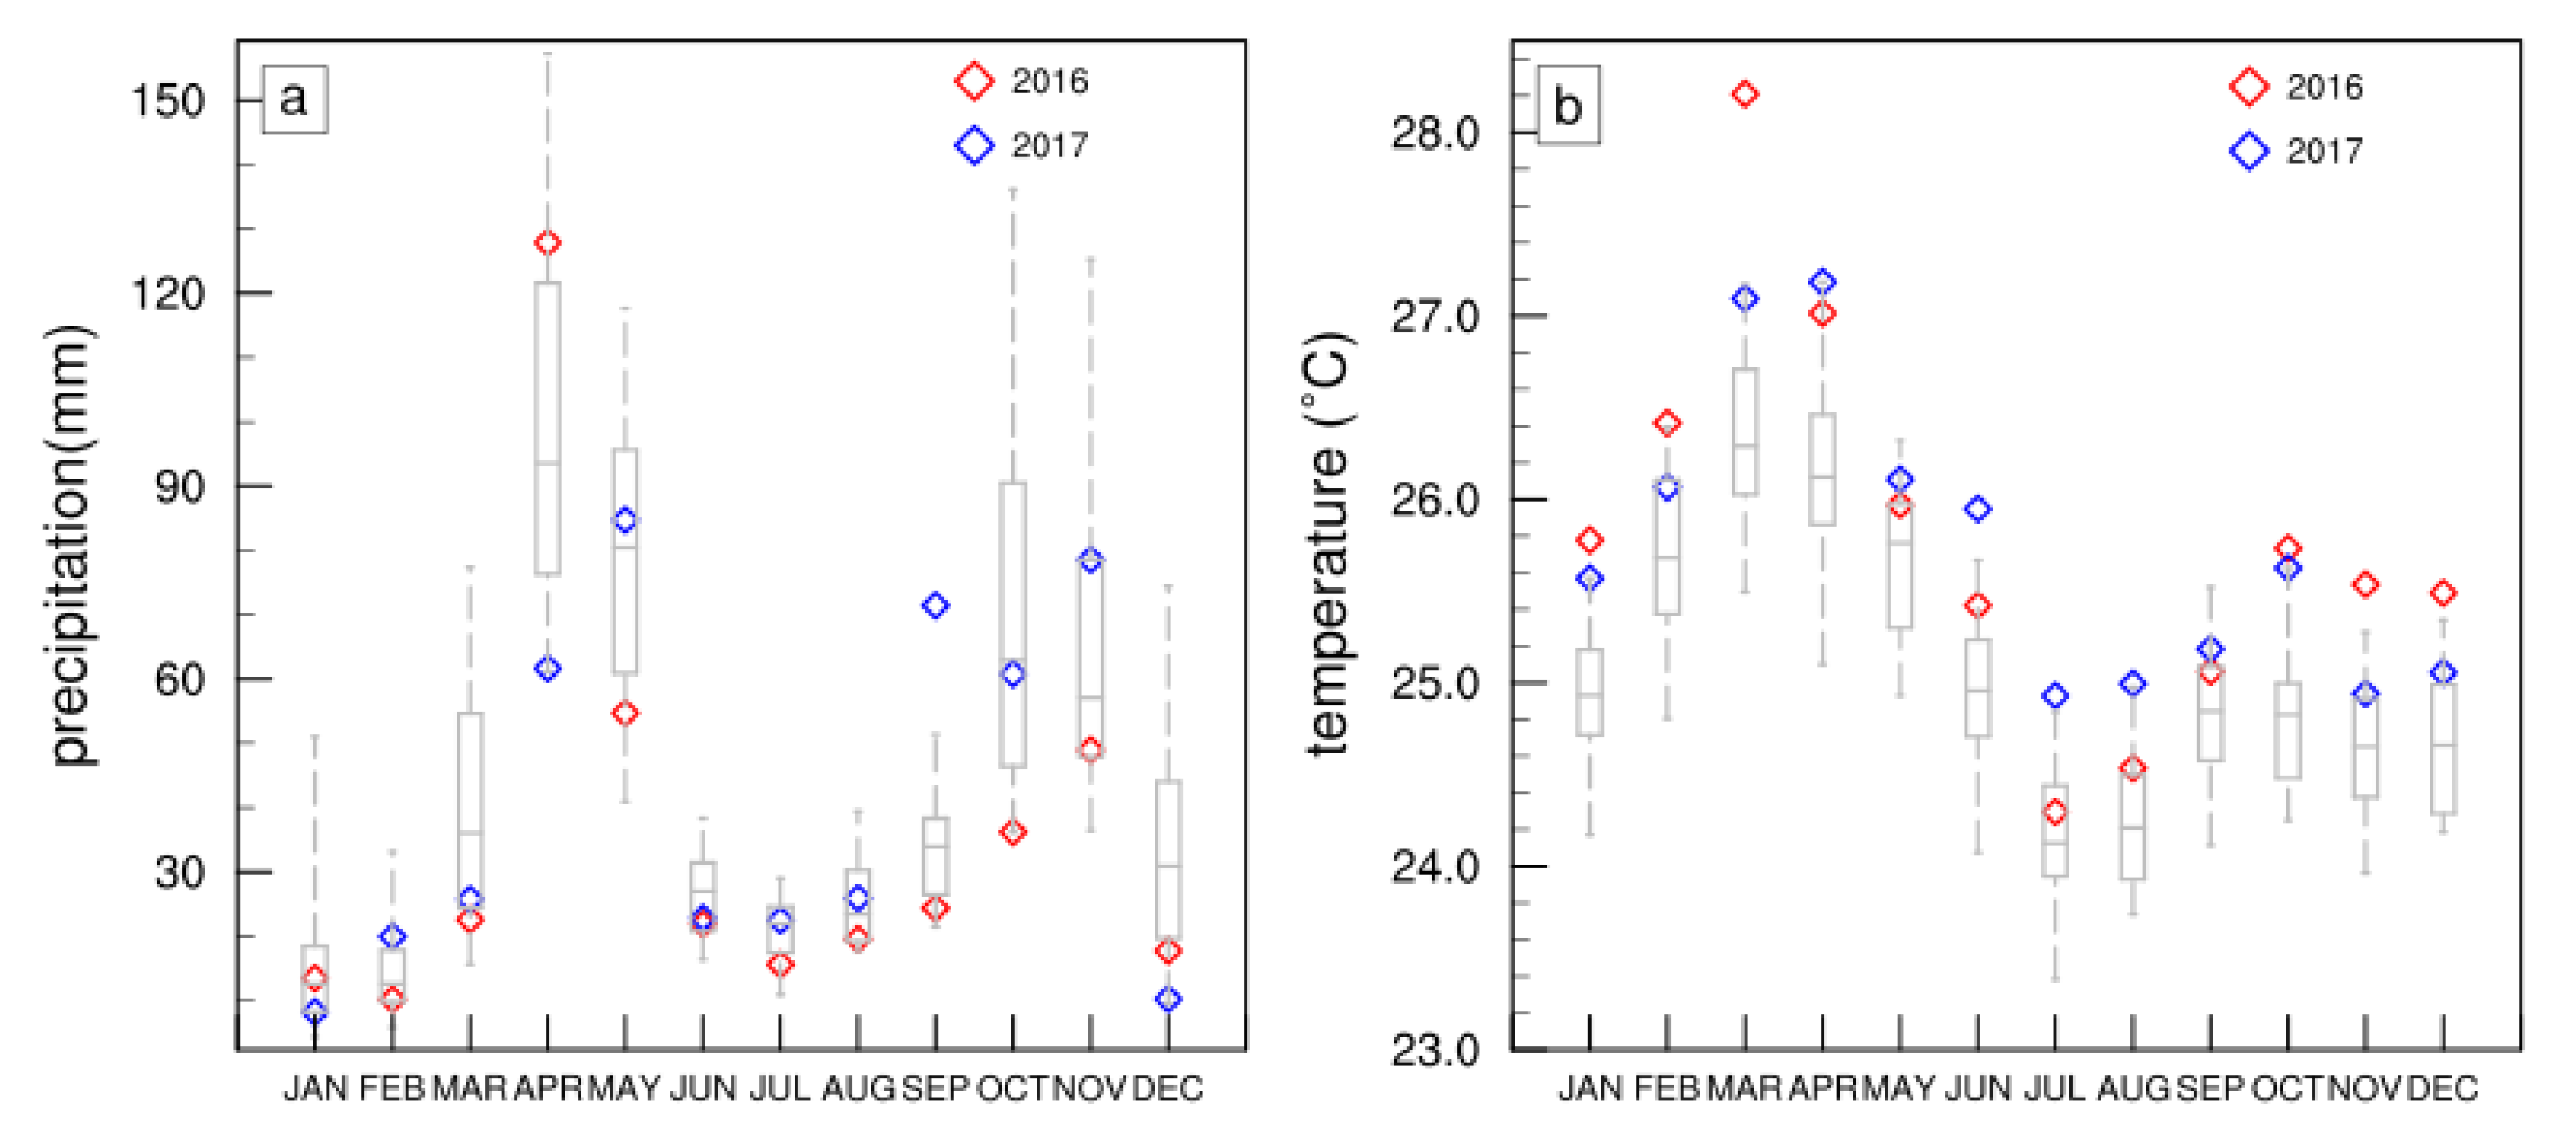
3.3. Analysis of Attribution of Extreme Drought in 2016/2017

In this section, anomalies of meteorologic factors during the extreme drought in 2016/2017 are analyzed in comparison with those of historical drought events. The time series of MAM and OND precipitation anomalies based on GPCC dataset are shown in Figure 6a. The interannual rainfall in MAM shows a declining trend, while the anomalies of OND rainfall show an increasing trend. In addition, OND rainfall displays more significant interannual variability than that of long rains. Comparing with historical drought events detected by SPEI, the accumulated rainfall from October 2016 to May 2017 was the fourth lowest during the last 41 years, with the OND 2016 rainfall anomalies of −64.81 mm, the second lowest during this period, and MAM 2017 rainfall anomalies of −20.37 mm. Figure 7a shows the box-and-whisker plot of monthly precipitation in 2016–2017. The box-and-whisker plot splits datasets into quartiles based on the period of 1979–2019, which can be used to compare climate anomalies in a specific month. From January 2016 to April 2017, except for abundant precipitation higher than the 75th percentile in April 2016, precipitations were all below the 25th percentile in other months. Significantly less precipitations from OND 2016 to MAM 2017 are in favor of the occurrence of persistent drought in the HOA.
Figure 6b depicts the temperature anomalies over the last 41 years, which has increased at an unprecedented rate. The obviously increasing trends of temperature anomalies both in MAM and OND are significant at 99.9% confidence level (R = 0.67 for MAM, R = 0.72 for OND). In 2016, the temperature of the whole year was above the 95th percentile (Figure 7b). As expected, the anomalous temperature values in MAM 2016 were the second highest during 1979–2019, and temperature in OND 2016 was the highest. Although the temperature in 2017 was lower than that of 2016, it was still around 1 °C above average temperature. High temperature approaching the 95th percentile persisted the whole year. Undoubtedly, the extreme heat deteriorated this drought event. Therefore, it can be seen that the drought in 2016/2017 was not a normal drought caused by less rainfall, but a compound drought accompanied by high temperature. Simultaneous occurrence of drought and high temperature is the unique characteristic of this extreme event.
According to previous researches, temperature plays a strong role on the drought severity by increasing evapotranspiration and exacerbating drought stress [33,57]. To further discuss the contribution of extreme heat to this compound event, the potential evaporation (PEV) of ERA5 was further analyzed in the study period (Figure 6c). Unlike the PET, which is calculated by the Thornthwaite equation, the PEV is the output of the current ECMWF Integrated Forecasting System (IFS). PEV is usually considered to be the amount of evaporation, under existing atmospheric conditions, from a surface of pure water, which has the temperature of the lowest layer of the atmosphere and gives an indication of the maximum possible evaporation. In Figure 6c, seasonal PEV exhibits a declining trend. It illuminates that PEV in MAM shows a more significant declining trend than that in OND, reaching 99.9% significant level (R = 0.59). The amount of evaporation in OND 2016 is the highest ever for the same period, and the higher evaporation persists till MAM 2017, which further exacerbates this drought event. As a consequence, the devastating impact of this compound drought is much higher than that of the normal drought events due to the combined effect of less precipitation and higher evaporation caused by high temperature.

4. Discussion

Unlike the humid climate of tropical region, the HOA presents a unique semiarid feature with the lowest annual rainfall in the tropics. This region that we focused on in this study shows a notable bimodal rainfall characteristic, with the greatest precipitation during long rains (MAM) and short rains (OND). The analysis of SPEI on different timescales reveals that the drought of the HOA was getting worse from 1979 to 2019, which corresponds with previous studies [28]. Meanwhile, compared with temperature, less precipitation plays a crucial role in the formation of drought in this region. The spatial and temporal characteristics of droughts in the HOA have been extensively studied [14,27,28]. In terms of severity, however, the drought of recent years is unprecedented.
Thus, there are two important issues worth thinking about and discussing: (1) why are droughts getting worse in this region? Primary researchers have found that decreasing long rains precipitation is closely related to increasing droughts of the HOA in recent years [58,59]. However, so far, it is difficult to explain the causes of the changes in long rains due to the insignificant correlations between the large scale oceanic and atmospheric modes and the long rains [60,61]. Either oceanic or atmospheric, no forcing factors of the precipitation in this season, had been identified in past studies [55,62]. Unlike long rains, precipitation of short rains, which dominates the interannual variability of East African rainfall [14,63], shows the strongest teleconnection with large-scale climate modes, such as El Niño-Southern Oscillation (ENSO) and Indian Ocean Dipole (IOD) [53,64,65,66]. Drought in short rains is closely related to La Niña and negative IOD modes, as the zonal gradient anomalies of sea surface temperature (SST) favor less OND rainfall over the HOA [14]. For instance, two severe drought events were due to below-normal rainfalls in OND of 2010 and 2016 consistent with La Niña. Therefore, ENSO can be used as a significant indicator for precipitation anomalies in short rains of the HOA, while the causes of low precipitation in long rains still need to be further studied.
Results of GEV illuminate that the return period of drought in 2016/2017 is about 1-in-250 years, which indicates that it was an extreme drought during 1979 to 2019. Historically, Africa has experienced huge droughts that were mainly driven by rare rainfall [33]. However, unlike a normal drought caused by a severe lack of rainfall, the 2016 short rains’ (2017 long rains) precipitation was only 27.1% (11.8%) below normal. Therefore, we further analyzed the possible causes why the extreme drought disaster formed and intensified in the absence of extremely low rainfall. Trends analyses show that the increasing trend of temperature of the HOA is much more significant than the decreasing trend of precipitation in long rains and the increasing trend of precipitation in short rains. The temperature of the HOA goes up steadily under the background of global warming. Global record heat in 2016 above expectation shocked scientists and the World Meteorological Organization (WMO), yet global temperature in 2018 set a new record.
From 2016 to spring 2017, across most of the HOA, not only was there less precipitation but it also was struck by an unprecedented heat. Thus, the extremely severe drought of 2016/2017 is not a normal drought that is only caused by low rainfall, but can be referred to as a compound drought, involving the concurrence of multiple dependent hazards: drought and heat. In this compound drought event, below-normal precipitation and extreme heat contributed to the exceptional magnitude of the extreme drought, which were exacerbated by unusually high temperatures.
Compound extreme event usually refers to multiple dependent extremes that occur concurrently or consecutively. It involves the interaction of various physical phenomenon or the interaction leading to extreme effects. Compound extremes tend to have high impacts because their effects may not depend on an individual extreme factor, but comprehensive effects of multiple factors [6,67,68]. The concurrence of droughts and extreme heat, as a compound drought, may lead to larger impacts [69,70,71]. Thus, the extreme drought in 2016/2017, as a compound drought, may involve more than two variables, such as low precipitation, low soil moisture, high temperature, and high evaporation. There is a clear sense that multiple contributing factors play a crucial role in tracing compound extremes, by amplifying their potential impacts. Therefore, when analyzing the causes of the droughts getting worse in the HOA, the extreme heat caused by global warming must be taken into account.
The second issue is: What is the variation trend of drought in the HOA under the background of global warming? In the HOA, according to the long term variations of precipitation and temperature, characteristics of climate change re obvious. The adverse effects of climate warming have been the concern of the entire world. It is likely to cause environmental, social, economic, food security, and other political issues, especially in sensitive and vulnerable areas [72]. So far, results of different modeling experiments show ambiguous conclusions about the climate of the HOA, especially the contribution of anthropogenic forcing to rainfall. A sensitivity experiment [73] found that the anthropogenic forcing could have resulted in the drought of 2011 long rains, as well as the conclusion of [74], which indicated that the long rains will be dry by the midcentury due to the anthropogenic forcing based on phase 3 of the Coupled Model Intercomparison Project (CMIP3). However, Yang et al. [59] discussed that anthropogenic forcing will contribute to more rainfall in the HOA based on model projections of CMIP5. Although the IPCC notes that climate model projections generally suggest that land will become wetter this century due to anthropogenic forcing, whether it will result in wetter or drier HOA is still a controversial issue because of the poor simulation of rainfall in the HOA [14,59].
According to IPCC-AR6, if global warming continues unabated, compound extreme events, which have been unlikely to occur in the past and until now, will become more frequent. In addition, unprecedented events with increased intensities, duration, and spatial extents will occur [1]. As the risks of compound events increase in the context of global warming, it is necessary to develop methods for their detection and attribution, assess their societal and environmental impacts and risks, and improve their predictability [75], especially in vulnerable regions like the Horn of Africa.

5. Conclusions

In this study, we focused on the extreme drought of the HOA in 2016/2017. Through analyzing and discussing characteristics of drought index, precipitation, temperature, and potential evaporation, the following conclusions are drawn:
Drought is an inescapable disaster due to the semiarid climate of the HOA, especially in Kenya, Somalia, and southeastern Ethiopia. There is little difference in temperature between months, but precipitation shows obvious bimodal distribution in the HOA. Precipitation of short rains in OND, which is less than that of long rains in MAM, shows more significant interannual variance.
Generally, the occurrence of normal drought events in the HOA depends on less rainfall. Droughts have exhibited increasing trends over the past decades, with an extreme drought event during the period of 1979–2019 occurring in 2016/2017. The drought of 2016/2017 can be referred to as a compound drought event. The concurrence of below-normal precipitation and extreme heat contributed to the exceptional magnitude of the extreme drought.
At present, it is difficult to predict the precipitation over the HOA region due to the poor simulation ability of dynamic models. Meanwhile, as the occurrences of compound events will increase in the context of global warming, it is necessary to improve the predictability of compound droughts and provide forewarning for the devastation caused by compound extreme events in the vulnerable HOA.

Author Contributions

Conceptualization, X.H.; Methodology, X.H. and Y.L.; Supervision, W.Y.; Validation, W.Y. and L.F.; Wrinting-original draft, X.H.,Y.L. and W.Y.; Writing-review & editing, X.H. All authors have read and agreed to published version of the manuscript.

Funding

This work was joinly supported by the National Natural Science Foundation of China (Grant No. 42176017, No. 41306007 and No. 41576029), National Key Research and Development Program (Grant No. 2018YFC1505802) and Shenzhen University Stability Support Program (Grant No. 20200810000724001).

Institutional Review Board Statement

Not applicable.

Informed Consent Statement

Not applicable.

Data Availability Statement

Not applicable.

Acknowledgments

The authors appreciated the constructive comments and insightful suggestions from three reviewers and editors.

Conflicts of Interest

The authors declare no conflict of interest.

References

  1. Intergovernmental Panel on Climate Change (IPCC). Summary for Policymakers. In Climate Change 2021: The Physical Science Basis. Contribution of Working Group I to the Sixth Assessment Report of the Intergovernmental Panel on Climate Change; Masson-Delmotte, V., Zhai, P., Pirani, A., Connors, S.L., Péan, C., Berger, S., Caud, N., Chen, Y., Goldfarb, L., Gomis, M.I., et al., Eds.; Cambridge University Press: Cambridge, UK, 2021; in press. [Google Scholar]
  2. Intergovernmental Panel on Climate Change (IPCC). Summary for Policymakers. In Global Warming of 1.5 °C: An IPCC Special Report on the Impacts of Global Warming of 1.5 °C above Pre-Industrial Levels and Related Global Greenhouse Gas Emission Pathways, in the Context of Strengthening the Global Response to the Threat of Climate Change, Sustainable Development, and efforts to Eradicate Poverty; Masson-Delmotte, V., Zhai, P., Pörtner, H.-O., Roberts, D., Skea, J., Shukla, P.R., Pirani, A., Moufouma-Okia, W., Péan, C., Pidcock, R., et al., Eds.; Cambridge University Press: Cambridge, UK, 2018; in press. [Google Scholar]
  3. Coumou, D.; Rahmstorf, S. A decade of weather extremes. Nat. Clim. Chang. 2012, 2, 491–496. [Google Scholar] [CrossRef]
  4. Trenberth, K.E.; Fasullo, J.T.; Shepherd, T.G. Attribution of climate extreme events. Nat. Clim. Chang. 2015, 5, 725–730. [Google Scholar] [CrossRef]
  5. Diffenbaugh, N.S.; Singh, D.; Mankin, J.S.; Horton, D.E.; Swain, D.L.; Touma, D.; Charland, A.; Liu, Y.; Haugen, M.; Tsiang, M.; et al. Quantifying the influence of global warming on unprecedented extreme climate events. Proc. Natl. Acad. Sci. USA 2017, 114, 4881–4886. [Google Scholar] [CrossRef] [PubMed] [Green Version]
  6. Hao, Z.; Hao, F.; Singh, V.P.; Ouyang, W.; Zhang, X.; Zhang, S. A joint extreme index for compound droughts and hot extremes. Theor. Appl. Climatol. 2020, 142, 321–328. [Google Scholar] [CrossRef]
  7. Seneviratne, S.; Nicholls, N.; Easterling, D.; Goodess, C.; Kanae, S.; Kossin, J.; Luo, Y.; Marengo, J.; McInnes, K.; Rahimi, M.; et al. Changes in climate extremes and their impacts on the natural physical environment. In Managing the Risks of Extreme Events and Disasters to Advance Climate Change Adaptation: A Special Report of Working Groups I and II of the Intergovernmental Panel on Climate Change (IPCC); Field, C.B., Barros, V., Stocker, T.F., Qin, D., Dokken, D., Ebi, K.L., Mastrandrea, M.D., Mach, K.J., Plattner, G.-K., Allen, S.K., et al., Eds.; Cambridge University Press: Cambridge, UK, 2012; pp. 109–230. [Google Scholar]
  8. Zscheischler, J.; Westra, S.; Van Den Hurk, B.J.; Seneviratne, S.I.; Ward, P.J.; Pitman, A.; AghaKouchak, A.; Bresch, D.N.; Leonard, M.; Wahl, T.; et al. Future climate risk from compound events. Nat. Clim. Chang. 2018, 8, 469–477. [Google Scholar] [CrossRef]
  9. Kiem, A.S.; Johnson, F.; Westra, S.; Van Dijk, A.; Evans, J.; O’Donnell, A.; Rouillard, A.; Barr, C.; Tyler, J.; Thyer, M.; et al. Natural hazards in Australia: Droughts. Clim. Chang. 2016, 139, 37–54. [Google Scholar] [CrossRef]
  10. Livneh, B.; Hoerling, M.P. The Physics of Drought in the U.S. Central Great Plains. J. Clim. 2016, 29, 6783–6804. [Google Scholar]
  11. Shukla, S.; Safeeq, M.; AghaKouchak, A.; Guan, K.; Funk, C. Temperature impacts on the water year 2014 drought in California. Geophys. Res. Lett. 2015, 42, 4384–4393. [Google Scholar] [CrossRef] [Green Version]
  12. Conway, D.; Schipper, E.L.F. Adaptation to climate change in Africa: Challenges and opportunities identified from Ethiopia. Glob. Environ. Chang. 2011, 21, 227–237. [Google Scholar] [CrossRef]
  13. Ghebrezgabher, M.G.; Yang, T.; Yang, X. Remote sensing and GIS analysis of deforestation and desertification in central highland and eastern region of Eritrea (1972–2014). Int. J. Sci. Basic Appl. Res. 2014, 18, 161–176. [Google Scholar]
  14. Lyon, B. Seasonal drought in the greater horn of Africa and its recent increase during the March–May long rains. J. Clim. 2014, 27, 7953–7975. [Google Scholar] [CrossRef]
  15. Beltrando, G. Space–time variability of rainfall in April and October–November over East Africa during the period 1932–1983. Int. J. Climatol. 1990, 10, 691–702. [Google Scholar] [CrossRef]
  16. Camberlin, P.; Wairoto, J.G. Intraseasonal wind anomalies related to wet and dry spells during the ‘‘long’’ and ‘‘short’’rainy seasons in Kenya. Theor. Appl. Climatol. 1997, 58, 57–69. [Google Scholar] [CrossRef]
  17. Lyon, B.; DeWitt, D.G. A recent and abrupt decline in the East African long rains. Geophys. Res. Lett. 2012, 39, L02702. [Google Scholar] [CrossRef] [Green Version]
  18. Salami, A.; Kamara, A.B.; Brixiova, Z. Smallholder Agriculture in East Africa: Trends, Constraints, and Opportunities; African Development Bank Working Papers Series No. 105; African Development Bank: Tunis, Tunisia, 2010; p. 52. Available online: http://www.afdb.org/fifileadmin/uploads/afdb/Documents/Publications/WORKING%20105%20%20PDF%20d.pdf (accessed on 15 September 2021).
  19. Human Rights Watch. Evil Days: 30 Years of War and Famine in Ethiopia; An Africa Watch Report; Human Rights Watch: New York, NY, USA, 1991. [Google Scholar]
  20. Allen, C.D.; Macalady, A.K.; Chenchouni, H.; Bachelet, D.; McDowell, N.; Vennetier, M.; Cobb, N. A global overview of drought and heat-induced tree mortality reveals emerging climate change risks for forests. For. Ecol. Manag. 2010, 259, 660–684. [Google Scholar] [CrossRef] [Green Version]
  21. Abdulkadir, G. Assessment of drought recurrence in Somaliland: Causes, impacts and climatology. J. Climatol. Weather. Forecast. 2017, 5, 2. [Google Scholar] [CrossRef] [Green Version]
  22. Devereux, S. Famine in the Twentieth Century; IDS Working Paper 105; Institute of Development Studies, University of Sussex: Brighton, UK, 2000; p. 40. [Google Scholar]
  23. United Nations Organization for the Coordination of Humanitarian Affairs (UN OCHA). Eastern Africa Drought; Humanitarian Rep. 4; United Nations Organization for the Coordination of Humanitarian Affairs: New York, NY, USA, 2011; p. 10. [Google Scholar]
  24. Tran, M. Explainer: The East Africa Food Crisis. Guardian, 12 July 2011. [Google Scholar]
  25. Checchi, F.; Robinson, W.C. Mortality among Populations of Southern and Central Somalia Affected by Severe Food Insecurity and Famine during 2010–2012; Food and Agriculture Organization (FAO); Famine Early Warning Systems Network (FEWS NET): Rome, Italy, 2013; p. 87. [Google Scholar]
  26. Loewenberg, S. Humanitarian response inadequate in Horn of Africa crisis. Lancet 2011, 378, 555–558. [Google Scholar] [CrossRef]
  27. Musei, S.K.; Nyaga, J.M.; Dubow, A.Z. SPEI-based spatial and temporal evaluation of drought in Somalia. J. Arid. Environ. 2021, 184, 104296. [Google Scholar] [CrossRef]
  28. Nicholson, S.E. A detailed look at the recent drought situation in the Greater Horn of Africa. J. Arid Environ. 2014, 103, 71–79. [Google Scholar] [CrossRef]
  29. Dutra, E.; Magnusson, L.; Wetterhall, F.; Cloke, H.L.; Balsamo, G.; Boussetta, S.; Pappenberger, F. The 2010-2011 drought in the Horn of Africa in ECMWF reanalysis and seasonal forecast products. Int. J. Clim. 2013, 33, 1720–1729. [Google Scholar] [CrossRef] [Green Version]
  30. United Nations Organization for World Food Programme (UN WFP). Kenya Drought Situation Report—January 2017. Available online: https://www.wfp.org/publications/wfp-kenya-drought-situation-report-jan-2017 (accessed on 13 January 2022).
  31. United Nations Disaster Risk Reduction (UN DRR). The Drought in Kenya, 2016–2017. 2017. Available online: https://www.preventionweb.net/publications/view/53538 (accessed on 13 January 2022).
  32. Kinuthia, J.H. Horizontal and vertical structure of the Lake Turkana jet. J. Appl. Meteorol. 1992, 31, 1248–1274. [Google Scholar] [CrossRef] [Green Version]
  33. Hebrezgabher, M.G.; Yang, T.; Yang, X. Long-Term Trend of Climate Change and Drought Assessment in the Horn of Africa. Adv. Meteorol. 2016, 2016, 12–13. [Google Scholar]
  34. Schneider, U.; Becker, A.; Finger, P.; Meyer-Christoffer, A.; Ziese, M.; Rudolf, B. GPCC’s new land surface precipitation climatology based on quality-controlled in situ data and its role in quantifying the global water cycle. Theor. Appl. Climatol. 2014, 115, 15–40. [Google Scholar] [CrossRef] [Green Version]
  35. Hersbach, H.; Bell, B.; Berrisford, P.; Biavati, G.; Horányi, A.; Muñoz Sabater, J.; Nicolas, J.; Peubey, C.; Radu, R.; Rozum, I.; et al. ERA5 Monthly Averaged Data on Pressure Levels from 1979 to Present. Copernicus Climate Change Service (C3S) Climate Data Store (CDS). 2019. Available online: https://doi.org/10.24381/cds.6860a573 (accessed on 13 January 2022). [CrossRef]
  36. Palmer, W.C. Meteorological Drought Research Paper; U.S. Department of Commerce Weather Bureau: Washington, DC, USA, 1965; p. 45.
  37. Hayes, M.J.; Svoboda, M.D.; Wiihite, D.A.; Vanyarkho, O.V. Monitoring the 1996 drought using the standardized precipitation index. Bull. Am. Meteorol. Soc. 1999, 80, 429–438. [Google Scholar] [CrossRef] [Green Version]
  38. Narasimhan, B.; Srinivasan, R. Development and evaluation of Soil Moisture Deficit Index (SMDI) and Evapotranspiration Deficit Index (ETDI) for agricultural drought monitoring. Agric. For. Meteorol. 2005, 133, 69–88. [Google Scholar] [CrossRef]
  39. Hao, Z.; AghaKouchak, A. Multivariate standardized drought index: A parametric multi-index model. Adv. Water Resour. 2013, 57, 12–18. [Google Scholar] [CrossRef] [Green Version]
  40. Rajsekhar, D.; Singh, V.P.; Mishra, A.K. Multivariate drought index: Aninformation theory based approach for integrated drought assessment. J. Hydrol. 2015, 526, 164–182. [Google Scholar] [CrossRef]
  41. Cammalleri, C.; Micale, F.; Vogt, J. A novel soil moisture based drought severity index (DSI) combining water deficit magnitude and frequency. Hydrol. Processes 2016, 30, 289–301. [Google Scholar] [CrossRef] [Green Version]
  42. Vicente-Serrano, S.M.; Beguería, S.; Lorenzo-Lacruz, J.; Camarero, J.J.; Lopez-Moreno, J.I.; Azorin-Molina, C.; Sanchez-Lorenzo, A. Performance of drought indicesfor ecological, agricultural, and hydrological applications. Earth Interact. 2012, 16, 1–27. [Google Scholar] [CrossRef] [Green Version]
  43. Thornthwaite, C.W. An approach toward a rational classification of climate. Geograph. Rev. 1948, 38, 55–94. [Google Scholar] [CrossRef]
  44. Vicente-Serrano, S.M.; Beguería, S.; Lòpez-Moreno, J.I. A multiscalar drought index sensitive to global warming: The standardized precipitation evapotranspiration index. J. Clim. 2010, 23, 1696–1718. [Google Scholar] [CrossRef] [Green Version]
  45. McKee, T.B.; Doesken, N.J.; Kleist, J. The relationship of drought frequency and duration to time scales. In Proceedings of the 8th Conference on Applied Climatology, Anaheim, CA, USA, 17–22 January 1993; Volume 17, pp. 179–183. [Google Scholar]
  46. Ying, A.; Pandey, M.D. The r largest order statistics model for extreme wind speed estimation. J. Wind Eng. Aerodyn. 2007, 95, 165–182. [Google Scholar]
  47. Kharin, V.V.; Zwiers, F.W.; Zhang, X.; Wehner, M. Changes in temperature and precipitation extremes in the CMIP5 ensemble. Clim. Chang. 2013, 119, 345–357. [Google Scholar]
  48. El Adlouni, S.; Ouarda, T.B.M.J.; Zhang, X.; Roy, R.; Bobe, B. Generalized maximum likelihood estimators for the nonstationary generalized extreme value model. Water Resour. Res. 2007, 43, W03410. [Google Scholar] [CrossRef]
  49. Nicholson, S.E. A review of climate dynamics and climate variability in the Greater Horn. In The Limnology, Climatology, and Paleoclimatology of the East African Lakes; Johnson, T.C., Odada, E.O., Eds.; Routledge: Oxfordshire, UK, 1996; pp. 24–56. [Google Scholar]
  50. Yang, W.; Seager, R.; Cane, M.A.; Lyon, B. The annual cycle of the East African precipitation. J. Clim. 2015, 28, 2385–2404. [Google Scholar] [CrossRef] [Green Version]
  51. Beltrando, G.; Camberlin, P. Interannual variability of rainfall in the eastern Horn of Africa and indicators of atmospheric circulation. Int. J. Climatol. 1993, 13, 533–546. [Google Scholar] [CrossRef]
  52. Goddard, L.; Graham, N.E. Importance of the Indian Ocean for simulating rainfall anomalies over eastern and southern Africa. J. Geophys. Res. 1999, 104, 19099–19116. [Google Scholar] [CrossRef] [Green Version]
  53. Schreck, C.J.; Semazzi, F.H.M. Variability of the recent climate of eastern Africa. Int. J. Climatol. 2004, 24, 681–701. [Google Scholar] [CrossRef]
  54. Camberlin, P.; Okoola, R.E. The onset and cessation of the ‘‘long rains’’ in eastern Africa and their interannual variability. Theor. Appl. Climatol. 2003, 75, 43–54. [Google Scholar] [CrossRef]
  55. Pohl, B.; Camberlin, P. Influence of the Madden–Julian oscillation on East African rainfall. I: Intraseasonal variability and regional dependency. Quart. J. R. Meteor. Soc. 2006, 132, 2521–2539. [Google Scholar] [CrossRef] [Green Version]
  56. Zhang, C.J.; Liu, H.B.; Song, Y.L. Grades of Meteorological Drought; Standards Press of China: Beijing, China, 2017; p. 24. (In Chinese) [Google Scholar]
  57. Xing., Y.; Wang, L.; Wood, E.F.; Xing., Y.; Wang, L.; Wood, E.F. Anthropogenic Intensification of Southern African Flash Droughts as Exemplified by the 2015/16 Season. Bull. Am. Meteorol. Soc. 2018, 99, S86–S90. [Google Scholar]
  58. Williams, A.P.; Funk, C. A westward extension of the warm pool leads to a westward extension of the Walker circulation, drying eastern Africa. Clim. Dynam. 2011, 37, 2417–2435. [Google Scholar] [CrossRef] [Green Version]
  59. Yang, W.; Seager, R.; Cane, M.A.; Lyon, B. The East African long rains in observations and models. J. Clim. 2014, 27, 7185–7202. [Google Scholar] [CrossRef]
  60. Okoola, R.E. A diagnostic study of the eastern Africa monsoon circulation during the Northern Hemisphere spring season. Int. J. Climatol. 1999, 19, 143–168. [Google Scholar] [CrossRef]
  61. Pohl, B.; Camberlin, P. Intraseasonal and interannual zonal circulations over the equatorial Indian Ocean. Theor. Appl. Climatol. 2011, 104, 175–191. [Google Scholar] [CrossRef]
  62. Camberlin, P.; Philippon, N. The East African March–May rainy season: Associated atmospheric dynamics and predictability over the 1968–1997 period. J. Clim. 2002, 15, 1002–1019. [Google Scholar] [CrossRef]
  63. Nicholson, S.E. The nature of rainfall variability over Africa on time scales of decades to millennia. Global Planet. Change 2000, 26, 137–158. [Google Scholar] [CrossRef]
  64. Indeje, M.; Semazzi, F.H.M.; Ogallo, L.J. ENSO signals in East African rainfall seasons. Int. J. Climatol. 2000, 20, 19–46. [Google Scholar] [CrossRef]
  65. Black, E.; Slingo, J.; Sperber, K.R. An observational study of the relationship between excessively strong short rains in coastal East Africa and Indian Ocean SST. Mon. Weather Rev. 2003, 131, 74–94. [Google Scholar] [CrossRef]
  66. Behera, S.; Luo, J.-J.; Masson, S.; Delecluse, P.; Gualdi, S.; Navarra, A.; Yamagata, T. Paramount Impact of the Indian Ocean Dipole on the East African Short Rains: A CGCM Study. J. Clim. 2005, 18, 4514–4530. [Google Scholar] [CrossRef] [Green Version]
  67. Leonard, M.; Westra, S.; Phatak, A.; Lambert, M.; van den Hurk, B.; McInnes, K.; Risbey, J.; Schuster, S.; Jakob, D.; Stafford-Smith, M. A compound event frame work for understanding extreme impacts. Wiley Interdiscip. Rev. Clim. 2014, 5, 113–128. [Google Scholar] [CrossRef]
  68. Kopp, R.; Easterling, D.R.; Hall, T.; Hayhoe, K.; Horton, R.; Kunkel, K.; LeGrande, A. Potential surprises–compound extremes and tipping elements. In Climate Science Special Report: Fourth National Climate Assessment; Wuebbles, D.J., Fahey, D.W., Hibbard, K.A., et al., Eds.; U.S. Global Change Research Program: Washington, DC, USA, 2017; Volume I, pp. 411–429. [Google Scholar]
  69. AghaKouchak, A.; Cheng, L.; Mazdiyasni, O.; Farahmand, A. Global warming and changes in risk of concurrent climate extremes: Insights from the 2014 California drought. Geophys. Res. Lett. 2014, 41, 8847–8852. [Google Scholar] [CrossRef] [Green Version]
  70. Hao, Z.; Hao, F.; Singh, V.P.; Zhang, X. Changes in the severity of compound drought and hot extremes over global land areas. Environ. Res. Lett. 2018, 13, 124022. [Google Scholar] [CrossRef]
  71. Hao, Z.; Singh, V.; Hao, F. Compound extremes in hydroclimatology: A review. Water 2018, 10, 718. [Google Scholar] [CrossRef] [Green Version]
  72. Tambo, J.A. Adaptation and resilience to climate change and variability in north-east Ghana. Int. J. Disaster Risk Reduct. 2016, 1785–1794. [Google Scholar] [CrossRef]
  73. Lott, F.C.; Christidis, N.; Stott, P.A. Can the 2011 East African drought be attributed to human-induced climate change? Geophys. Res. Lett. 2013, 40, 1177–1181. [Google Scholar] [CrossRef]
  74. Cook, K.H.; Vizy, E.K. Impact of climate change on mid-twenty-fifirst century growing seasons in Africa. Clim. Dyn. 2012, 39, 2937–2955. [Google Scholar] [CrossRef] [Green Version]
  75. Zscheischler, J.; Martius, O.; Westra, S.; Bevacqua, E.; Raymond, C.; Horton, R.M.; van den Hurk, B.; AghaKouchak, A.; Jézéquel, A.; Mahecha, M.D.; et al. LA typology of compound weather and climate events. Nat. Rev. Earth Environ. 2020, 1, 333–347. [Google Scholar] [CrossRef]
Figure 1. (a) Topographic elevation (m) around the study area. (b) Annual cycle type of GPCC precipitation measured by log2 |C2/C1|, where C1 and C2 are the Fourier harmonics of the annual period and the semi-annual period, respectively. Positive (negative) values occur when the semiannual (annual) period mode dominates. Boxes 1, 2, and 3 have ranges of [36° E, 50° E] × [0, 8° N], [30° E, 36° E] × [6° N, 11° N] and [30° E, 36° E] × [10° S, 4° S] respectively. Bar plots next to the boxes show the annual cycle of precipitation over the corresponding boxes.
Water 14 00409 g001
Figure 2. GPCC climatological annual precipitation. The direction of the arrow represents the month of maximum precipitation, which is represented according to the clock dial. Blue box denotes the HOA region.
Water 14 00409 g002
Figure 3. The annual cycle of area-averaged GPCC precipitation of the HOA. The gray shading in the mini panel shows the areas satisfying the criteria, consistent with positive values in Figure 3.
Water 14 00409 g003
Figure 4. Temporal variation and trend analysis (red line) of SPEI in the HOA at each 3-month (a), 8-month (b), and 12-month (c) timescale from 1979–2019.
Water 14 00409 g004
Figure 5. Return periods and 95% confidence intervals for SPEI-8 (a), accumulated precipitation (b), average temperature (c), and PEV (d), where the blue-filled dots represent the period from OND 2016 to MAM 2017.
Water 14 00409 g005
Figure 6. Seasonal temporal variation and trend analysis (solid lines) of precipitation anomalies (a), temperature anomalies (b), and PEV anomalies (c) during MAM (red) and OND (blue).
Water 14 00409 g006
Figure 7. The box-and-whisker plots of precipitation (a) and temperature (b) during 2016–2017. The three horizontal lines from bottom to top in the box denotes the values of lower quartile (25th), median, and upper quartile (75th) percentiles, respectively, while the whiskers represent the values of lower bound (5th) and upper bound (95th) percentiles.
Water 14 00409 g007
Table 1. Observation and reanalysis datasets.
DatasetsHorizontal ResolutionPeriod
PrecipitationGPCC1.0° × 1.0° 1979–2019 of (1901–2019)
Temperature (T2 m)ERA50.25° × 0.25° 1979–2019
Potential evaporation (PEV)ERA50.25° × 0.25° 1979–2019
Table 2. Drought category based on the SPEI value.
SPEI ValueDrought Type
0 to −0.99Mild drought
−1 to −1.49Moderate drought
−1.5 to −1.99Severe drought
≤2.0Extreme drought
Table 3. Standardized regression coefficients between seasonal SPEI and anomalies of precipitation and temperature in HOA during 1979–2019.
Seasonal SPEIPrecipitationTemperature
MAM0.35 *−0.29
OND0.58 **−0.21
* α = 0.05, ** α = 0.001.
Publisher’s Note: MDPI stays neutral with regard to jurisdictional claims in published maps and institutional affiliations.

