Article

Characteristics of Microstructural Changes of Malan Loess in Yan’an Area during Creep Test

1
State Key Laboratory of Continental Dynamics, Northwest University, Xi’an 710069, China
2
Shaanxi Satellite Application Center for Natural Resources, Xi’an 710069, China
3
Shanxi Construction Investment Group Co., Ltd., Taiyuan 030013, China
*
Author to whom correspondence should be addressed.
Water 2022, 14(3), 438; https://doi.org/10.3390/w14030438
Submission received: 16 November 2021 / Revised: 19 January 2022 / Accepted: 23 January 2022 / Published: 1 February 2022
(This article belongs to the Section Water Erosion and Sediment Transport)

Abstract

:
The shortage of land resources on the Loess Plateau has long been a thorny problem. Many high-fill projects are carried out, accompanied by a series of geological hazards, which threaten the ecological environment and personal safety. The creep characteristics of loess are an essential part of loess landslide research. The microstructural changes are closely related to creep behavior. By conducting triaxial creep experiments on Malan loess from the Yan’an area in China, scanning electron microscope (SEM) experiments on loess in different creep stages were carried out. Using qualitative and quantitative analyses of the microstructural characteristics of intact loess and remodeled loess during creep, the microstructural parameters were compared, and finally, the microscopic mechanisms during creep were analyzed. The qualitative analysis of remodeled loess during creep returned significantly higher results than it did for intact loess. During the creep process, among the microstructural parameters of loess change, the change in pore and particle size and shape were the most obvious, while the complexity of other microstructural parameters and orientation changed little. During the creep process of loess, the soil skeleton changed continuously, but the loess microstructure featured different changes at different levels of deviator stress.

1. Introduction

Loess is widely distributed in semi-arid and arid regions of the world, including China, Russia, USA, UK, France, Germany, Italy, Israel, New Zealand and other countries [1]. Loess is unique Aeolian sediment formed in Quaternary and features special engineering geological properties, such as water sensitivity, collapsibility, and highly developed vertical joints. Loess is a kind of Quaternary sediment formed in arid and semi-arid regions. The region’s unique conditions, such as its dry climate, sparse rainfall, and extensive evaporation, have resulted in loess that is mainly powdery, under-compacted, high in porosity, low in humidity, and rich in soluble salts (reinforcing cohesion), as well as featuring the development of characteristic vertical joints. It is generally believed that typical loess (also known as standard loess) is mainly aeolian loess, and subtype loess (also known as loess-like or secondary loess) is mostly loess formed from other origins (such as alluvial deposits, slope deposits, alluvial deposits, lakes deposits). When loess is subjected to long-term loading, creep deformation increases over time, posing a safety hazard to the environment. Therefore, the study of the creep deformation of loess is of tremendous significance for the loess area eco-system. The loess’s macroscopic creep characteristics depend on the loess structure, and soil particle units arrange the loess structure. Microscopic tests are needed to study the micromechanics in the process of creep.
For the study of microstructures, several devices and methods have been developed, including scanning electronic microscopy (SEM), mercury intrusion porosimetry (MIP) and X-ray computed tomography (CT) [2,3,4,5]. The microstructural and compositional characteristics of loess, such as its particle size, shape and orientation, pore size distribution and clay aggregation between particles, are widely considered to determine loess collapsibility [6,7,8,9,10]. Wang et al. [11] combined a triaxial test apparatus with medical computed tomography; however, the characterization of particles, pores, contacts and cement exceeded the range of medical CT scanners. Li et al. [12] investigated the creep properties and microscopic pore variation of soft soils under different drainage conditions. They found that different drainage conditions exert a significant effect on the relationship between strain time and strain deviation stress in soil samples. Yang et al. [13] selected specimens from multiple time points in the creep process of soft soil for microstructure testing and extracted the parameters of particle and pore changes to study the microstructural change pattern during creep. Microstructural research on loess is an effective way to improve our understanding of loess’ presentation characteristics and establish the interactions between micro and macrostructures [14]. The pore distribution of different soils and its effect on mechanical properties [15] and hydraulic [16,17,18] conductivity have been widely studied.
In recent years, through the monitoring of landslides, most landslides have been shown to display creeping behavior [19,20,21,22,23]. It is recognized that the recent human casualties and property damage in loess areas are closely related to the creep behavior of landslides [24,25,26]. Yates et al. conducted a statistical analysis of landslides caused by loess creep in Canterbury, New Zealand and found that loess landslides with creep behavior are mainly controlled by the liquid behavior of saturated loess, potential failure surfaces and seasonal wetting/drying cycles [27]. The porous structure and well-developed vertical cracks of loess contribute to its unique creep properties [28,29,30,31,32,33]. Although scholars have studied the microstructure of loess extensively, a microscopic study of Malan loess in the Yan’an area has still not been performed., In particular, in the environment of the large-scale filling and excavation project in Yan’an New Area, the creep characteristics of Yan’an loess need to be studied urgently; the change law of the loess creep period can be found through the quantitative study of loess pores and particles.
In this study, by sampling the Malan loess in the dredging and filling area of Yan’an New Area, triaxial creep tests were conducted on its intact loess and remodeled loess, respectively. The scanning electron microscope technique was used to reveal the microstructural characteristics of the different stages of the creep process of the loess in Yan’an New Area. The microstructural characteristics of the creep process of the intact loess and the compacted remodeled loess were analyzed qualitatively and quantitatively using the scanning electron microscope technique and each microstructural parameter was compared. Finally, the microscopic mechanism of the creep process was analyzed.

2. Materials and Methods

2.1. Study Area

Yan’an City is located in the north-central part of the Loess Plateau, belonging to the hilly and gully area of the Loess Plateau (study area location and associated geological map are shown in Figure 1). Quaternary aeolian loess is exposed in the area, mainly in loess hills and gullies. The area has gradually accumulated through geological tectonics, river erosion, water erosion, wind transport and deposition to form a unique yellow landform. The terrain in the area is high in the west and low in the east, with some uplifts in the middle and relatively large rises and falls in the north relative to the south. The topography of the area north of Yan’an includes ravines, hills, ridges and beams, among which ridges are the central part; the topography of the area south of Yan’an includes ravines, plateaus and beams, of which loess plateaus are the main part; the topography of the central part of Yan’an includes ravines, hills and beams. From south to north, the content of fine sand in late Pleistocene loess gradually increases, while the content of clay gradually decreases. Due to the highly developed loess gully, the ratio of valleys and streams in Yan’an area is about 1:1, and the slope is generally greater than 25°. Due to the downward cutting of rivers and the erosion of the source, the gullies are highly developed. Therefore, the topography of Yan’an area features large undulations.
The region is dominated by hilly landforms and river valley terrace landforms. In the river valley terrace area, an area of intensive human engineering activities, the terrain is flat and open. The geological environment conditions are weakly changed in the cultivation area, and geological hazards are not developed. In the transition section of the river valley terrace and hilly area, geological hazards are more developed due to road construction or industrial construction; these geological hazards are induced by slope excavation. The alluvial floodplain formed in this geomorphic unit is fertile; primarily, humans excavate slope bodies to build dwellings, or build roads along the river, thus creating potential geological hazards. The hilly area features a broken terrain, a high density of gullies and valleys, mainly developed beams and hills, as well as a large amount of sloping terrain. This geomorphic unit features a large area, a relatively dense population, and frequent human engineering activities; the loess vertical joints in this area are developed and the underlying sand mudstone interlayer is prone to differential weathering. Hence, the number of geological hazards in this area is the highest.
The area belongs to the central and eastern part of the Ordos Plateau of the North China Platform, the regional geological structure is stable and the fracture and earthquakes are not very developed. Since the Quaternary period, the Ordos Plateau has presented continuous uplift, which leads to a continuous rise in the loess plateau geomorphology and induces change in the surrounding soil body stress state change; continuously influenced by the unloading side pressure, the stress state of the loess plateau body changes and, eventually, leads to an increase in the loess slope’s potential energy in the area. The development of rivers and valleys will gradually break up the loess plateau and form typical loess beam and loess hill landforms.
The coordinates of the sampling point are 36°45′13.5″ N, 109°11′4.2″ E. The loess in the study area is Late Pleistocene loess (Qp3), which covers the tops of all the loess plateaus and beams in the whole area (Figure 2). The thickness varies greatly, ranging from a few meters to more than 20 m and, locally, up to 30 m. The loess particles are mainly composed of powder particles and the minerals are mainly composed of feldspar, quartz and a small number of clay minerals. The natural moisture content of the loess is 14.7% and the density is 1.54 g/cm3. The loess sample’s liquid limit and plastic limits were 27.9% and 18.9%, respectively, after using an unsaturated triaxial apparatus to carry out a shear experiment and obtain the cohesion and internal friction angle. Through the grain composition experiment, viscous particles accounted for 16.3% of the loess, silt particles accounted for 71.6% and sand particles accounted for 12.1%. We determined the physical properties of the sample by conducting a series of geotechnical tests (Table 1). The loess from the sample point were classified as calcaric regosols in the WRB [34] reference system and typic ustorthents in the USDA system [35]. The loess is a form of Late Pleistocene Malan loess, classified as silty clay according to its grain size characteristics.
In order to prevent the loess from being affected by the external environment (frost, rainfall and sunshine), we excavated 0.5 m horizontally before sampling to avoid interference with the loess. The soil samples we removed were marked from top to bottom and then quickly wrapped and sealed with fresh-keeping film, before being wrapped with bubble film to avoid soil interference during transportation. After the soil samples were transported indoors, they were placed in a dry and ventilated place to avoid direct sunlight.

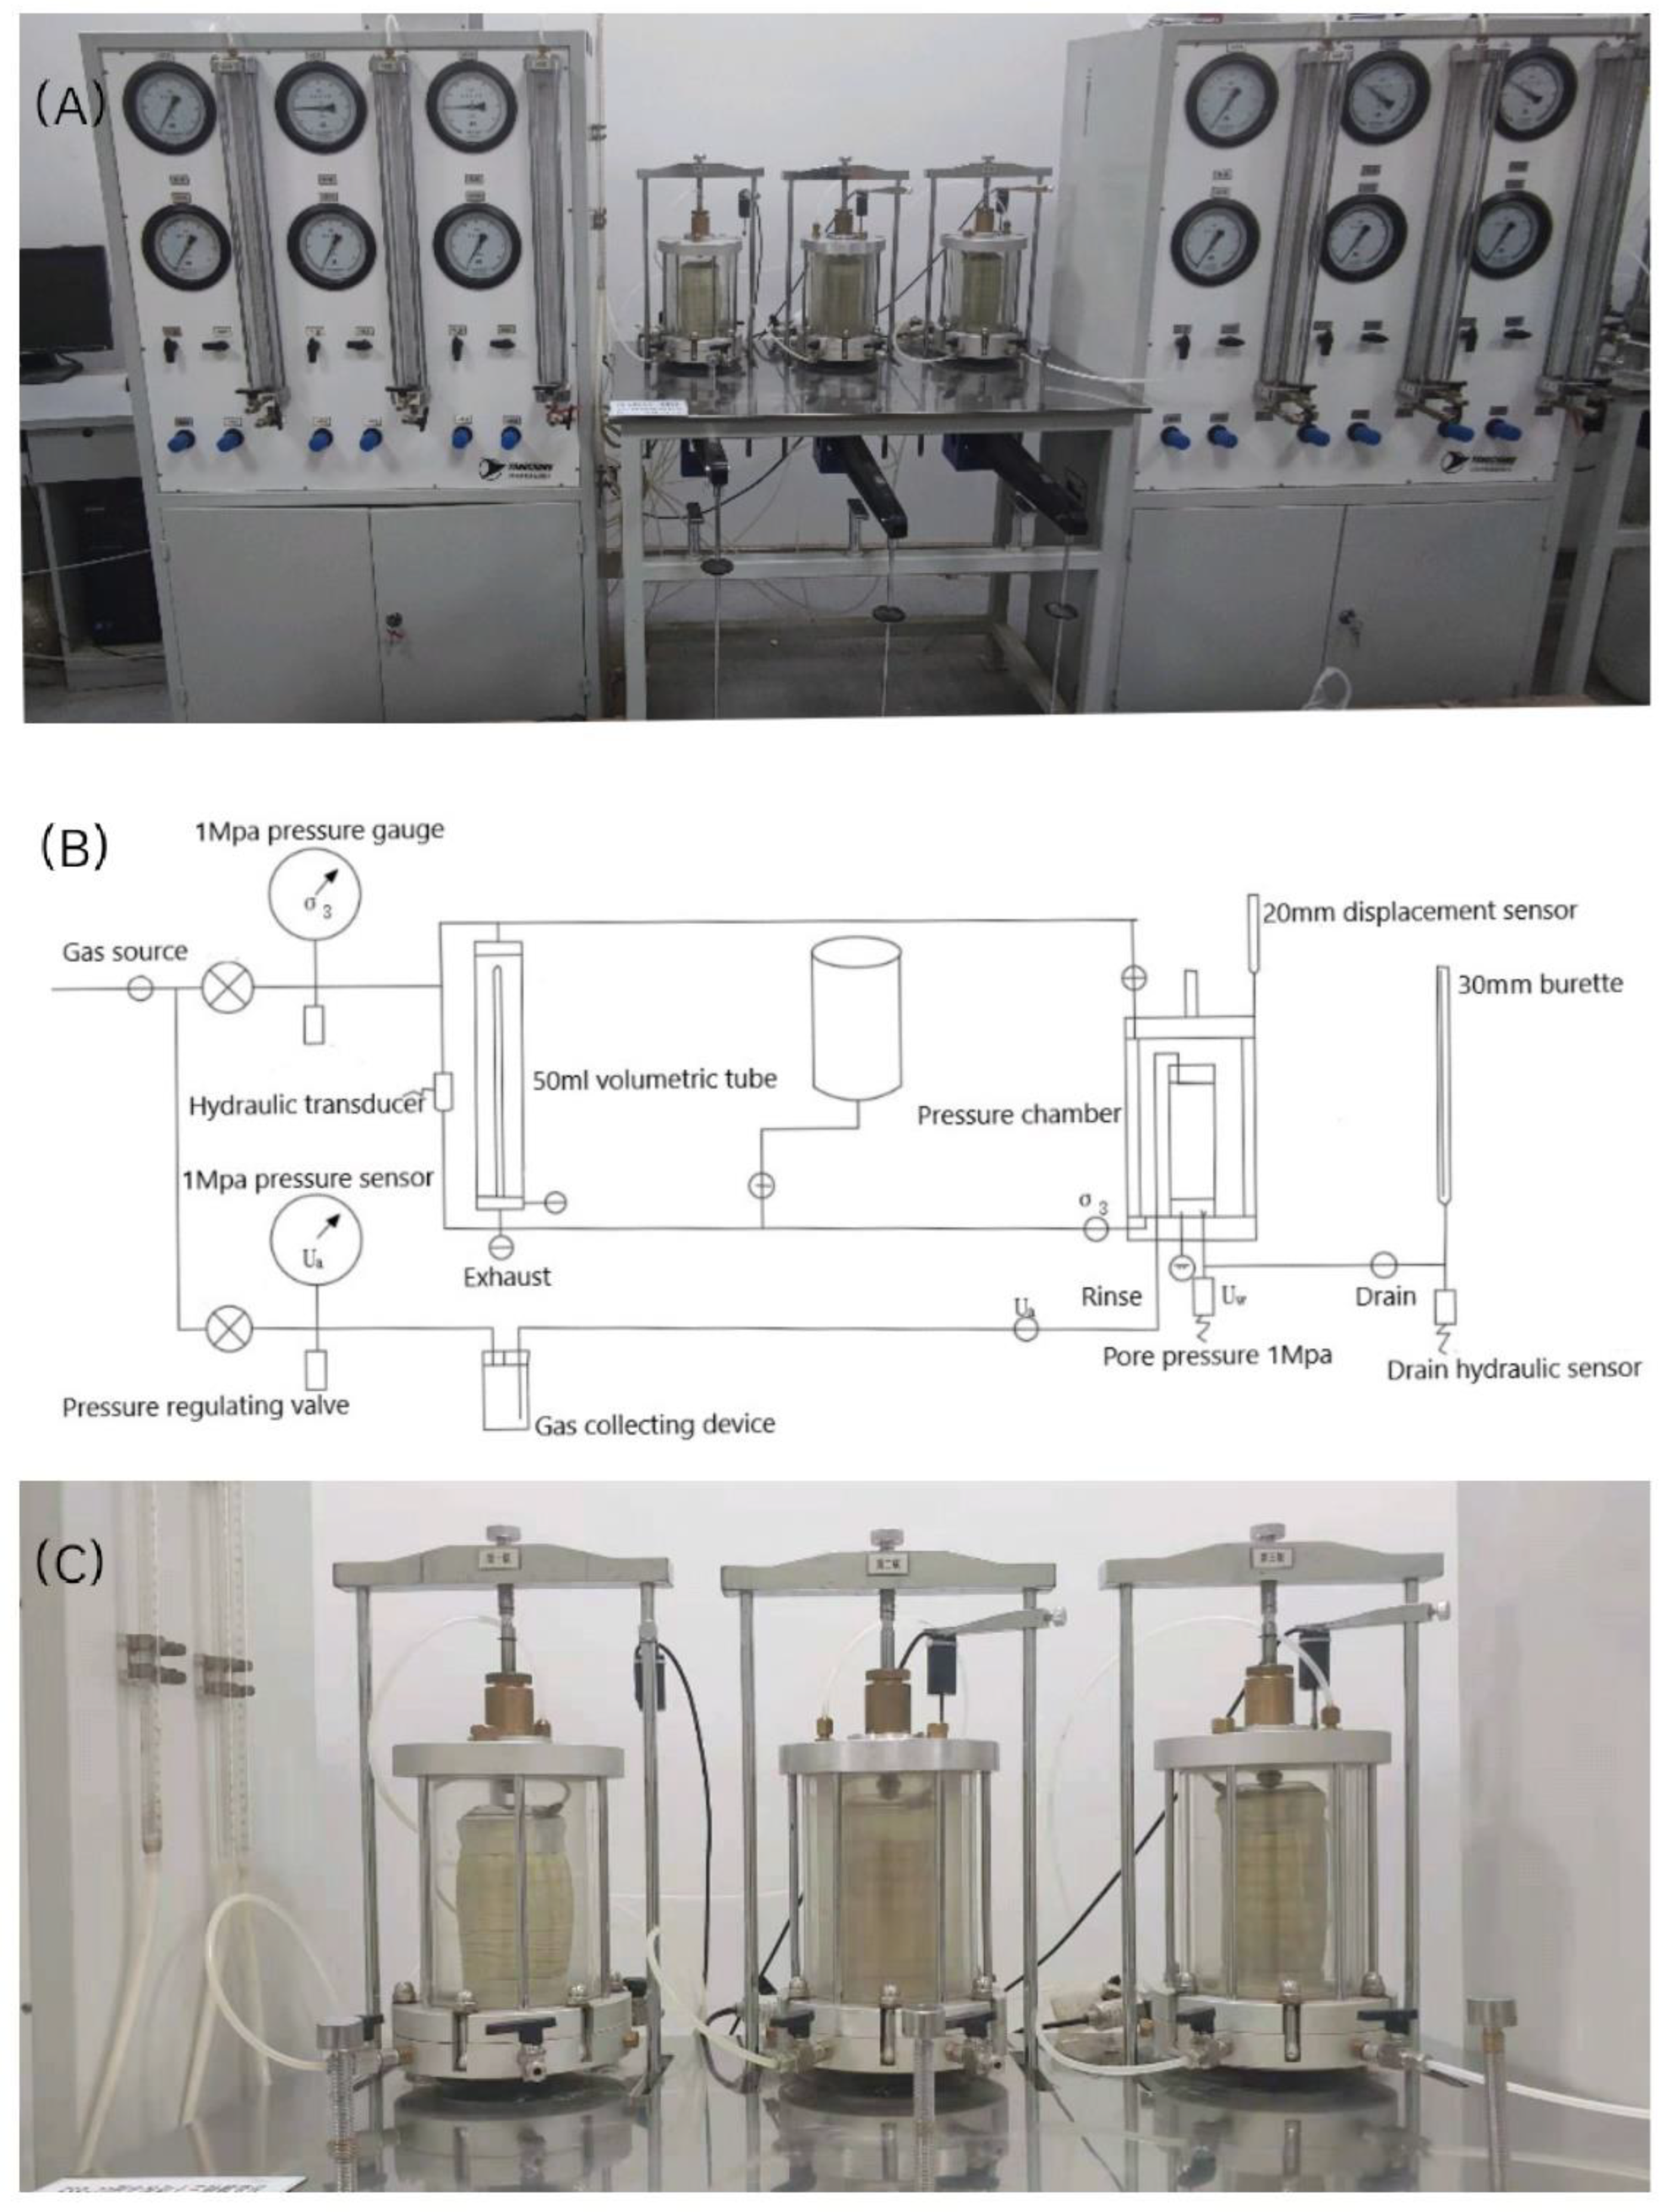
2.2. Testing Programs

For the creep test design, triaxial creep experiments were carried out on the intact sample and the remolded sample of Malan loess. Before the test, we controlled the soil samples to the corresponding suction by using the water film transfer method and then placed the sample in the instrument base, keeping the pore water pressure at 0 kPa, adjusting the pore pressure to the set value of 100 kPa and balancing the suction. Firstly, we determined the failure deviator stress ( σ 1 σ 3 ) of the loess through the triaxial creep test and used this as a basis to load the sample in steps until the samples reached the expected creep stage; the loading time of each deviator stress was 24 h. The test conditions of the samples are shown in the table. The intact loess samples for the creep test were identified as UC-X and the remolded loess samples for the creep test were identified as RC-X.
Figure 2 shows a typical creep curve. The vertical axis is the strain. Section OA is the instantaneous strain phase, section AB is the decay creep phase, section BD is the steady creep phase and section DE is the accelerated creep phase. At the moment of loading, the loess produced instantaneous strain. When the deviator stress was low, the creep rate gradually decreased; this stage is called the decay creep phase. When the deviator stress was high, the creep rate remained constant after experiencing the decay creep phase; this stage is called steady creep phase. When the deviator stress reached a certain value, after experiencing decay creep phase and steady creep phase, the creep rate increased with time; this stage is the accelerated creep phase. The loess was located at the end of the stable creep (point D in Figure 2) and just before the accelerated creep. When the axial strain of the loess reached 10% of its height, this indicated that the sample had been destroyed.

2.3. Testing Method

The equipment selected for this creep test was the FSR-20 triaxial creep meter for unsaturated soil. The instrument mainly consists of a pressurization system, a data acquisition system and an air compressor. The maximum axial load that the equipment can provide is 2000 kPa, the maximum pore air pressure is 500 kPa, the maximum axial deformation that can be measured is 18 mm and the volume deformation is 50 cm3. For the preparation of intact-loess triaxial creep type samples, we removed the cling film-wrapped undisturbed sample, determined the upper and lower position of the sample, cut it flat and placed it in the triaxial chipper and then cut the sample into a cylinder of 61.8 mm diameter. The preparation of the remolded loess was performed by using a triaxial sample maker of remolded loess. Before the sample preparation, the mass of the required dry soil was calculated according to the moisture content, volume and dry density of the prepared sample; next, water was added according to the target moisture content. It was then wrapped with cling film and left to stand for two days. The prepared samples were divided into five parts, added to the sample maker in batches, compacted with a compaction device and scraped after each compaction. After sample preparation, we removed the samples from the sample maker, wrapped them with plastic wrapping and placed them in the moisture vat (Figure 3).
According to the test method in Table 2, after the creep test of each sample, the samples were recovered, air-dried and processed as follows: for the samples before the creep test of intact loess and remodeled loess, the middle part of the samples was selected; for the samples after the creep test, the “drum” position of the remodeled samples and the position of the most obvious shear damage of the intact samples were selected. It was processed into a cylindrical core (R = 1 cm, H = 1 cm). Glue was applied around the sample to facilitate the adhesion of conductive glue and form a vacuum to prevent contamination of the lens with loess powder. The following stages were tested using scanning electron microscopy (SEM): intact samples, decay-creep samples (instantaneous first-stage load application), steady creep sample (late second-stage load application), pre-creep damage samples (late third-stage load application) and creep damage samples (late fourth-stage load application). All the samples were examined at a uniform magnification of 800× to collect microscopy data under the same conditions as the SEM examination. The SEM images were analyzed using Image-Pro Plus (IPP) 2D image analysis software to obtain quantitative microstructural information. In the study of loess microstructure, pores are the essential features.
In this study, six structural parameters describing the pore size and shape and two parameters describing the sample fabric were chosen to quantify the microstructure. These parameters are described as follows:
(1)
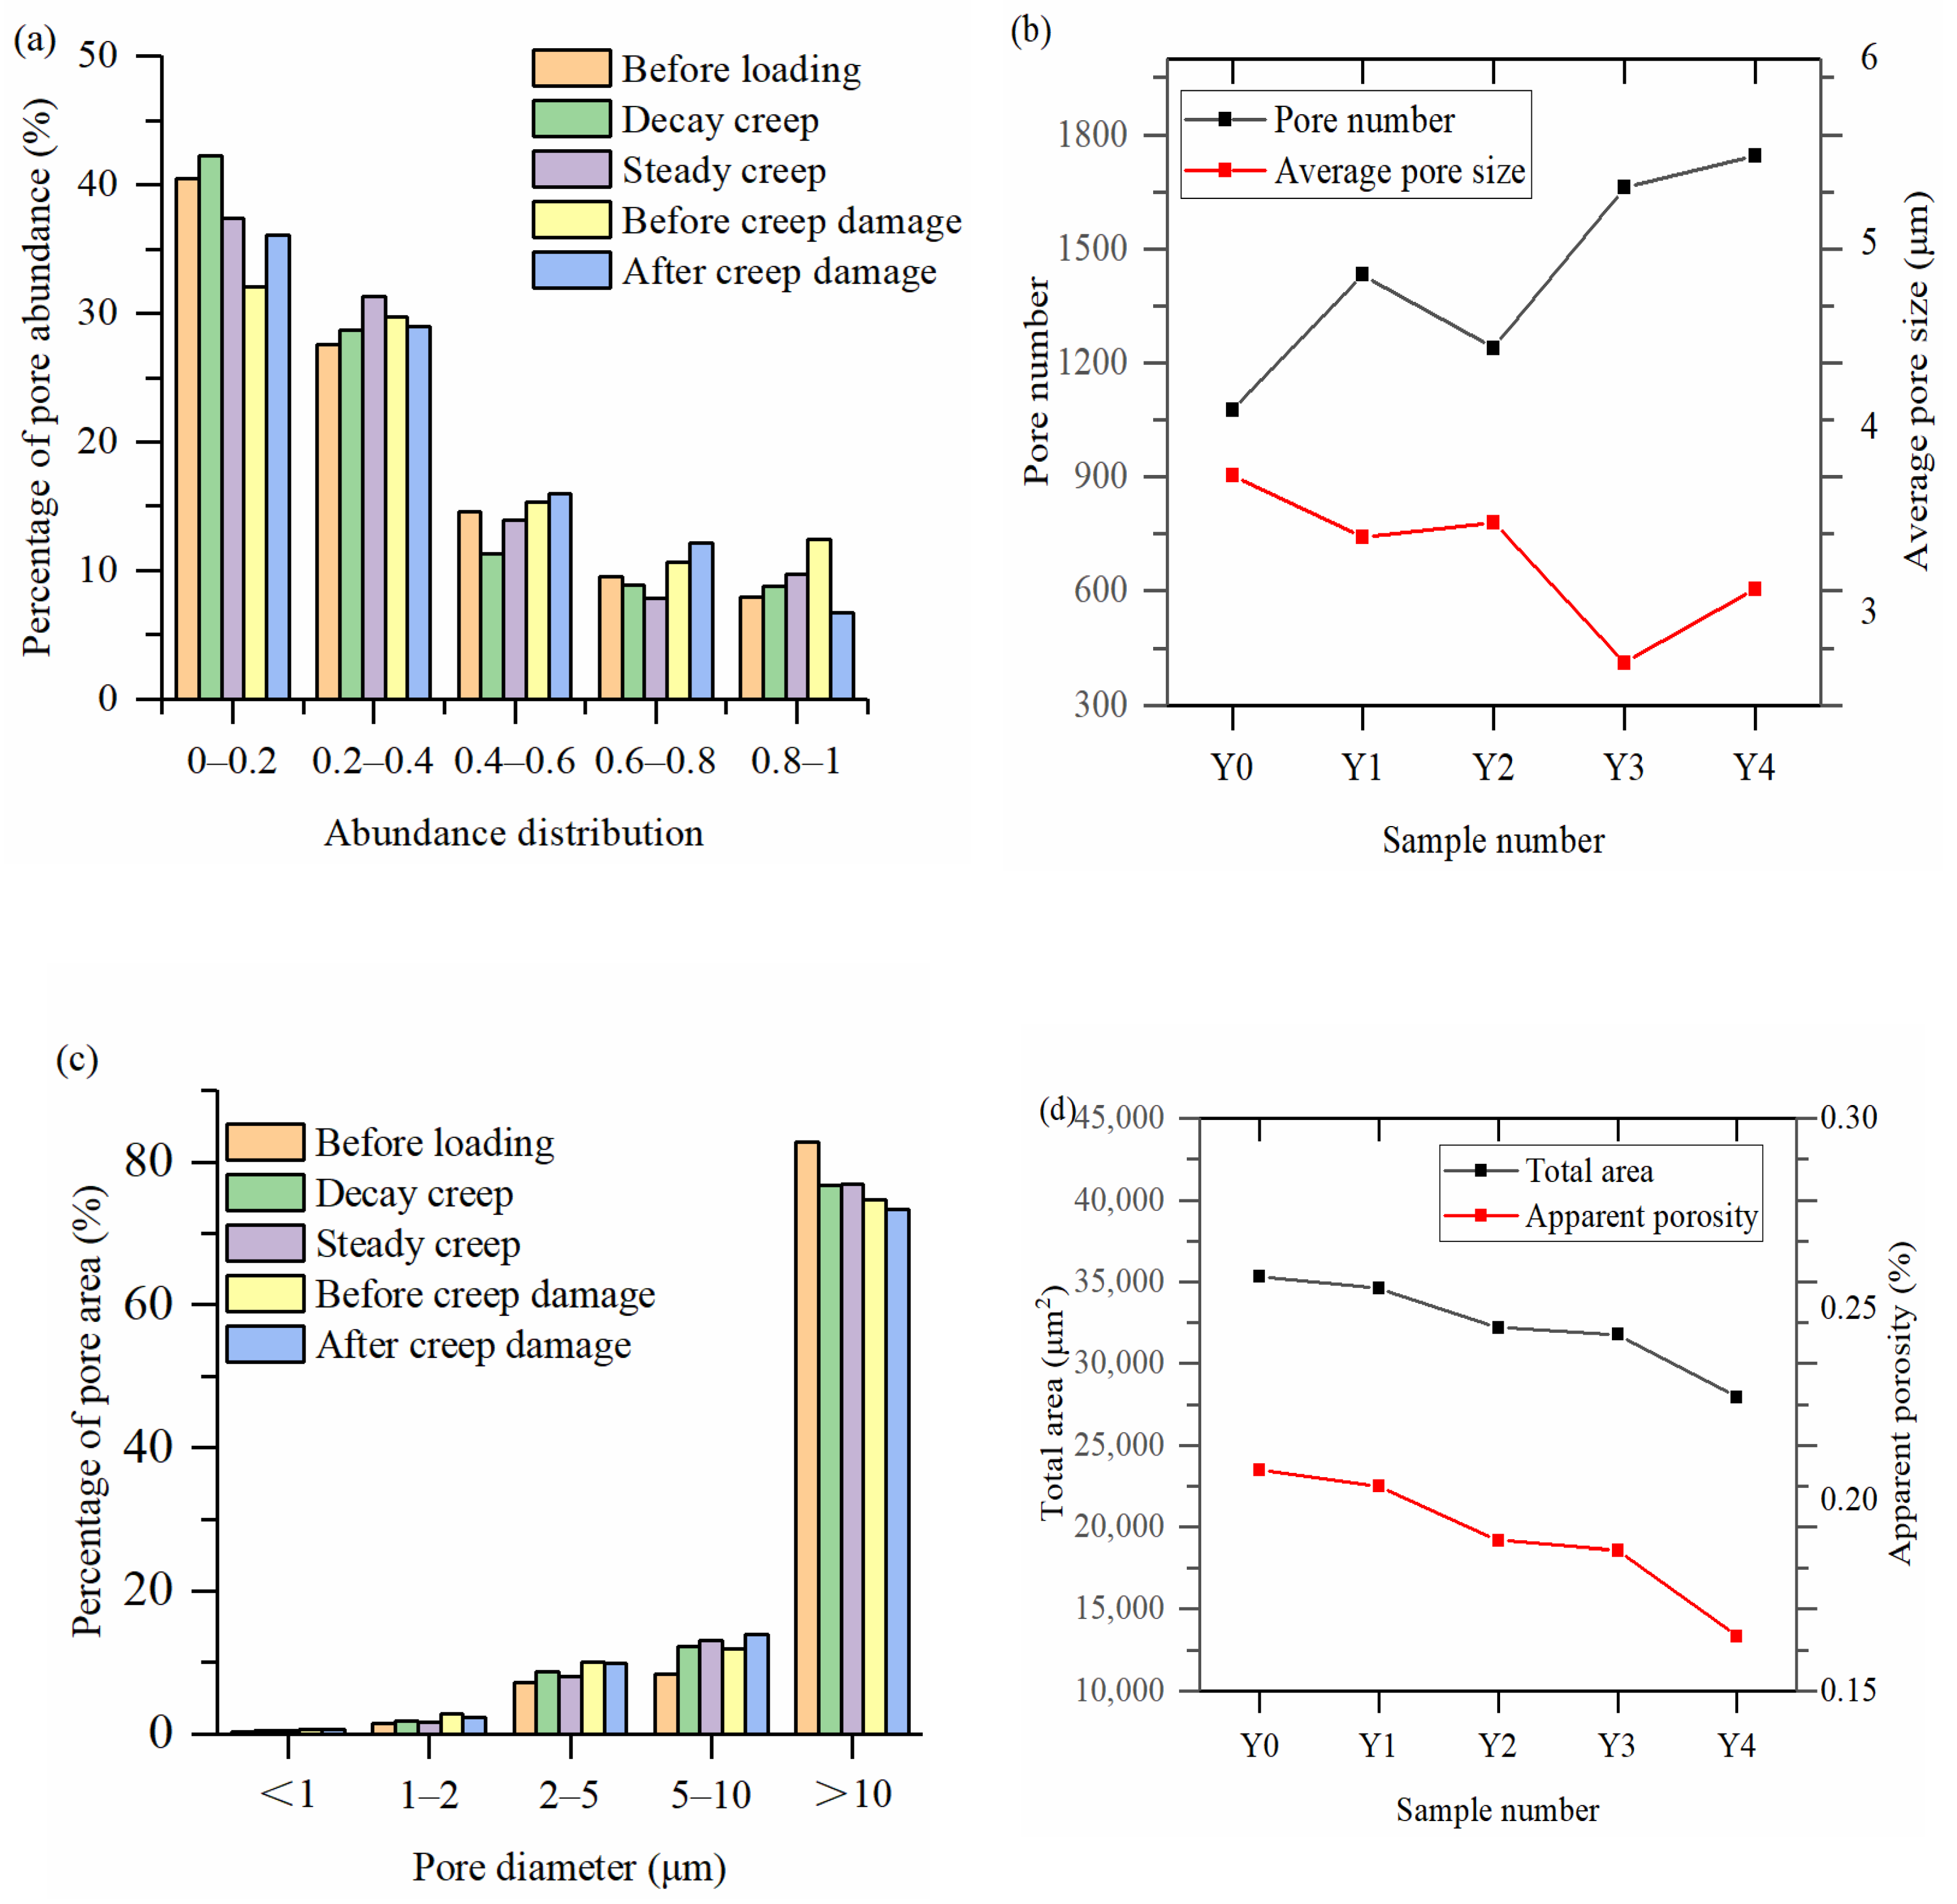
Pore diameter means the average diameter value through the geometric center. According to the method of the loess hole classification [34], the loess pore is divided into a macropore (radius more significant than 16 μm), mesopore (radius between 4–16 μm), small pore (radius between 1–4 μm) and micropore (radius less than 1 μm).
(2)
Number of pores N refers to the number of loess pores in different pore size intervals.
(3)
Pore area S refers to the area of loess pore space in different pore size intervals.
(4)
Pore abundance C is the ratio of long-axis pore radius and short-axis pore radius.
C = D a D b
(5)
Pore roundness R can be expressed as:
R = A 2 4 π S
A is the perimeter of the pore, S is the pore area.
(6)
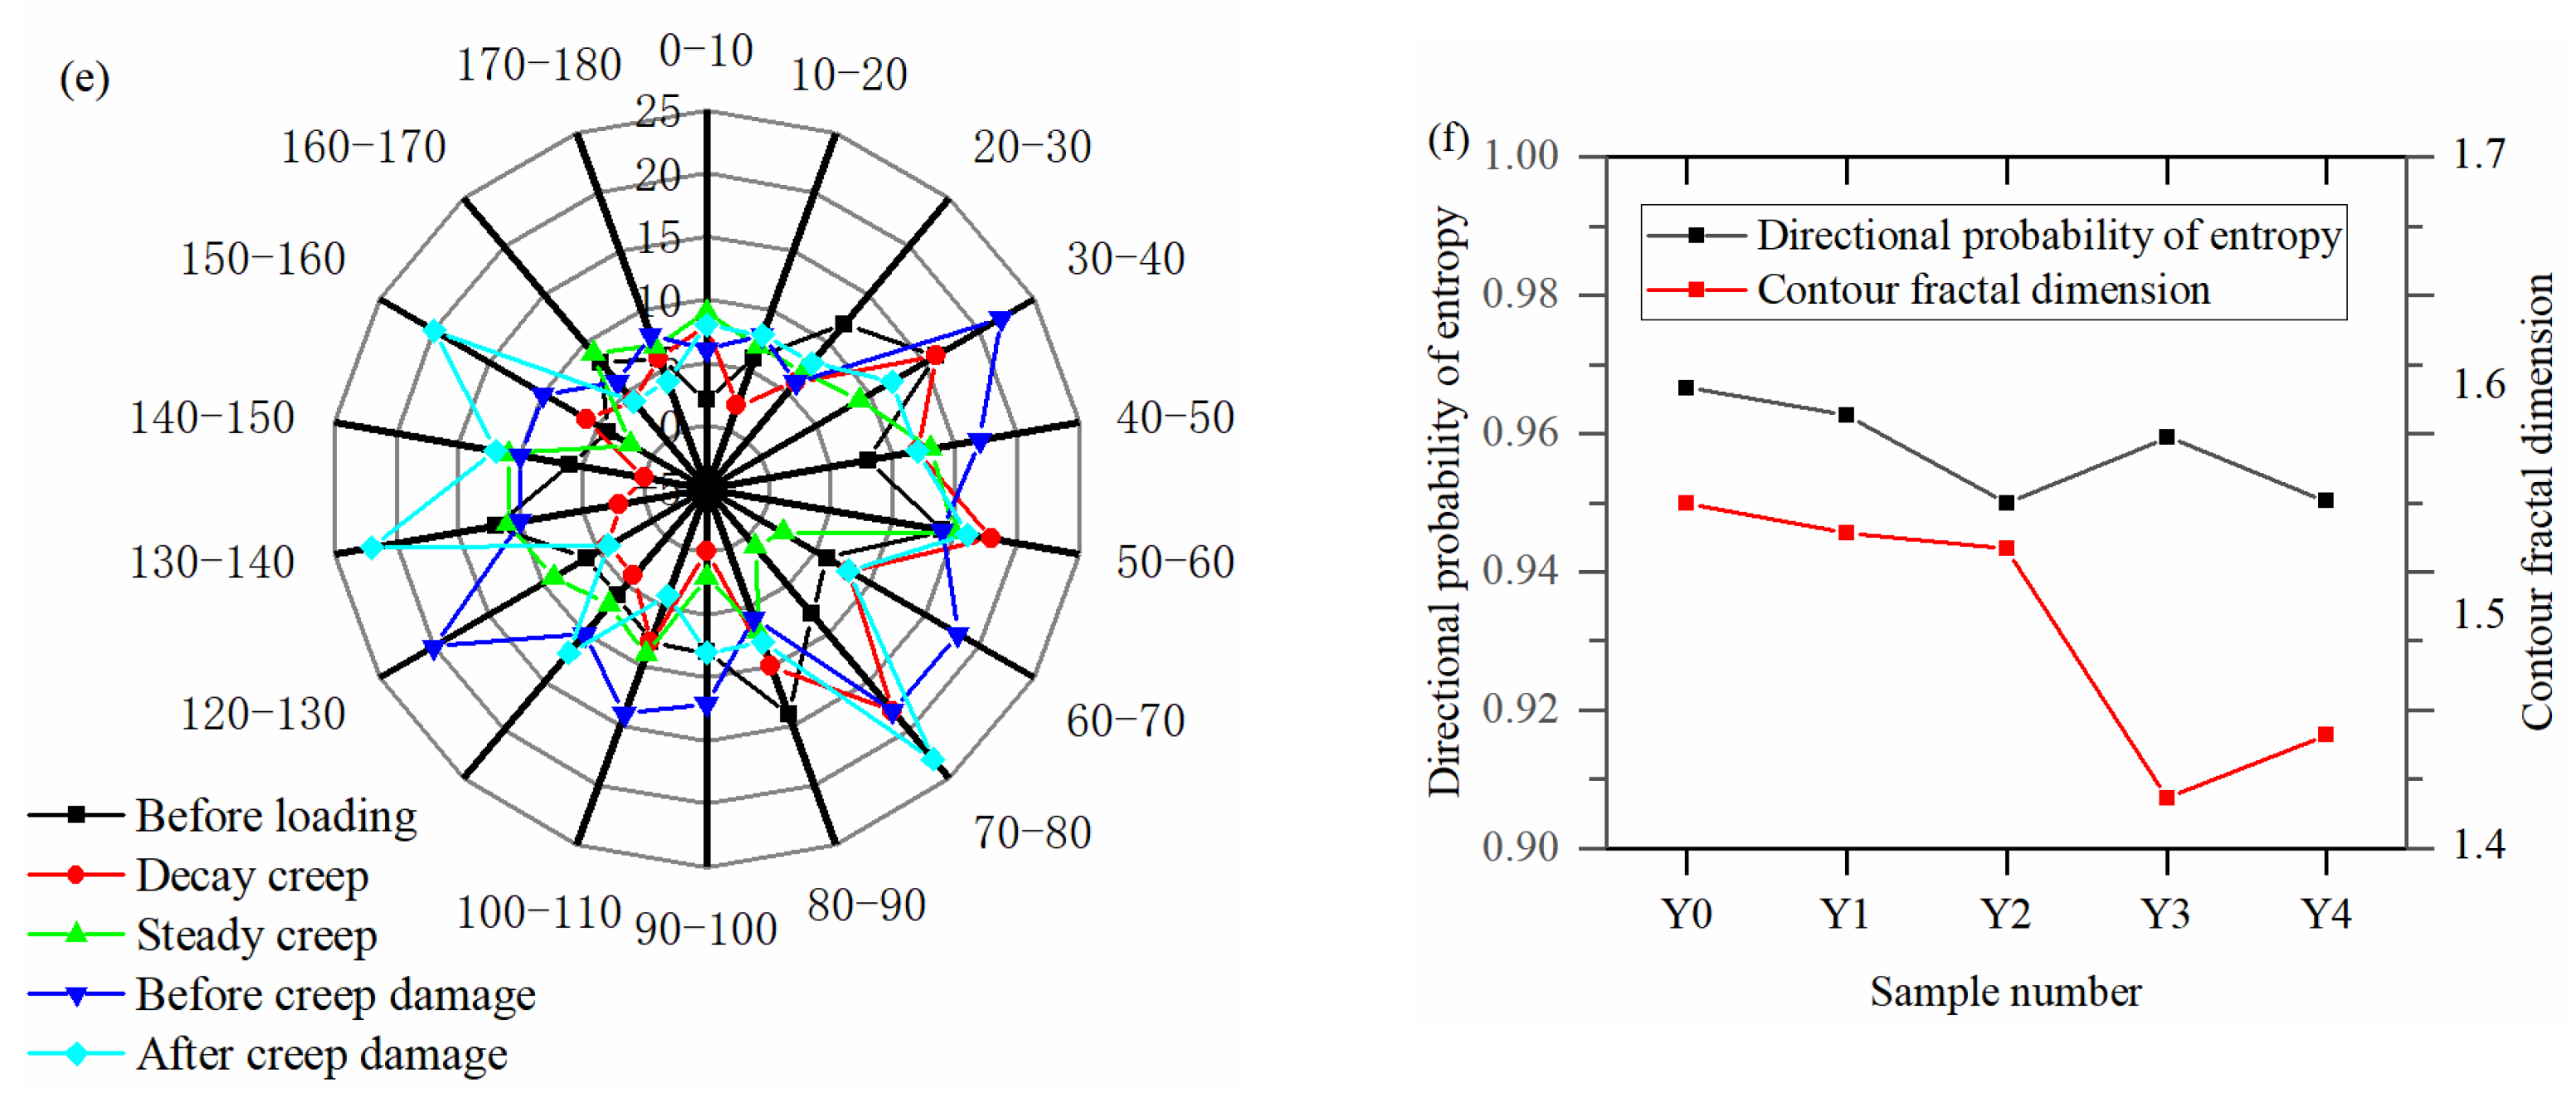
Pore outline fractal dimension Dc is used to describe the complexity of the pore profile. It reflects the irregularity of the interface between the pore and the particles surrounding it. The fractal dimension can be used to describe the pore edge roughness, which can be expressed as:
lnP = D 2 × lnA + C  
where P refers to the perimeter of the soil pore (particle), A refers to the area of the soil pore and C is a constant.
The area of the soil pore is the horizontal coordinate and the perimeter is the vertical coordinate to obtain the corresponding double logarithmic relationship. The fractal dimension can be found by linearly fitting the slope of the line:
D = k × 2
(7)
Directional frequency Fi(α) indicates the degree of distinctness of the pole arrangement in a given direction, which can be expressed as:
  F i ( α ) = ( m i M ) × 100 %
where m i is the number of holes in the long axis direction in part i. M is the total number of poles. For this paper, α = 10° and i ranges from 1 to n.
(8)
Directional probability of entropy Hm refers to the index of orderliness of unit arrangement:
  H m = F i ( α ) log n F i ( α )
where the value of H m ranges from 0 to 1. H m = 0 means that all the pores in this range are oriented in the same direction and feature the highest order state. H m = 1 means that the pores are entirely randomly distributed; i ranges from 1 to n.
The creep curves for each stage of the intact and remodeled samples are shown in Figure 4. The axial strain of the samples increased with increasing deflection stress and time. The strain value of the intact loess was higher than the remodeled loess at the same level of deviator stress, which was due to the high compaction of the remodeled loess; its dry density was much larger than that of the intact loess, so its creep deformation was relatively minor. The intact loess showed decay phase and steady phase during the interval of isolation (24 h); when the deviator stress increased to 600 kPa, the strain increased rapidly and the surface specimen was damaged by creep, which is consistent with the results after the test. This was due to the macroscopic damage (with obvious shear cracks) caused by the self-adjustment and internal adaptive changes in the microstructure of the intact loess under external load. Because the initial dry density of the remodeled loess was larger than the intact loess and the association between the soil particles was tight, the specimen did not show obvious shear damage, as did the intact soil. Rather, it only showed axial compression.

3. Testing Results

3.1. Microstructure Characteristics of Intact Loess

Under the conditions of the triaxial creep test, the macroscopic creep characteristics of loess are caused by the change in the internal microstructure of loess. The study of the microstructure of loess plays a vital role in changing the macroscopic mechanical properties of soil. Y.M. Sergeyv divided the microstructure of clay into the following types: honeycomb structure, skeleton structure, turbulent structure and laminar structure. The loess can be divided into 12 types of microstructure according to particle morphology, connection and arrangement. Figure 5 shows SEM photos of intact loess at different magnifications. The analysis of the images shows that the shape of the soil particles in the original loess can be divided into granular and lump and the granular particles can be subdivided into angular, grinding-round, flaky and grinding-aggregate, with grinding-round and grinding-corner as the main types. The arrangement of intact loess can be divided into three types: point contact, surface cementation (mutual cementation of particle bases) and edge contact (mutual association of the edges of particles). The pores of intact loess can be divided into primary pores and secondary pores, while the primary pores can be subdivided into overhead pores, intergranular pores, intragranular pores and cementation pores. The development of intergranular pores provides the conditions for adjusting the microstructure of the loess during the creep process.
Analyzing the image shows that the soil particle morphology of the intact loess can be divided into two categories, granular and agglomerated, while the granular particles can be subdivided into angular, granulation, flaky, grinding and rounded: the arrangement of undisturbed loess. It can be divided into three categories: point contact, surface cementation (the base surfaces of the particles are cemented with each other) and edge contact (the edges of the particles are connected), of which the point contact is the central part.

3.2. Qualitative Analysis of the Microstructure of Intact and Remolded Samples under Triaxial Creep Condition

Figure 6 and Figure 7 show the SEM photos of intact and remolded samples at different creep stages. The analysis of the photos shows that in the triaxial creep test, the structure of the intact samples gradually became compact, the clastic and clay materials on the surface of the particles increased, the soil particles gradually changed from mainly granular and massive to mainly agglomerated, the overhead pores in the soil pores decreased and the intergranular pores increased. Due to the loose structure of the intact loess, the soil particles gradually aggregated into larger aggregates under the action of external loads, and the soil became an agglomerated structure. Under confining pressure and deviator stress, the large pores collapsed and the tiny pores and micropores increased, presenting axial compression and volume compression at a macro level. Due to the complete disturbance of the remolded loess, the initial orientation of the soil particles was poor. Under confining pressure and deviator stress, the direction of the soil particles gradually deviated to deviator stress, so the qualitative development of remolded loess was more obvious than that of the intact loess during the creep process. Comparing the SEM images of the two types of samples after destruction, it can be seen that the remodeled sample presented significantly more fine particles than the intact sample, since the remodeled loess featured a larger initial dry density than the intact loess, resulting in a more significant degree of slip misalignment between the soil particles at the later stage of creep, which subsequently led to a significant increase in fine particles.
The creep process of loess is the continuous development of the internal structural hardening and softening of soil. Structural hardening refers to particle convergence and pore reduction under external forces and structural softening refers to the gradual destruction of the connection between granular particles under the action of external loads and the loosening of the original compact structure. At the initial creep stage, soil microstructure hardening plays a dominant role. With the increase in deviational stress, soil particles gradually converge, the internal connection of particles increases, and the creep rate of loess decreases gradually. When the soil enters the steady phase, the strain rate reaches the lowest value, and the internal structural hardening and softening of soil reach a balance; with the further increase of the deviator stress, the joint failure points between soil particles gradually increase, and the degree of soil particle orientation increases. At this point, soil microstructure softening plays a dominant role and the soil enters the accelerated creep stage (the creep rate of soil increases). The loess is damaged when the axial strain is greater than 10%.

3.2.1. Analysis of Intact Loess Pore Characteristics

Figure 8a,b shows the pore size analysis results of intact loess in different creep stages. The pores with a size of less than 5 μm account for a large proportion in each creep stage and the pores with a pore sizes of 1–2 μm and 2–5 μm account for more than 55%. With the increase in deviator stress, the proportion of pores less than 1 μm and 1–2 μm gradually increased and the proportion of pores larger than 2 μm gradually decreased. Compared with the average pore size of the initial pore of the intact loess, the pore size decreased with the increase in deviator stress. The reason for this is that the soil particles gradually clustered under the load, the inter-particle spacing decreased, some of the large pores collapsed to form tiny pores and the pore diameter decreased.
Figure 8c,d shows the pore area analysis results of intact loess in different creep stages. With the increase in the deviator stress, the proportions of pore area more significant than 10 μm decreased, while the proportions of the other pores increased. As the number of pores increased, the total pore area and apparent porosity showed a decreasing trend. The reason for this phenomenon is that under deviator stress, the extrusion between soil particles led to the collapse of the loess skeleton, making the intergranular pores continuously filled and migrated, as well as the gradual change from large pores to tiny pores.
It can be seen from Figure 9a that the pore abundance of intact loess was mainly distributed between 0 and 0.6, and pores with an abundance between (0, 0.2) were dominant. The pores with abundance between 0 and 0.2 decreased slightly with increasing deviator stress, while the pores with abundance between 0.6 and 1 increased slightly. The analysis shows that the number of flat and long pores decreased and the number of round pores increased with the increase in deviator stress; and it can be inferred that the change process of soil pores in the creep process of intact loess is a gradual transition from an angular to a round shape.
The following figure gives the roundness of the pores of the intact loess at different creep stages. It can be seen that the value gradually decreased with the increase in the partial stress, indicating that the pore structure tended to gradually round in the process of extrusion, crushing and filling, accompanied by the formation of a small number of narrow pores. On the other hand, due to the continuous rolling and grinding between soil particles, the irregular contours on the surface of the particles were smoothed out and the soil structure gradually became stable.
The frequency of the pore orientation distribution of the intact loess is shown in Figure 9c. The deviator soil pores are dominant at 100–130°, showing some orientation, while the distribution of the remaining intervals was the same. From an overall perspective, the pore orientation during creep was not obvious. Figure 9d shows the directional probability of the pore entropy of the deviator loess at different creep stages. It can be seen that the value changed little with increasing bias stress, which coincided with the frequency of the directional distribution. For the fractal dimension of the pore profile of the deviator soil at different creep stages, it can be seen that the value showed an overall decreasing trend with the increase in the deviator stress during the creep process, indicating that the pore profile gradually rounded and that the soil structure tended to gradually become stable.

3.2.2. Quantitative Analysis of Intact Loess Particles

Figure 10a shows the particle pore size analysis results of the intact loess in different creep stages. The results show that the diameter of the soil particles was mainly distributed in the range of 0–5 μm, accounting for about 80%. With the increase in deviator stress, the number of particles tended to increase and the overall pore size tended to decrease. This was due to the “slip” between soil particles under external load, increasing the number of fine particles and, consequently, the number of particles, as well as decreasing the pore size.
As shown in Figure 10c, the abundance distribution of the intact soil particles was relatively uniform. With the increase in deviator stress, the soil particles with an abundance between 0 and 0.2 slightly decreased, while the soil particles with an abundance between 0.8 and 1 slightly increased. The above analysis shows a slight decrease in the long structural units and a slight increase in the equiaxed units as the deviator stress increased. Figure 10d analyzes the change in the roundness of the intact soil particles at different creep stages. The value gradually decreased with the increase in deviator stress, indicating that the soil particles gradually became round and the soil structure gradually stabilized.
The frequency of the orientation distribution of the intact loess particles is shown in Figure 10e. Analyzing the data in the figure, it can be concluded that the intact loess particles were dominant in the 30–80° range and showed some orientation. The loess samples after creep damage were dominant at 130–140°, 150–160°, with an overall increase in directionality. Figure 10f analyzes the directional probability of the entropy of the intact soil particles at different creep stages. It can be seen that the value shows an unstable decreasing trend with the increase in the deviator stress. However, the decrease is insignificant, coinciding with the directional distribution frequency. Figure 10f shows the fractal dimension of the particle profile of the intact loess at different creep stages. It can be seen that the value shows an overall decreasing trend with the increase in the deviator stress during creep, indicating that the particle profile gradually rounded and that the soil structure gradually stabilized.

3.2.3. Analysis of Remolded Loess Pore Characteristics

Figure 11a shows the results of the pore size analysis of the remodeled loess in different creep stages. The analysis of the data in the table shows that pores less than 5 μm accounted for a large proportion of the pores in each creep stage, among which pores with diameters of 1–2 μm and 2–5 μm accounted for a more significant proportion, which was similar to the intact loess. With the increase in deviator stress, the proportion of pores smaller than 1 μm gradually increased and the proportion of pores larger than 5 μm gradually decreased; compared with the average pore size of the original pores of the remodeled loess, the overall pore size showed a decreasing trend with the increase in deviator stress; compared with the average pore size of intact loess during creep test, the average pore size of the remolded loess is smaller than that of the intact loess. The reason is that after compaction, the soil particles were dispersed more evenly, there were fewer large pores between soil particles compared with the intact loess, the overall spacing between the soil particles was smaller than in the intact loess and more fine particles were attached to the surfaces of large particles or filled in the inter-pore space under the load, which decreased the average pore size of the soil.
Figure 11c shows the results of the pore area analysis of the remodeled loess in different creep stages. With the increase in deviator stress, the percentage of the pore area with pores larger than 10 μm decreased and the percentage of the remaining pores increased to some extent.
Figure 12a shows that the abundance of pores in the intact loess was mainly distributed between 0 and 0.6, where the pores with the abundance between 0 and 0.4 were dominant. With the increase in the deviator stress, the pores with an abundance between 0 and 0.6 slightly decreased, while the pores with an abundance between the 0.6 and 1 slightly increased. The average value first tended to decrease with the increase in the deviator stress and then tended to increase. This shows that the number of round pores increased slightly with the increase in deviator stress. This was because after the compaction of the remodeled loess, the particles were uniformly distributed and the inter-particle reached a relatively stable state, so its abundance changed little under the external load. Figure 12b analyzes the roundness of the pores of the remodeled loess at different creep stages. It can be seen that the value shows an overall decreasing trend with the increase in the deviator stress, which indicates that the pore structure tended to gradually round and the loess structure tended to gradually stabilize.
The frequency of the pore orientation distribution of the remodeled loess is shown in Figure 12c. From an analysis of the following figure, it can be concluded that the pores of the remodeled loess were dominant in the range of 20–50°, showing a certain degree of orientation, while the distribution of the remaining intervals was the same. From an overall perspective, the pore orientation increased during creep. Figure 12d shows the directional probability of the pore entropy of the remodeled loess at different creep stages, which changed little with increasing deviator stress, which coincided with the frequency of the directional distribution. Figure 12d analyzes the roundness of the pores of the remodeled loess at different creep stages. It can be seen that the value shows an overall decreasing trend with the increase in the deviator stress, which indicates that the pore structure tended to gradually tends round and that the soil structure tended to gradually tends stabilize.

3.2.4. Quantitative Analysis of Remolded Loess Particles

Figure 13a shows the particle pore size analysis results of the remolded loess in different creep stages. The diameters of the soil particles were mainly distributed in the 0–5 μm range, accounting for about 85%, the number of particles tended to increase with the increase in deviator stress and the pore diameter showed an overall trend of becoming smaller, which was similar to that of the intact loess. However, the average pore diameter of the remodeled loess was larger than that of the intact loess. This may have been due to the small inter-particle spacing of the remodeled loess and the combination of multiple soil particles into one soil particle during image analysis.
Figure 13c shows that the abundance of the remodeled loess particles was uniformly distributed. With the increase in deviator stress, the soil particles with an abundance between 0.8 and 1 decreased and then increased and the soil particles between 0 and 0.2 showed an overall increasing trend. Combined with the data in the table, it can be seen that with the increase in deviator stress, the long-strip structural unit cells increased and the average value tended to decrease at first, with the increase in deviator stress, before tending to increase. The reason for this may the substantial slip misalignment between the soil particles caused by the compactness of the remodeled soil particles under external load, which then increased the long-strip soil particles. Figure 13d demonstrates the roundness of the remodeled soil particles at different creep stages. The value gradually decreased with the increase of the deviator stress, indicating that the pore structure tended to gradually round and that the soil structure gradually stabilized.
The directional distribution frequency of the remolded soil particles is shown in Figure 13e. The remolded soil particles were dominant at 60–70°, showing a certain orientation. On the whole, the loess samples after creep damage offer certain advantages at 0–40° and 150–160°, while the overall orientation is increased. Figure 13f shows the directional probability of entropy of the remolded soil particles at different creep stages. It can be seen that with the increase in deviator stress, this value presented an unstable downward trend, but the decrease was not significant, indicating that there was no obvious orientation, which is exactly consistent with the directional distribution frequency. As for the fractal dimension of the reconstructed soil particle profile at different creep stages analyzed in Figure 13f, it can be seen that with the increase in deviator stress in the creep process, this value showed a decreasing trend on the whole, indicating that the pore profile gradually rounded and that the soil structure gradually stabilized.

3.3. Analysis of Influence Degree of Micro-Parameters

During the creep process, the loess microstructure changed correspondingly under deviator stress, but different microstructure parameters featured different trends. Figure 14 shows the changes in the microstructure parameters of the intact and remolded loess at different creep stages. The average pore size and particle size changed significantly at different creep stages for intact loess. The average variation range of the pore sizes was 14.70%, followed by particle size and porosity roundness, which were 10.09% and 8.99%, respectively. The probability of pore and particle orientation was the lowest, at 0.145% and 1.14%, respectively, indicating no obvious orientation in the creep process. The other parameters, porosity abundance, fractal dimension of pore profile, particle abundance, particle roundness and fractal dimension of particle profile, were 5.89%, 1.79%, 5.04%, 4.79% and 4.22%, respectively. For the remolded loess, the average particle size and average pore size changed significantly at different creep stages. The average particle size and pore size changed significantly at different creep stages for the remolded loess. The average variation range of the particle size was the largest, 14.68%, followed by pore size, which was 9.03%. The probability of pore and particle orientation was the lowest, at 0.118% and 1.00% respectively, indicating that there was no obvious orientation in the creep process. The other parameters, porosity abundance, porosity roundness, the fractal dimension of pore profile, particle abundance, particle roundness and fractal dimension of particle profile, were 5.58%, 4.87%, 1.71%, 7.07%, 3.38% and 3.16%, respectively.
The above analysis shows that the changes in the microstructure parameters of the intact and remolded loess were mainly manifested in pore and particle size (pore size and particle size) and shape change (abundance), while the complexity of the other microstructure parameters (roundness and fractal dimension of contour) and orientation (probability of entropy direction) exerted little influence.

4. Discussion

The creep deformation of loess includes reversible deformation and irreversible deformation; reversible deformation includes instantaneous elastic deformation and viscoelastic deformation and irreversible deformation includes instantaneous plastic deformation and viscoplastic deformation. The reversible deformation of the soil body is caused by the volume deformation between the loess skeleton and the reversible volume change in the air bubbles enclosed in the soil particles. Under load, the soil particles are close to each other and, when the load is removed, the repulsive forces between the soil particles separate and the deformed part of the soil body recovers. Irreversible soil deformation rearranges the soil particles due to inter-particle mix shift slip. Under external load, the pores and particles are rearranged, changes in soil microstructure accompany this process and the loess creep deformation is dominated by irreversible deformation.
In the stress process of loess, the soil skeleton composed of soil particles or aggregates features four deformation modes: sliding, rotation and transposition, crushing and aggregation. The former three are the main reasons for the plastic deformation of soil, while the latter is the main reason for the hardening of the soil structure in the creep process. The above four deformation modes mainly cause the creep deformation of loess. After the rotation, transposition, sliding and crushing of soil particles, the loess particles gradually change from point and edge contact to edge contact and surface cementation. Under external load, soil particles with weak connections are separated and some of the soil particles and aggregates are broken and re-aggregated into new aggregates, resulting in a reduction in the number of large pores and an increase in small pores. Because the irregular-shape and strip particles are more likely to be damaged and deformed than the round particles, the soil particles gradually tend to be round and form a more stable structure to adapt to the change of external force through sliding and dislocation among particles.
Through the aforementioned macro-mechanical tests and microstructural changes to the loess, it is known that loess is always accompanied by the fracture of inter-particle cementation and the fragmentation and reorganization of soil particles under external loading; furthermore, it adapts to external changes through the adjustment of internal forces. Moreover, under long-term loading, the adjustment of the internal forces changes slowly with time, causing the creep phenomenon of the soil. According to the magnitude of all the external forces and the degree of creep deformation during the triaxial creep of the loess, the process can be divided into three stages:
(1)
When the external load is less than the long-term strength of the soil, at the early stage of creep, the free water and gas between the soil particles are preferentially excluded; at this time, the internal forces in the soil are borne by the soil particles in the form of contact points, causing the soil particles to indicate the combined water film to produce extrusion elastic deformation, forming a resistance to an external load. The overall performance is dominated by structural hardening, the deformation rate gradually decreases until it tends to 0 and the soil creep deformation is small.
(2)
When the external load gradually approaches the long-term strength of the loess, under the action of the external load, the weaker linkage between the soil particles will preferentially fracture, the soil particles will slip and rotate, some of the soil particles will break and the softening of the soil structure will prevail. Under the action of this external force with the continuation of time, the loess deformation increases, forming more particle contact points; broken particles form new aggregates to adapt to the changes in the external forces, manifested as structural hardening.
(3)
When the external load is greater than the long-term strength of the loess, the growth of the structural hardening under the external load is not sufficient to compensate for the softening of the structure. At this time, the misalignment and slip between the particles are the main cause of deformation and, with the increase in the deformation rate, the soil is damaged.
The above analysis of the microscopic mechanism of the creep process of loess can provide technical support for loess engineering treatment technology. The strength of the soil can be increased by changing the association of the internal microstructure of the soil particles, such as by adding a chemical curing agent (usually cement slurry), the principle of which is to react the cement with the soil and improve the stability of the loess as a whole, changing the particle skeleton and structure of the undisturbed loess. The pore space is reduced so that the compression property of the foundation is reduced and the strength is increased.

5. Conclusions

The scanning electron microscopy technique was used to reveal the microstructural features of the loess creep process in Yan’an New Area, where the microstructure includes pores and agglomerates and the structural features include microscopic unitary and contact features. The microstructural characteristics during the creep of intact loess and remodeled loess were analyzed qualitatively and quantitatively by using the electron microscopy scanning technique and each microstructural parameter was compared. Finally, the microscopic mechanism during creep was analyzed. The conclusions are as follows:
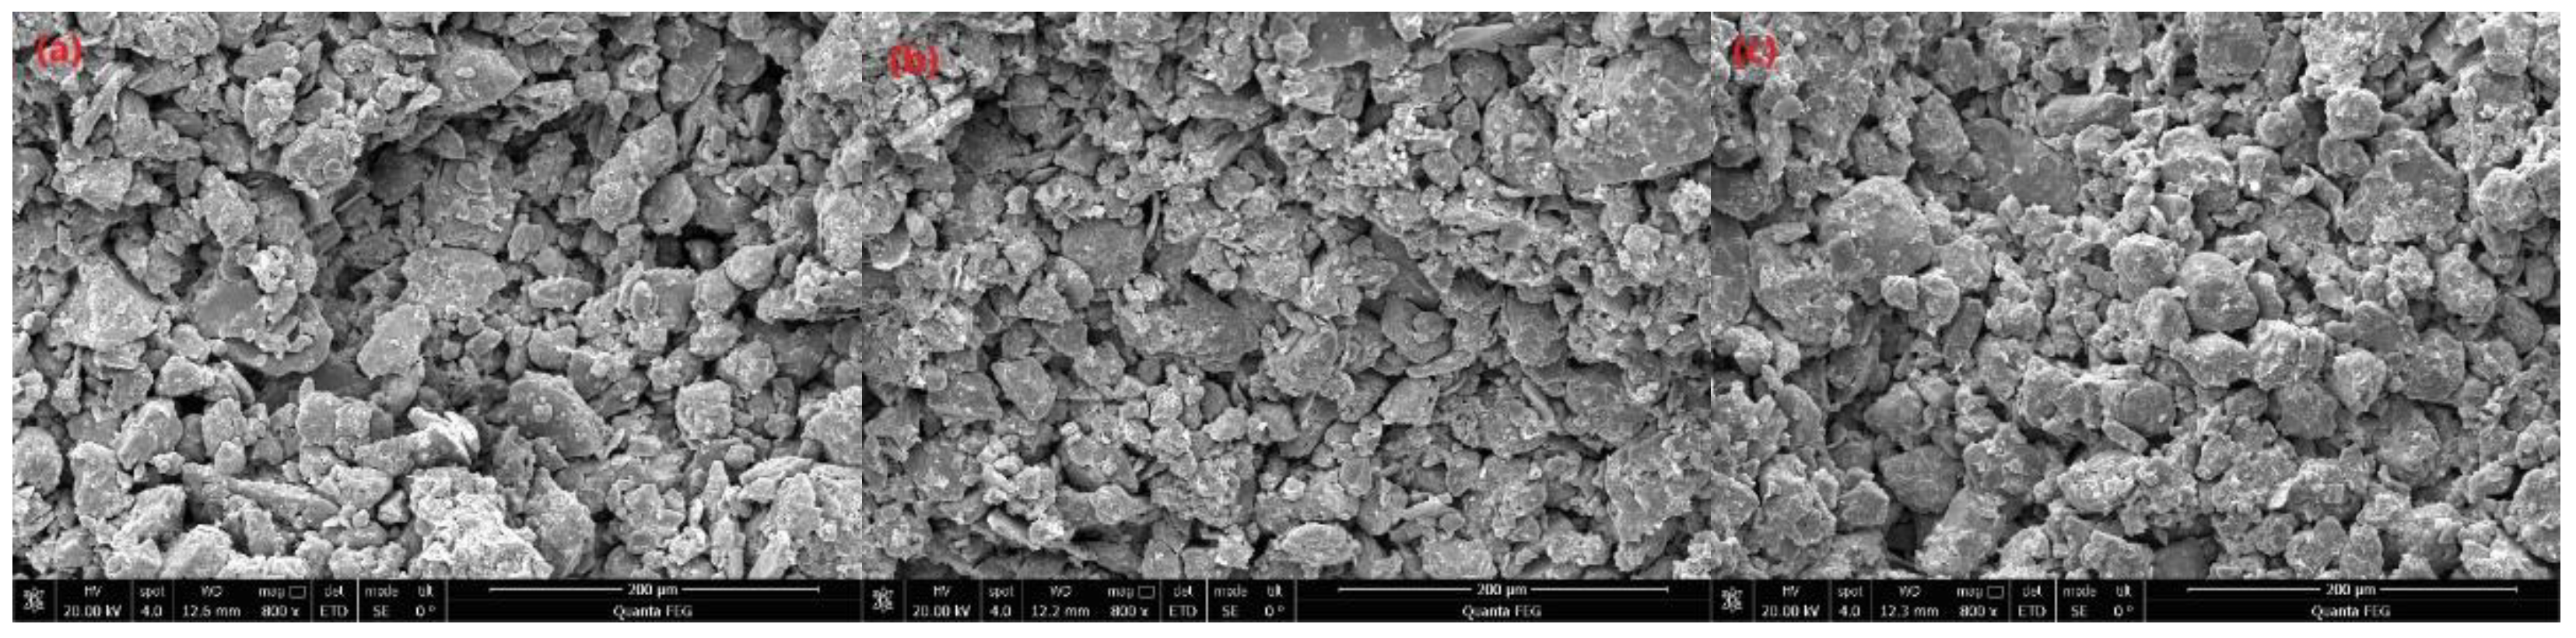
  • Quantitative analysis shows that in the process of the triaxial creep test, the soil structure of the intact loess gradually becomes compact, the debris material and viscous material on the surface of the particles increase, the soil particles gradually change from mainly granular and massive to mainly agglomerated, the overhead pores in the soil pores decrease and the intergranular pores increase. This is because the intact loess structure is loose and, under the action of external load, soil particles gradually gather into larger aggregates; and under the action of confining pressure and deviator stress, the large pores in the loess collapse, tiny pores and micro-pores increase, leading to the macroscopic expression of axial compression and volume compression. Due to thorough disturbance, the initial orientation of the soil particles is poor for remodeled loess. Under the action of confining pressure and deviator stress, the direction of soil particles gradually deviates to the direction of combined force (deviator stress). Hence, the qualitative development of remodeled loess in the creep process is obvious compared with intact loess.
  • The microstructural characteristics of loess can be described by size index (pore diameter, number of pores, pore area), shape index (abundance), complexity index (roundness, contour fractal dimension) and directionality index (directional frequency, directional probability of entropy). During the creep process, the microstructural parameters of soil change, among which the change in pore and particle size (pore diameter, particle size) and shape (abundance) are the most obvious. By contrast, the complexity of other microstructural parameters (roundness, contour fractal dimension) and orientation (probability of entropy direction) exert little effect.
  • During the creep process of loess, the soil skeleton changes continuously, but the soil microstructure experiences different changes at different levels of deviator stress. Before the loess enters the accelerated creep phase (the external force is less than the structural yield stress), the structural strength generated by the association between soil particles is greater than the external force, the degree of rotation and transposition of soil particles is small and the degree of microstructural change is small. When the loess enters the accelerated creep phase (the external force is greater than the structural yield stress), the linkage between soil particles is broken under the action of external force and the soil particles slip and rotate. Under the action of this external force with the continuation of time, the loess deformation increases, more particle contact points are formed and broken particles form new and stable aggregates.

Author Contributions

Z.L.: analyses, writing; J.W.: review & editing; S.Y.: software; S.L.: conceptualization; Y.L.: Visualization. All authors have read and agreed to the published version of the manuscript.

Funding

This research was supported by the National Natural Science Foundation of China (grant numbers 42027806 and 41630639) and National Key Research and Development Plan (grant number 2018YFC1504703).

Institutional Review Board Statement

Not applicable.

Informed Consent Statement

Informed consent was obtained from all subjects involved in the study and written informed consent has been obtained from the patients to publish this paper.

Data Availability Statement

According to the joint decision of all authors, the data cannot be used to other article.

Conflicts of Interest

The authors declare no conflict of interest.

References

  1. Rogers, C.D.F.; Dijkstra, T.A.; Smalley, I.J. Hydroconsolidation and Subsidence of Loess: Studies from China, Russia, North America and Europe: In Memory of Jan Sajgalik. Eng. Geol. 1994, 37, 83–113. [Google Scholar] [CrossRef]
  2. Romero, E.; Simms, P.H. Microstructure Investigation in Unsaturated Soils: A Review with Special Attention to Contribution of Mercury Intrusion Porosimetry and Environmental Scanning Electron Microscopy. Geotech. Geol. Eng. 2008, 26, 705–727. [Google Scholar] [CrossRef]
  3. Beckett, C.T.S.; Hall, M.R.; Augarde, C.E. Macrostructural Changes in Compacted Earthen Construction Materials under Loading. Acta Geotech. 2013, 8, 423–438. [Google Scholar] [CrossRef] [Green Version]
  4. Jiang, M.; Zhang, F.; Hu, H.; Cui, Y.; Peng, J. Structural Characterization of Natural Loess and Remolded Loess under Triaxial Tests. Eng. Geol. 2014, 181, 249–260. [Google Scholar] [CrossRef]
  5. Li, Y.; Zhang, T.; Zhang, Y.; Xu, Q. Geometrical Appearance and Spatial Arrangement of Structural Blocks of the Malan Loess in NW China: Implications for the Formation of Loess Columns. J. Asian Earth Sci. 2018, 158, 18–28. [Google Scholar] [CrossRef]
  6. Pusch, R.; Weston, R. Microstructural Stability Controls the Hydraulic Conductivity of Smectitic Buffer Clay. Appl. Clay Sci. 2003, 23, 35–41. [Google Scholar] [CrossRef]
  7. Wen, B.-P.; Yan, Y.-J. Influence of Structure on Shear Characteristics of the Unsaturated Loess in Lanzhou, China. Eng. Geol. 2014, 168, 46–58. [Google Scholar] [CrossRef]
  8. Li, P.; Vanapalli, S.; Li, T. Review of Collapse Triggering Mechanism of Collapsible Soils Due to Wetting. J. Rock Mech. Geotech. Eng. 2016, 8, 256–274. [Google Scholar] [CrossRef]
  9. Xu, L.; Coop, M.R. Influence of Structure on the Behavior of a Saturated Clayey Loess. Can. Geotech. J. 2016, 53, 1026–1037. [Google Scholar] [CrossRef]
  10. Ng, C.W.W.; Mu, Q.Y.; Zhou, C. Effects of Soil Structure on the Shear Behaviour of an Unsaturated Loess at Different Suctions and Temperatures. Can. Geotech. J. 2017, 54, 270–279. [Google Scholar] [CrossRef]
  11. Wang, J.; Li, P.; Gu, Q.; Xu, Y.; Gu, T. Changes in Tensile Strength and Microstructure of Loess Due to Vibration. J. Asian Earth Sci. 2019, 169, 298–307. [Google Scholar] [CrossRef]
  12. Li, D.-W.; Fan, J.-H.; Wang, R.-H. Research on Visco-Elastic-Plastic Creep Model of Artificially Frozen Soil under High Confining Pressures. Cold Reg. Sci. Technol. 2011, 65, 219–225. [Google Scholar] [CrossRef]
  13. Zhou, Q.; Xu, Q.; Peng, D.; Fan, X.; Ouyang, C.; Zhao, K.; Li, H.; Zhu, X. Quantitative Spatial Distribution Model of Site-Specific Loess Landslides on the Heifangtai Terrace, China. Landslides 2021, 18, 1163–1176. [Google Scholar] [CrossRef]
  14. Romero, E. A Microstructural Insight into Compacted Clayey Soils and Their Hydraulic Properties. Eng. Geol. 2013, 165, 3–19. [Google Scholar] [CrossRef]
  15. Al-Mukhtar, M.; Khattab, S.; Alcover, J.-F. Microstructure and Geotechnical Properties of Lime-Treated Expansive Clayey Soil. Eng. Geol. 2012, 139–140, 17–27. [Google Scholar] [CrossRef]
  16. Casini, F.; Vaunat, J.; Romero, E.; Desideri, A. Consequences on Water Retention Properties of Double-Porosity Features in a Compacted Silt. Acta Geotech. 2012, 7, 139–150. [Google Scholar] [CrossRef] [Green Version]
  17. Cuisinier, O.; Masrouri, F.; Pelletier, M.; Villieras, F.; Mosser-Ruck, R. Microstructure of a Compacted Soil Submitted to an Alkaline PLUME. Appl. Clay Sci. 2008, 40, 159–170. [Google Scholar] [CrossRef]
  18. Li, J.H.; Zhang, L.M.; Li, X. Soil-Water Characteristic Curve and Permeability Function for Unsaturated Cracked Soil. Can. Geotech. J. 2011, 48, 1010–1031. [Google Scholar] [CrossRef]
  19. Mansour, M.F.; Morgenstern, N.R.; Martin, C.D. Expected Damage from Displacement of Slow-Moving Slides. Landslides 2011, 8, 117–131. [Google Scholar] [CrossRef]
  20. Di Maio, C.; Vassallo, R.; Vallario, M. Plastic and Viscous Shear Displacements of a Deep and Very Slow Landslide in Stiff Clay Formation. Eng. Geol. 2013, 162, 53–66. [Google Scholar] [CrossRef]
  21. Wen, B.-P.; Jiang, X.-Z. Effect of Gravel Content on Creep Behavior of Clayey Soil at Residual State: Implication for Its Role in Slow-Moving Landslides. Landslides 2017, 14, 559–576. [Google Scholar] [CrossRef]
  22. Di Maio, C.; Scaringi, G.; Vassallo, R. Residual Strength and Creep Behaviour on the Slip Surface of Specimens of a Landslide in Marine Origin Clay Shales: Influence of Pore Fluid Composition. Landslides 2015, 12, 657–667. [Google Scholar] [CrossRef]
  23. Li, Z.; Wang, J.; Zhang, D. Creep Behavior of Intact Loess Followed Unloading Paths. Front. Earth Sci. 2021, 9, 812. [Google Scholar] [CrossRef]
  24. Sun, M.; Tang, H.; Wang, M.; Shan, Z.; Hu, X. Creep Behavior of Slip Zone Soil of the Majiagou Landslide in the Three Gorges Area. Env. Earth Sci 2016, 75, 1199. [Google Scholar] [CrossRef]
  25. Palmer, J. Creeping Earth Could Hold Secret to Deadly Landslides. Nature 2017, 548, 384–386. [Google Scholar] [CrossRef]
  26. Wang, J.; Zhang, D.; Wang, N.; Gu, T. Mechanisms of Wetting-Induced Loess Slope Failures. Landslides 2019, 16, 937–953. [Google Scholar] [CrossRef]
  27. Yates, K.; Fenton, C.H.; Bell, D.H. A Review of the Geotechnical Characteristics of Loess and Loess-Derived Soils from Canterbury, South Island, New Zealand. Eng. Geol. 2018, 236, 11–21. [Google Scholar] [CrossRef]
  28. Tan, R.Y.; Yang, C.H. Structural Responses of Underground Pipelines to Dynamic Loadings. Mech. Struct. Mach. 1988, 16, 103–122. [Google Scholar] [CrossRef]
  29. Zhang, F.; Wang, G.; Kamai, T.; Chen, W. Effect of Pore-Water Chemistry on Undrained Shear Behaviour of Saturated Loess. Q. J. Eng. Geol. Hydrogeol. 2014, 47, 201–210. [Google Scholar] [CrossRef]
  30. Peng, J.; Fan, Z.; Wu, D.; Zhuang, J.; Dai, F.; Chen, W.; Zhao, C. Heavy Rainfall Triggered Loess–Mudstone Landslide and Subsequent Debris Flow in Tianshui, China. Eng. Geol. 2015, 186, 79–90. [Google Scholar] [CrossRef]
  31. Zhou, Y.F.; Tham, L.G.; Yan, R.W.M.; Xu, L. The Mechanism of Soil Failures along Cracks Subjected to Water Infiltration. Comput. Geotech. 2014, 55, 330–341. [Google Scholar] [CrossRef]
  32. Wang, X.; Wang, J.; Zhan, H.; Li, P.; Qiu, H.; Hu, S. Moisture Content Effect on the Creep Behavior of Loess for the Catastrophic Baqiao Landslide. Catena 2020, 187, 104371. [Google Scholar] [CrossRef]
  33. Wang, J.-D.; Li, P.; Ma, Y.; Vanapalli, S.K. Evolution of Pore-Size Distribution of Intact Loess and Remolded Loess Due to Consolidation. J. Soils Sediments 2019, 19, 1226–1238. [Google Scholar] [CrossRef]
  34. IUSS Working Group WRB. World Reference Base for Soil Resources 2014, update 2015 International soil classification system for naming soils and creating legends for soil maps. In World Soil Resources Reports No. 106; FAO: Rome, Italy, 2015. [Google Scholar]
  35. Soil Taxonomy, Keys to Soil Taxonomy, 12th ed.; USDA-Natural Resources Conservation Service: Washington, DC, USA, 2014.
Figure 1. (a) Location of study area; (b) Associated geological map of the sample point (Geological map is modified based on Geological Map of China).
Water 14 00438 g001
Figure 2. Typical loess creep curve.
Water 14 00438 g002
Figure 3. (A) FSR-20 unsaturated soil triaxial creep apparatus; (B) schematic diagram of creep apparatus; (C) creep experiment.
Water 14 00438 g003
Figure 4. Creep curve of Yan’an loess.
Water 14 00438 g004
Figure 5. Loess particle morphology and connection method.
Water 14 00438 g005
Figure 6. SEM photographs of intact loess specimens at different creep status: (a) before test; (b) decay creep; (c) steady creep; (d) before creep test; (e) after creep test.
Water 14 00438 g006aWater 14 00438 g006b
Figure 7. SEM photographs of remolded loess specimens at different creep stages: (a) before test; (b) decay creep; (c) steady creep; (d) before creep test; (e) after creep test.
Water 14 00438 g007
Figure 8. Quantitative analysis of pore space of intact loess. (a) Histogram of pore content histogram; (b) number of pores and average pore size; (c) histogram of pore area distribution; (d) total pore area and apparent porosity.
Water 14 00438 g008
Figure 9. Quantitative analysis of pore space of intact soil. (a) Histogram of pore abundance distribution; (b) pore abundance and roundness; (c) frequency diagram of pore orientation distribution; (d) pore orientation probability and fractal dimension.
Water 14 00438 g009
Figure 10. Quantitative analysis of intact soil particles. (a) Histogram of particle content; (b) number of particles and average particle size; (c) particle abundance distribution; (d) average particle abundance and roundness; (e) particle orientation probability distribution; (f) particle orientation probability and fractal dimension.
Water 14 00438 g010aWater 14 00438 g010b
Figure 11. Quantitative analysis of pore space of remolded loess. (a) Histogram of pore content histogram; (b) number of pores and average pore size; (c) histogram of pore area distribution; (d) total pore area and apparent porosity.
Water 14 00438 g011aWater 14 00438 g011b
Figure 12. Quantitative analysis of pore space of remolded loess. (a) Histogram of pore abundance distribution; (b) pore abundance and roundness; (c) frequency diagram of pore orientation distribution; (d) pore orientation probability and fractal dimension.
Water 14 00438 g012
Figure 13. Quantitative analysis of remolded soil particles. (a) Histogram of particle content; (b) number of particles and average particle size; (c) particle abundance distribution; (d) average particle abundance and roundness; (e) particle orientation probability distribution; (f) particle orientation probability and fractal dimension.
Water 14 00438 g013
Figure 14. The magnitude of variation of microstructural parameters of intact loess and remolded loess.
Water 14 00438 g014
Table 1. Physical and mechanical properties of loess in the study area.
Water Content
ω
%
Density
ρ
g/cm3
Liquid Limit
ωL
%
Plastic Limit
ωP
%
Cohesion
c
kPa
Internal Friction Angle
φ
°
Specific Gravity
Gs
Grain Composition
Viscous Particles
%
Silt Particles
%
Sand Particles
%
14.71.5427.918.928.8718.992.6916.371.612.1
Table 2. Loess sample number and test conditions.
SampleNumberInitial Confining Pressure
kPa
Matrix Suction
kPa
Deviator Stress
kPa
Creeping Status
Remolded SamplesRC-0--Not loadedBefore loading
RC-1400100200Decay creep
RC-2400100200–400Steady creep
RC-3400100200–400–500–600Before creep failure
RC-4400100200–400–500–600–700Creep failure
Intact SamplesUC-0--Not loadedBefore loading
UC-1400100200Decay creep
UC-2400100200–400Steady creep
UC-3400100200–400–500Before creep failure
UC-4400100200–400–500–600Creep failure
Publisher’s Note: MDPI stays neutral with regard to jurisdictional claims in published maps and institutional affiliations.

