Abstract
Water conservation is essential to sustainable development, and among human activities, buildings are responsible for a significant portion of total water consumption. Therefore, we present a systematic review that aims to search for valuable contributions from benchmarking and their potential significance to water conservation. The relevance of performing such a review is to support the research in the field, organise information, and highlight both the lack of data and valuable results in specific building types. Benchmarking highlights best performance buildings, while it also classifies performances, which allows developing interventions for different buildings. Seventy-two documents on the environmental performance of buildings were reviewed, and a variety of methods, metering procedures, and indicators were found as valuable data for water-saving initiatives. In addition to a systematic search in SCOPUS, searches were made in Science Direct and Google Scholar databases. Although the main challenge in this matter lies in the lack of procedures standardisation, it was found that performing benchmarking is relevant for accurately developing water conservation initiatives. Gains of over five million m3 per year in a set of buildings or above 151 thousand m3 per year in a single factory were found, which indicate the existing potential for water conservation.
1. Introduction
Environmentally friendly buildings are essential for sustainable development and require standardisation. In that sense, there are building rating systems, such as LEED (Leadership in Energy and Environmental Design), BREEAM (BRE Environment Assessment Method), and Green Star, which mainly focus on energy efficiency. Although the concern over minimum water supply levels remains, water efficiency is more and more considered in sustainable building assessment.
Due to their high heterogeneity, benchmarking systems could be used to evaluate buildings efficiency, which could be implicated in improving overall resources conservation, such as water and energy. Benchmarking is a methodology that can be used for comparing similar processes of a given activity to highlight the one with the best performance [1], which can be used to assess the management of organisations. Even in presenting slight variations in data acquisition (e.g., sample definition), such practice has its core linked to comparative procedures and optimisations based on knowledge acquired in each organisation [2]. Benchmarking differs from a benchmark, as the first one is a process for comparison, and the other is a reference value of the ideal situation obtained from such a process [3,4].
Benchmarking methods can identify references (benchmarks) and determine systematic manners to compare all data to those references. Thus, benchmarking water consumption allows both highlighting the most efficient building and analysing such performance. Benchmarking is mainly done in three approaches: processes comparison, performance analysis, and strategies comparison [5]. Such approaches are necessary to establish an efficiency border where each element occupies a relative position compared to others, highlighting differences. A benchmark could be taken as a target, and in some way, it allows users to move from where they are to where is considered the ideal position in terms of sustainable water-use performance [6]. The criteria for sample selection are crucial for these techniques’ success [7]. The rules differ in the results and indicators validation. Therefore, benchmarking establishes criteria to represent a given phenomenon with optimal performance, providing indicators and performance goals as optimal references to evaluate similar phenomena [3].
In buildings assessment, benchmarking highlights best performance buildings while it classifies performances, which allows developing interventions for different buildings, and these properties can be used to assess how water is consumed in different types of buildings. Studies on water consumption in buildings generally consider specific indicators for each building type. These indicators could be “litres per inhabitant per day” for residential buildings [6,8]; “litres per guest per night” for hotels and other accommodation sites [9,10]; and “litres per student per day” for educational buildings [11,12,13]. There is also a dimensionless index ranging from 0 (the lowest performance) to 300 (the highest performance) for measuring water efficiency in dwellings, such as the one developed by Vieira et al. [14]. In addition to developing indicators, several techniques to perform evaluations on water efficiency in buildings have been developed [3,15,16,17,18]. Comparison evaluations, such as benchmarking, could use these methods and indicators to identify ideal situations in terms of water efficiency in buildings. Benchmarking systems including strategies such as cluster analysis can overcome such heterogeneity, as buildings can be assessed through their equivalents in resulting clusters. This procedure has been carried out in several studies, such as the study presented by Lara et al. [19], which was performed to assess energy consumption in a set of school buildings in Italy. The authors pointed out that a relevant issue when assessing a set of buildings is its correct definition and argued that a possible solution is the use of data mining techniques, such as the K-means clustering method. According to the authors, this allows the division of a large and heterogeneous sample into more homogenous and small groups, which facilitates finding benchmarks. Although many publications on water benchmarking are on agricultural sciences, as this sector accounts for most of the water consumption globally, the consumption in buildings is a significant portion of total water consumption among human activities. Buildings in non-industrial facilities represent 25.5% of all water withdrawn from nature in developing countries, such as Brazil (529 m3/s) [20]. In developed countries, water consumption in buildings shows higher values. In Austria, 27% of total withdrawal is consumed in urban buildings (33% of total water consumption) [21]. To assess how efficiently such an important amount of water is consumed in different building types, benchmarking could be used. Thus, this review paper aims to analyse benchmarking methods considering residential, commercial, and educational buildings. These three types compose the most common buildings and should represent the majority of urban facilities that are related to the water consumption mentioned.
As water consumption data are essential to designing sustainable buildings, the literature presents several studies that compare water efficiency levels in commercial, residential, and educational buildings [10,13,15,17,22,23]. Despite that, the development of standardised indicators is still an obstacle to ranking water consumption efficiency in residential buildings, as simple normalisation with a single parameter may not be enough [9]. On the other hand, complicated benchmarking systems may impose difficulties for the user to adapt to novel procedures [6,17]. Therefore, is possible to question whether performing benchmarking could support the development of water-saving measures for increasing water conservation. This question was investigated by reviewing benchmarking methods in buildings to highlight results that could be valuable for water conservation initiatives. Studies on buildings benchmarking focusing not only on water but also on energy and other resources were reviewed.
2. Review Method
The potential of benchmarking methods as a tool for developing water-saving measures and increasing water conservation in buildings was investigated in the literature available. A systematic review was conducted to find as many documents that have used the terms of interest as detailed below. The topics searched were benchmarking techniques to measure environmental performance, including water consumption in residential, commercial, and educational buildings. Buildings were searched as residential, commercial, and educational buildings for the different user behaviour found and water usage in each one. It is far different from how water is consumed in a factory or a dwelling. The same premise is adopted regarding educational buildings, such as universities and schools. For that reason, results from each type of building are categorised in this review.
The initial terms often appeared in exploratory searches on water benchmarking topics. The search on buildings by type (commercial, educational, and residential) comes from the way that buildings appear in publications. Most of the studies do not present “buildings” in their publications but the finality of such buildings instead. Examples are hotels, schools, and dwellings. They are all buildings; however, they are not presented as defined this way but as what those buildings are for. For that reason, buildings were also searched under these forms.
The search on SCOPUS focused on the terms “water consumption,” “water use,” “benchmarking,” and “buildings” found in the title, abstract, or keywords of publications according to the query string below. These four terms refer to the main review objective: how water is consumed in buildings. The final search term was then performed in SCOPUS using Boolean operators as follows:
TITLE-ABS-KEY ((“water consumption” OR “water use” OR “water consumption”) AND “benchmarking” AND (“buildings” OR “hotel*” OR “school*” OR “household*” OR “dwelling*”) AND NOT (“plants” OR “crops” OR “agriculture”))
- OR: finds all the documents that contain any of the terms;
- AND: presents only the documents that contain all the terms;
- AND NOT: excludes the specific terms;
- *: replaces multiple characters (e.g., hotel* = hotel, hotels).
Studies on water consumption in agricultural sciences presenting terms such as agriculture, crops, or plants were excluded, as this review focus on water benchmarking in buildings. The term “benchmarking” maybe be hidden when searched, as many studies on water-use assessment are useful for reviewing water benchmarking but do not mention “benchmarking” in title, abstract, or keywords. This gap was overpassed through supplementary topics and by searching in databases other than SCOPUS. In addition to SCOPUS, Science Direct and Google Scholar were searched. Previous searches showed that in 2000, relevant documents on the field were published. For that reason, this year was taken as the base timeline for the review.
An initial survey on benchmarks led to definitions and performance studies on buildings. These studies concentrate on the energy area, and benchmarking methods there appear more often than in the water efficiency area. Water benchmarking methods were investigated as the main topic of the review alongside supplementary searches, including water consumption drivers, user behaviour, and water efficiency in buildings.
The strategy searched valid results and methods considering commercial, educational, and residential buildings. Based on both results and methods, opportunities for overall water conservation were highlighted. Including documents on supplementary topics, the final number of documents used in this review originated from the searches in the three databases mentioned. This strategy was used to answer two questions: “Which benchmarking methods are used to assess water consumption in buildings?” and mainly “Can benchmarking methods for building performance assessment can support initiatives for improving water conservation?”
The review strategy considered firstly general benchmarking methods to find applicable systems to the water research field. This led to a review of several energy benchmarking systems, as they mainly appear when benchmarking in buildings is searched. Thus, to understand buildings performance was necessary to review several energy benchmarking methods. Then, water benchmarking systems became clearer, as studies suggested that it is possible to use energy benchmarking in water assessment in buildings. This understanding was aided through comprehensive supplementary topics, such as water consumption drivers, user behaviour, and water efficiency in buildings.
The review framework used throughout the study is shown in Figure 1. One can see that performing a systematic review includes reviewing supplementary topics, and that is the reason they appear in the review framework. This helped to build concepts and definitions in such a limited field that presents few studies published.
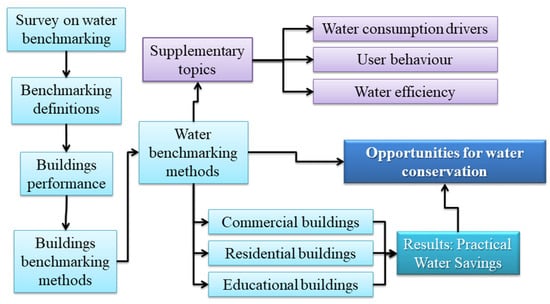
Figure 1.
Review framework for the main and supplementary searches.
This review framework is not mandatory to perform this type of review. Nevertheless, it aided the review to explore the field, as the availability of publications is still limited. To divide buildings into three types helped to organize the results as well as the discussions. The supplementary topics supported necessary concepts and definitions. Finally, results from practical research highlighted opportunities for water conservation.
3. Results
The search in SCOPUS alone resulted in 44 documents on benchmarking methods in buildings that could contribute to water conservation from their results. These documents are included in the total number of documents reviewed, which was 72 if searches through the other databases are considered. The documents not included in these results are on studies that do not mention the search terms in their title, abstract, or keywords (e.g., benchmarking, water consumption) but present valuable results on the topic. These results correspond to 28 documents that refer to those valuable results mentioned. Examples of such results are the energy assessment methods for buildings presented in the studies of Dascalaki and Sermpetzoglou [24], Desideri and Proietti [25], Filippín [26], and Santamouris et al. [27]. Other examples are studies with results from which benchmarks for water consumption in school buildings could be extracted, such as the work of Antunes and Ghisi [12] and Melo et al. [15].
The year 2015 presented the most significant number of publications. However, the majority of papers concentrate on recent years. Although the number of publications on this topic is still limited, Figure 2 shows a growing number of published documents since 2000, especially from 2014 onwards. This topic is considered interesting even without a large number of publications, as it could establish novel methodologies and references to support water conservation in buildings.

Figure 2.
Publications on the topic over 2001–2021.
The areas with the most publications are Engineering and Environmental Sciences, and the majority of papers have been published from studies carried out in Canada and the United States as Figure 3 shows. These numbers could be related to the language spoken in those countries, as benchmarking in English can refer to a comparison between indicators without a deeper search for references. In any case, the normalised values of such numbers could not represent an interest in the topic, as in non-English speaking regions, many documents are published in the local language. As for the type of publication, conference papers (17.6%) and journal papers (73.5%) were the most representative type of publications. Table 1 shows the most relevant documents found in terms of Cite Score, SNIP, and SJR, which could measure their relevance in journal assessment patterns. The journals in which some publications have been published illustrates that, despite their limited number, studies have been published in relevant journals.
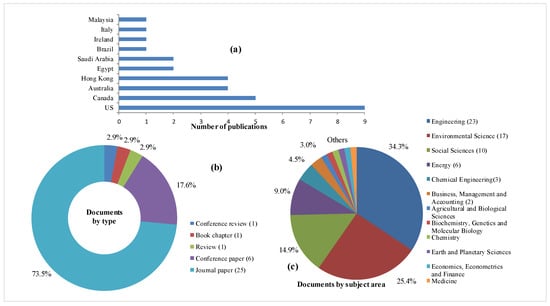
Figure 3.
Search results analysis. (a) The number of documents by country or territory; (b) Documents by type; and (c) Documents by subject area.

Table 1.
International journals in which the majority of journal papers were published.
3.1. Benefits of Performing Benchmarking in Buildings
The literature shows the influence on future projections from data obtained in benchmarking procedures. A relevant water-saving potential through rainwater harvesting systems was highlighted through correlations between water use and variables related to water supply from 62 cities [28]. Benchmarks were found for non-potable water supply alternatives, and their potential impact on water availability was discussed. Rainfall data, roof areas, water demand, and inhabitants per dwelling ratio were surveyed. The comparative assessment showed possible savings ranging from 32–95% of total water use (70–190 L/day). When considering future water availability, there is a significant difference between adopting such a strategy regarding annual per capita water availability [28].
Benchmarking uses measure systems and performance models to compare buildings efficiency using various methods [22,29]. In the construction sector, sustainable benchmarks define the minimum requirements to minimise the environmental impacts that are associated, including energy demand, water use, and emissions during construction, maintenance, and operation [30]. An environmental assessment that manages to isolate a financial analysis achieves better results [31], and benchmarking is shown in the literature as evaluating processes without considering financial aspects that can result from the actions taken. In that sense, benchmarking methods have been performed on energy and water efficiency. Alongside computer simulations, benchmarking is an essential resource performance assessment tool for buildings [8,22,32].
For performance evaluation of buildings with various indicators, measurement procedures require standardising the sample [22]. Benchmarking starts by collecting valuable data, and depending on what information is necessary, surveys are developed for different benchmarking purposes [33], including criteria definition to compose the sample. To evaluate water consumption, Duverge et al. [34] defined aquatic centres to compose their sample as public or community locations with at least one indoor pool and three different services, such as a gym, sauna, and cafe. That is a clear and objective definition to even the sample. The guidelines for benchmarking are the exact definition of sample buildings, which follows previously established criteria, being an essential step for comparative evaluation of buildings. In that sense, standards are suitable to divide the sample into groups for employing clustering analysis to identify representative buildings and parameters for reducing heterogeneity. The work of Lara et al. [19] showed a procedure to find clusters in a heterogeneous sample of school buildings aiming to assess energy consumption in Italy. To overcome an identified issue related to such heterogeneity, authors used data mining techniques to perform clustering analysis. The K-means clustering method was used to find clusters in a sample of 60 school buildings, which allowed to find suitable benchmarks to be compared to other elements. In addition to overcoming heterogeneity in a sample and performing an environmental assessment, benchmarking is also suitable to rank the efficiency of water utilities, whether concessionaires or state agencies. Their benchmarking is an analytical instrument for water conservation and allows obtaining valuable data from institutions [3,7]. Consequently, these organisations may raise their performance to improve indicators and increase water efficiency levels for evaluating both distributors and regulations [29]. In this context, Corton and Berg [3] assessed water services in Central America by surveying indicators, techniques, and cost-efficiency from organisations related to water services. Results showed institutional fragmentation as the main challenge to achieve better service performance due to inconsistent data from different water utilities operating within the same regions. A similar effort in the United Kingdom showed that many original standards for energy efficiency were inadequate, demanding the sector to be restructured for establishing suitable benchmarks [35].
3.2. Energy Benchmarking
The interest in comparing the performance of buildings on resources consumption comes from energy crises (e.g., the 1979 oil crisis), which led to efforts to design energy-efficient buildings [36,37]. As buildings account for 20−40% of total energy consumption in developed countries [37], their environmental assessment is critical. Human development processes increase water and energy stress due to a closed link between higher development and higher resource demand [38]. As performance benchmarking in buildings first gained prominence in the energy area and then in water conservation studies [37], it is necessary to briefly review energy benchmarking methods to understand their influence over water benchmarking in buildings.
Energy benchmarking methods require consumption forecast and use physical principles to calculate thermal dynamics and energy behaviour in the building, either in its entirety or in its sectors [8]. This procedure is done to compare a sample of buildings with a reference building or indicator [39]. Other methods use physical or thermal dynamic functions to calculate the energy consumption of all building components [40] and use the weather, construction system, building operation, service utilities, and air conditioning systems as inputs of prediction models. Due to rules established to evaluate each element based on performance, benchmarking allows resources consumption assessment even in large heterogeneity samples, such as hotel buildings [9,10,41].
Statistical regression, computer simulations, and score classification systems are the most used performance benchmarking methods [22,33]. The first one uses models developed through existing data to find correlations between several variables, such as the weather and building characteristics (e.g., age, size, number of floors, occupancy rate, and behaviour of occupants) [33]. Computational models calculate benchmarks from the simulated performance of a reference building [39,42]. The scoring classification methods use ranking systems, in which buildings are not compared to each other but assessed against best practice standards instead (e.g., Green Star, LEED, United Kingdom Code for Sustainable Homes—CSH) [6,22]. Alternatively, the hierarchical and end-use metrics method develops performance metrics from the highest level (entire building) to the underlying system performance data [33]. As for water consumption, score systems are found in the environmental performance evaluations of school buildings and are applied to measure the user perception index [13,15,43,44].
Energy efficiency indicators support energy benchmarking and sustainable policies, such as energy codes [22,37], and include the ratio of measured usable area and either use of equipment in hours or the water volume consumed, which is known as energy intensity [45]. Data found for each use are registered in a reference table and then compared with field measurements [37,46] to rank buildings resources consumption. Machine learning has been used to rank buildings and select and analyse specific energy datasets for cities. In that sense, the study of Papadopoulos and Kontocosta [47] cross-validated input normalised data for nearly 7500 buildings in the city of New York with optimal parameters, and then, a clustering algorithm was applied to rank energy use.
Energy benchmarking in buildings allows comparing benchmark residuals from both regression models and evaluated buildings regarding differences instead of similarities [48]. Residuals analysis was also used to develop a suitable model to explain the variability in city-specific energy data compared to the Energy Star benchmarking system [49]. The residuals are, in these cases, a measure of inefficiency, and their quantity should be minimal in the design process. Strategies on benchmarking often require statistical analysis of data collected before the evaluation [11], and alternatively, some methods use actual meter-monitoring data from buildings [8].
According to the transparency in evaluation processes, benchmarking methods are classified into white-box, grey-box, and black-box [50]. Physical constraints exist in white-box modelling, and a large amount of data is required, i.e., there is less empirical knowledge and more modelling processes to perform the assessment. Grey-box and black-box methods grade the amount of available data. Thus, a black-box method presents data adjustment instead of knowledge of physical data and needs a statistical model pre-selected besides data (e.g., Artificial Neural Networks). Reference lines are adopted in four ways: previous performance of similar buildings; current performance of similar buildings; previous performance of the same building; and intended performance of the same building [50].
Although benchmarking supports the understanding of environmental impacts in different building phases, results are limited to that specific building. Nair et al. [51] showed how efficient water conservation measures can save energy at an Irish university building through the assessment of hot water usage, heating water energy, pumping water energy, carbon emissions, and solar power potential. Nonetheless, their findings would be only applicable to similar conditions.
As has been seen, benchmarking not only allows highlighting best practices and results but can also build rankings on efficiency or other characteristics. It also can be applied to evaluate organisations, such as water and energy utilities, rather than only buildings to reach major levels of service quality. Benchmarking methods need data, and any more information represents more accuracy on results. However, not only is the quantity of data important, but mainly quality data are required, as one can see in the work of Duverge et al. [34]. As they can vary on procedures involved, all benchmarking systems so far require particular care on data collection phases.
3.3. Water Benchmarking in Buildings
Although related to high monitoring costs, initiatives in water benchmarking, green buildings, and water-efficient facilities have been encouraged in recent years, as they represent long-term solutions for water and energy savings [52]. Water efficiency has more often been included in key performance indicators for buildings performance assessment alongside energy efficiency [53]. This section focuses on residential, commercial, and educational buildings. A table at the end of each section summarises methods and results for water conservation.
3.3.1. Residential Buildings
Due to the relevance of urban residential water consumption [54], evaluation methods on domestic water efficiency are needed. Such evaluation uses performance assessment functions that include converting state variables (e.g., water flow ratio, volume) in the performance index to be classified in standard water devices. As benchmarking depends on accurate building definition, the existence of alternative water supply systems, such as rainwater harvesting and greywater use systems, could strongly influence results [28,45,55]. In the United Kingdom, the Code for Sustainable Homes (CSH) [51] establishes maximum daily values of 80 L/person for the best-performing benchmarks, 105 L/person for mid-range benchmark levels, and 125 L/person for lowest-performing benchmarks [6,56]. Although domestic consumption is traditionally determined by the per capita approach, it may present high variability due to climate, culture, economy, individual demands, occupation characteristics, and building typology besides water end-uses [18].
Excluding toilet flush, the variation in daily per capita consumption is 65–175 L in Europe, 105–237 L in the United States, and 150–380 L in Asia [17]. Regarding this reality, the study of Wong and Mui [18] assessed 60 flats in Hong Kong with a mean distribution of water consumption as input for the estimative model. Results were compared to regional standards to generate suitable benchmarks. The highest 5% consumption was equal to or higher than 108 m3 per person per year. Both higher and lowest 5% consumption were used to evaluate consumption. Results showed that according to adjustments to reach benchmarks in different scenarios, the official yearly consumption in Hong Kong (61 m3 per person per year) could be 43, 47, and 50 m3 per person per year for the first, second, and third posterior predictions, respectively [18]. For comparison, in 2005, surveys showed 82, 75, and 70 m3 per person per year, respectively. The third mean found was 50% of Hong Kong total freshwater consumption (140 m3 per person per year).
In the pursuit of better understanding, researchers have been applying different analysis tools, such as Adaptive Logic Networks (ALN). In the work of Chen et al. [8], ALN has been used with sociodemographic information as input for developing water-use prediction in twenty homes in Sosnowiec, Poland, and ten in Skiathos, Greece. This was done by comparing baseline under two approaches: household water consumption against its consumption over time and comparing several households in the same region. Inputs were the city size, age, the income of inhabitants, and their education level, allowing water consumption prediction in similar cities. This benchmarking system exemplified the use of on-site metering data in addition to statistical procedures, showing that real-world measurements require fewer data to infer useful conclusions. Predicted means can be compared to measurements, and in the case of measurement larger than predicted values, that particular household is using more water than necessary [8].
Performance indicators for individual water-use devices could be dimensionless, ranging from zero to 300 for calculating a general index by weighting each device for the correspondent water use. In the study of Vieira et al. [14], water-use and socioeconomic variables nexuses were analysed in 43 households through dimensionless indicators to highlight measures to enhance water efficiency. In that sense, valuable data for benchmarking can also be obtained from studies that aim to estimate water consumption, as their results highlight the most influential variables. Examples are the influence of building age and its distance to the central city area on the water consumption [57] as well as the number of inhabitants per dwelling, their educational level, building characteristics, number of bathrooms, building age and floor area, the existing water-saving systems, and water conservation habits [58].
In residential buildings, water and finance savings could be reached from benchmarking as the studies of Ghajarkhosravi et al. [33,59] have shown. Water consumption data—among other services (gas, electricity, and waste treatment)—from 2007 to 2011 were used to perform a benchmarking in a set of 105 multi-family residential buildings in Toronto, Canada. Results were classified to identify the top performer, the 25th percentile, the 50th percentile, and the 75th percentile, highlighting the possibility of saving 5,102,089 m3 of water per year (CAD 12,721,671 based on the 2012 price of water in Canada).
Although studies have shown the benefits of benchmarking techniques, they do not only present positive aspects in the water efficiency context. By highlighting benchmarks, decision makers could impose desired behaviour over regular users in the pursuit of water conservation. Thus, it is critical to understand practical aspects of adopting a benchmarking system in residential buildings by considering the feedback of users related to what is achievable [6]. Reaching benchmarks requires knowing how much it is possible to seek lower consumption without compromising comfort, safety, and hygiene. Therefore, more research on user behaviour in benchmarking the environmental performance of buildings should be carried out [60].
The sensitivity of water indicators is measurable by detecting changes in user behaviour and technology, such as rainwater harvesting, greywater utilisation, and the inclusion of gardening demands [55]. Benchmarking depends on the roof area, gardening area, building location, daily occupancy rates, rainfall parameters, and conventional water supply quality [6]. Available technology and user behaviour, associated with socioeconomic factors, are critical elements in bringing consumption closer to benchmarks. Table 2 summarises findings from benchmarking procedures discussed above that could be applied in sets of buildings for improving their water conservation.
Table 2.
Procedures and results related to benchmarking water use in residential buildings.
Benchmarking water use in residential buildings highlights the heterogeneity of this type of building. In general, the number of buildings investigated is low when compared to the actual building number in the cities where the studies have been carried out. It is understandable that researches have limitations, but it is interesting to note that benchmarking procedures can originate useful results from samples. Even the sample results for water conservation are considered a great contribution, such as the potential savings pointed out by Ghajarkhosravi et al. [33]. In addition, from residential buildings come discussions on how the user will react if as a target for low water consumption is imposed. Residential use is far different from factory use or that in a hotel, which is why residential water benchmarking should be addressed separately from other types of buildings.
3.3.2. Commercial Buildings
Benchmarking in non-residential buildings has also been performed, and applications in specific buildings, such as sports centres, hotels, and factories, are found in the literature. In this section, publications were reviewed to assess the relevance of benchmarking on water consumption in high-heterogeneity buildings. An example of a benchmarking system was found in the study of Alkaya and Demirer [61], which was applied to an internal production chain to assess a polyethene terephthalate factory. It was found the possibility of saving 151,428 m3 of water per year by identifying the most intense water-use processes and implementing suitable measures. Gains in energy consumption were also highlighted in cooling systems due to less heat generation from machines and less CO2 emitted per year. This shows the potential for water conservation of benchmarking in a particular activity.
In the tourism industry, water scarcity is a primary environmental concern [9,10]. As a highly water-consuming sector, despite driving development for many regions, this activity is also a driver of negative impacts on water resources [62]; i.e., water consumption in hotels is much higher than in dwellings [63]. Consequently, rational water use is a key sustainability challenge for such an industry. Researchers have often focused on direct (on-site) consumption, with tourism water management based almost exclusively on direct water-use benchmarks [9].
As benchmarking supports rational water-use programmes by setting indicators and goals, water efficiency has been surveyed in the accommodation sector. Styles et al. [10] found consumption greater than or equal to 140 L per guest per night at full-service hotels and 94 L per guest per night at camping sites. Suitable benchmarks were then established, and simulations were performed to estimate gains in water efficiency in a 100-room hotel and 60-lot camping site. Potential water savings found was 228 and 127 L per guest per night in the hotel and the camping site, respectively, representing 16,573 m3/year (422 million m3/year if adopted in all Europe) [10].
However, depending on the approach, the use of some indicators can be inappropriate. Although indicators such as “litres per guest per night” could be suitable for benchmarking purposes, they do not indicate whether abstraction levels are sustainable compared to the available renewable water resources [9]. As an example, there is a vast amount of renewable geothermal and heated water in Iceland, and the use of water by tourism is mostly irrelevant. On the other hand, in water-scarcity locations, consumption impacts are highly dependent on the season [62].
Sustainable programmes could be originated from favourable results in benchmarking water use in hotels. The work of Bohdanowicz and Martinac [41] investigated the influence of hotel standards, building area, number of accommodations sold, and number of meals served on water consumption; variable regression analysis was carried out for 184 hotels in Europe. Significant differences in water consumption were observed between Hilton and Scandic hotels, highlighting the need for smaller and more representative classification groups with comparable properties for establishing suitable benchmarks. It was also found that “guest nights” sold was the most influential variable, with each additional guest consuming 0.16 m3 of water followed by total hotel floor area (0.38 m3/m2). Furthermore, the pool facility increases annual consumption by approximately 1000 m3/year, and each meal sold uses an additional 0.006 m3 and if irrigation is required, 0.088 m3/m2/year. Researchers concluded that the floor area could be more relevant than guest nights for consuming water in water-stressed locations, such as Mediterranean regions, where there is intensive irrigation [41].
A similar effort was made in a hotel in Barbados by correlating the number of accommodations, hotel standard, building size, and employees quantity for developing a unit water consumption model [63]. It was found that in terms of unit consumption (i.e., litres per guest night); there is a high water use when compared to international benchmarks. Another concerning finding is that in a water-stressed place such as Barbados, the daily consumption in hotels was about three times greater than the average consumption of the general population (756 vs. 240 L per capita) [63].
Office buildings are included in benchmarking studies as consumption measures and demand drivers could define a database for their assessment, including guidelines to generate suitable benchmarks. In the benchmarking carried out by Bint et al. [64], the inputs were a letter of acceptance from the manager to survey legal documentation on building characteristics, an information sheet of the history of changes (installations in the last five years and most recent consumption metering), and historical water collection data. On-site surveys were used to validate the information through a generic visiting protocol with all necessary building aspects: number and type of bathroom and kitchen equipment; cooling systems standards; details on the water metering; and building location. Regarding office buildings, flushing toilets and sink taps could be the most contributing pieces of equipment to water consumption, presenting acceptable compatibility between measured consumption and estimates based on user interviews [23]. Such findings could represent useful benchmarks for office buildings.
However, the lack of standardised classification and metering systems is an obstacle to spreading water-saving measures based on benchmarking. Although the efforts to extend such measures increase homogeneity in groups, significant variations in drivers for water-use remain. Energy benchmarking methods could overcome such a gap. They use the principle of the least-squares and multiple linear regressions to enhance simple normalisation, which allows the modelling of numerous use drivers [29]. Thus, it is possible to standardise measurements and increase statistical significance to determine independent variables. Alternatively, data enveloping methods include many observations to set an efficient boundary, from which the deviation measures choose efficiencies of all other elements. Their usability was demonstrated by applying both techniques for studying water efficiency and generating benchmarks on data from 17,187 commercial, industrial, and institutional facilities in Austin, United States [29].
Benchmarking methods develop suitable indicators for many different situations. However, there is little consensus on which indicator is most appropriate. To overcome this divergence, the initial criteria for choosing the sample could be critical. In that sense, Duverge et al. [34] performed a benchmarking on water use in Australian sports centres and applied pre-established standardised guidelines and procedures. The sample was composed only of sports centres with indoor pools and at least three services, such as a fitness centre or snack bar. Such guidelines allowed sample selection and elements standardisation to compare water consumption in different variables and indicators.
The methods and findings discussed in this section are summarised in Table 3, which also shows different contributions to water conservation. It should be noted that several studies had no intention to explore benchmarking methods but identified benchmarks and drivers.
Table 3.
Results from water-use benchmarking in commercial buildings.
In commercial buildings, benchmarking could identify references that can be used in simulations that show interest numbers of water-saving potential. Examples are given by Alkaya and Demirer [61] as well as by Styles et al. [10]. In addition, guidelines appear to be more important to benchmark this type of building, as they are generally larger than residential buildings. In larger buildings or facilities, protocols to survey data are important, as such surveys must be equivalent in all buildings for comparison purposes.
3.3.3. Educational Buildings
As buildings in the educational sector are highly heterogeneous, benchmarking methods have been addressed to assess their performance in the energy efficiency area [24,25,26,27,42,51,65,66]. The usability of such methods for water efficiency assessment has been demonstrated [29]. In educational buildings, studies have addressed how indicators are produced as well as the influence of both alternative water supply systems and methods for assessing user behaviour [11,12,60,67]. Although benchmarking could support decision making on rational use of water in buildings, the lack of consensus on the most influential drivers for water consumption remains. This reality leads to initiatives that attempt to assign more accurate indicators by multivariate regression and score systems applied to user behaviour [13,44].
Cluster analysis methods, such as Complete Linkage and the Method of Ward, are used to organise benchmarking data. In that sense, Almeida et al. [11] found significant water and energy consumption variability in 23 Portuguese schools with similar physical characteristics due to non-constant user behaviour in similar environments. Water consumption assessment in schools is within an evaluation system that includes other sustainability variables, such as lectures addressing solid waste production and classification, noise pollution, food waste, and traffic density around the school [43], which could be regarded as drivers for water consumption in benchmarking systems.
Another interesting alternative to rank buildings by their environmental performance is Fuzzy clustering. This approach is useful to overcome uncertainties in evaluation systems [68], such as the definition of where is the efficiency borderline in such buildings. In that sense, higher educational institutions in Canada were ranked regarding water and energy consumption and greenhouse gases emissions [60]. Seventy-one buildings were grouped in three clusters based on their reported energy and water consumption as well as carbon emission: Cluster 2 obtained the best environmental performance (33 buildings, average area 10,051 m2); Cluster 1 showed a typical performance (30 buildings, average area 11,528 m2); and Cluster 3 obtained the lowest environmental performance (8 buildings, average area 5843). The average water-use intensity found was 1.01 m3/m2 for Cluster 1, 0.80 m3/m2 for Cluster 2, and 1.72 m3/m2 for Cluster 3 [60]. These findings represent different degrees of membership of each group to the so-considered efficient condition, and the environmental performance was then benchmarked. The results were highlighted as potential realistic targets to concentrate efforts in low-performance buildings.
Heterogeneity tends to be more prominent when drivers for a particular phenomenon are less known. This trend becomes clear in developing countries, where the lack of data is often a reality. In Brazil, daily water consumption in schools varies from 3.79 to 81.1 L per student [13]. A more recent study indicates a disparity between 0.81 and 35.43 L per student per day [12]. Internationally, this variability, through different indicators, can range from 11 L per student per day to 547 L per person (not only student) per day [13,69]. However, the main obstacle to overcoming such disparity, other than the high variability in consumption data, could be the poor standardisation of indicators. Some studies consider only students [12,67], others find general occupants of the school [11,13,44], and even consumer agents per day (water users other than the regular school population, such as parents of students) have been considered [15].
The influence of user perception has been investigated as a driver for improving water efficiency in schools. The analysis of data from 140 schools in Brazil showed 47.14% ranging between 10–20 L/student/day, 25.71% ranging from zero to 10 L/student/day, and 16.43% ranging from 20–30 L/student/day [70]. Using questionnaires, interviews, and on-site observations, this research has also found greater user perception over water consumption in areas inside buildings rather than outside. The study of Melo et al. [15] in twelve public schools distributed in six cities in south-eastern Brazil showed a great variation in water consumption, ranging from 13.6–27.3 L per consumer per day. In another study, a survey of water sanitation facilities was used to calculate a monthly indicator in a technical education building, which found consumption ranging from 6.28–22.78 L/student/day between 2012 and 2015 [71]. An assessment of user perception index applied to different cities revealed that previous studies [44,72] had shown an increase in such index from water users in schools [71]. The variability of water consumption indicators in educational buildings is shown in Table 4.
Table 4.
The water consumption variability in schools.
As for the educational buildings, the main challenge appears to be the lack of standardisation on indicators and information found. This could be linked to education standards around the world, which implicates students as well as the type of buildings where schools and universities are located. Nevertheless, in the same countries, such as Brazil, there are significant differences between such indicators and values, which generates concern about the quality of data available. The availability of data is another concern, as many countries on the globe present a lack of information on water use in educational buildings, as can be seen in Figure 4, which shows the proportion of schools with a basic drinking water service by country, 2016 (%).
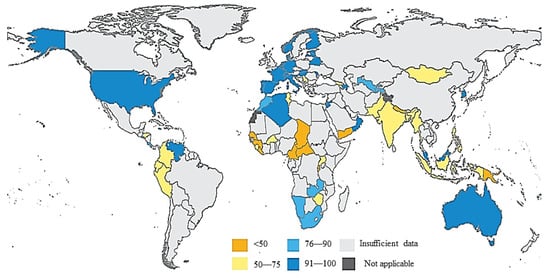
Figure 4.
The lack of information on water use in schools [73].
3.4. Potential Water Savings from Initiatives Based on Benchmarking
There are three approaches for water savings in buildings that are more often explored: environmental education for rational use of water programmes, installation of water-saving technologies, and supplementary water supply systems (mainly rainwater harvesting and greywater utilisation). Benchmarking should consider those, as they are increasingly found in current and future building designs. However, it is important to highlight that alternative water supply systems should be considered in buildings design and assessment with concern to the water quality obtained. Moreover, it can complement such approaches by highlighting and organising data so that technologies and programmes can reach better results.
As the review highlights the relevance of benchmarking methods in buildings for water conservation, Table 5 summarises the potential water savings found in each type of building reviewed. The role of benchmarking in promoting overall water conservation shows that relevant amounts of water could be saved even if not adopting best practices but targeting intermediate benchmarks.
Table 5.
The potential savings found in studies from water-use benchmarking in buildings.
Clusters found through fuzzy methodology [60] demonstrate that potential water savings could range from 41.28–53.49% if practices adopted in Clusters 1 and 2 were adopted in Cluster 3, which contains the set of buildings with the lowest performance. For Clusters 1, 2, and 3, this represents potential savings of 11,643 m3, 8040 m3, and 10,049 m3, with performance similar to the benchmarks in all buildings. Similar conclusions could be made over the performance groups found for multi-family residential buildings [33], where water savings up to 5,102,089 m3 per year could be reached. In the accommodation sector, 22 million m3 per year of water could be saved if benchmarks and best practices were adopted all over Europe [10]. Finally, a single factory showed possible water gains of more than 151 thousand m3 per year by identifying the most water-intense processes applying water-saving alternatives and optimising such processes [61].
4. Discussion
4.1. Advantages and Disadvantages of Performing Benchmarking to Assess Buildings
Benchmarking is such a great tool to find useful references when assessing water distribution networks. It allows identifying those elements that present high consumption values or those with excessively low consumption. In both cases, these references are useful because they allow the network manager to accurately direct efforts to control network issues, such as issues or under-measuring buildings. In addition, after implementation, benchmarking-based monitoring models are low cost to maintain and make possible remote monitoring of such networks. This is a huge positive aspect and must be pointed out, as they only need to be fed with more and updated data on buildings and network characteristics.
Although benchmarking is useful to identify and compare similar elements to search for best performance references, the lack of indicators and the heterogeneity in procedures could make it difficult to choose the most appropriate method for each evaluation. Benchmarking systems could include clustering analysis, which can overcome heterogeneity, as clusters are similar, and valuable information could be obtained from their internal comparative assessment. This procedure included in benchmarking systems can be used to overcome heterogeneity in a set of buildings. In general, statistical procedures are the most common techniques to build a benchmarking system. On the other hand, some designs use real-world data obtained using smart meters. Both are applicable to assess water consumption, but each one has limitations.
The common benchmarking processes are comparisons between a standard or a benchmark and other elements that can be done using a reference base rule. This common type of benchmarking has limitations related mainly to the specific variables that could be involved. Examples of such variables are climatic conditions, cultural behaviours by users, and technological limitations. This reality could limit average buildings to reach benchmark’s water consumption or even to approximate to an ideal efficiency. Therefore, the results from benchmarking procedures and their limitations should be considered in the process of supporting water-conservation initiatives. This review summarises benchmarking methods that have generated valuable results for promoting water-conservation initiatives. Their use has been increasing in recent years, as water use evaluation requires good-quality data to identify drivers for water consumption. Hence, benchmarking allows researchers to gauge measurements, compare results, and find references of efficiency. Benchmarks can be used as consumption goals for users, which in the very process of trying to approach that level, lower their water consumption.
4.2. Benchmarking and Actual Water Conservation
Even though benchmarking systems present all the advantages mentioned, their contribution to overall water conservation depends on the concrete development of initiatives that promote this benefit. This means that the answer on whether benchmarking systems are capable of promoting water savings would be negative if such concrete terms were considered. However, in indirect terms, it is possible to say that these systems promote water conservation, as they detect issues in distribution networks as well as in industrial production chains and are a tool for setting goals that would help achieve these goals. The gains in water conservation would depend not on benchmarking but on what actions are taken from the information provided by such systems.
In that sense, not performing benchmarking would be the issue, and such an action needs to be discussed. In the absence of benchmarking, rational water-use programmes and water-saving technologies in buildings may show negligible effects due to improper design or, for being applied to an unknown efficient building, not resulting in measurable improvement. This poor initiative implementation is frequent in educational and commercial buildings. Thus, it is important to consider factors that influence the pursuit of benchmarks: socioeconomic, technological, cultural, and climatic aspects. Benchmarking does not directly guarantee lower water consumption rates, as the imposition of consumption targets can have controversial effects on user comfort. However, the assessment of buildings through benchmarks could highlight drivers that should be addressed to improve water efficiency.
4.3. The Relationship between Benchmarking and Regular Water-Saving Initiatives
Water consumption studies results are far from absolute definitions, as indicators may be unsuitable in addition to depending on cultural, socioeconomic, climatic, and technological factors. Benchmarking could be a starting point for an overview of water consumption in buildings by accurately addressing water conservation efforts. Although not being the most water-withdrawing sector or human activity from nature, buildings represent a significant challenge for water conservation due to their high heterogeneity of types and purposes.
Benchmarking water consumption could be as efficient for water conservation as water-saving systems in buildings on a large scale, especially if the implementation of such systems lacks information on which buildings need to be improved. In addition, it has been demonstrated that water-conservation measures supported by benchmarking systems could increase water savings in buildings. In that sense, benchmarking should be performed before installing water-saving systems or implementing educational programmes.
In conclusion, there is less chance of success if such efforts do not have references or benchmarks. Initiatives based on benchmarking are similar to the idea of sustainable development in setting goals that may be challenging or even impossible to achieve. However, the very attempt to improve the indicators leads to improvements in sustainability and water-conservation processes.
Through this review, the potential of benchmarking to support water-saving initiatives becomes clear. This could inspire research on the reasons why such initiatives are less popular than they should be. Water conservation is critical to a sustainable future, and the application of novel technologies and methodologies is desirable to address it.
As for general environmental concerns, reducing water consumption in buildings is mandatory for sustainable development, as it can significantly contribute to overall water conservation. Buildings are often considered in environmental discussions as a single system. However, regarding many buildings as a single environmental system highlights the massive potential for water conservation. Such procedures could assist in decision making in terms of cities’ management.
4.4. Research Opportunities
Alternative water supply systems (rainwater harvesting and greywater utilisation) could be included in the characterisation of buildings for benchmarking systems. The literature does not often address such systems on this topic, which are becoming more popular and promote physical modifications in buildings, making them highly relevant in water-consumption studies. Future research could identify specific conditions in benchmarking systems and define protocols for each technology to be classified according to its influence on the evaluation. It must be pointed out that including alternative water supply systems in future buildings should be done with an awareness of the water quality from these sources, which could be also evaluated in benchmarking procedures.
The literature has not often mentioned the relevance of establishing partial efficiency criteria in water use. Partial efficiency refers to methodologies that are not based on classical logic and do not establish “efficiency” and “not efficiency” conditions for buildings. Fuzzy logic can define efficiency levels that are between those classic logic conditions. This is useful for deeper efficiency evaluations. Determining the relationship between benchmarks and other relative efficiency definition outcomes is essential for establishing efficiency levels that fluctuate between lower- and higher-efficiency scenarios. The establishment of an efficiency ranking could consider such intermediate levels to support decision making and enrich the database on the subject.
Author Contributions
Conceptualization, R.A.F.; methodology, R.A.F. and E.G.; writing—original draft preparation, R.A.F.; writing—review and editing, R.A.F. and E.G.; supervision, E.G.; funding acquisition, E.G. All authors have read and agreed to the published version of the manuscript.
Funding
This research was funded by the Brazilian Council for Scientific and Technological Development—CNPQ, grant number 140878/2018–1.
Institutional Review Board Statement
Not applicable.
Informed Consent Statement
Not applicable.
Data Availability Statement
Data are contained within the article.
Acknowledgments
Authors acknowledge the Brazilian National Council for Scientific and Technological Development—CNPq (Grant no. 140878/2018-1) and the Federal University of Santa Catarina (UFSC) for the support received to carry out this study.
Conflicts of Interest
The authors declare no conflict of interest.
References
- Camp, R.C. Benchmarking: The search for industry best practices that lead to superior performance. Qual. Prog. 1989, 22, 62–69. [Google Scholar]
- Galindro, B.M.; Zanghelini, G.M.; Soares, S.R. Use of benchmarking techniques to improve communication in life cycle assessment: A general review. J. Clean. Prod. 2019, 213, 143–157. [Google Scholar] [CrossRef]
- Corton, M.L.; Berg, S.V. Benchmarking Central American water utilities. Util. Policy 2009, 17, 267–275. [Google Scholar] [CrossRef]
- Yu, I.; Kim, K.; Jung, Y.; Chin, S. Comparable performance measurement system for construction companies. J. Manag. Eng. 2007, 23, 131–139. [Google Scholar] [CrossRef]
- Lankford, W.M. Benchmarking: Understanding the basics. Coast. Bus. J. 2000, 1, 57–62. [Google Scholar]
- Hunt, D.V.L.; Rogers, C.D.F. A benchmarking system for domestic water use. Sustainability 2014, 6, 2993–3018. [Google Scholar] [CrossRef]
- Corton, M.L. Benchmarking in the Latin American water sector: The case of Peru. Util. Policy 2003, 11, 133–142. [Google Scholar] [CrossRef][Green Version]
- Chen, X.; Yang, S.H.; Yang, L.; Chen, X. A benchmarking model for household water consumption based on adaptive logic networks. Procedia Eng. 2015, 119, 1391–1398. [Google Scholar] [CrossRef]
- Gössling, S. New performance indicators for water management in tourism. Tour. Manag. 2015, 46, 233–244. [Google Scholar] [CrossRef]
- Styles, D.; Schoenberger, H.; Galvez-Martos, J.L. Water management in the European hospitality sector: Best practice, performance benchmarks and improvement potential. Tour. Manag. 2015, 46, 187–202. [Google Scholar] [CrossRef]
- Almeida, R.M.S.F.; Ramos, N.M.M.; Simões, M.L.; De Freitas, V.P. Energy and water consumption variability in school buildings: Review and application of clustering techniques. J. Perform. Constr. Facil. 2015, 29, 04014165. [Google Scholar] [CrossRef]
- Antunes, L.N.; Ghisi, E. Water and energy consumption in schools: Case studies in Brazil. Environ. Dev. Sustain. 2019, 22, 4225–4249. [Google Scholar] [CrossRef]
- Pedroso, L.P. Estudo das Variaveis Determinantes no Consumo de Agua em Escolas: O Caso das Unidades Municipais de Campinas, São Paulo [Study of the Determinants of Water Consumption in Schools: The Case of Municipal Units in Campinas, Sao Paulo]. Master’s Thesis, Faculdade de Engenharia Civil, Universidade Estadual de Campinas, Campinas, Brazil, November 2008. [Google Scholar]
- Vieira, P.; Jorge, C.; Covas, D. Assessment of household water use efficiency using performance indices. Resour. Conserv. Recycl. 2017, 116, 94–106. [Google Scholar] [CrossRef]
- De Melo, N.A.; Salla, M.R.; de Oliveira, F.R.G.; Frasson, V.M. Consumo de água e percepção dos usuários sobre o uso racional de água em escolas estaduais do Triângulo Mineiro [Water consumption and User Perception on rational water use in Triangulo Mineiro schools]. Cienc. Eng. Sci. Eng. J. 2014, 23, 1–9. [Google Scholar] [CrossRef]
- Morales, M.A.; Heaney, J.P. Classification, benchmarking, and hydroeconomic modeling of nonresidential water users. J. Am. Water Work. Assoc. 2014, 106, E550–E560. [Google Scholar] [CrossRef]
- Mui, K.W.; Wong, L.T.; Law, L.Y. Domestic water consumption benchmark development for Hong Kong. Build. Serv. Eng. Res. Technol. 2007, 28, 329–335. [Google Scholar] [CrossRef]
- Wong, L.T.; Mui, K.W. Epistemic water consumption benchmarks for residential buildings. Build. Environ. 2008, 43, 1031–1035. [Google Scholar] [CrossRef]
- Lara, R.A.; Pernigotto, G.; Cappelletti, F.; Romagnoni, P.; Gasparella, A. Energy audit of schools by means of cluster analysis. Energy Build. 2015, 95, 160–171. [Google Scholar] [CrossRef]
- ANA (Ed.) Conjuntura Recursos Hídricos Brasil; Agência Nacional de Águas: Brasilia, Brazil, 2018. [Google Scholar]
- Vanham, D. A holistic water balance of Austria—How does the quantitative proportion of urban water requirements relate to other users? Water Sci. Technol. 2012, 66, 549–555. [Google Scholar] [CrossRef]
- Duverge, J.J.; Rajagopalan, P.; Fuller, R.; Woo, J. Energy and water benchmarks for aquatic centres in Victoria, Australia. Energy Build. 2018, 177, 246–256. [Google Scholar] [CrossRef]
- Proença, L.C.; Ghisi, E. Water end-uses in Brazilian office buildings. Resour. Conserv. Recycl. 2010, 54, 489–500. [Google Scholar] [CrossRef]
- Dascalaki, E.G.; Sermpetzoglou, V.G. Energy performance and indoor environmental quality in Hellenic schools. Energy Build. 2011, 43, 718–727. [Google Scholar] [CrossRef]
- Desideri, U.; Proietti, S. Analysis of energy consumption in the high schools of a province in central Italy. Energy Build. 2002, 34, 1003–1016. [Google Scholar] [CrossRef]
- Filippín, C. Benchmarking the energy efficiency and greenhouse gases emissions of school buildings in central Argentina. Build. Environ. 2000, 35, 407–414. [Google Scholar] [CrossRef]
- Santamouris, M.; Mihalakakou, G.; Patargias, P.; Gaitani, N.; Sfakianaki, K.; Papaglastra, M.; Pavlou, C.; Doukas, P.; Primikiri, E.; Geros, V.; et al. Using intelligent clustering techniques to classify the energy performance of school buildings. Energy Build. 2007, 39, 45–51. [Google Scholar] [CrossRef]
- Ghisi, E.; Montibeller, A.; Schmidt, R.W. Potential for potable water savings by using rainwater: An analysis over 62 cities in southern Brazil. Build. Environ. 2006, 41, 204–210. [Google Scholar] [CrossRef]
- Morales, M.; Heaney, J. Benchmarking nonresidential water use efficiency using parcel-level data. J. Water Resour. Plan. Manag. 2016, 142, 04015064. [Google Scholar] [CrossRef]
- Zimmermann, M.; Althaus, H.-J.; Haas, A. Benchmarks for sustainable construction: A contribution to develop a standard. Energy Build. 2005, 37, 1147–1157. [Google Scholar] [CrossRef]
- Soares, S.R.; Souza, D.M.; Pereira, S.W. A avaliação do ciclo de vida no contexto da construção civil. [Life cycle assessment in the context of civil construction]. Colet. Habitare 2006, 7, 96–127. [Google Scholar]
- Cheng, C.L.; Hong, Y.T. Evaluating water utilization in primary schools. Build. Environ. 2004, 39, 837–845. [Google Scholar] [CrossRef]
- Ghajarkhosravi, M.; Huang, Y.; Fung, A.S.; Kumar, R.; Straka, V. Energy benchmarking analysis of multi-unit residential buildings (MURBs) in Toronto, Canada. J. Build. Eng. 2020, 27, 100981. [Google Scholar] [CrossRef]
- Duverge, J.J.; Rajagopalan, P.; Fuller, R. Defining aquatic centres for energy and water benchmarking purposes. Sustain. Cities Soc. 2017, 31, 51–61. [Google Scholar] [CrossRef]
- Chau, V.S. Benchmarking service quality in UK electricity distribution networks. Benchmarking 2009, 16, 47–69. [Google Scholar] [CrossRef][Green Version]
- Ilha, M.S.O.; Oliveira, L.H.; Gonçalves, O.M. Environmental assessment of residential buildings with an emphasis on water conservation. Build. Serv. Eng. Res. Technol. 2009, 30, 15–26. [Google Scholar] [CrossRef]
- Pérez-Lombard, L.; Ortiz, J.; González, R.; Maestre, I.R. A review of benchmarking, rating and labelling concepts within the framework of building energy certification schemes. Energy Build. 2009, 41, 272–278. [Google Scholar] [CrossRef]
- Dai, J.; Wu, S.; Han, G.; Weinberg, J.; Xie, X.; Wu, X.; Song, X.; Jia, B.; Xue, W.; Yang, Q. Water-energy nexus: A review of methods and tools for macro-assessment. Appl. Energy 2018, 210, 393–408. [Google Scholar] [CrossRef]
- Capozzoli, A.; Piscitelli, M.S.; Neri, F.; Grassi, D.; Serale, G. A novel methodology for energy performance benchmarking of buildings by means of linear mixed effect model: The case of space and DHW heating of out-patient Healthcare Centres. Appl. Energy 2016, 171, 592–607. [Google Scholar] [CrossRef]
- Zhao, H.X.; Magoulès, F. A review on the prediction of building energy consumption. Renew. Sustain. Energy Rev. 2012, 16, 3586–3592. [Google Scholar] [CrossRef]
- Bohdanowicz, P.; Martinac, I. Determinants and benchmarking of resource consumption in hotels—Case study of Hilton International and Scandic in Europe. Energy Build. 2007, 39, 82–95. [Google Scholar] [CrossRef]
- Bernardo, H.; Antunes, C.H.; Gaspar, A. Exploring the use of indicators for benchmarking the energy performance of Portuguese secondary schools. In Proceedings of the Energy for Sustainability 2015 Sustainable Cities: Designing for People and the Planet, Coimbra, Portugal, 14–15 May 2015; pp. 1–8. [Google Scholar]
- Fehr, M.; Andrade, V.S.C.S. Search for objective environmental performance indicators of primary schools. Benchmarking 2016, 23, 1922–1936. [Google Scholar] [CrossRef]
- Ywashima, L.A. Avaliação do Uso de Água em Edifícios Escolares Públicos e Análise de Viabilidade Econômica da Instalação de Tecnologias Economizadoras nos Pontos de Consumo. [Assessment of Water Use in Public School Buildings and Analysis of Economic Feasibility of Installing Water-Saving Technologies at Consumption Points]. Master’s Thesis, Faculdade de Engenharia Civil, Universidade Estadual de Campinas, Campinas, Brazil, 2005. [Google Scholar]
- Marinoski, A.K.; Vieira, A.S.; Silva, A.S.; Ghisi, E. Water end-uses in low-income houses in Southern Brazil. Water 2014, 6, 1985–1999. [Google Scholar] [CrossRef]
- Sharp, T. Energy benchmarking in commercial office buildings. ACEEE Summer Study Energy Effic. Build. 1995, 4, 321–329. [Google Scholar]
- Papadopoulos, S.; Kontokosta, C.E. Grading buildings on energy performance using city benchmarking data. Appl. Energy 2019, 233–234, 244–253. [Google Scholar] [CrossRef]
- Chung, W.; Hui, Y.V.; Lam, Y.M. Benchmarking the energy efficiency of commercial buildings. Appl. Energy 2006, 83, 1–14. [Google Scholar] [CrossRef]
- Energy Star® Performance Ratings Technical Methodology; Environmental Protection Agency, EPA: Washington, DC, USA, 2011.
- Li, Z.; Han, Y.; Xu, P. Methods for benchmarking building energy consumption against its past or intended performance: An overview. Appl. Energy 2014, 124, 325–334. [Google Scholar] [CrossRef]
- Nair, S.; Hashim, H.; Hannon, L.; Clifford, E. End use level water and energy interactions: A large non-residential building case study. Water 2018, 10, 810. [Google Scholar] [CrossRef]
- Masia, T.; Kajimo-Shakantu, K.; Opawole, A. A case study on the implementation of green building construction in Gauteng province, South Africa. Manag. Environ. Qual. Int. J. 2020, 31, 602–623. [Google Scholar] [CrossRef]
- Li, H.; Hong, T.; Lee, S.H.; Sofos, M. System-level key performance indicators for building performance evaluation. Energy Build. 2020, 209, 109703. [Google Scholar] [CrossRef]
- Cobacho, R.; Arregui, F.; Gascón, L.; Cabrera, E. Low-flow devices in Spain: How efficient are they in fact? An accurate way of calculation. Water Sci. Technol. Water Supply 2004, 4, 91–102. [Google Scholar] [CrossRef]
- Teston, A.; Geraldi, M.S.; Colasio, B.M.; Ghisi, E. Rainwater harvesting in buildings in Brazil: A literature review. Water 2018, 10, 471. [Google Scholar] [CrossRef]
- DCLG. Code for Sustainable Homes: Technical Guide November 2010, 1st ed.; Department for Communities and Local Government, DCLG: London, UK, 2010; ISBN 9781859463314. [Google Scholar]
- Dias, T.F.; Kalbusch, A.; Henning, E. Factors influencing water consumption in buildings in southern Brazil. J. Clean. Prod. 2018, 184, 160–167. [Google Scholar] [CrossRef]
- Garcia, J.; Salfer, L.R.; Kalbusch, A.; Henning, E. Identifying the drivers of water consumption in single-family households in Joinville, Southern Brazil. Water 2019, 11, 1990. [Google Scholar] [CrossRef]
- Ghajarkhosravi, M.; Huang, Y.; Fung, A.S.; Kumar, R.; Straka, V. Benchmarking of water consumption and waste management in multi-unit residential buildings (MURBs) in Toronto. Can. J. Civ. Eng. 2021, 48, 628–641. [Google Scholar] [CrossRef]
- Alghamdi, A.; Hu, G.; Haider, H.; Hewage, K.; Sadiq, R. Benchmarking of water, energy, and carbon flows in academic buildings: A fuzzy clustering approach. Sustainability 2020, 12, 4422. [Google Scholar] [CrossRef]
- Alkaya, E.; Demirer, G.N. Reducing water and energy consumption in chemical industry by sustainable production approach: A pilot study for polyethylene terephthalate production. J. Clean. Prod. 2015, 99, 119–128. [Google Scholar] [CrossRef]
- Tortella, B.D.; Tirado, D. Hotel water consumption at a seasonal mass tourist destination. The case of the island of Mallorca. J. Environ. Manag. 2011, 92, 2568–2579. [Google Scholar] [CrossRef] [PubMed]
- Charara, N.; Cashman, A.; Bonnell, R.; Gehr, R. Water use efficiency in the hotel sector of barbados. J. Sustain. Tour. 2011, 19, 231–245. [Google Scholar] [CrossRef]
- Bint, L.E.E.; Isaacs, N.; Vale, R. Water Performance Benchmarks for New Zealand: An Approach to Understanding Water Consumption in Commercial Office Buildings; Victoria University of Wellington: Wellington, New Zealand, 2010; pp. 1–11. [Google Scholar]
- Corgnati, S.P.; Corrado, V.; Filippi, M. A method for heating consumption assessment in existing buildings: A field survey concerning 120 Italian schools. Energy Build. 2008, 40, 801–809. [Google Scholar] [CrossRef]
- Hernandez, P.; Burke, K.; Lewis, J.O. Development of energy performance benchmarks and building energy ratings for non-domestic buildings: An example for Irish primary schools. Energy Build. 2008, 40, 249–254. [Google Scholar] [CrossRef]
- Alghamdi, A.; Haider, H.; Hewage, K.; Sadiq, R. Inter-university sustainability benchmarking for Canadian higher education institutions: Water, energy, and carbon flows for technical-level decision-making. Sustainability 2019, 11, 2599–2625. [Google Scholar] [CrossRef]
- Dubois, D.; Prade, H. What are fuzzy rules and how to use them. Fuzzy Sets Syst. 1996, 84, 169–185. [Google Scholar] [CrossRef]
- Keating, T.; Lawson, R. The Water Efficiency of Retrofit Dual Flush Toilets, 1st ed.; Southern Water, A Scottish Power Company: Bristol, UK, 2000. [Google Scholar]
- De Oliveira, F.R.G. Consumo de Água e Percepção dos Usuários Para o Uso Racional de Água em Escolas Estaduais de Minas Gerais. [Water Consumption and Users’ Perception of Rational Water Use in State Schools in Minas Gerais]. Master’s Thesis, Faculdade de Engenharia Civil, Universidade Federal de Uberlândia, Uberlândia, Brazil, August 2013. [Google Scholar]
- De Moraes, J.F.S.; Nunes, L.G.C.F.; da Silva, S.R. Estudo de percepções e avaliações do consumo de água em escolas públicas do Recife. [Study of perceptions and assessments of water consumption in public schools in Recife]. Holos Environ. 2019, 19, 116–130. [Google Scholar] [CrossRef]
- Da Silva, S.R.; de Araújo, A.R.B.; da Fonseca, J.M.M.; Nunes, L.G.C.F. Indicadores de uso racional da água em uma escola técnica estadual da cidade de Recife-PE. [Indicators of rational use of water in a state technical school in the city of Recife-PE]. Rev. Gestão Sustentabilidade Ambient. 2018, 7, 381–396. [Google Scholar] [CrossRef][Green Version]
- UNICEF. Drinking Water, Sanitation and Hygiene in Schools: Global Baseline Report 2018; United Nations Children’s Fund (UNICEF) and World Health Organization: New York, NY, USA, 2018. [Google Scholar]


Publisher’s Note: MDPI stays neutral with regard to jurisdictional claims in published maps and institutional affiliations. |
© 2022 by the authors. Licensee MDPI, Basel, Switzerland. This article is an open access article distributed under the terms and conditions of the Creative Commons Attribution (CC BY) license (https://creativecommons.org/licenses/by/4.0/).