Article

Assessment of Spatio-Temporal Variability of Faecal Pollution along Coastal Waters during and after Rainfall Events

by
Elena Manini
1,*,
Elisa Baldrighi
1,
Fabio Ricci
2,3,
Federica Grilli
1,
Donato Giovannelli
1,4,5,6,
Michele Intoccia
4,
Silvia Casabianca
2,3,
Samuela Capellacci
2,3,
Nadia Marinchel
2,3,
Pierluigi Penna
1,
Fabrizio Moro
1,
Alessandra Campanelli
1,
Angelina Cordone
4,
Monica Correggia
4,
Deborah Bastoni
4,
Luigi Bolognini
7,
Mauro Marini
1,3 and
Antonella Penna
2,3,*
1
Institute for Biological Resources and Marine Biotechnologies—IRBIM, National Research Council—CNR, 60125 Ancona, Italy
2
Department of Biomolecular Sciences, DISB, University of Urbino, 60129 Urbino, Italy
3
Fano Marine Center, The Inter-Institute Center for Research on Marine Biodiversity, Resources and Biotechnologies, 61032 Fano, Italy
4
Department of Biology, University of Naples Federico II, 80126 Naples, Italy
5
Marine Chemistry & Geochemistry Department, Woods Hole Oceanographic Institution, Falmouth, MA 02543, USA
6
Earth-Life Science Institute, Tokyo Institute of Technology, Tokyo 145-0061, Japan
7
Department Territory and Environment, Marche Region, 60125 Ancona, Italy
*
Authors to whom correspondence should be addressed.
Water 2022, 14(3), 502; https://doi.org/10.3390/w14030502
Submission received: 3 January 2022 / Revised: 31 January 2022 / Accepted: 3 February 2022 / Published: 8 February 2022

Abstract

:
More than 80% of wastewaters are discharged into rivers or seas, with a negative impact on water quality along the coast due to the presence of potential pathogens of faecal origin. Escherichia coli and enterococci are important indicators to assess, monitor, and predict microbial water quality in natural ecosystems. During rainfall events, the amount of wastewater delivered to rivers and coastal systems is increased dramatically. This study implements measures capable of monitoring the pathways of wastewater discharge to rivers and the transport of faecal bacteria to the coastal area during and following extreme rainfall events. Spatio-temporal variability of faecal microorganisms and their relationship with environmental variables and sewage outflow in an area located in the western Adriatic coast (Fano, Italy) was monitored. The daily monitoring during the rainy events was carried out for two summer seasons, for a total of five sampling periods. These results highlight that faecal microbial contaminations were related to rainy events with a high flow of wastewater, with recovery times for the microbiological indicators varying between 24 and 72 h and influenced by a dynamic dispersion. The positive correlation between ammonium and faecal bacteria at the Arzilla River and the consequences in seawater can provide a theoretical basis for controlling ammonium levels in rivers as a proxy to monitor the potential risk of bathing waters pathogen pollution.

1. Introduction

Faecal pollution of coastal waters around the world impairs water quality and poses a serious health threat by promoting the spread of infectious diseases among humans and marine organisms [1]. A variety of pathways and sources—especially sewer overflows, drainage of stormwater, runoff from farmed and urban areas, leaking of septic systems and sewerage lines—can result in the contamination of coastal and bathing waters with faecal bacteria [2,3]. Monitoring faecal pollution together with various environmental parameters is essential to understand the environmental fate of faecal bacteria and to identify the reservoirs and hotspots that promote the spread of faecal bacteria across the coastal areas, potentially contributing to the prevention or mitigation of their spread to the ocean [4].
In many urbanised areas, domestic wastewaters and rainwater, so-called urban wastewater [4], are collected and conveyed to the wastewater treatment plant by the same network, known as a combined sewer system (CSS). Combined sewer overflows (CSOs) may occur in the case of intense rainfall events [5,6], resulting in a higher water flow rate within the sewer network due to the consistent contribution of surface runoff and rainfall. Surface runoff conveyed to the public sewer system may contain suspended solids, nutrients, microorganisms, heavy metals, or other types of pollutants depending on rain event magnitude and duration [7]. Microbial pollution of marine environments is strictly related to the discharge of urban wastewater along coastal areas [8]. Intense human activities and urbanisation of coastal areas have exacerbated the problem together with the increased frequency of heavy rain events also related to climate changes [9].
The ongoing climate crisis is the driver of risk to human and marine biota health, threatening coastal regions and their sustainable economic development. In this context, intense episodic rainfall events represent an increasingly important threat to the integrity of coastal systems, with hydrographic basins showing altered flow regimes that affect coastal ecosystem processes. Rivers are potential major contributors to the contamination of coastal waters because they receive various pollutants from lands, urbanised areas, industrial and agricultural activities located along their courses [10,11]. This issue is of great concern for water quality control authorities, and it can lead to a restriction in the use and destination of the receiving surface body, and consequently to negative economic impacts, such as the closure of bathing areas [12,13], restrictions to the consumption of fish and shellfish [14], and contamination of drinking water resources [15].
Coastal water quality is monitored throughout the world for faecal pollution using faecal indicator bacteria. The most widely used are Escherichia coli and enterococci [16]. In the EU, the provisions regulating bathing water quality involve monitoring E. coli and intestinal enterococci (Bathing Water Directive, BWD, 2006/7/EC) in rivers and along the coasts. Their origins are from human faeces and organic waste in the sewage, as well as animal faeces in the runoff and disposed of in the water bodies without any sanitation systems [7,17]. Each EU nation defines threshold levels for E. coli and intestinal enterococci concentrations to prevent the health risks associated with bathing in faecal contaminated seawater and freshwaters. The Bathing Water Directive establishes the guidelines for bathing waters monitoring (good quality: 500* and 200* CFU/100ml, for E. coli and intestinal enterococci, respectively * based upon a 95-percentile evaluation).
The increasing human activities along coastal areas, especially in surrounding semi-enclosed basins, such as the Adriatic Sea, make them ideal hotspots for microbial pollution, producing strong environmental impacts along the coasts on popular bathing locations and touristic towns [18,19,20].
Microbial pollution and its effects have been mitigated along the European Mediterranean coasts through expensive implementations of large urban wastewater treatment plants to reduce the pollutant loads to the sea. However, these actions cannot face the effects of the short-term disturbances induced by the release of untreated CSOs during episodic heavy rain events. In Italy, only a few Regions have established guidelines for the management of rainwater during CSOs [6]. Coastline protection and integrated management of water quality are priority objectives of environmental policies in Europe, as ratified in the Water Framework Directive 2000/60/EC, and they are included between the 17 Sustainable Development Goals of the ONU (Organisation of the United Nations) 2030 Agenda [21]. In the Marche Region (Central Adriatic Sea, Italy), the quality of bathing waters remains a crucial issue from an environmental and economic point of view. The region’s coast is 173 km long and is relatively flat and straight, with shallow bathymetry dominated by sand and gravel [22,23]. Every time that a massive rainy event occurs, all recreational activities along beaches are regularly forbidden, with frequent closures of bathing areas due to the risk of microbial contamination (ARPA-Regional Agency for Environmental Protection; Regional Council Deliberation-DGR 419-2021). Nutrients associated with bacterial load in sewage out-flow and river discharge into the seawaters can be indicators of domestic, agricultural or zoonotic origin [24]. As part of the water framework directive (WFD), which aims to improve the ecological and chemical quality of European waters, ammonium, oxidised nitrogen compounds, and phosphorus concentrations are monitored in rivers and streams (European Commission-EC, 2000). Several studies have identified strong correlations between ammonium, its oxidised derivatives (nitrites and nitrates) and phosphates with faecal indicator bacteria [25,26]. Generally, the nutrients do not have faecal origins, but they can provide a signal of faecal pollution and its origin, such as human or zoonotic from inland within the catchment, and this can help to assess the water quality from faecal pollution.
The present study was carried out during two bathing seasons of 2019 and 2020, which were characterised by different and conspicuous rainy events in the area. The aims of the study were: (i) to assess the levels of faecal pollution and its spatial-temporal variability along a coastal area affected by freshwater discharged linked to strong storm rainfall events; (ii) to explore the potential relationships between the abundance and distribution of bacteria as faecal indicators and the main environmental variables; and (iii) to identify the potential processes to control the decay/persistence of coastal faecal contamination during river flow events. This study is part of the EU CBC-Interreg Italy–Croatia Project WATERCARE, which aims at reducing the impact of microbial environmental contamination on the Adriatic bathing waters due to heavy rainfall events, enhancing the quality of local waters; and providing support for the decision-making process regarding the management of bathing water. All the microbial and environmental data analysed were used to implement the Water Quality Integrated System (WQIS) proposed in the WATERCARE Project [27]. By understanding the dynamics associated with microbial contamination and environmental variables, it will be possible for managers and policymakers to develop more reliable sampling strategies and attenuation measures in order to avoid bathing area closures for unnecessary periods of time as often it occurs [13,28].

2. Materials and Methods

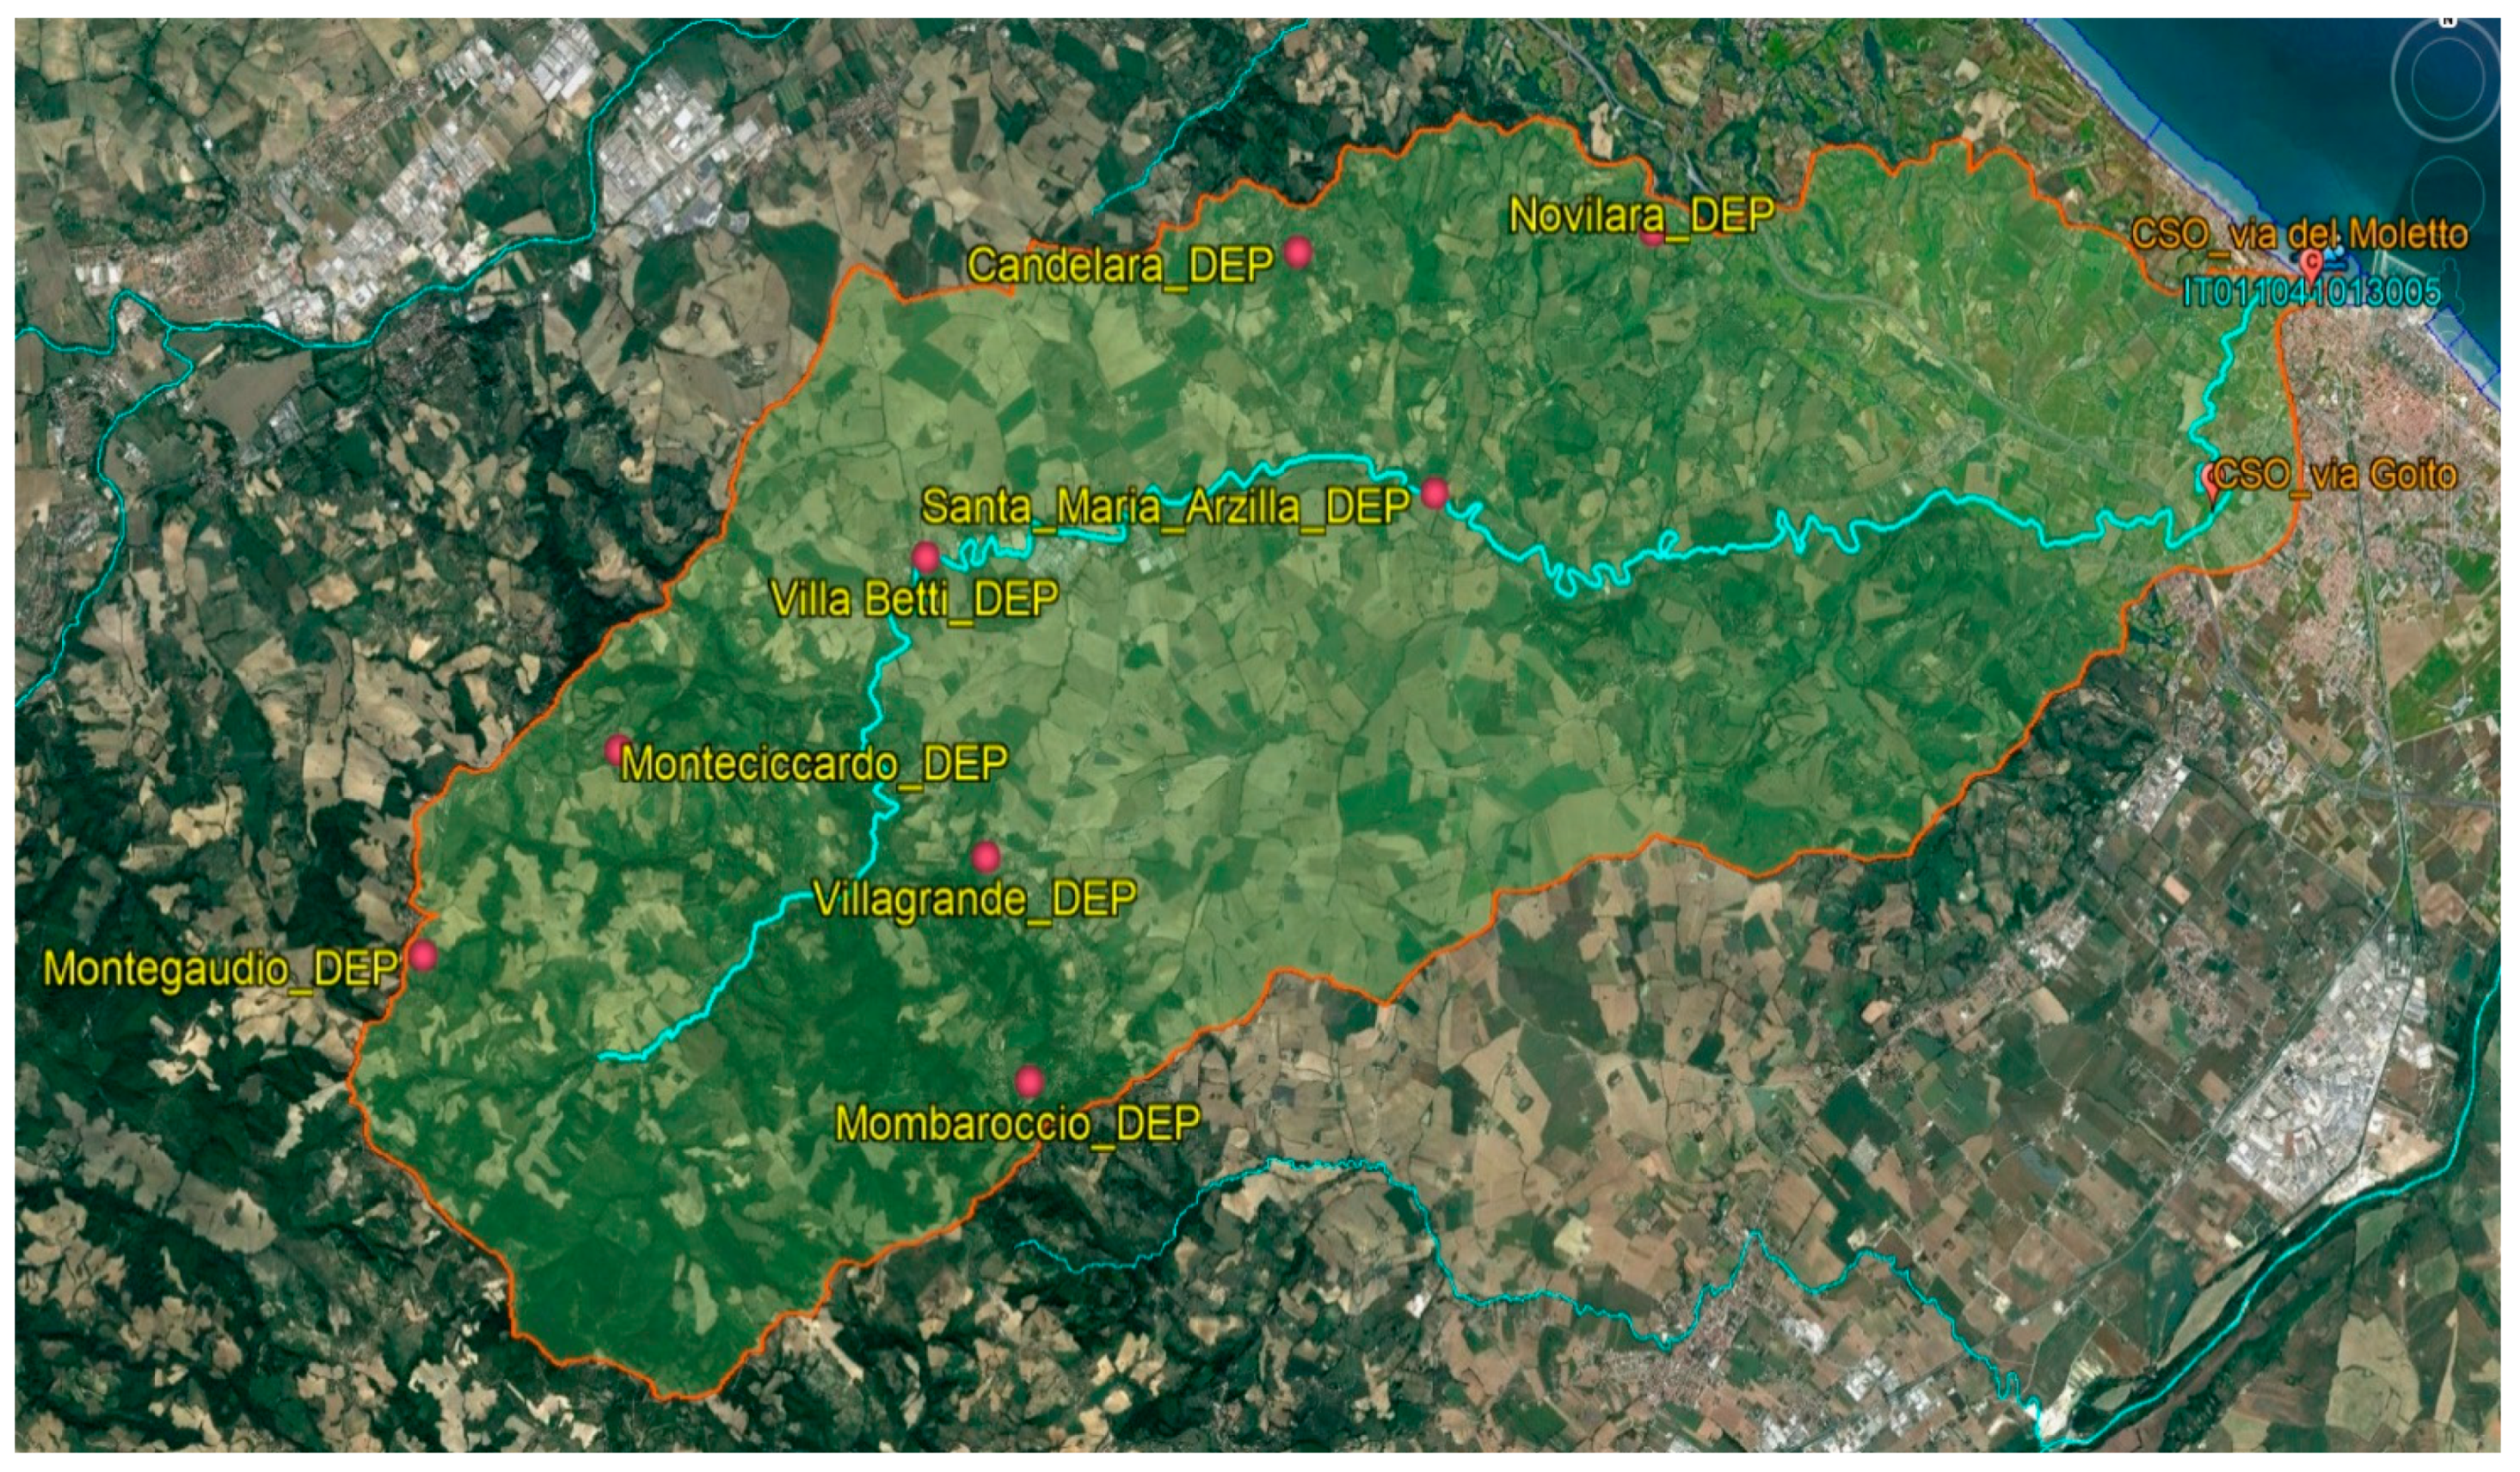
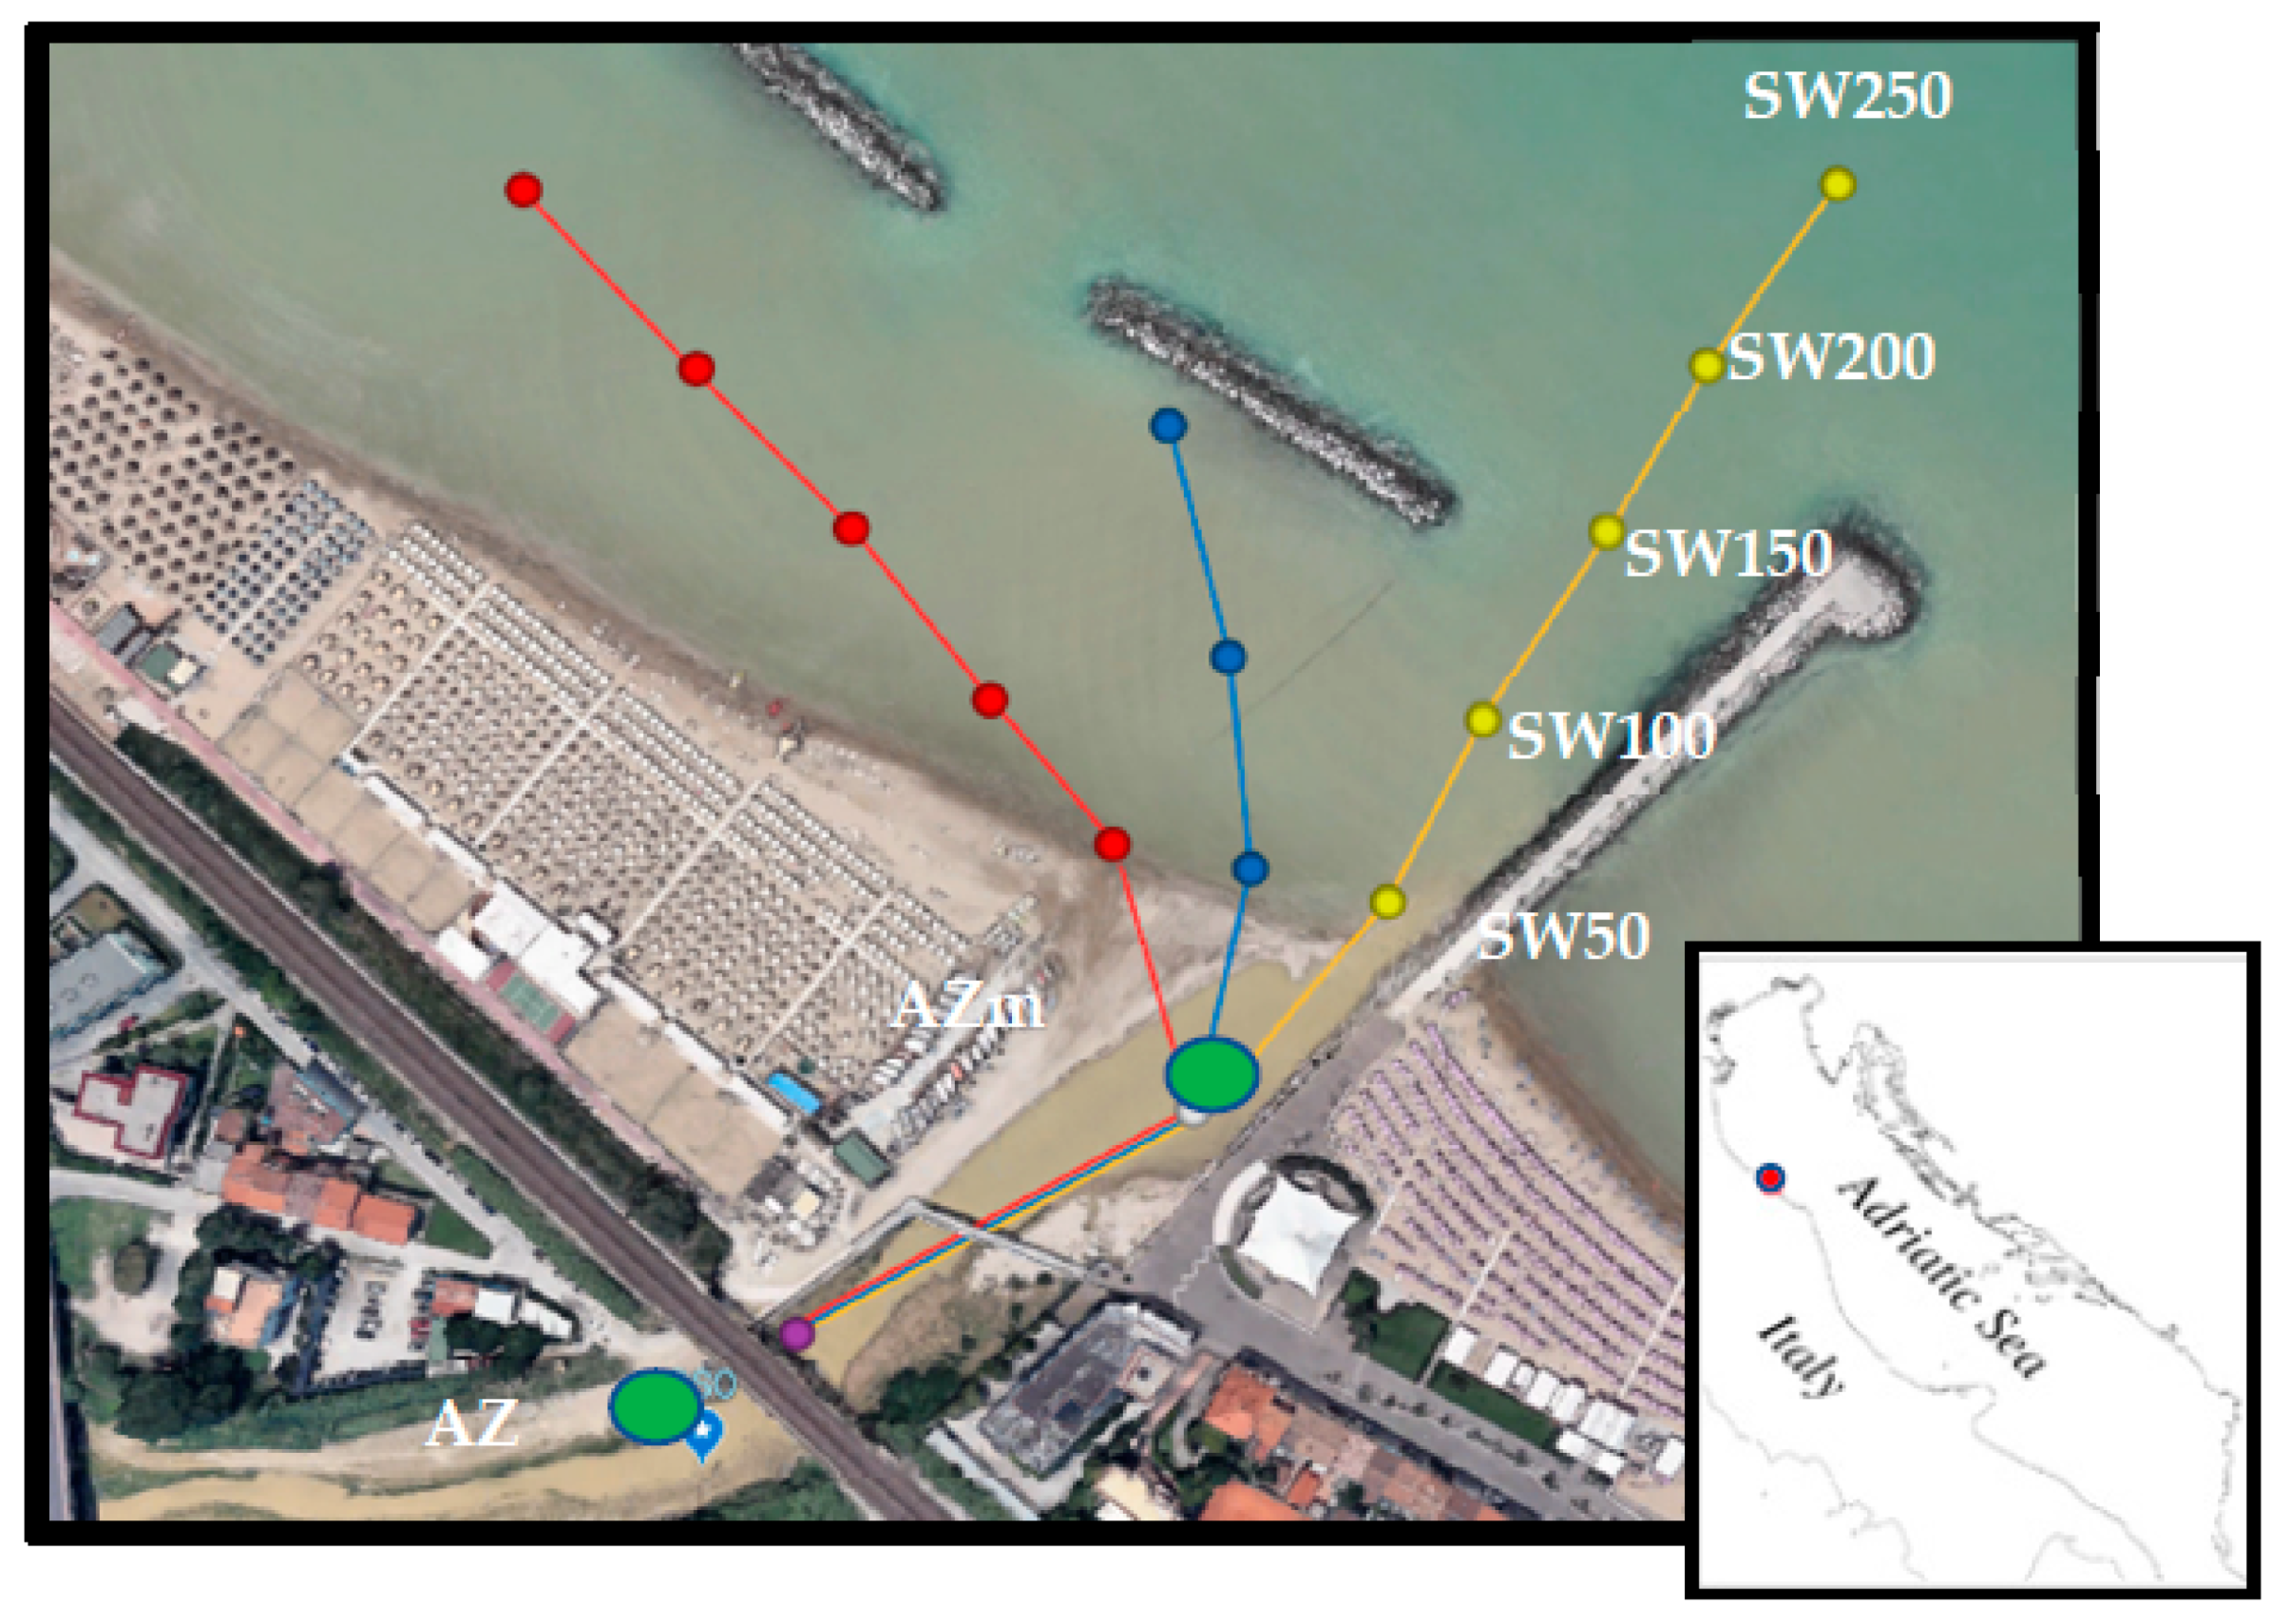
2.1. Study Area and Sampling Strategy

The study area is located in the Arzilla River along the bathing waters in front of Fano city (Marche Region, north-western Adriatic Sea). This area has been selected as a pilot site since this site shows the typical characteristic of a highly urbanised city overlooking the Adriatic Sea with a touristic marina located near the river mouth and the coast of the city characterised by several artificial protections against beach erosion. The Arzilla River collects sewages from inland and Fano CSO and discharges them into the sea, near one of the most popular beaches during the summer season. Heavy rainfall often causes the overflow of the local sewage network that collects the sewage load from Fano city [13]. Every time that a sewer outflow occurs, the bathing activity in the city is closed based on the potential risk for faecal microbial contamination [27]. Figure 1 shows the Arzilla River hydrographic basin, where all the water purification installations from urban centres, the CSOs and the bathing waters are placed. During intense rainfall, there is the potential for the CSOs and purification systems to be unable to retain all the rainwater. Therefore, a greater bacterial load flows into the Arzilla River.
For the purpose of this work, two bathing seasons were considered from May to September 2019 and 2020, during which freshwater and seawater samples were collected. Freshwater samples from the Arzilla River were collected over a time scale interval of 30 min during the rainfall events and every 6, 12 or 24 h after the rainfall events using an autosampler located at the Arzilla mouth. Samples were collected for the determination of faecal bacteria, dissolved inorganic nutrients (ammonia-NH4, nitrite-NO2, nitrate-NO3, total nitrogen, total phosphorus), total suspended matter (TSM) and chlorophyll-a (Chl-a) content characterising the freshwater body that flowed into the sea. At the end of each rainy event, surface seawater samples were manually collected with sterilised bottles in front of the Arzilla mouth, within 250 m from the coastline, for comparable chemical and microbiological analyses. The spatial sampling scale followed a grid composed of three transects (Transects 1, 2 and 3) along with a sampling site in the Arzilla mouth (Figure 2). Each transect includes sites at 50, 100, 150, 200 and 250 m from coastline; Transect 2 has only three sampling sites (i.e., 50, 100 and 150 m). This small spatial scale sampling strategy was adopted following the coastal morphology, bathymetry of the area, water currents and the presence of artificial barriers that influence the microbial dispersion. At each site, temperature (°C), salinity, pressure, density (στ), oxygen concentration and saturation, pH, redox and Chl-a were measured using a CTD multiparametric probe (Idronaut model Ocean Seven 316 Plus).

2.2. Environmental Variable Analysis

Samples for nutrient analysis were filtered (nitrocellulose Millipore, 0.45 μm) and stored at −20 °C in polyethylene bottles until analysis, whereas water samples for TSM (total suspended matter) and Chl-a were filtered on pre-combusted and pre-weighed GF/F Whatman, 0.7 μm and nitrocellulose Millipore, 0.45 μm filters, respectively, and immediately processed. Nutrient concentrations were measured using a UV-1700 Shimadzu model following [29]. TN (Total nitrogen) and TP (total phosphorous) were determined on unfiltered water samples according to the method of [1]. Accuracy was ±0.02 μmol L−1 for N-NH4, N-NO2, N-NO3, TN, TP. A calibration curve was made with 5 levels of Merck standards, and the accuracy was tested using a standard as the sample. The precision was tested on 10 replicates of the standard and was: ±0.001 μmol L−1 (N-NH4), ±0.006 μmol L−1 (N-NO2), ±0.005 μmol L−1 (N-NO3). Chl-a concentration was determined in 90% acetone homogenates of particulate matter collected on filters described above. The Chl-a was analysed spectrophotometrically (UV-1700, Shimadzu, Duisburg, Japan) according to the method described by [30]. TSM concentrations were determined gravimetrically by filtration of a known volume of water sample through 0.7 μm GF/F membrane filters (Millipore, Bedford, MA, USA) following [30]. The precision estimated on 5 replicates by a coefficient of variation (CV) being lower than 5%. For PIM (particulate inorganic matter) and POM (particulate organic matter) determination, the GF/F filters were then ashed at 500 °C for 1 h following the APHA (American Public Health Association) Loss on Ignition (LOI) method [30]. POM concentrations were calculated by the difference between TSM and PIM.

2.3. Microbiological Analysis

Samples for microbiological analyses of faecal contamination (Escherichia coli and intestinal enterococci) were immediately transported to the laboratory at in situ temperature in the dark and processed within a few hours after collection. E. coli and enterococci were analysed using culture-based methods. E. coli abundance was assessed by membrane filtration [4]. An appropriate volume of water (1 to 100 mL) was vacuum-filtered (pore size 0.22 μm, diameter 47 mm; Millipore) in triplicate, and the filters were placed on m-FC agar plates and were incubated at 44.5 °C for 24 h. Only blue colonies were considered. Their abundance was reported as CFU (colony-forming units) per 100 mL of water (100 mL−1). Enterococci abundance samples were assessed by membrane filtration, and an appropriate volume (from 1 to 100 mL) was filtered in triplicate as described above, and filters were placed on Slanetz Bartley agar plates. Plates were incubated at 37.5 °C for 48 h. Only red or reddish-brown colonies were considered as presumptive enterococci. Their abundance was reported as CFU 100 mL−1 of water filtered.

2.4. Statistical Analysis

Spearman rank correlation analysis was performed to test relationships between the abundance of E. coli and intestinal enterococci in the river and seawater and between rain and faecal bacteria in the river. Correlation coefficients (r) were considered significant at p-values < 0.05. Differences in the abundance of faecal indicator bacteria between river and seawater were tested using a one-way analysis of variance (ANOVA). Multivariate multiple regression analysis was performed to explore the relationships between environmental and microbial data using distance-based linear modelling (DistLM). This procedure was applied on faecal indicator bacteria dataset (i.e., considering all events and for each event separately) and included the main environmental variables (temperature, salinity, pH, redox potential, dissolved oxygen, total nitrogen, total phosphate, orthophosphate, chlorophyll-a, ammonium, nitrates, nitrites, total suspended matter) as predictor variables. One-way ANOVA was performed using the statistical R-software (version 4.0.5); DistLM analysis was performed using the routines included in the software PRIMER v6 and PERMANOVA+ [31]. Data were expressed as mean ± standard error (SE).

3. Results

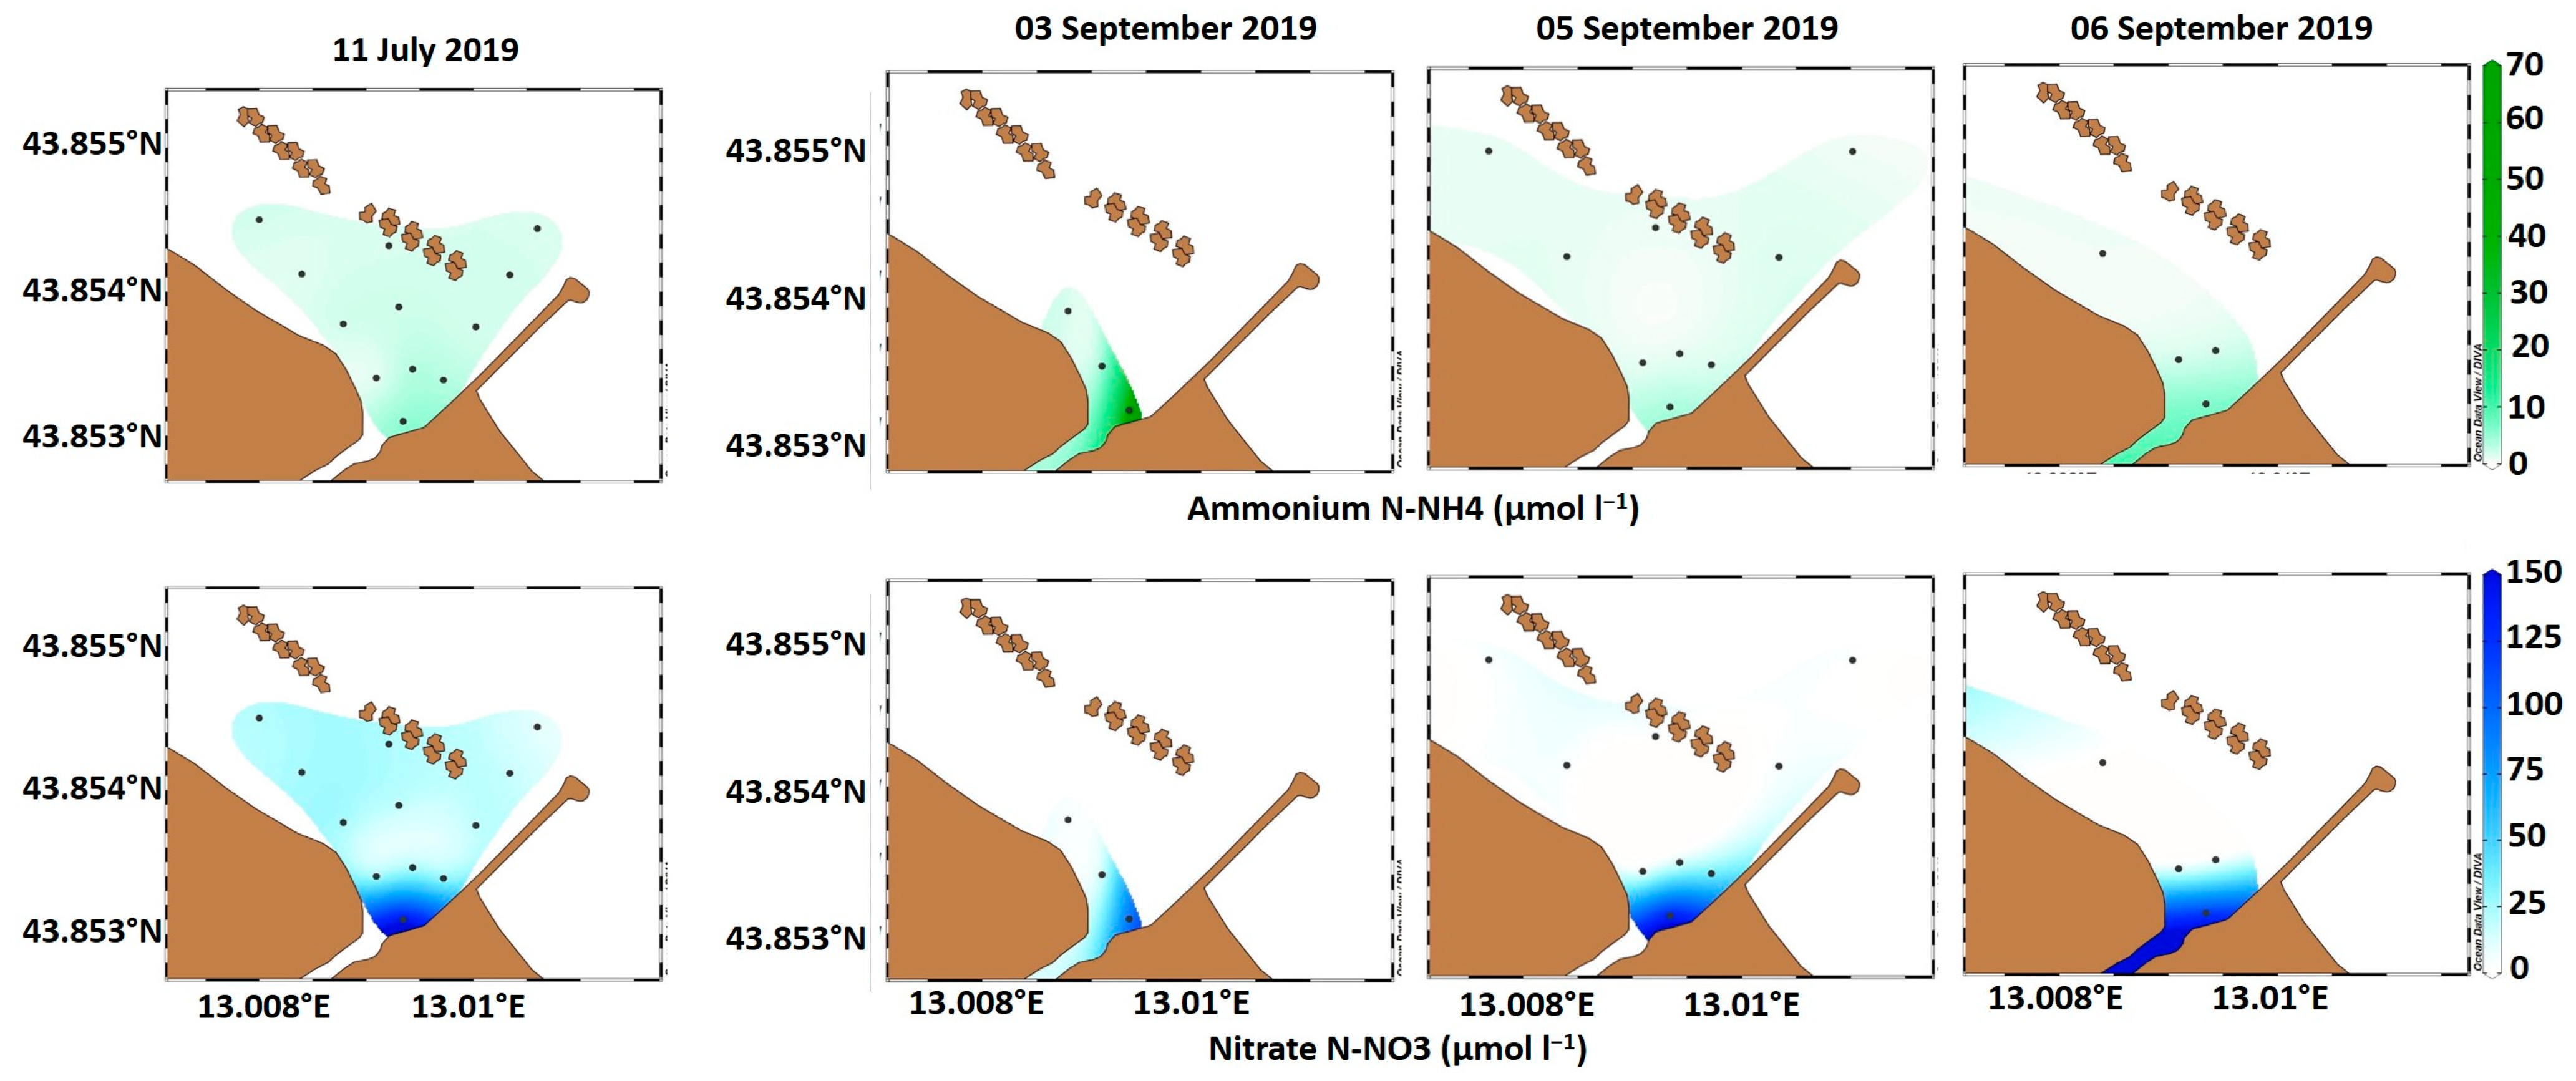
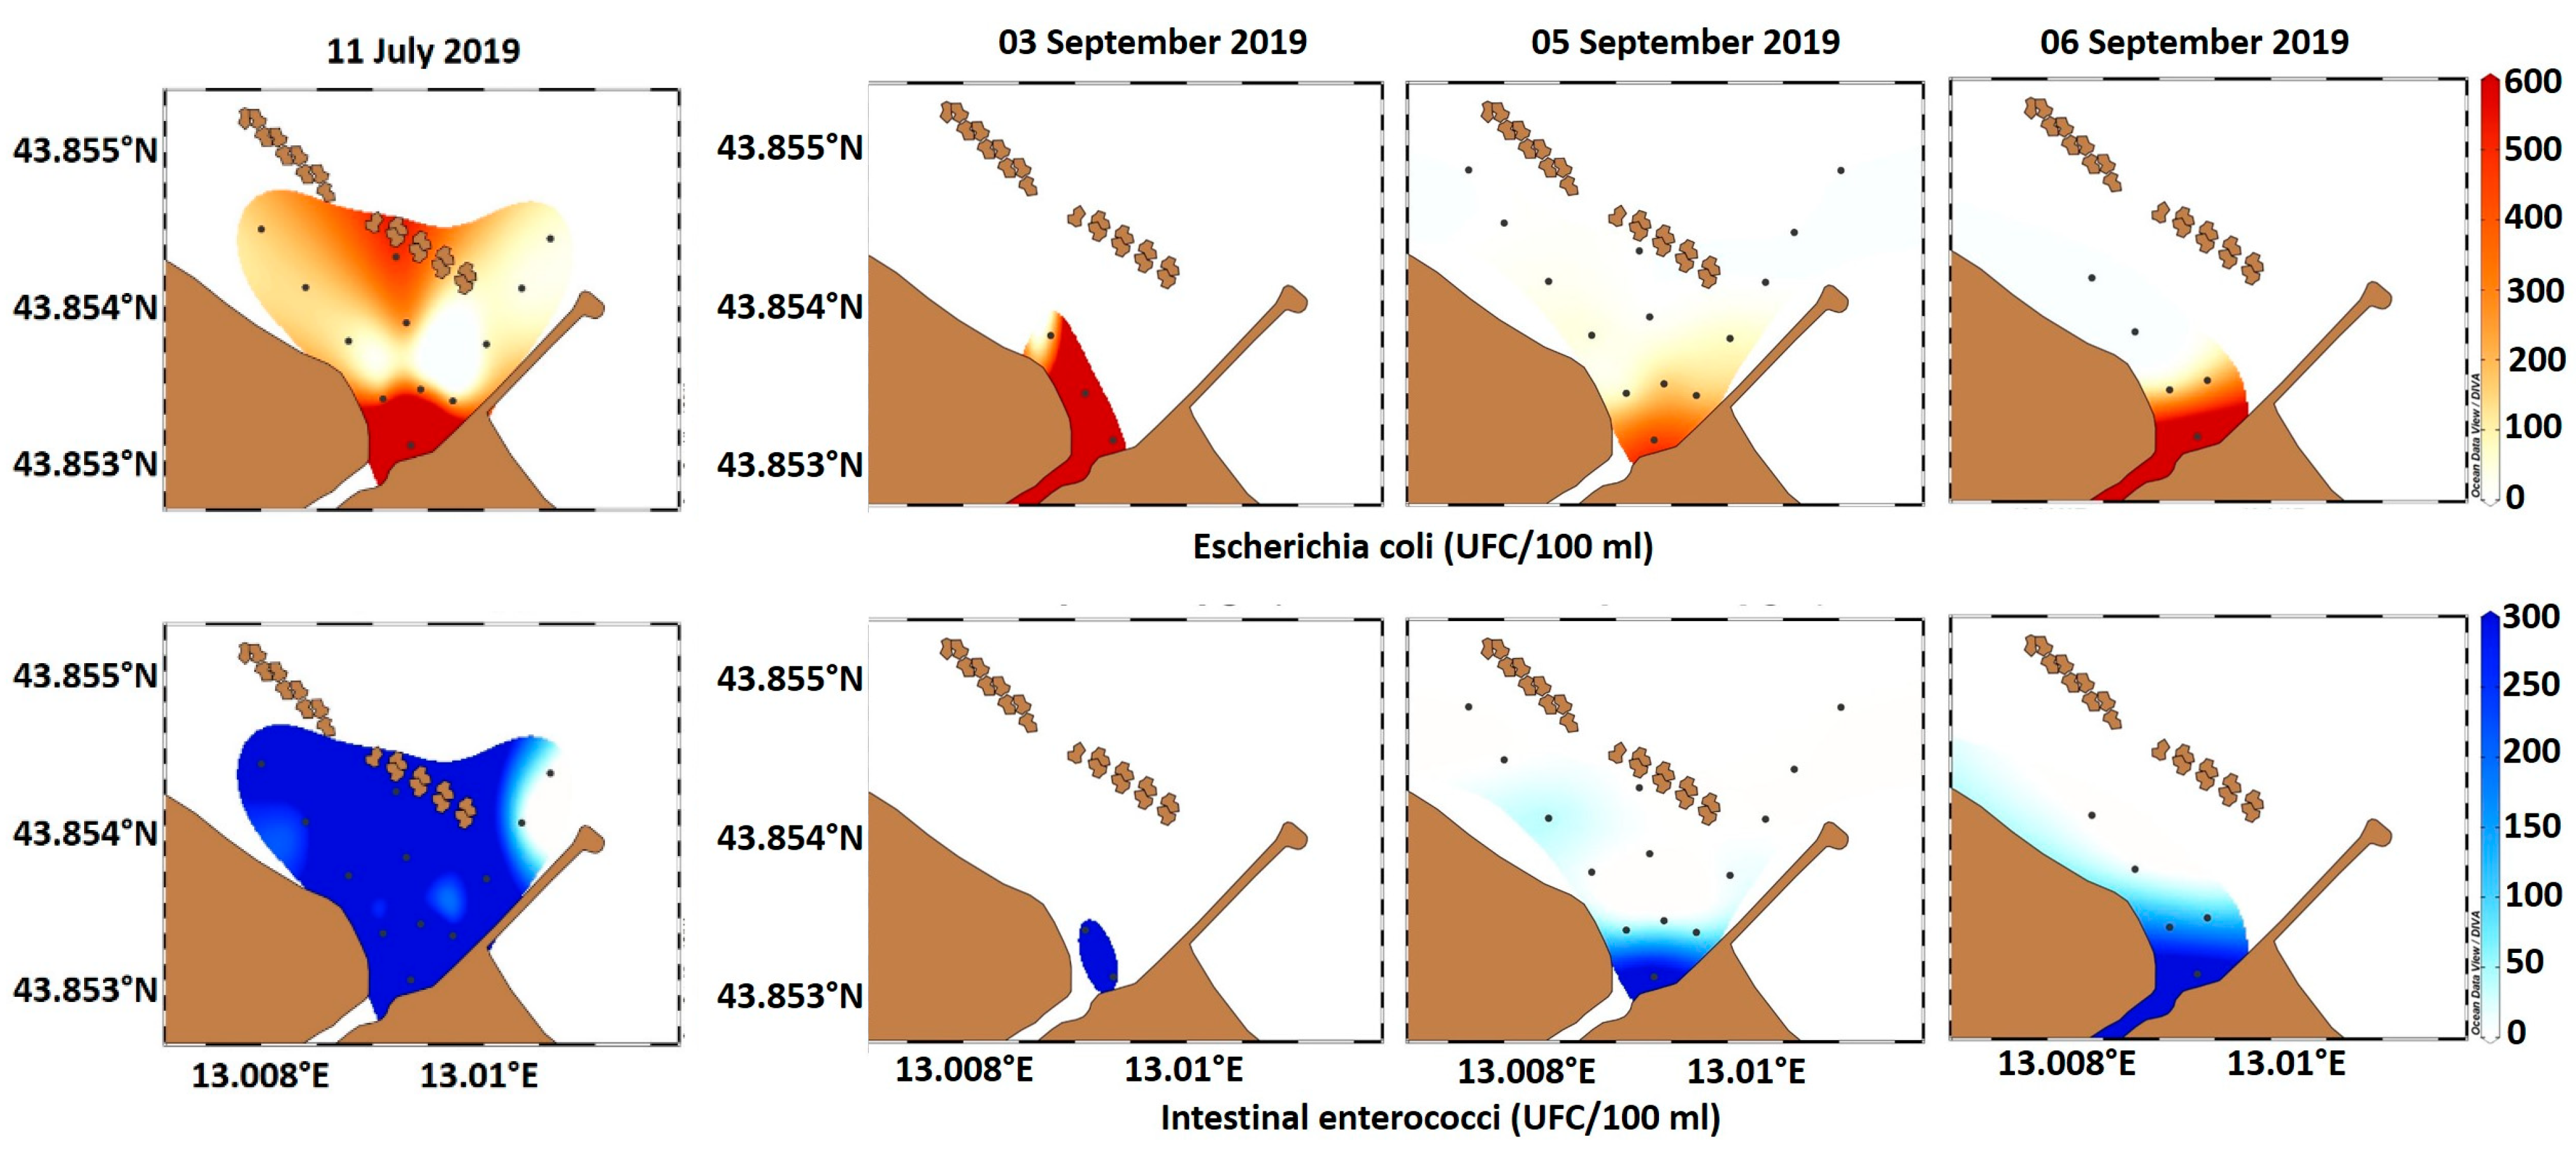
Spatial and Temporal Variability of the Environmental Parameters and Faecal Bacteria Distribution in the Arzilla River and Bathing Water

We analysed the spatial and temporal variability of faecal bacteria distribution, along with the main environmental parameters positively correlated with faecal bacteria, in two sampling areas: Arzilla River (AZ) and seawater (SW). We considered different conditions of heavy precipitations, followed by an increase in the river level or activation of the CSO. The daily monitoring during the rainy events was carried out in two bathing seasons for a total of five sampling activities (July and September 2019; July, August, and September 2020).
A complete list of physical, biological and chemical parameters measured for riverine and sea waters is reported in Tables S1–S5. The lowest values of salinity characterising the water bodies were registered in 2019 events: mean values of 0.42 ± 0.02 and 29.72 ± 0.57 at river and sea, respectively. The temperature values were significantly different between river and seawater (p < 0.001), showing that riverine waters were colder than seawater. Dissolved oxygen was in the mean range value of 6.22 to 6.36 mg L−1 in the seawater. Regarding chemical parameters (Tables S1–S4), results from daily monitoring conducted during the events in 2019 and 2020 showed that the ammonium and nitrate were significantly positively correlated with the sewage faecal load (Table 1). Other chemical parameters were analysed. The mean nitrite values were in the range of 4.03 to 9.84 μM and 0.4 to 0.51 μM in river and seawaters, respectively. In riverine waters, the total nitrogen mean concentration was in the range of 205 to 292.65 μM. Total nitrogen was retrieved in the concentration of 40.53 ± 3.94 μM in the seawater. Phosphate mean concentration was 0.90 ± 0.13 μM in the seawater, while total phosphate was in the mean range of 4.08 to 5.30 μM in riverine waters, and of 1.44 ± 0.27 μM in seawater. TSM mean values were in the range of 100.55 to 242.6 μg L−1 and 50.14 to 63.67 μg L−1 in river and sea waters, respectively. The particulate organic matter (POM) had a 12.52 ± 1.76 μg L−1 and 9.12 ± 1.33 μg L−1 mean value in riverine and seawater, respectively. In addition, Chl-a was analysed as a biological parameter in both riverine and seawater; the mean range value was 12.35 to 14.27 μg L−1 and of about 4.15 ± 1.22 μg L−1 mean value in riverine and sea waters, respectively.
From the data analysed, we observed that E. coli and intestinal enterococci concentrations were always higher in the Arzilla River than those of seawater sites (p < 0.001) and with abundances often exceeding the limit allowed by Directive 2006/7/EC (Figure S1). A highly significant and positive correlation was found between the abundance trend of E. coli and intestinal enterococci in all sampling periods in the Arzilla River (n = 53, r = 0. 850, p < 0.01; Table 1) and in seawater (n = 63, r = 0. 872, p < 0.01), and between rainfall and total abundance of E. coli and intestinal enterococci in Arzilla River (p < 0.01; Table 1) in all events. Differently, the ammonium concentration significantly correlated only with the enterococci load (2019–2020 events; Table 1).
The nutrient concentrations of the seawater samples collected immediately after the rainy events showed an evident and immediate dilution of ammonium and nitrate from the mouth to offshore along all the three transects associated with the hydrodynamics of the surface water mass, which was associated above all with wind direction and intensity (Figure 3 and Figure 5 and Supplementary Table S5). In particular, the highest concentration of nutrients was found at the Arzilla mouth in the range of 2.4 to 70 μM and 75 to 380 μM for ammonium and nitrate, respectively. The highest ammonium concentration was reached (70 μM) on 3 September 2019, while the highest nitrate concentration (380 μM) occurred on 6 August 2020 (Figure 3 and Figure 5).
Although characterized by abundant rains, the precipitation event of July 2019 did not produce an activation of the CSO but an increase in the Arzilla River level (from a 0.63 m at a maximum of 0.72 m; Figure S1).
Despite the no-CSO condition, the rains caused a significant increase in E. coli and intestinal enterococci at t1 (up to 4000 and 3500 CFU 100 mL−1, respectively) in the river samples, and the levels also remained above the maximum limit allowed by Directive 2006/7/EC in the following hours (2850 and 3150 CFU 100 mL−1, respectively at t7; Supplementary Figure S1). During the event, the nutrient concentrations of ammonium and nitrate exhibited a different trend along the riverine sampling. The nitrate decreased from t1 to t7, while the ammonium remained constant within a range of 2.5 to 6.5 μM (Supplementary Figure S2). Following the meteorological event in seawater samples, the E. coli and enterococci values exceeded the allowed limit only at the station near the mouth of the Arzilla River (AZm), where the river flows into the sea and at the SW50 stations. The faecal load was below the limit established by law as it moved away from the river mouth to offshore along all three transects (Figure 4). The ammonium and nitrates distribution in seawater samples showed an evident dilution along all transects with a range of concentration from 0.94 to 3.55 and from 10.25 to 26.9 μM, respectively (Figure 3). With regard to faecal indicator bacteria, the event of September 2019, after precipitation of 1.2 mm, produced activation of the CSO lasting about 4 h (from t3 to t4), which showed a rapid increase in the abundance of E. coli and intestinal enterococci in the Arzilla River (16,500 and 24,000 CFU 100 mL−1, respectively in t4) up to a maximum value at t4 for E. coli in Arzilla mouth (30,000 CFU 100 mL−1). In the following time (until t12; after 84 h), a reduction in the microbial load was observed up to the legal limits (Figure S1). In September 2019, the peak of ammonium during the activation of the CSO preceded the nitrate increase (Figure S2), while the nitrate concentration reached the highest levels at t8 (136.5 μM).
During the rain event, the CSO activation caused an increase in the microbial load of E. coli and intestinal enterococci in seawaters, with values that exceeded the limit allowed by the Directive 2006/7/EC at the SW50 and SW100 stations of the Transect 1 only (near the coastline) on the first sampling day (3 September), and after 72 h, the faecal distribution exhibited an evident dispersion at SW50 and SW100 also in the Transect 2 and 3 (Figure 4). In addition, the ammonium and nitrates distribution in seawater samples showed a similar trend for the faecal bacteria, with a high concentration at Arzilla mouth and SW50 of the Transect 1 and an evident dilution along all transects after 72 h (Figure 3). For the 2019 events, a highly significant and positive correlation was reported between faecal bacteria and ammonium concentration in the Arzilla River, along with rain levels (Table 1).
A rapid increase in the concentration of E. coli and intestinal enterococci was observed on July 2020 in the Arzilla River (from t1 to t3, 17,000–21,000 CFU 100 mL−1 and 10,500–16,900 CFU 100 mL−1, respectively) after the rainfall event (6.0 mm of rain) and the CSO activation. In the next 24 h, a marked decrease in the concentration of faecal bacteria occurred with values at t1 of 151 CFU 100 mL−1 in the E. coli and higher for intestinal enterococci (778 CFU 100 mL−1; Supplementary Figure S1). In July 2020, the nutrient trends were almost overlapping. After the period of spillway continuation, the nutrient concentrations decayed immediately for a short time, and then, the nitrate concentration seemed to re-increase at the end of riverine sampling (Supplementary Figure S2). Along the three transects from SW50 to SW150, 4 h after the CSO, an increase in the E. coli and enterococci load was observed, recording values of faecal bacteria beyond the limits allowed by the Directive. In the following 24 h, the E. coli concentrations exhibited an evident dispersion along the coastal transect, with values below the legal limits (Figure 6). The Enterococci values remained high around the Arzilla mouth and in SW50 of Transect 3, placed in front of the river mouth. The ammonium and nitrate concentration showed an evident and immediate dilution from the mouth to offshore along all three transects associated with the wind direction (Figure 5 and Supplementary Table S1).
The event of August 2020 was characterised by two CSOs at t1 and after 24 h at t6. We reported an increase in the microbial load of E. coli and intestinal enterococci in the Arzilla River (33,700 and 25,800 CFU 100 mL−1 for E. coli and 15,000 and 5110 CFU 100 mL−1 for enterococci, in the first and second events, respectively) with values above the limits allowed by Directive. Faecal concentrations decreased in the following 32 h but never returned below the expected limits (Supplementary Figure S1). The nutrient concentration of ammonium and nitrate increased simultaneously and in succession reached the highest levels after the second CSO event showing values of 59 μM and 293.4 μM for ammonium and nitrate, respectively (Supplementary Figure S2).
The seawater sites were sampled approximately 4 h after the CSO activation. The load of E. coli exceeded the legal limits in the river mouth only (23,000 CFU 100 mL−1), and in all seawater sampled sites (from SW50 to SW250), the E. coli concentration was below the limits, even in the following days after the event (Figure 6). On the contrary, the enterococci concentration reported from Transect 3 (from SW50 to SW150 stations) in front of the Arzilla mouth was higher than the limits allowed by the Directive. Enterococci values returned below the allowed limits over the next 72 h, showing a decreasing trend moving away from the mouth to offshore (Figure 6). The ammonium and nitrate concentration showed an evident and immediate dilution from the Arzilla mouth in all three transects due to wind direction and intensity (Figure 5 and Supplementary Table S1). The meteorological event on September 2020 determined the CSO activation 3 h after the rain started. The CSO opening induced an increase in the microbial load of E. coli and intestinal enterococci along the Arzilla River and mouth above the limit allowed by Directive. Over the next 24 h, faecal bacteria concentrations decreased without returning below the legal limits (1660 and 880 CF 100 mL−1; Supplementary Figure S1). In September 2020, the nutrient trends were almost overlapping. After the period of spillway continuation, the nutrient concentrations decayed immediately for a short time, and then, the nitrate concentration seemed to re-increase at the end of riverine sampling.
Twenty-four hours after the event, at all seawater sampling stations, the bacterial load of E. coli and enterococci remained below the allowed limits (Figure 6), and ammonium and nitrate concentrations were not very indicative due to the limited number of samples collected due to the adverse weather conditions (Figure 5). During the 2020 events, only the enterococci loads were significantly and positively correlated with nitrate concentrations in the Arzilla River, while both faecal bacteria were significantly correlated with rain levels (Table 1).

4. Discussion

The national and regional legislation requires that the dispersion of sewage as soil improvers for use in agriculture must be distributed at a distance greater than 10 m from the shores of surface watercourses [32]; therefore, in this study, it was difficult to define the cause of sewage run-off and whether there was the interference of this agricultural fertilisation practice [33,34,35]. Bathing waters along the Adriatic Sea regularly receive untreated or partially treated sewage from neighbouring cities [13,36]. In many cases, the release of wastewaters occurs in the proximity of recreational waters, which are situated in front of estuaries, bays, or artificial semi-enclosed systems, where water circulation is limited. This increases the likelihood of the presence of high levels of faecal bacteria that can negatively impact the utilisation of coastal resources and human health. This situation is exacerbated when the increase in the water runoff flow is associated with sudden heavy rainfall events and seasonal temperature changes [37] that might favour increased faecal pollution and longer survival for the faecal microbes, respectively. Coastal development and the loss of vegetative landscape have increased the potential of small rainfall events to create large pulses of stormwater, which can also carry excess pollutants that may adversely affect coastal systems [38].
The EU public health regulation (Bathing Water Directive, BWD, 2006/7/EC) requires the monitoring of recreational waters. The monitoring is limited to seawater, ignoring the riverine systems’ potential contribution to coastal water quality, and it involves two parameters of faecal coliform bacteria. The analyses are carried out at single points distributed along the coast and systematically sampled once a month or one time after a rain event (ARPA, DGR 419-2021), and they do not envisage bathing water sampling at different time scales and spatial points (i.e., from few hours up to one week after the event).
In the present study, the results of a two-year monitoring program in the Arzilla River and the bathing water area in front of the city of Fano (Marche Region, Italy, North Adriatic Sea) are shown. The Arzilla River collects treated wastewaters from the wastewater treatment plant of Fano city, and it discharges them into the sea near one of the most popular beaches during the summer season. Heavy rainfall events often cause the overflow of the local sewage network, directly releasing the wastewaters into the river and to the sea [13]. The area was selected since it is representative of the average conditions of a medium urbanised city (about 100,000 inhabitants) overlooking the Adriatic Sea, and it might provide valuable information for the implementation of monitoring programs and mitigation strategies.
The study design consisted of multiple sampling points located both in the Arzilla River and on the coast at sampling time points following episodic heavy rain events. Our data highlighted the need for monitoring at different time scales, including more than one single point at sea (i.e., different distances from shore) and considering the riverine system as input of polluted waters into the coast.
Time scale, sources of microbial contamination and nutrient concentrations are key aspects if we wish to improve water quality management practises and achieve a more thorough understanding of the risk they pose to human health. In fact, different studies reported higher faecal bacteria levels at sites affected by freshwater inputs after storm rainfall events [4,39], suggesting that such inputs are likely to be important point-sources of faecal pollution for bathing waters, which receive faecal-polluted freshwater as for our study case from the Arzilla River.
This study showed how there was an immediate increase in Arzilla River levels of faecal bacteria in conditions of heavy rainfall. The activation of the CSO corresponded to the maximum values of faecal bacterial concentrations, with over 100 to 1000 times the limit allowed by the Bathing Water Directive at the beginning of the rain event. E. coli and enterococci trends co-occurred, and their concentration profiles were strictly related to rainfall duration and intensity precipitation and decreased 40–60% over the next 48 to 72 h, as previously reported [6,40]. The E. coli concentrations dominated in all samples. Differences between the concentrations of E. coli and enterococci in aquatic environments have been described in previous studies, and this variability depends on numerous factors, such as temperature, ultraviolet radiation, pH, salinity, and oxygen and nutrient concentrations. Solar radiation is an important factor in understanding microbial dynamics. In the present study, the seawater sampling was very close to the beach, and at the mouth of Arzilla River, the TSM values were high (6.25–285.71 mg L−1, shown in Table S2). Meanwhile, TSM values in the northern Adriatic coastal area were much lower in the range of 2.5 to 4.2 mg L−1 (unpublished data; [41]), and consequently, the solar radiation into the water column was potentially attenuated.
As reported in previous studies [7,17,42], lower salinity and higher oxygen values favour higher faecal bacteria concentrations in bathing waters. Amorim et al. [17] also stressed that higher microbial loads were often reported in those beaches less exposed to the direct influence of the Ocean, while beaches more exposed to oceanographic forcing and under reduced fluvial influence were less impacted by faecal contamination. Similarly, [7] stressed the influence of beach topography and the differential impact of storm run-off on bacterial concentration according to topographically distinct beaches. In the present study, the Fano or Arzilla site is characterised by sandy beaches and is very shallow with artificial reefs placed parallel to the coast, which limits the seawater circulation favouring high residual time of the waters. The spatial distribution of microbial faecal load and nutrients in the coastal seawater in front of the Arzilla River showed a faecal bacteria dispersion decreasing along the sampled transects, with higher values at the river mouth and along the transect near the coastline. Similar trends were visible in the nutrients, showing dilutions from 50 metres (SW50) from the coast to offshore stations potentially related to wind direction and intensity with a mitigation effect in 24 h.
Multivariate analysis involving all environmental variables was performed to identify which measures influenced the faecal patterns in the entire sampling period (Table 1). In the Arzilla River, variability in faecal bacteria concentrations was partially explained by ammonium concentration, Chl-a and TSM, whereas in seawater samples, the faecal abundance was highly explained by salinity, pH and ammonium content. The water temperature, similar to that reported in previous studies [4], was not the main factor influencing their survival in the sampling water bodies, and consequently, it had a marginal role in determining the spatial and temporal distribution of the bacteria concentration in coastal waters.
Despite our results suggesting a potential role of the seawater hydrodynamics (i.e., mixing induced by wind and waves) in controlling the decay of the faecal contamination to background levels, our analysis did not identify these variables as statistically significant (Table 2). This could be due to the difficulties encountered in securing a consistent number of samples from the offshore sampling sites during severe storms, a variable temporal offset between the changing of key environmental variables (i.e., UV-index or water hydrodynamics), and the response in the concentration of faecal contaminants or a combination of both.
The identified correlation of faecal bacteria and TSM can be attributed to the capacity of the increased flow rate to resuspend sediments [43], which can considerably increase faecal bacteria and pathogen levels [44]. With regard to salinity, its variation over time during CSO generally showed a rapid decrease, and sometimes it reached a minimum before progressively increasing until the end of the overflow, highlighting a dilution effect of wastewater due to urban stormwater runoff (with a much lower conductivity). As reported in the literature and our results, there was a great variation in the concentration of microorganisms in CSO depending on rainfall/runoff duration and intensity, stormwater quality, and the number of dry days before the event [44]. In the present study, results that were related to the variation of some nutrients associated with the nitrogen cycle could help us understand whether the origin of faecal contamination was due exclusively to the urban sewage outflow quantity of the Arzilla mouth or also could originate from other sources.
The ammonium (N-NH4+) was the most representative nutrient of domestic sewage outflow rather than the other chemical parameters that included different origins, such as inorganic and organic and as dissolved or particulate [45]. Several studies identified strong correlations between ammonium with faecal indicator bacteria [26,43]. The strong correlation between ammonium and faecal bacteria in the sampling waters in Arzilla River and seawater (Table 1 and Figure S3) can provide a theoretical basis for controlling pathogen pollution through ammonium monitoring in the river. In the short term, effective sensors will be available for measuring the concentration of ammonium in freshwaters allowing us to have real-time information on this parameter [46].
In the present study the potential spatial-temporal relationships of the faecal microbial load in the Arzilla River and bathing waters with the main environmental variables were assessed. These relationships were analysed to establish whether the E. coli and intestinal enterococci abundance patterns were related to the fluctuations of some of the main environmental variables over time and provide a concept of how they can be used to predict bathing water quality. The data acquired in this study, associated with the real-time information of the ammonium concentration in the river waters, will contribute to determining the forecast of the duration and distribution of contamination in coastal waters along with the use of the forecasting models [13].
Moreover, the findings presented here support the hypothesis that individual characteristics of beaches may influence pathogen concentrations and manifest serious health risks. The use of specific data for a given location in management decisions is highly recommended, and our results provide the basis for such planning [7,20].

Supplementary Materials

The following are available online at https://www.mdpi.com/article/10.3390/w14030502/s1. Figure S1: Temporal trends of microbial faecal distribution and rainfall in the site of Arzilla River and in Arzilla mouth after the 5 sampling events; Figure S2: Temporal trends of nutrient distribution rainfall in the site of Arzilla River and in Arzilla mouth after the 5 sampling events; Figure S3: Relationship between total faecal bacteria and ammonium in Arzilla River and seawater. Table S1: Dataset of physical, biological, chemical parameters, and Total Suspended Matter at the Arzilla River in July-September 2019. Table S2. Dataset of physical, biological, chemical parameters, and Total Suspended Matter along the three transects at the sea in July-September 2019, Table S3. Dataset of physical, biological, chemical parameters, Total Suspended Matter and Particulate Organic Matter at the Arzilla River in July, August and September 2020, Table S4. Dataset of physical, biological, chemical parameters, and Total Suspended Matter and Particulate Organic Matter along the three transects at the sea in July, August, and September 2020, Table S5. Meteorological-marine conditions during the five events (2019–2020).

Author Contributions

Conceptualization, E.M., E.B., A.P.; Data curation, E.M., A.P.; Investigation, E.M., P.P., L.B., M.M., A.P.; Formal analysis, E.B., F.R., D.G.; Resources, E.M., E.B., F.R., F.G., D.G., M.I., S.C. (Silvia Casabianca), S.C. (Samuela Capellacci), N.M., P.P., F.M., A.C. (Alessandra Campanelli), A.C. (Angelina Cordone), M.C., D.B., A.P.; Methodology, E.M., F.R., M.I., S.C. (Silvia Casabianca), S.C. (Samuela Capellacci), N.M., P.P., A.P.; Funding acquisition, M.M., Project administration, E.M., M.M., A.P., Supervision, E.M., L.B., M.M., A.P., Validation, E.M., E.B., F.R., A.P., Visualization, E.M., E.B., F.R., F.G., A.P., Writing-original draft, E.M., E.B., A.P., Writing—review & editing, E.M., E.B., D.G., M.M., A.P. All authors have read and agreed to the published version of the manuscript.

Funding

This research was funded by WATERCARE project (Water management solutions for reducing microbial environment impact in coastal areas, project ID 10044130, https://www.italy-croatia.eu/web/watercare, accessed on 17 October 2021) funded by the European Union under the Interreg Italy–Croatia CBC Programme.

Data Availability Statement

Authors have the raw data readily available for presentation to the referees and the editors of the journal, if requested. Authors ensure appropriate measures are taken so that raw data is retained in full for a reasonable time after publication.

Acknowledgments

Authors wish to thank Marche Region Civil Protection for providing pluvio-hydrometric data from Santa Maria in the Arzilla River. The authors thank Elia Rosetti for his contribution to the dissemination phase of the project.

Conflicts of Interest

The authors declare that they have no known competing financial interests or personal relationships that could have appeared to influence the work reported in this paper.

References

  1. McLellan, S.L.; Eren, A.M. Discovering new indicators of fecal pollution. Trends Microbiol. 2014, 22, 697–706. [Google Scholar] [CrossRef] [PubMed] [Green Version]
  2. Newton, R.J.; Bootsma, M.J.; Morrison, H.G.; Sogin, M.L.; McLellan, S.L. A Microbial Signature Approach to Identify Fecal Pollution in the Waters Off an Urbanized Coast of Lake Michigan. Microb. Ecol. 2013, 65, 1011–1023. [Google Scholar] [CrossRef]
  3. Oliver, D.M.; Hanley, N.D.; van Niekerk, M.; Kay, D.; Heathwaite, A.L.; Rabinovici, S.J.M.; Kinzelman, J.L.; Fleming, L.E.; Porter, J.; Shaikh, S.; et al. Molecular tools for bathing water assessment in Europe: Balancing social science research with a rapidly developing environmental science evidence-base. Ambio 2016, 45, 52–62. [Google Scholar] [CrossRef] [Green Version]
  4. Luna, G.M.; Manini, E.; Turk, V.; Tinta, T.; D’Errico, G.; Baldrighi, E.; Baljak, V.; Buda, D.; Cabrini, M.; Campanelli, A.; et al. Status of faecal pollution in ports: A basin-wide investigation in the Adriatic Sea. Mar. Pollut. Bull. 2019, 147, 219–228. [Google Scholar] [CrossRef]
  5. Barco, J.; Papiri, S.; Stenstrom, M.K. First flush in a combined sewer system. Chemosphere 2008, 71, 827–833. [Google Scholar] [CrossRef]
  6. Al Aukidy, M.; Verlicchi, P. Contributions of combined sewer overflows and treated effluents to the bacterial load released into a coastal area. Sci. Total Environ. 2017, 607–608, 483–496. [Google Scholar] [CrossRef]
  7. He, Y.; He, Y.; Sen, B.; Li, H.; Li, J.; Zhang, Y.; Zhang, J.; Jiang, S.C.; Wang, G. Storm runoff differentially influences the nutrient concentrations and microbial contamination at two distinct beaches in northern China. Sci. Total Environ. 2019, 663, 400–407. [Google Scholar] [CrossRef] [PubMed]
  8. Mongruel, R.; Vanhoutte-Brunier, A.; Fiandrino, A.; Valette, F.; Ballé-Béganton, J.; Pérez Agúndez, J.A.; Gallai, N.; Derolez, V.; Roussel, S.; Lample, M.; et al. Why, How, and how far should microbiological contamination in a coastal zone be mitigated? An application of the systems approach to the Thau lagoon (France). J. Environ. Manag. 2013, 118, 55–71. [Google Scholar] [CrossRef] [Green Version]
  9. Grilli, F.; Accoroni, S.; Acri, F.; Aubry, F.B.; Bergami, C.; Cabrini, M.; Campanelli, A.; Giani, M.; Guicciardi, S.; Marini, M.; et al. Seasonal and Interannual Trends of Oceanographic Parameters over 40 Years in the Northern Adriatic Sea in Relation to Nutrient Loadings Using the EMODnet Chemistry Data Portal. Water 2020, 12, 2280. [Google Scholar] [CrossRef]
  10. Chu, Y.; Tournoud, M.G.; Salles, C.; Got, P.; Perrin, J.L.; Rodier, C.; Caro, A.; Troussellier, M. Spatial and temporal dynamics of bacterial contamination in South France coastal rivers: Focus on in-stream processes during low flows and floods. Hydrol. Process 2014, 28, 3300–3313. [Google Scholar] [CrossRef]
  11. Basili, M.; Campanelli, A.; Frapiccini, E.; Luna, G.M.; Quero, G.M. Occurrence and distribution of microbial pollutants in coastal areas of the Adriatic Sea influenced by river discharge. Environ. Pollut. 2021, 285, 117672. [Google Scholar] [CrossRef]
  12. Jalliffier-Verne, I.; Heniche, M.; Madoux-Humery, A.S.; Galarneau, M.; Servais, P.; Prévost, M.; Dorner, S. Cumulative effects of fecal contamination from combined sewer overflows: Management for source water protection. J. Environ. Manag. 2016, 174, 62–70. [Google Scholar] [CrossRef]
  13. Ferrarin, C.; Penna, P.; Penna, A.; Spada, V.; Ricci, F.; Bilić, J.; Krzelj, M.; Ordulj, M.; Šikoronja, M.; Ðuračić, I.; et al. Modelling the quality of bathing waters in the adriatic sea. Water 2021, 13, 1525. [Google Scholar] [CrossRef]
  14. Line, D.E.; White, N.M.; Kirby-Smith, W.W.; Potts, J.D. Fecal coliform export from four coastal North Carolina areas. J. Am. Water Resour. Assoc. 2008, 44, 606–617. [Google Scholar] [CrossRef]
  15. Schlitzer, R. Ocean Data View 2020. Available online: https://odv.awi.de (accessed on 2 February 2022).
  16. Field, K.G.; Samadpour, M. Fecal source tracking, the indicator paradigm, and managing water quality. Water Res. 2007, 41, 3517–3538. [Google Scholar] [CrossRef]
  17. Amorim, E.; Ramos, S.; Bordalo, A.A. Relevance of temporal and spatial variability for monitoring the microbiological water quality in an urban bathing area. Ocean Coast. Manag. 2014, 91, 41–49. [Google Scholar] [CrossRef]
  18. Zenelaj, R.; Hila, F. Impact of Urban Wastewater Discharges on the Microbiological Pollution of Rivers Debouching into the Adriatic Sea; ESE Publications: Tirana, Albania, 2007. [Google Scholar]
  19. Ostoich, M.; Aimo, E.; Fassina, D.; Barbaro, J.; Vazzoler, M.; Soccorso, C.; Rossi, C. Biologic impact on the coastal belt of the province of Venice (Italy, Northern Adriatic Sea): Preliminary analysis for the characterization of the bathing water profile. Environ. Sci. Pollut. Res. 2011, 18, 247–259. [Google Scholar] [CrossRef]
  20. Liberatore, L.; Murmura, F.; Scarano, A. Bathing water profile in the coastal belt of the province of Pescara (Italy, Central Adriatic Sea). Mar. Pollut. Bull. 2015, 95, 100–106. [Google Scholar] [CrossRef]
  21. Organizzazione delle Nazioni Unite. Trasformare il Nostro Mondo: L’Agenda 2030 per lo Sviluppo Sostenibile (Agenda 2030); Organizzazione delle Nazioni Unite: New York, NY, USA, 2015. [Google Scholar]
  22. Spagnoli, F.; Dell’Anno, A.; de Marco, A.; Dinelli, E.; Fabiano, M.; Gadaleta, M.V.; Ianni, C.; Loiacono, F.; Manini, E.; Marini, M.; et al. Biogeochemistry, grain size and mineralogy of the central and southern Adriatic sea sediments: A review. Chem. Ecol. 2010, 26, 19–44. [Google Scholar] [CrossRef] [Green Version]
  23. Spagnoli, F.; De Marco, R.; Dinelli, E.; Frapiccini, E.; Frontalini, F.; Giordano, P. Sources and metal pollution of sediments from a coastal area of the central western adriatic sea (Southern Marche region, Italy). Appl. Sci. 2021, 11, 1118. [Google Scholar] [CrossRef]
  24. Reynolds, L.J.; Martin, N.A.; Sala-Comorera, L.; Callanan, K.; Doyle, P.; O’Leary, C.; Buggy, P.; Nolan, T.M.; O’Hare, G.M.P.; O’Sullivan, J.J.; et al. Identifying Sources of Faecal Contamination in a Small Urban Stream Catchment: A Multiparametric Approach. Front. Microbiol. 2021, 12, 1–12. [Google Scholar] [CrossRef]
  25. Mallin, M.A.; McIver, M.R. Pollutant impacts to Cape Hatteras National Seashore from urban runoff and septic leachate. Mar. Pollut. Bull. 2012, 64, 1356–1366. [Google Scholar] [CrossRef]
  26. Napier, A.D.; Depledge, M.; Knipper, M.; Lovell, R.; Ponarin, E.; Sanabria, E.; Thomas, F. Culture Matters: Using a Cultural Contexts of Health Approach to Enhance Policy-Making; WHO: Copenhagen, Denmark, 2017. [Google Scholar]
  27. Penna, P.; Baldrighi, E.; Betti, M.; Bolognini, L.; Campanelli, A.; Capellacci, S.; Casabianca, S.; Ferrarin, C.; Giuliani, G.; Grilli, F.; et al. Water quality integrated system: A strategic approach to improve bathing water management. J. Environ. Manag. 2021, 295, 113099. [Google Scholar] [CrossRef]
  28. Locatelli, L.; Russo, B.; Acero Oliete, A.; Carlos Sánchez Catalán, J.; Martínez-Gomariz, E.; Martínez, M. Modeling of E. coli distribution for hazard assessment of bathing waters affected by combined sewer overflows. Nat. Hazards Earth Syst. Sci. 2020, 20, 1219–1232. [Google Scholar] [CrossRef]
  29. Strickland, J.D.H.; Parsons, T.R. A Practical HANDBOOK of Seawater Analysis; Bulletin of Fisheries Research Board of Canada 167: Ottawa, ON, Canada, 1972. [Google Scholar]
  30. Alpha Analytical Quality. Total Suspended Solids Dried at 103–105 °C Total Volatile Suspended Solids Dried at 500 °C. In Standard Methods for the Examination of Water and Wastewater; APHA-AWWA-WPCF; Alpha Analytical, Inc.: Holmes, PA, USA, 2013; pp. 1–9. [Google Scholar]
  31. Clarke, D.A.; Gorley, R.N. PRIMER v6: User Manual/Tutorial; PRIMER-E: Plymouth, MA, USA, 2006. [Google Scholar]
  32. Marche, D.C. 1991/676/CE-D.M. n. 9 del 25/02/2016 A. del P. d’azione preliminare zone vulnerabili da nitrati di origine agricola della R. In Delibera della Giunta Regionale 1282_2019; Regione Marche Giunta Regionale: Ancona, Italy, 2019; pp. 1–64. [Google Scholar]
  33. EU Directive 2008/98/EC of the European Parliament and of the Council on Waste and Repealing Certain Directives; Official Journal of the European Union: Luxembourg, 2008; pp. 3–30.
  34. DIRECTIVE 2000/60/EC of the European Parliament and of the Council Establishing a Framework for Community Action in the Field of Water Policy; Official Journal of the European Communities: Aberdeen, UK, 2000; pp. 1–72.
  35. DM 18354 27-11-2009: Disposizioni per L’attuazione dei Regolamenti (CE) n. 834/2007, n. 889/2008, n. 1235/2008 e Successive Modifiche Riguardanti la Produzione Biologica e L’etichettatura dei Prodotti Biologici; Il Ministro delle Politiche Agricole Alimentari e Forestali: Rome, Italy, 2009; pp. 1–21.
  36. Ostoich, M.; Ghezzo, M.; Umgiesser, G.; Zambon, M.; Tomiato, L.; Ingegneri, F.; Mezzadri, G. Modelling as decision support for the localisation of submarine urban wastewater outfall: Venice lagoon (Italy) as a case study. Environ. Sci. Pollut. Res. 2018, 25, 34306–34318. [Google Scholar] [CrossRef]
  37. Hong, H.; Qiu, J.; Liang, Y. Environmental factors influencing the distribution of total and fecal coliform bacteria in six water storage reservoirs in the Pearl River Delta Region, China. J. Environ. Sci. 2010, 22, 663–668. [Google Scholar] [CrossRef]
  38. Sidhu, J.P.S.; Skelly, E.; Hodgers, L.; Ahmed, W.; Li, Y.; Toze, S. Prevalence of Enterococcus species and their virulence genes in fresh water prior to and after storm events. Environ. Sci. Technol. 2014, 48, 2979–2988. [Google Scholar] [CrossRef]
  39. Lipp, E.K.; Kurz, R.; Vincent, R.; Rodriguez-Palacios, C.; Farrah, S.R.; Rose, J.B. The effects of seasonal variability and weather on microbial fecal pollution and enteric pathogens in a subtropical estuary. Estuaries 2001, 24, 266–276. [Google Scholar] [CrossRef]
  40. Pongmala, K.; Autixier, L.; Madoux-Humery, A.S.; Fuamba, M.; Galarneau, M.; Sauvé, S.; Prévost, M.; Dorner, S. Modelling total suspended solids, E. coli and carbamazepine, a tracer of wastewater contamination from combined sewer overflows. J. Hydrol. 2015, 531, 830–839. [Google Scholar] [CrossRef]
  41. Boldrin, A.; Carniel, S.; Giani, M.; Marini, M.; Bernardi Aubry, F.; Campanelli, A.; Grilli, F.; Russo, A. Effects of bora wind on physical and biogeochemical properties of stratified waters in the northern Adriatic. J. Geophys. Res. 2009, 114, 1–19. [Google Scholar] [CrossRef]
  42. Ishii, S.; Ksoll, W.B.; Hicks, R.E.; Sadowsky, M.J. Presence and growth of naturalized Escherichia coli in temperate soils from lake superior watersheds. Appl. Environ. Microbiol. 2006, 72, 612–621. [Google Scholar] [CrossRef] [Green Version]
  43. Wilkes, G.; Edge, T.A.; Gannon, V.P.J.; Jokinen, C.; Lyautey, E.; Neumann, N.F.; Ruecker, N.; Scott, A.; Sunohara, M.; Topp, E.; et al. Associations among pathogenic bacteria, parasites, and environmental and land use factors in multiple mixed-use watersheds. Water Res. 2011, 45, 5807–5825. [Google Scholar] [CrossRef]
  44. Illuminati, S.; Annibaldi, A.; Truzzi, C.; Tercier-Waeber, M.-L.; Nöel, S.; Braungardt, C.B.; Achterberg, E.P.; Howell, K.A.; Turner, D.; Marini, M.; et al. In-situ trace metal (Cd, Pb, Cu) speciation along the Po River plume (Northern Adriatic Sea) using submersible systems. Mar. Chem. 2019, 212, 47–63. [Google Scholar] [CrossRef]
  45. Viaroli, P.; Soana, E.; Pecora, S.; Laini, A.; Naldi, M.; Fano, E.A.; Nizzoli, D. Space and time variations of watershed N and P budgets and their relationships with reactive N and P loadings in a heavily impacted river basin (Po river, Northern Italy). Sci. Total Environ. 2018, 639, 1574–1587. [Google Scholar] [CrossRef]
  46. Samavati, Z.; Borhani, T.N.; Samavati, A.; Ismail, A.F.; Rahman, M.A.; Othman, M.H.D.; Soleymani, M. Optical fiber sensor based on magneto-plasmonic features of Ag-Co nanostructure for ppm ammonium detection in aqueous solutions. Opt. Fiber Technol. 2021, 67, 102730. [Google Scholar] [CrossRef]
Figure 1. The hydrographic basin of the Azilla River (light blue line). An area of 105 square kilometres, delimited by the orange line. In the map, the purification systems (marked with DEP and shown as red dots) releasing wastewaters into the Arzilla River, two CSOs of the urban network of the Fano city (CSO_via del Moletto and CSO_via Goito, shown as red placemarks), and bathing areas (light blue lines) along the coast near the mouth of the Arzilla stream: IT01104013005 is shown.
Water 14 00502 g001
Figure 2. Study site and sampling strategy. Two sampling stations were positioned along the Arzilla River (green dots), AZ (where is located the automatic water sampling for microbiological and chemical analyses) and at Arzilla mouth (AZm). On the sea, sampling stations were distributed along three transects at increasing distances from the shore (orange dots). Transect 1 near the coastline (red line): Transect 2 in the middle (blue line); Transect 3 in front of the river mouth (yellow line).
Water 14 00502 g002
Figure 3. Ocean data view [15] maps showing the spatial distributions of nutrient concentration (NH3 and NO3) in seawater from sampling stations to offshore along the three transects in front of the Arzilla mouth during the 2019 rainy events (July and September 2019). The graphs show the relative concentration of ammonium (in green) and nitrates (in blue).
Water 14 00502 g003
Figure 4. Ocean data view [15] maps showing the spatial distributions of microbial faecal contamination in seawater from sampling stations to offshore along the three transects in front of the Arzilla mouth during the 2019 rainy events (July and September 2019). The graphs show the relative abundance of colony-forming units of Escherichia coli (in red) and intestinal enterococci (in blue).
Water 14 00502 g004
Figure 5. Ocean data view [15] maps showing the spatial distributions of nutrient concentration (NH3 and NO3) in seawater from sampling stations to offshore along the three transects in front of the Arzilla mouth during the 2020 rainy events (July, August and September). The graphs show the relative abundance of ammonium (in green) and nitrates (in blue).
Water 14 00502 g005
Figure 6. Ocean data view [15] maps showing the spatial distributions of microbial faecal contamination in seawater from sampling stations to offshore along the three transects in front of the Arzilla mouth during the 2020 rainy events (July, August and September). The graphs show relative abundance in colony-forming units of Escherichia coli (in red) and intestinal enterococci (in blue).
Water 14 00502 g006
Table 1. Spearman’s rank correlation between nutrient concentrations (nitrates and ammonium), faecal bacteria (E. coli and enterococci) and rainfall in the site of the Arzilla River during 2019–2020 events. In bold significant values reported (p < 0.01).
2019–2020 N-NH4+N-NO3RainEnterococciE. coli
N-NH4+1
N-NO30.1591
rain−0.0590.2091
Enterococci0.3460.2250.4221
E. coli0.2440.1970.4900.8501
2019 N-NH4 +N-NO3rainEnterococciE. coli
N-NH4+1
N-NO3−0.3821
rain0.4610.0701
Enterococci0.947−0.3480.5431
E. coli0.968−0.3400.4760.9261
2020 N-NH4+N-NO3rainEnterococciE. coli
N-NH4+1
N-NO30.1581
rain−0.2700.1591
Enterococci−0.0110.4460.4981
E. coli−0.1720.2520.4920.8521
Table 2. Summary of DistLM statistical analysis carried out to test for relationships between the abundance of E. coli and intestinal enterococci and chemical–physical variables in the Arzilla River (a) and in seawater (b) during all sampling periods (2019–2020) and each sampling year separately. Results of sequential tests. SS = mean square; F = F statistic; TSM = total suspended matter; T = temperature; S = salinity; TN = total nitrogen. Only significant relationships are shown.
VariableSSFpProp%Cum.Prop%
(a) Arzilla River2019-2020N-NH4+5.74 × 1084.7030.0327.67.6
Chl-a5.27 × 1084.5870.0237.014.6
TSM4.59 × 1084.4520.0396.120.7
2019N-NH4+2.27 × 109240.9900.00192.091.9
Chl-a3.87 × 1074.8720.0061.693.6
2020T1.13 × 10910.9200.00124.324.3
S1.19 × 10916.9200.00125.750.0
TN5.68 × 10810.3650.00312.262.2
(b) Seawater2019–2020N-NH4+1.12 × 108113.3100.00169.869.8
pH3.86 × 1064.1740.0402.472.2
2019S5.06 × 10765.9690.00175.075.0
N-NH4+4.86 × 1068.4930.0087.282.2
pH1.94 × 1064.4590.0432.985.1
2020N-NH4+6.46 × 10760.9560.00170.970.9
Redox3.87 × 1064.0990.0314.275.2
S2.95 × 1065.3330.0303.278.4
T2.27 × 1066.9790.0122.580.9
Publisher’s Note: MDPI stays neutral with regard to jurisdictional claims in published maps and institutional affiliations.

