Article

Temporal and Spatial Differences and Driving Factors of Evapotranspiration from Terrestrial Ecosystems of the Qinghai Province in the Past 20 Years

1
School of Geographical Science, Qinghai Normal University, Xining 810008, China
2
Academy of Plateau Science and Sustainability, People’s Government of Qinghai Province and Beijing Normal University, Xining 810016, China
3
Key Laboratory of Tibetan Plateau Land Surface Processes and Ecological Conservation (Ministry of Education), Qinghai Normal University, Xining 810008, China
4
Qinghai Province Key Laboratory of Physical Geography and Environmental Process, Xining 810008, China
5
Key Laboratory of Ecohydrology of Inland River Basin, Northwest Institute of Eco-Environment and Resources, Chinese Academy of Sciences, Lanzhou 730013, China
6
College of Tourism, Qinghai Nationalities University, Xining 810007, China
*
Author to whom correspondence should be addressed.
Water 2022, 14(4), 536; https://doi.org/10.3390/w14040536
Submission received: 13 January 2022 / Revised: 1 February 2022 / Accepted: 9 February 2022 / Published: 11 February 2022
(This article belongs to the Special Issue Energy and Water Cycles in the Third Pole)

Abstract

:
As the “Asian Water Tower”, understanding the hydrological cycles in Qinghai Province and its interior is critical to the security of terrestrial ecosystems. Based on Moderate Resolution Imaging Spectroradiometer (MODIS)16 evapotranspiration (ET) remote sensing data, we used least squares regression, correlation analysis, and t-test to determine the temporal and spatial changes and trends of ET in Qinghai Province and its five ecological functional regions, located on the Qinghai–Tibet Plateau (Plateau) Western China from 2000 to 2020. In addition, we discussed the main factors affecting the changes of ET in different regions of Qinghai Province over the first two decades of the 21st century along spatial as well as altitudinal gradients. The results showed that: (1) the average annual ET in Qinghai Province was 496.56 mm/a, the highest ET value appeared in the southeast of the study area (684.08 mm/a), and the lowest ET value appeared in the Qaidam region in the northwest (110.49 mm/a); (2) the annual ET showed an increasing trend with a rate of 3.71 mm/a (p < 0.01), the place where ET decreased most was in the Three-River Source region (−8–0 mm/a) in the southwest of the study area, and the ET increased the most in the Hehuang region in the east of the study area (9–34 mm/a); (3) temperature (T) was the dominant ET change factor in Qinghai Province, accounting for about 65.27% of the region, followed by the normalized difference vegetation index (NDVI) and precipitation (P) for 62.52% and 55.41%, respectively; and (4) ET increased significantly by 2.84 mm/100 m with increasing altitude. The dominant factors changed from P to NDVI and T as the altitude increased. The research is of practical value for gaining insight into the regional water cycle process on the Plateau under climate change.

1. Introduction

On a global scale, the asymmetry of climate change leads to heterogeneity among ecosystems [1], affecting atmospheric water vapor content, and causing significant changes in water cycle systems, such as precipitation (P) and evapotranspiration (ET) [2]. As the central link in water, energy, and carbon cycles in the climate system, ET refers to the process by which surface water vapor enters the atmosphere in gaseous form [3], including soil evaporation and plant transpiration, and is also an active factor in any regional ecosystem. ET is a complex physical and biological process whose rates vary over time across the landscape as a function of differences in temperature (T), precipitation (P), and vegetative land cover. Studies have shown that global land ET provides about 60% of P to the atmosphere, and it may be even higher in arid regions [4]. Therefore, clarifying the spatial and temporal dynamic response of ET to climate change is of great significance for predicting regional and global hydrological cycles [5].
Most traditional methods for measuring ET are based on an on-site scale, including flux tower measurement [6], indirect estimation [7], empirical model [8], semi-empirical model [9], and process model [10]. However, the spatial heterogeneity of ET and the complexity of hydrological processes limit the application of these methods in regional and global scale assessments [11]. With the development of remote sensing, ET data can be obtained on a larger geographic scale, and with better timeliness, accuracy, and economy [12]. In particular, the Moderate Resolution Imaging Spectroradiometer (MODIS)16 global surface land ET data set, which is calculated based on the Penman–Monteith formula, can reach 86% simulation accuracy with high resolution and continuous coverage in different temporal and spatial scales around the world [7], has been widely used and its reliability of results have been verified. Liaqat et al. used flux tower measurements of semi-humid farmland and temperate forest in the Korean Peninsula to evaluate the accuracy of MODIS16 ET data, and found that MODIS16 data can provide reasonable accuracy for daily ET changes [13]. Xu et al. compared 12 types of ET data in the United States and found that MODIS16 data could capture seasonal changes in ET [14]. Studies of the Three Gorges Reservoir [15], North China Plain [16], and Taohe Basin [17] in China also showed that MODIS16 ET data could provide reasonable accuracy.
The Qinghai–Tibet Plateau (Plateau) has profoundly affected East Asia and the global atmospheric water cycle through special dynamic and thermal effects, and has become a critical sensitive region for global climate change [18]. Since the 1950s, the T of the Plateau has increased significantly, and P has increased slightly [19], which inevitably leads to ET changes in response [20]. Studies have shown that there are significant spatial differences in the interannual ET trends on the Plateau [21,22], and P is the main factor affecting the ET on the Plateau [2]. However, in Tibet’s Ali, Lhasa River Valley, Qinghai Haibei region [23], and northeastern Plateau [24], ET was closely related to radiation and T. Meanwhile, the driving factors for the ET of different underlying surfaces were also different. The ET of wetlands and Kobresia humilis meadows was mainly affected by T [25,26], while that of alpine shrubs, alpine meadows, and alpine wetlands was determined by P [27,28]. In addition, factors, such as atmospheric water vapor, normalized difference vegetation index (NDVI), and soil moisture, also significantly impact ET [29,30,31]. These studies showed that the driving factors of ET were highly uncertain [32], depending on the difference in ecosystems caused by factors, such as the latitude and altitude of the study region, affecting the formation and feedback of the regional hydrological cycle [33]. The adaptation process of terrestrial hydrological evolution brought about by ET has a significant spatial connectivity. In practical applications, water resource managers and decisionmakers are more concerned about the temporal and spatial distribution and driving factors of ET at the administrative scale, such as provincial and city scales, rather than just watersheds or other natural subdivisions, yet, many current studies ignore this fact, which is not conducive to the implementation of unified water resources management and allocation.
Qinghai Province is the birthplace of Asian rivers, including the Yangtze River, the Yellow River, and the Lancang River. It is also the most populous region on the Plateau, and the study of its ET is of great significance to the ecological and hydrological systems of the Plateau. At present, studies on ET in Qinghai province have only focused on the watershed scale, such as Three-River Source [34] and Shaliu River Basin [35], but there is no comprehensive exploration from a spatial and altitudinal perspective. The purpose of this research is to: (1) evaluate the applicability of MODIS16 ET data in the terrestrial ecosystem of Qinghai Province; (2) analyze the temporal and spatial changes of ET in Qinghai Province from 2000 to 2020; and (3) assess the impact of climate factors (P, T) and environmental factors (NDVI) on ET over spatial and altitude gradients. The research is expected to provide a theoretical basis for exploring regional environmental protection, climate change, and agriculture and animal husbandry production in Qinghai Province.

2. Materials and Methods

2.1. Study Region

Qinghai Province is located in the northeastern part of the Plateau, between 89°25′–103°04′ E and 31°39′–39°11′ N, with a region of 717,500 square kilometers (Figure 1). Based on the ecological environment zoning management and control system, which from the perspective of ecological and environmental protection, promote differentiated and refined management in different regions, it has been divided into five ecological function zones in the province’s administrative regions by the Qinghai Provincial government: (1) the Three-River Source region; (2) the Qaidam Basin region; (3) the Qilian Mountain region; (4) the region around Qinghai Lake; and (5) the Hehuang region. Among them, the Three-River Source region, which is the birthplace of the Yellow River, the Yangtze River, and the Lancang River, focuses on water conservation and biodiversity function maintenance to ensure the water source of the “Asian Water Tower”; the Qilian Mountain region, an important water source in the Hexi Corridor of China, such as the Shiyang River, Heihe River, and Shule River, focuses on the ecological management and restoration to improve the water conservation function; the region around Qinghai Lake focuses on maintaining biodiversity function to promote the positive cycle of the watershed, woodland, grassland and wetland ecosystems, and biodiversity ecosystems; the Qaidam Basin region focuses on coordinating the relationship between protection and development, protecting the original ecological surface and landforms, and rationally developing mineral resources; and the Hehuang region focuses on the restoration and rehabilitation of the environment.
The terrain of Qinghai Province is exceptionally complex, with an average altitude of over 3000 m. It has formed a unique “plateau climate” with cold winters and short summers. The annual average T ranges between −5 °C and 8 °C, with higher T distributed from Hehuang Region to Qaidam. P decreases from southeast to northwest, with annual P below 400 mm in most regions [36]. The main vegetation types in this region are alpine shrubs and alpine meadows [37].

2.2. Data Source and Processing

The ET discussed in this paper is the actual evapotranspiration, and the ET remote sensing product we used is the MODIS16 A3 global terrestrial ET product (Table 1), which is a remote sensing image data set based on the Penman–Monteith algorithm for calculating global surface ET. It has a spatial resolution of 500 m and an annual time scale. The estimated input data of MODIS16 includes remote sensing information such as leaf region index, albedo, vegetation coverage, and meteorological data, such as T, air pressure, relative humidity, and radiation. It includes ET, latent heat flux (LE), latent ET (PET), and latent heat flux (PLE) [7].
In order to study the response of ET to climate change on the spatial and altitudinal gradients, T and P were selected as climate variables in this study, and NDVI as the normalized vegetation index, which can reflect the coverage of vegetation and be also used as an essential factor affecting ET (Table 1). MODIS13A3 is a product of the global terrestrial vegetation index, the content is the grid normalized vegetation index (NDVI) with a spatial resolution of 1 km. The Digital Elevation Model(DEM) data are from the China Geospatial Data Cloud Platform, with a spatial resolution of 90 m. The T and P data set are China’s monthly P data provided by the National Earth System Science Data Center (China’s National Science & Technology Infrastructure). The data are based on the published the global 0.5° climate data from the Climatic Research Unit (http://www.cru.uea.ac.uk, accessed on 9 June 2021) and the global high-resolution climate data published by WorldClim (http://worldclim.org, accessed on 12 June 2021), which is formed in China through the Delta space downscaling program Downscale generation. The data of 496 independent meteorological observation points were used for verification, and the verification results are credible [38].
We used Python to convert T and P data into TIF format, cut and splice, NDVI, and meteorological data based on ArcGIS 10.6, then eliminated invalid values, projected transform NDVI and meteorological data, resampled according to 500 m resolution, and finally obtained the raster data of ET, NDVI, P, and T in Qinghai Province from 2000 to 2020.

2.3. Research Methods

The least-squares regression method estimates the linear trend of ET in Qinghai Province from 2000 to 2020. The calculation formula is as follows [39]:
S L O P E = n × i = 1 n i × j i i = 1 n i i = 1 n i n × i = 1 n i 2 ( i = 1 n i ) 2
In the formula, SLOPE is the slope of the regression equation, n is the length of the time series; if SLOPE > 0, it means ET increases; if SLOPE < 0, it means ET decreases.
Using correlation analysis to reflect the correlation between variables x and y, the calculation formula is [39]:
r x y = i = 1 n ( x i x ¯ ) ( y i y ¯ ) i = 1 n ( x i x ¯ ) 2 i = 1 n ( y i y ¯ ) 2
In the formula, x ¯ is the multi-year average ET, y ¯ is the multi-year average NDVI, T, and P, i is the number of years (i = 1, 2, 3, 4…21), n is the length of the research time series, is the ET value in the i-th year, is NDVI, T and P values in the year i. When r > 0, there is a positive correlation between the two, and when r < 0, there is a negative correlation between the two. The closer the absolute value is to 1, the stronger the correlation; the closer to 0, the weaker the correlation. The t-test completes the significance test of the correlation coefficient, and the calculation formula is [40]:
t = R x y 1 R x y 2 n m 1
Among them, n is the number of samples (the time series is 2001–2020, that is, n = 21), and m is the number of independent variables.

3. Results

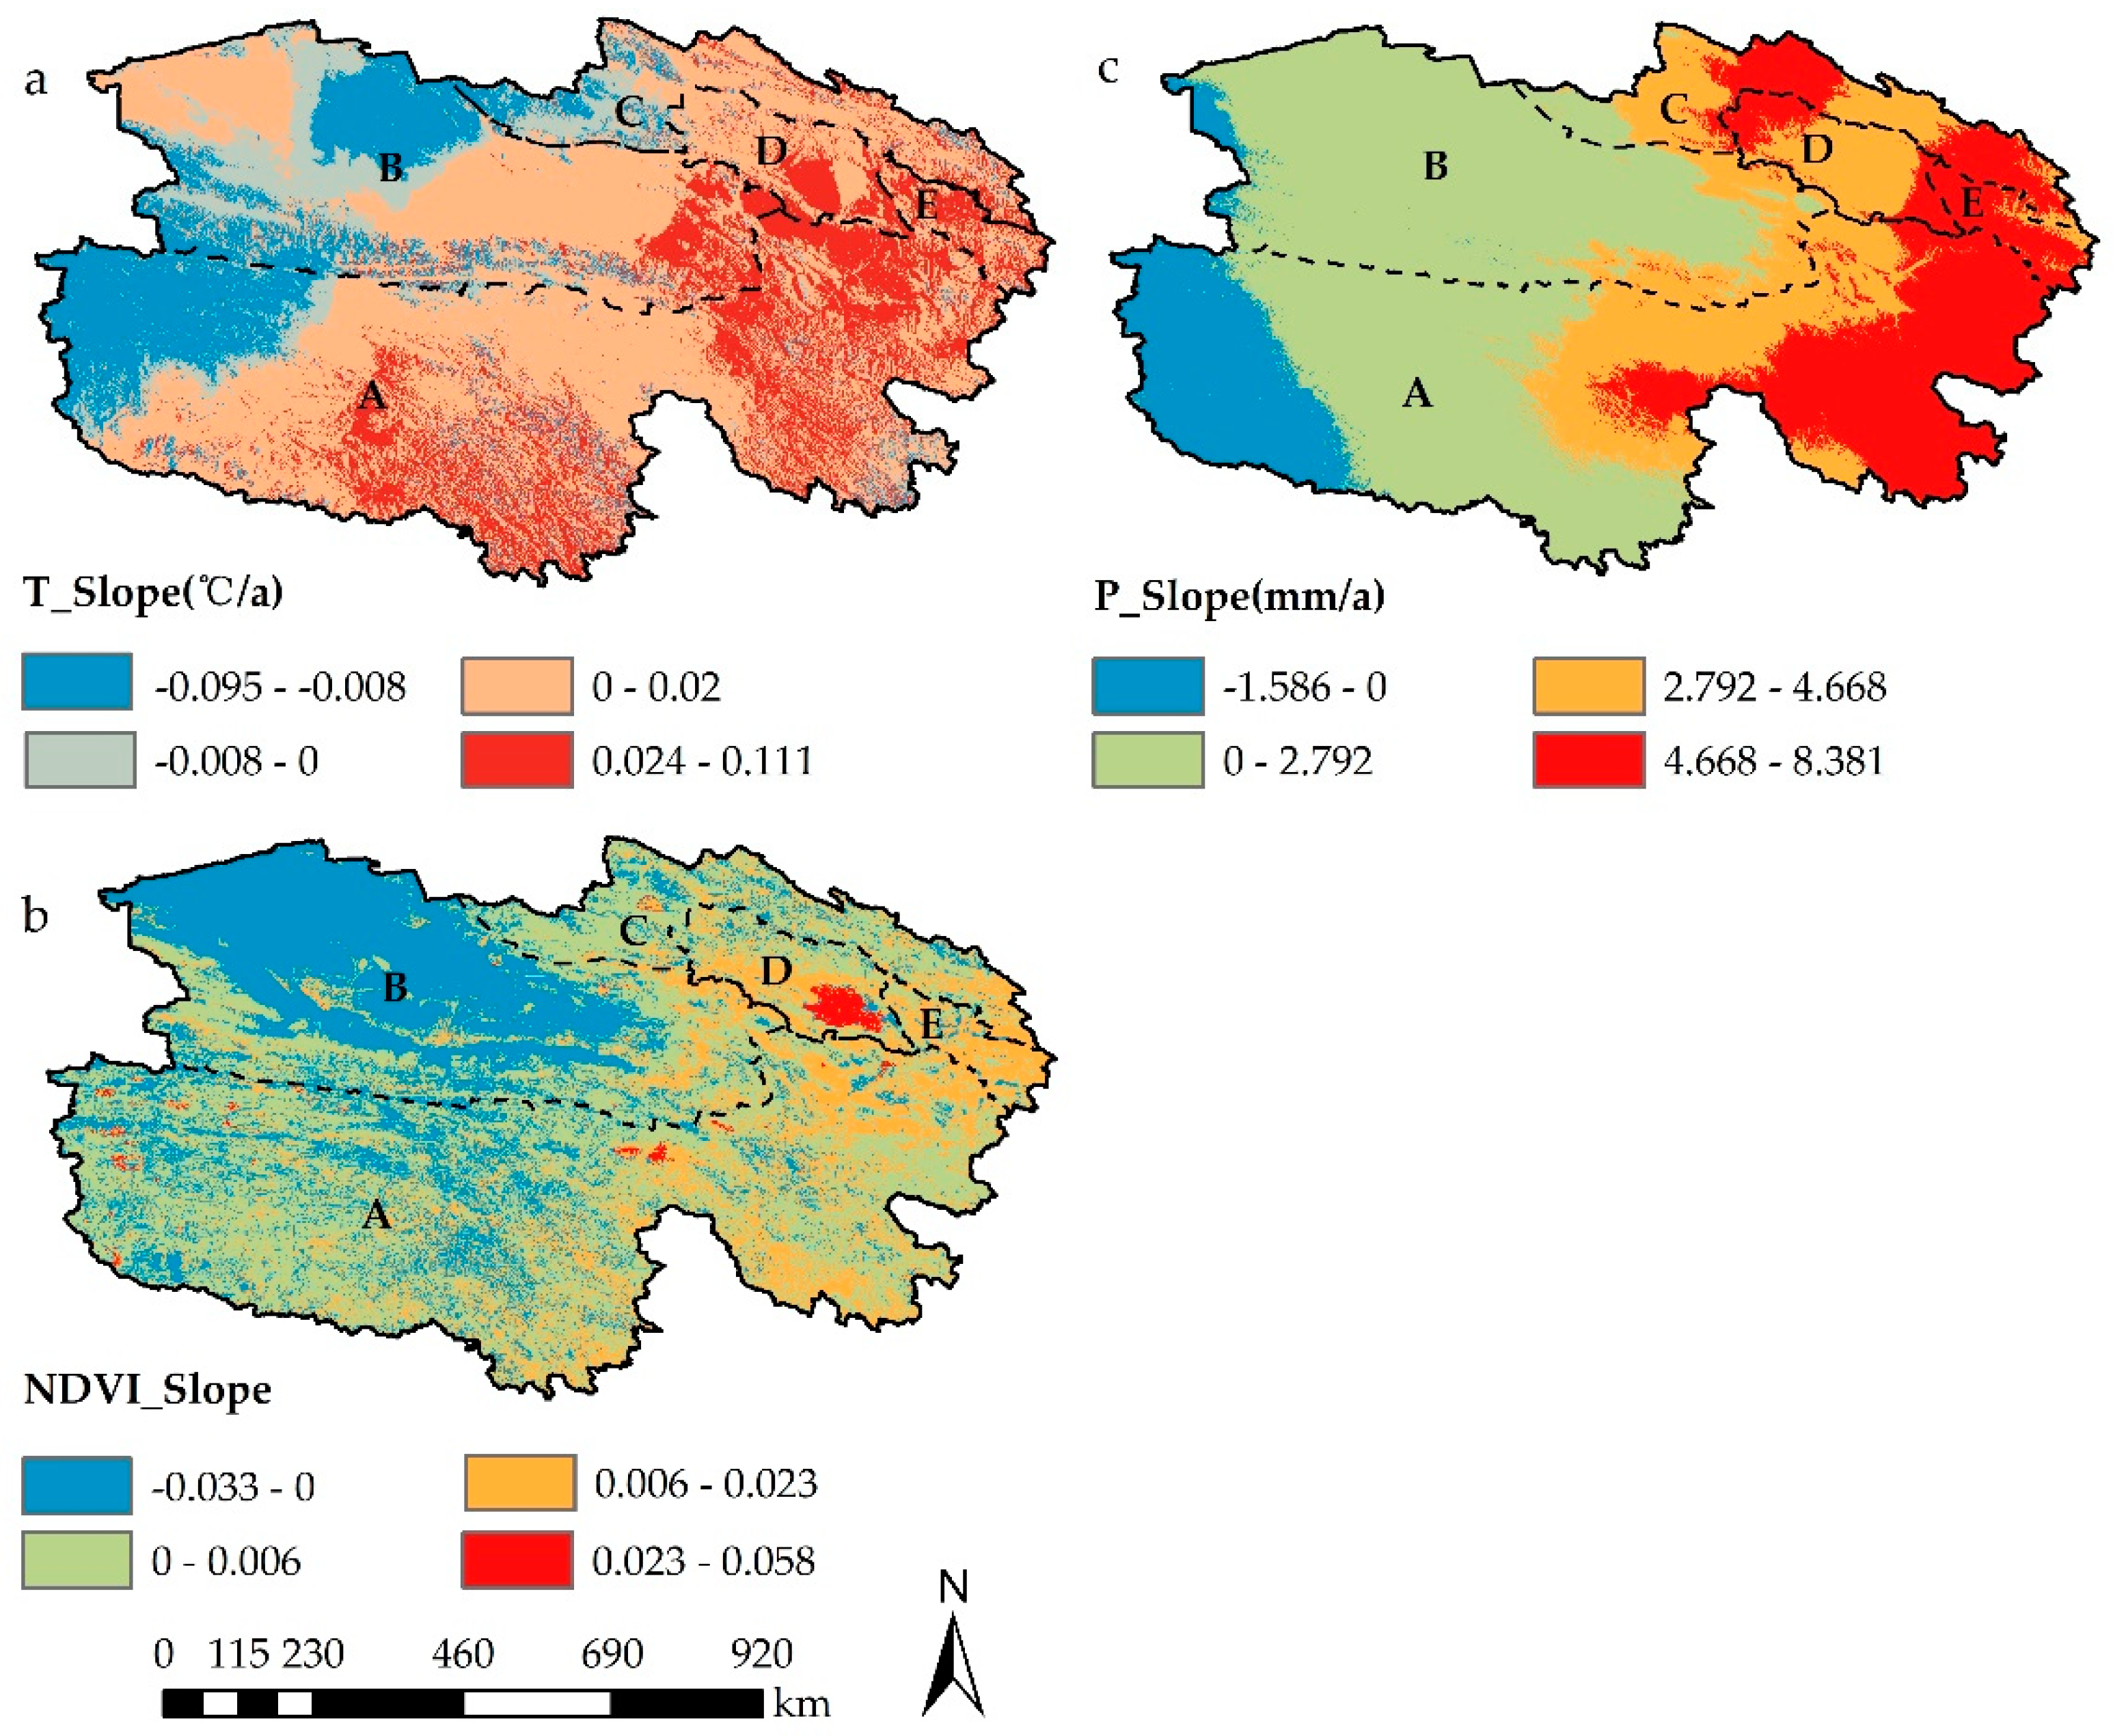
3.1. Temporal and Spatial Characteristics of T, P, and NDVI

The spatial distribution characteristics of T, P and NDVI are shown in Figure 2a–c. In the study region, the ranges of T, P, and NDVI were 20.42–9.22 °C, 17.7–802.03 mm, and 0–0.86 (Figure 2a–c). The T in the Qaidam Basin and the Hehuang regions were relatively high, while the T in the Qilian Mountain and the Three-River Source regions were relatively low (Figure 2a). P and NDVI gradually decreased from the Three-River Source in the southeast to the Qaidam Basin(Figure 2b,c) in the northwest.
As shown in Figure 2d,e,f, T and P increased at a rate of 0.07 °C/decade and 24.73 mm/decade, respectively, from 2000 to 2020, but the increase was not significant (p > 0.05), while NDVI increased significantly at a rate of 0.02/decade (p < 0.01). By further analysis of the correlation between T and P with NDVI, we found that the P and NDVI were significantly correlated (p < 0.05), and precipitation determined the spatial distribution of NDVI (Figure 2b,c). Due to the significant terrain differences in Qinghai Province, although the overall increase in T and P was not significant, the trend of warming and humidification was still obvious in most regions (Figure 3b,c), which may be the climatic reason for the significant increase in NDVI. In addition, the ecological projects implemented by the Chinese government have a lot to do with the increase in NDVI. In 2003, the large-scale implementation of the “returning grazing land to grassland” ecological project began, and NDVI increased rapidly in 2004 (Figure 2c).

3.2. Characteristics of Interannual Variations in ET

Figure 4 shows that average ET variations in the study region during 2000–2020. ET has ranged from 405.88 to 549.3 mm in Qinghai Province over the 21 year period. The multi-year mean ET was 496.56 mm. The lowest and highest ET were 405.88 and 549.3 mm, occurring in 2000 and 2017, respectively. The average annual ET showed a significant increasing trend (R2 = 0.43, p < 0.01) and increased at a rate of 37.26 mm/decade. In addition, the relative rate of average level distance showed that the annual average change of ET ranged from −18% to 11%. Before 2009, the rate of change was primarily negative, and after 2009, it was mostly positive.

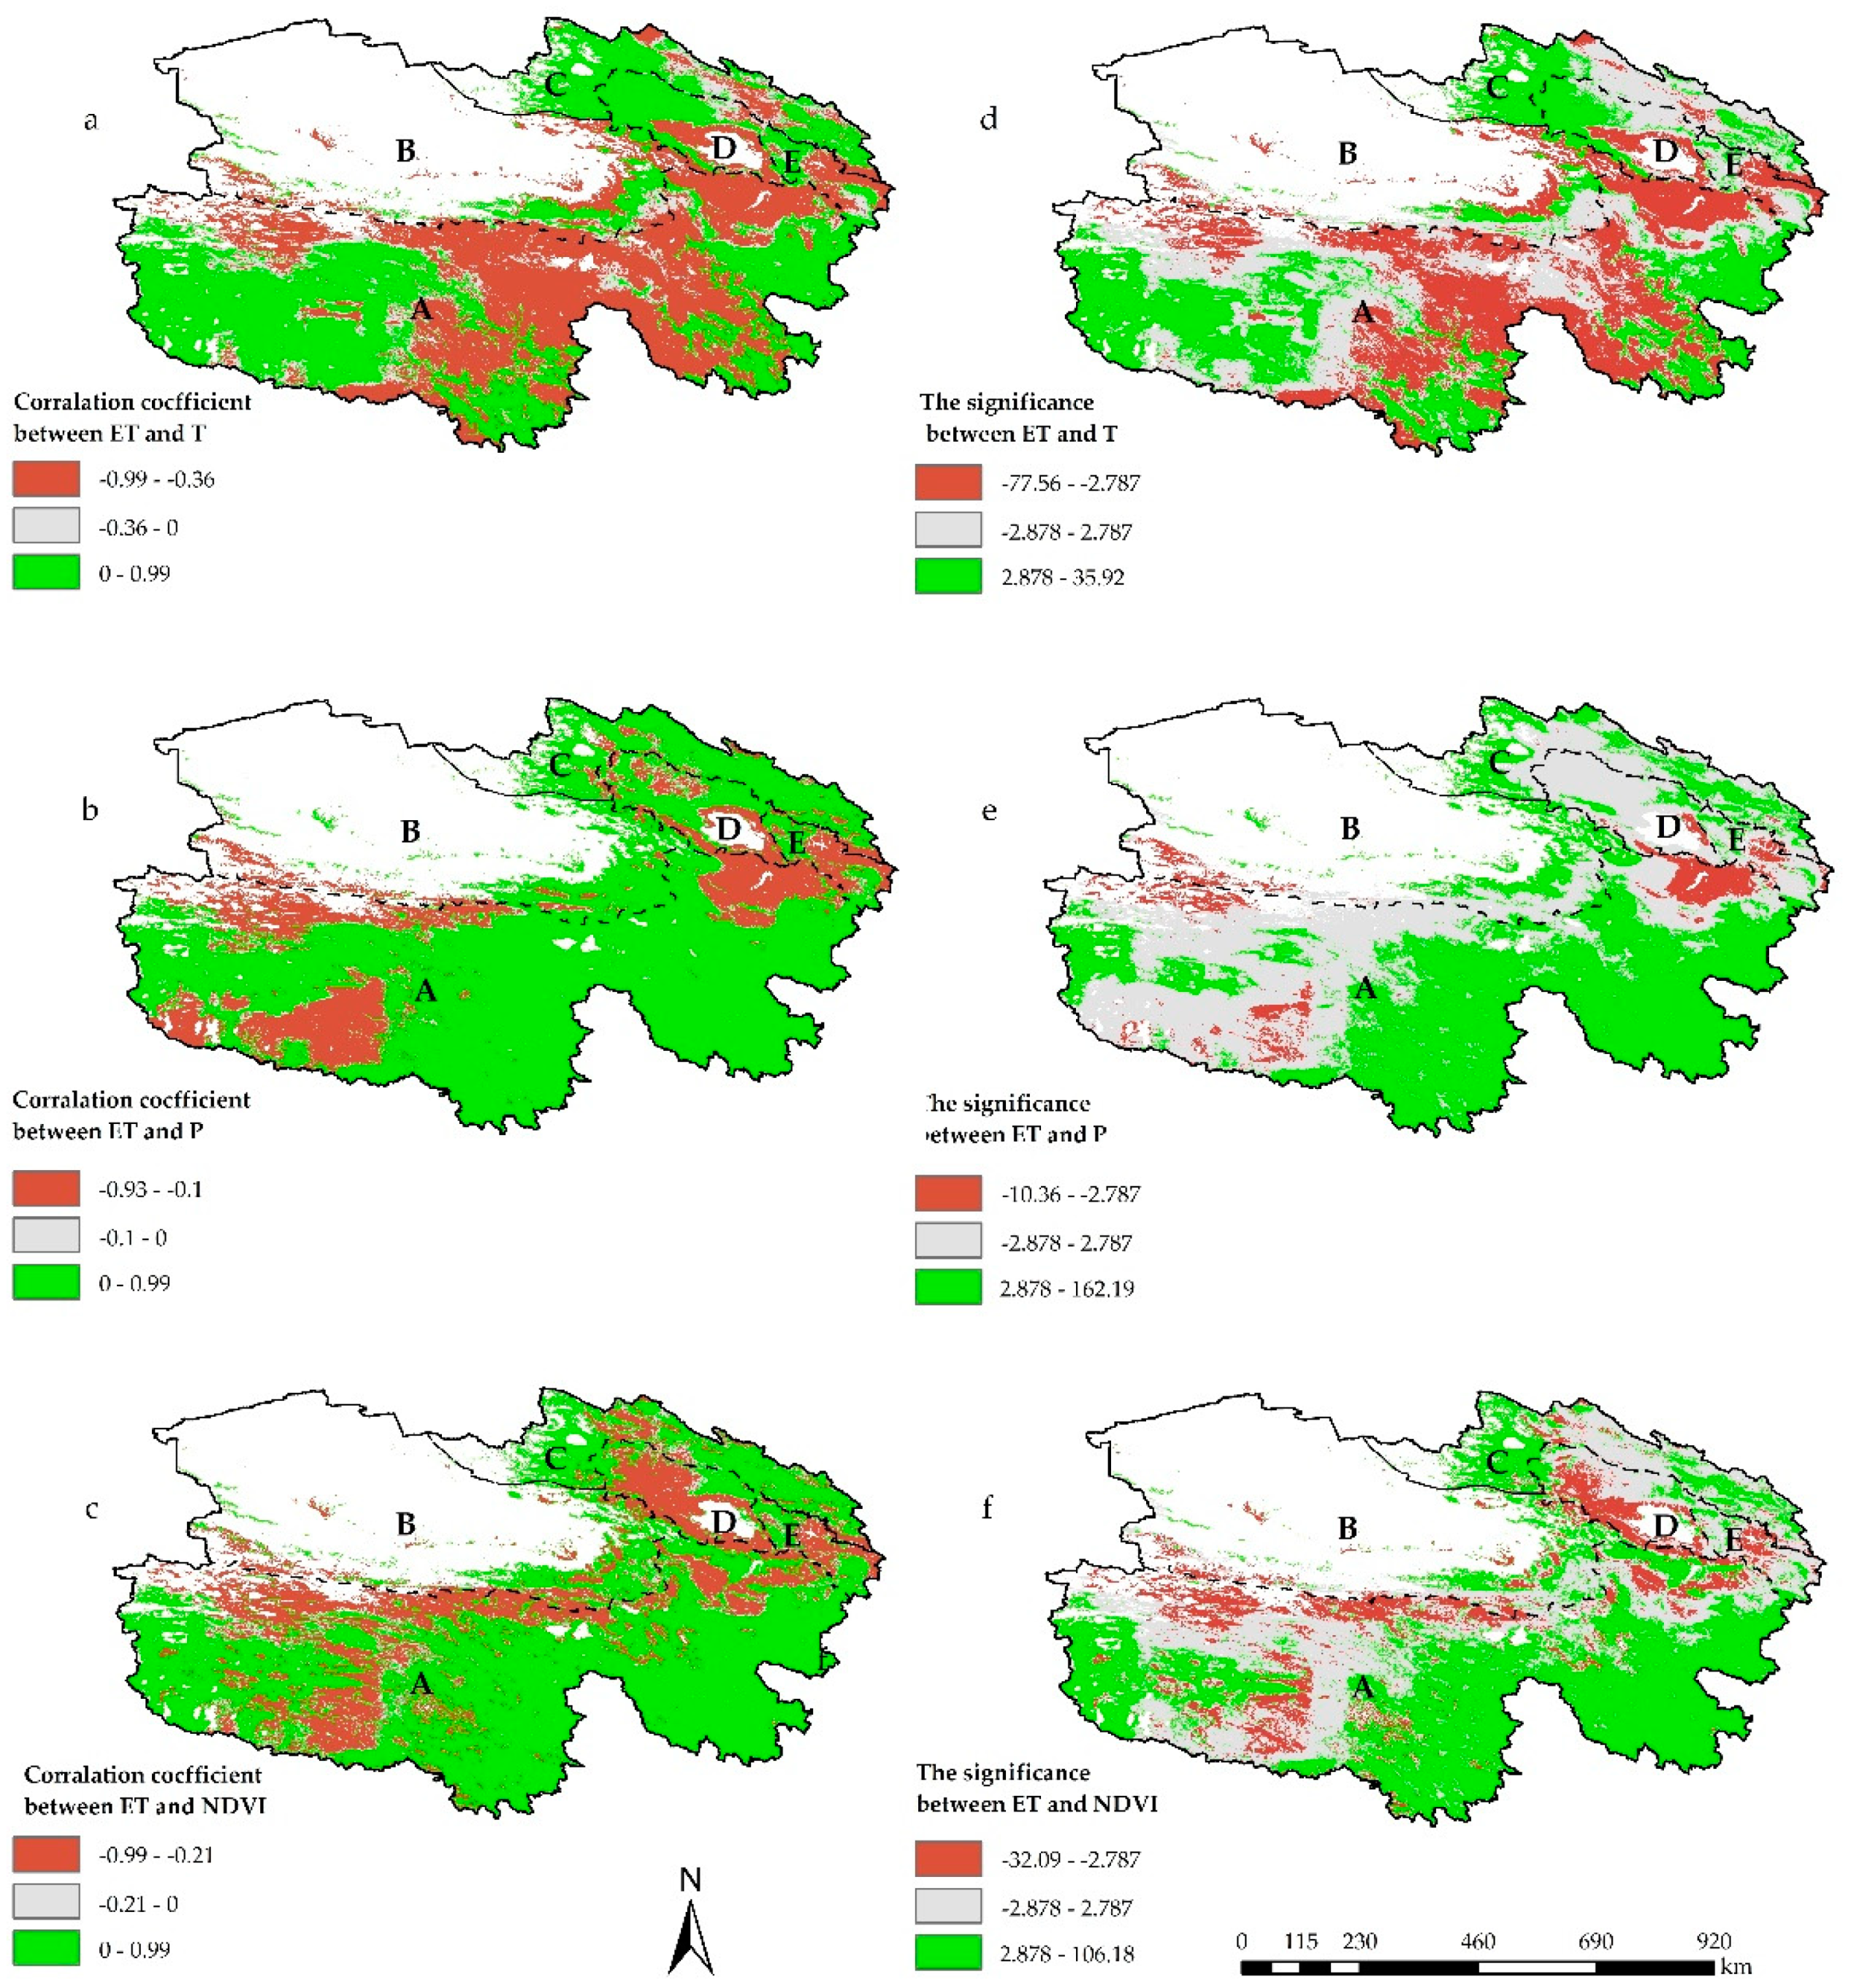
3.3. Characteristics of Spatial Variations in ET

Figure 5a shows the spatial distribution of ET in Qinghai Province during 2000–2020. It is not difficult to see that ET presented a spatial difference that was high in the southeast and low in the northwest. The annual average ET value in space was between 110.49–684.08 mm. The ET was higher in the Three-River Source region and the middle-eastern part of the Qilian Mountain region, while the ET in the western part of the Three-River Source, Qaidam, and Hehuang region was the lowest.
Figure 5b illustrates the spatial change trend of ET, with slope trend value ranging from −8 to 34 mm/a, and ET gradually increasing from the southwest to the northeast. In general, most regions showed a significant increasing trend, except for the southwestern edge of the Three-River Source region (Figure 4a), which showed a decreasing trend (−8–0 mm/a). The region with the largest increase in ET was recorded in Haidong City in the Hehuang region (9–34 mm/a).
We used box plots to compare the ET per unit region of the five ecological function zones from 2000–2020. (Figure 6). In terms of the ET patterns according to these five divisions, the highest value was 2113.44 mm/km2 in the Three-River Source region, which was between 1882.36 to 2362.73 mm/km2, and the lowest value 395.05 mm/km2 in the Qaidam Basin region, which was between 306.8–448.68 mm/km2. The unit region ETs of the Qilian Mountain, around Qinghai Lake, and Hehuang region were 395.05 mm/km2, 1690.29 mm/km2, 2113.44 mm/km2, respectively. On the whole, the differences were significant, showing a distribution pattern in which, the south was higher than the north and the east was higher than the west.

4. Discussion

4.1. Comparison with Existing Research Results on the PLATEAU

This research used MODIS16 data to calculate the ET value of Qinghai Province, and the results showed that there is a significant increasing ET trend with a rate of 3.48 mm/a, which is much higher than that in China [41], and the source of the Yellow River Basin [42], with 1.23 mm/a, and 0.44 mm/a, respectively. It shows that the response of the Plateau to climate change may be higher than that of other regions [18,43].
According to statistics (Table 2), the average annual ET on the Plateau varies between 320–500 mm/a, and the results of this study are within this range. However, due to factors, such as high downward shortwave radiation flux inputs from the Global Modeling and Assimilation Office [44], the estimate based on MODIS16 data (450–500 mm/a) [45] will be higher than the ET combined with the measured and satellite remote sensing data value (350–380 mm/a) [4,44,46,47], with calculated differences between 118–146 mm/a. Song et al. [11] estimated the MODIS16 ET data and obtained a similar gap (111.1 mm/a). In addition, MODIS16 data can reflect the spatial distribution and change pattern of ET on the Plateau; the region where ET decreased was mainly in the Tibet Autonomous Region, while the region where ET increased was mainly in Qinghai Province [44,45,46,47]; the spatial distribution of ET decreased from the southeast to the northwest, and the spatial change was just the opposite, decreasing in the southwest and increasing in the northeast. These results show that although the current research methods can show similar spatial patterns, there are significant differences in the magnitude and interannual variation of ET, and different data sources and calculation methods have considerable uncertainty on the ET and time variation of the Qinghai Tibet Plateau. Therefore, an integrated ET product is needed to take advantage of the complementary advantages of each ET data set [48].
Among the five ecological function regions, the average annual ET of the Three-River Source and around Qinghai Lake regions were 513.59 mm/a and 444.39 mm/a, respectively, which were close to the current research results [50,51,56,57]. The average annual ET of the Qilian Mountain was 460.73 mm/a, which was between the existing research results [54,55]. The average annual ET of the Qaidam region was 428.18 mm/a, which was inconsistent with existing research [52,53]. The dry and hot climate leads to a shallow vegetation index in the Qaidam region, and the MODIS16 data lack many ET values in this region. In addition, the resolution of remote sensing data is too coarse to capture the ET spatial changes in smaller areas [59]. This leads to a significant error with the actual ET value, and more field measurements need to be used for further verification in future studies. Due to the different study areas, the average annual ET in the Hehuang area was 470.32 mm/a, which was higher than the results of Zhang et al. [58].

4.2. Drivers of ET Space Changes

ET results from the complex interaction between climatic factors and environmental factors. The growth rates of T, P, and NDVI in Qinghai Province are 0.07 °C/decade (Figure 2d), 24.73 mm/decade (Figure 2e), and 0.02/decade (Figure 2f), and they spatially present distribution patterns similar to ET (Figure 2a–c). The correlation coefficients of T, P, and NDVI with ET in Qinghai Province are −0.99 to 0.99, −0.93 to 0.99, and −0.99 to 0.99, respectively (Figure 2a–c). Climate factors and environmental factors are positively and negatively correlated with ET, T and ET positively correlated regions are mainly distributed in the northern, eastern, and southwestern margins of Qinghai Province; negatively correlated regions are mainly distributed in the middle and southern parts of Three-River Source (Figure 2a). P and ET positively correlated regions are distributed in most regions of Qinghai Province; negatively correlated regions are mainly distributed in the central and southwest of Qinghai Province with few regions. The relative distribution characteristics of NDVI and ET are essentially the same as P. In general, the distribution patterns of T, P, and NDVI determine the spatial distribution of ET in Qinghai Province.
The results of the significance test showed that T, P, and NDVI had an extremely significant positive or negative correlation (p < 0.01) with ET (Figure 7d–f). In the T, extremely significant correlation region between ET and T was 65.27% (Figure 7d), positive correlation regions were mainly distributed in the northern and southwestern of Qinghai Province where the altitude is higher (Figure 1), and the T is lower (Figure 2a). In contrast, in the humid southeast region (Figure 2b), the T was lower than ET showed a very significant negative correlation. P, NDVI, and ET were mainly spatially highly significant positive correlations (Figure 7e,f), with significant correlation regions of 62.52% and 55.41%, respectively, mainly distributed in the southeastern and northern regions of Qinghai Province. This shows that T, P, and NDVI changes were the main driving forces for increasing ET. The T had the most significant impact on ET, which was consistent with previous research results [2,60,61].
Among the five ecological function zones, the driving factors of ET are similar to those of Qinghai Province. The Three-River Source region is in the hinterland of the Plateau. Most regions are high-cold regions above 4600 m, with a unique natural environment and climatic conditions. ET showed a changing pattern during the study period in which the west decreased and increased in the east, mainly due to the “decrease–increase” change pattern of T, P, and NDVI from west to east. In addition, the main reason for the decrease in ET in the southwestern part of the Three-River Source region is the drought caused by the increase in T and the decrease in P [62].
The Qaidam basin region is far from the monsoon climate zone [63], surrounded by mountains, with low P and vegetation coverage (Figure 2b,c), and high T. Although both climatic and environmental factors show an upward trend, the increase in T affects ET. The influence is more vital than other factors, and T is the main reason for the increase in ET [47].
The T in the western part of the Qilian Mountain dropped slightly, P increased, and the climate changed from warm and dry to warm and humid [64], which was the main reason for the increase in ET. The increase in ET in the central and eastern part of the Qilian Mountain region may be due to the combined effects of climate change, vegetation change, and human activities [60]. In addition, the spatial variation of other climatic factors, such as wind speed, is also an essential factor of ET variation in the Qilian Mountain region [65].
The western region around Qinghai Lake has exposed rocks and high altitude, while high mountain regions show strong sensitivity to T [66], and T rise is the main reason for the increase in ET. P and NDVI have increased in the past 20 years, but P can only explain 16.68% of the region (Figure 7b,e). NDVI and ET are mainly negatively correlated, indicating that P has little effect on the growth of ET in the region around Qinghai Lake; the improvement of vegetation conditions restrained the growth of ET to a certain extent.
Although the average annual ET in the Hehuang region is not the largest in Qinghai Province, the average annual growth rate of ET is the largest. There may be several reasons; the Hehuang region is located at a low altitude in the eastern part of Qinghai Province, with better hydrothermal conditions, which are favorable for the evaporation of vegetation and soil. In the past 21 years, T, P, and NDVI in this region have increased the most, reaching 0–0.11 °C/a, 2.79–8.38 mm/a, and 0.006–0.023/a, respectively, and these factors were significantly positively correlated with ET (Figure 7d,e). This may partly explain the rapid growth of ET. The correlation between T, P, NDVI, and ET of more regions in the Hehuang was not significant (Figure 7d,e), accounting for 49.01%, 67.96%, and 49.19% of the region of Hehuang, respectively. ET may also be affected by other factors. Some studies have showed that the contribution rate of human activities to regional hydrological changes in the Hehuang region reached 64.54% [55]. Further in-depth research is needed in the future.
In general, ET in the Three-River Source, Qaidam Basin, and Qilian Mountain regions is driven by T, P, and NDVI, with 54.66–66.51%, 46.89–59.97%, and 51.68–66.34% in the regions, respectively. ET in the Hehuang region and the region around Qinghai Lake is driven by T and NDVI, which are 65–65% and 49.47–56.95% in these regions, respectively. However, the impact of P on ET in these regions is small, only 32% and 17%. In the southwest of Qinghai Province, there is an “evaporation paradox” in the Three-River Source region.

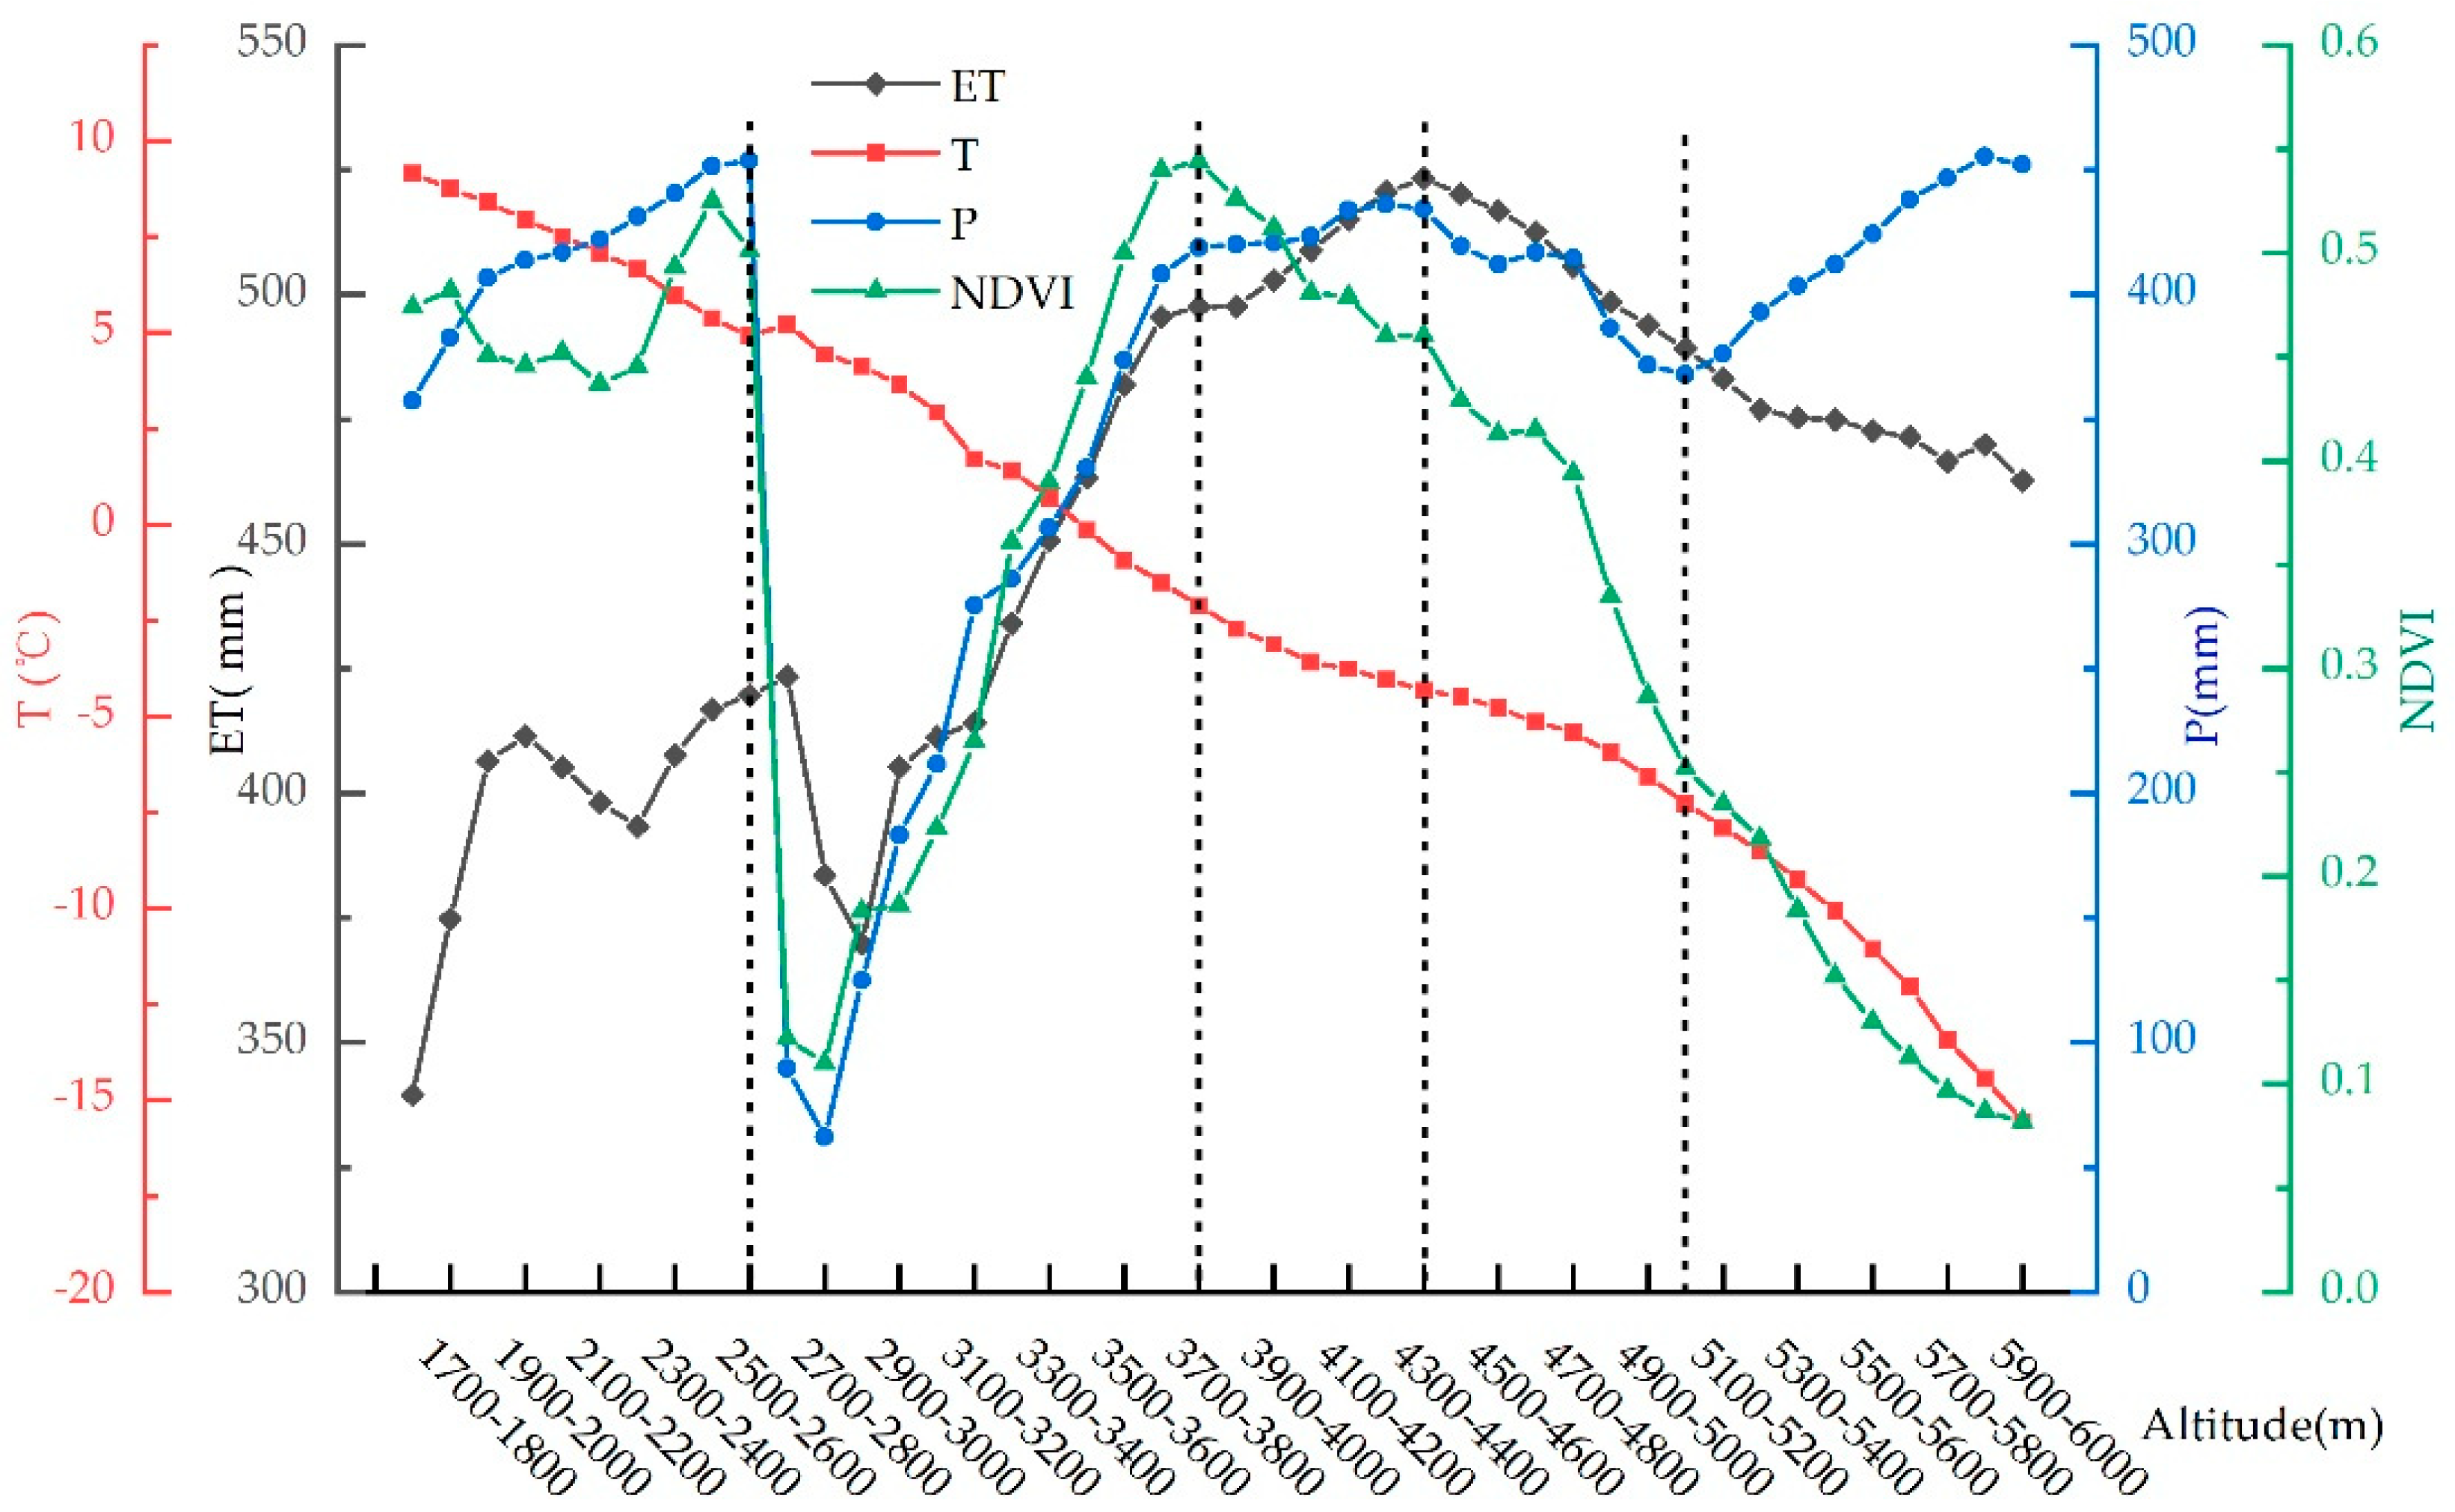
4.3. Altitude Effect of ET Changes

The altitude is one of the critical factors that affects the heterogeneity pattern of ET [67,68]. It affects environmental variables, such as NDVI [69], by affecting climatic conditions, such as T and P, thereby impacting ET. The Plateau was found to have a complex topography, and its average altitude was much higher than that of the surrounding regions at the same latitude. Therefore, it was crucial to analyze the relationship between the altitude gradient and T, P, NDVI, and ET.
Table 3 shows that T was the main factor affecting the change of ET on the elevation gradient in Qinghai Province. T has a significant negative correlation with ET. When the T rises by 1 °C, ET decreased by 5.16 mm (R2 = 0.53, p < 0.01), followed by P, which is significantly positively correlated with ET, with P increasing by 1 mm and ET increasing by 0.23 mm (R2 = 0.21, p < 0.01); the correlation between NDVI and ET is not significant (R2 = 0.01, p > 0.05). The complexity of the overall terrain of Qinghai Province, changes in T, P, and other factors show significant regional differences (Figure 2), resulting in the non-significant dependence of NDVI on altitude.
The distribution characteristics of ET in Qinghai Province were evident on the altitude gradient (Figure 8). The ET value in high-altitude regions was significantly higher than in low-altitude regions. The region with the lowest altitude has the smallest ET, which was 339.51 mm, and the highest ET value appears on the 4300–4400 m altitude gradient, which was 523.29 mm. Meanwhile, ET increased significantly with the increase in altitude; when the altitude increased by 100 m, ET increased by 2.84 mm (R2 = 0.55, p < 0.01). Previous studies on China’s Hengduan Mountains and Southwest Mountains also supported the results of other research [70,71], in that ET has a significant positive correlation with altitude. However, there were still differences in the changes of ET on different altitude gradients. Chen et al. found that altitude above 4000 m had a negative and significant correlation with reference ET [68]. This study also found that ET above 4400 m had the same performance (R2 = 0.95, p < 0.01, Table 4). In order to further quantify the influence of altitude on ET, Qinghai Province was divided into five intervals on the altitude gradient (Figure 8) for research.
Below the altitude of 2600 m, the T kept dropping, but the annual average T was above 4.93 °C, and the P was more and continuously increasing, which was roughly consistent with the changing trend of ET, while the fluctuation of NDVI was very pronounced (Figure 8). It may be because this region was mainly distributed in the eastern agricultural region, and the vegetation types are main crops, and crop ET and the climatic factors affecting it are quite different on the seasonal and annual time scales [72]. Correlation analysis showed that P and ET were significantly positively correlated (R2 = 0.78, p < 0.01, Table 4), T also had a particular influence on ET (R2 = 0.5, p < 0.01), and the correlation between NDVI and ET was not significant. Research by Liu et al. showed that the maximum T (Tmax) was the dominant driving factor of ET under the 2800 m altitude gradient of the Plateau [73], which was different from the results of this paper.
On the altitude gradient of 2600–3800 m, ET increased the fastest, which was roughly the same as the changing trend of P and NDVI. Although the T kept decreasing, it stayed above 0 °C, and the P also increased rapidly, which was beneficial to vegetation growth, and NDVI reached its maximum value (Figure 8), becoming the main driving factor of ET (R2 = 0.86, p < 0.01, Table 4). Consistent with the results of previous studies [73], T and P also had a more significant effect on ET (R2 > 0.8, p < 0.01). It is worth noting that ET, T, P, and NDVI had abrupt changes on the altitude gradient of 2600–2700 m (Figure 8). According to remote sensing images, this region was in the Qaidam Basin with an extremely arid climate; T and ET had a significant positive correlation (R2 = 0.99, p < 0.01).
The altitude gradient of 3800–4400 m was a significant response region for the climate transition from warm and dry to warm and humid [74]. There was more P, which slowly increased with the increase in altitude, and the fluctuation of NDVI decreased (Figure 8). The influencing factors of ET are T, P, and NDVI (R2 > 0.9, Table 4), of which T promotes ET the most (R2 = 0.98, p < 0.01, Table 4). Previous studies have shown that the high-altitude regions of the Plateau below 5000 m have apparent warming trends [75], leading to regional vegetation greening [76], and climate warming also leads to ET of cryospheric hydrological systems, such as glaciers, frozen soil, snow, and lake ice. The study of Feng’s hydrological effects on the glacial permafrost on the Plateau shows that the impact of glacier degradation on ET reaches 14.69 ± 12.82 mm [77]. The effects of these climate changes have promoted the continuous rise of ET on the 3800–4400 m altitude gradient and reached its highest value.
On the altitude gradient of 4400–5100 m, climate and environmental factors (T, P, and NDVI) decreased with the increase in altitude (Figure 8), which limits ET and causes ET to drop continuously (R2 > 0.9, p < 0.01, Table 4). The T has the most significant influence on ET changes (R2 = 0.96, p < 0.01, Table 4). These results were also verified by measuring the altitude gradient of Qinghai Lake and the scale of the ecosystem [56], indicating that the dominant factor of ET changes with the increase in altitude to the limit of T conditions.
Above an altitude of 5100 m, the ET change was consistent with the changing trend of T and NDVI. The T dropped below −7.89 °C, the vegetation normalization index continued to drop to the lowest level, close to 0.1, and the P increased to the highest value (Figure 8). Due to the high altitude and shallow vegetation coverage, the T was the lowest, although there was more P. P mainly existed in the form of ice and snow. The ability to absorb solar radiation was weakened and soil moisture cannot be effectively converted into evaporation. This may be one of the factors limiting ET [45]. The results showed that the main driving factor of ET was T (R2 = 0.88, p < 0.01, Table 4), and P and T also had a certain impact on ET (R2 > 0.8, p < 0.01, Table 4).
In summary, the T was the main driving factor for ET on the altitude gradient in Qinghai Province, followed by P, and NDVI had no significant impact on ET. At the same time, the driving variability of ET on the altitude gradient was apparent, changing from P driving to NDVI and T driving with increasing altitude, which was roughly the same as the research results of the Mongolian Plateau and Qinghai Lake [56,78]. Interestingly, ET has prominent distribution characteristics affected by T on the altitude gradient (Figure 9): In regions where the average annual T was less than −4.32 °C and the altitude was less than 4400 m, ET rose significantly (R2 = 0.86, p < 0.01). In regions where the annual average T was higher than −4.32 °C, and the altitude was higher than 4400 m, ET decreased significantly (R2 = 0.83, p < 0.01). However, P and NDVI had no similar performance. The correlation between P and ET on an altitude gradient was only 0.2 (p < 0.01), and the correlation between NDVI and ET was not significant (p > 0.05).
This paper discussed the spatial distribution and driving factors of ET in Qinghai Province from 2000 to 2020, studied the driving factors of ET in Qinghai Province and five ecological function regions, and quantified the changes and effects of ET on the altitude gradient (Figure 10), and obtained good research results. However, this study did not quantify the spatial driving factors of ET in Qinghai Province. Other natural factors, such as net radiation, wind speed, soil moisture, and the effects of different vegetation types on ET have also not been discussed. At the same time, human activities can promote and inhibit ET [60]. The impact of the large-scale implementation of ecological projects in Qinghai Province by the Chinese government, such as returning farmland to forests, natural forest protection, construction of the “Three Norths” shelter forest system, returning grazing land to grasslands, and land-use changes caused by rapid urbanization in the Hehuang region, are still unknown. By 2016, Qinghai had become the province with the most ecological engineering projects in China, and the accumulated capital investment in the past 21 years has exceeded RMB 60 billion. In addition, the accuracy of MODIS16 data in areas with low vegetation coverage needs to be further verified on seasonal and more minor scales with the measured ET data.

5. Conclusions

ET is still one of the largest unknowns in the terrestrial ecological cycle. We used MODIS16 ET data to obtain the spatiotemporal changes and driving factors of ET in Qinghai Province. MODIS16 data can accurately reflect the spatial distribution, annual changes, and range of ET. The distribution of ET decreased from southeast to northwest, and the change of ET increased from southwest to northeast during the study period. T is the main factor of the annual average ET change in Qinghai Province, followed by P and NDVI, which account for 65.27%, 62.52%, and 55.41%, respectively. In the five ecological function zones, the driving factors of ET are similar to those of Qinghai Province as a whole. However, in Hehuang and regions around Qinghai Lake, the average annual ET change is mainly affected by T and NDVI, and the driving region of P on ET is only 32% and 17%. The “evaporation paradox” exists in the Three-River Source region in southwestern Qinghai Province. ET is highly dependent on elevation, and there is significant heterogeneity in the driving factors of ET across the altitude gradient: P is the driving factor for 1700–2600 mm, NDVI is the driving factor for 2600–3800 mm, and the driving factor for 3800–6000 m is T. In addition, there is a significant positive correlation between ET and T in regions with an average annual T of less than −4.32 °C and an altitude of less than 4400 m. There was found to be a significant negative correlation between ET and T.
This research can provide a scientific basis and practical support for implementing differentiated water resource management policies and the sustainable development of ecosystems in Qinghai Province and different regions. The high-altitude regions in the west of the Three-River Source, Qilian Mountain, and Qinghai Lake have few human activities, and are mainly affected by climatic factors. We should be alert to the risk of vegetation degradation caused by temperature rise and the risk of increased evapotranspiration and water consumption caused by melting glaciers. By establishing prohibited and restricted development zones, the pilot work in Three-River Source, Qilian Mountain, and Qinghai Lake National Park has controlled the livestock carrying capacity of pastures and reduced the impact of the increase in cultivated land on local water distribution and climate environment. The Hehuang region provides most of the agricultural products in the province, and urbanization and farmland water resource management are the core measures to optimize the regional eco-hydrological system. The Qaidam Basin region is the growth core of industrial development in Qinghai Province. Although the evapotranspiration per unit area is not large, the climate is arid, and the ecosystem is extremely fragile. It is necessary to prevent the impact of industrial production and oasis development on the regional water balance.

Author Contributions

Conceptualization, methodology, code, data curation, investigation, formal analysis, writing—original draft: Z.S.; supervision, writing—review and editing, supervision, funding acquisition: Q.F. and S.C.; writing—review and editing: Z.G. and G.C.; visualization, Z.W. All authors have read and agreed to the published version of the manuscript.

Funding

This study was funded by the Natural Science Foundation of Qinghai Province (2018-ZJ-905).

Institutional Review Board Statement

Not applicable.

Informed Consent Statement

Not applicable.

Data Availability Statement

Publicly available data sets were analyzed in this study. This data can be found here: https://search.earthdata.nasa.gov/ (accessed on 2 June 2021), http://www.gscloud.cn/ (accessed on 20 May 2021), http://www.geodata.cn (accessed on 27 June 2021).

Acknowledgments

Acknowledgement for the data support from “National Earth System Science Data Center, National Science & Technology Infrastructure of China. (http://www.geodata.cn, accessed on 27 June 2021)”. The authors would like to thank three anonymous reviewers for their valuable comments that improved the quality of this manuscript.

Conflicts of Interest

The authors declare no conflict of interest.

References

  1. Parmesan, C. Ecological and evolutionary responses to recent climate change. Annu. Rev. Ecol. Evol. Syst. 2006, 37, 637–669. [Google Scholar] [CrossRef] [Green Version]
  2. Yin, Y.; Wu, S.; Zhao, D.; Zheng, D.; Pan, T. Impact of climate change on actual evapotranspiration on the Tibetan Plateau during 1981–2010. Acta Geogr. Sin. 2012, 67, 1471–1481. [Google Scholar] [CrossRef]
  3. Shukla, J.; Mintz, Y. Influence of Land-Surface Evapotranspiration on the Earth’s Climate. Science 1982, 215, 1498–1501. [Google Scholar] [CrossRef] [PubMed]
  4. Jung, M.; Reichstein, M.; Ciais, P.; Seneviratne, S.I.; Sheffield, J.; Goulden, M.L.; Bonan, G.; Cescatti, A.; Chen, J.; de Jue, R.; et al. Recent decline in the global land evapotranspiration trend due to limited moisture supply. Nature 2010, 467, 951–954. [Google Scholar] [CrossRef]
  5. Kingston, D.G.; Todd, M.C.; Taylor, R.G.; Thompson, J.R.; Arnell, N.W. Uncertainty in the estimation of potential evapotranspiration under climate change. Geophys. Res. Lett. 2009, 36, 20403. [Google Scholar] [CrossRef] [Green Version]
  6. Cai, J.; Wang, Y.; Liu, Y. Feature Parameters of Evapotranspiration Estimation Model for Winter Wheat and Summer Maize Based on Lysimeter Monitoring System. Trans. Chin. Soc. Agric. Mach. 2021, 52, 285–295. [Google Scholar]
  7. Mu, Q.; Zhao, M.; Running, S.W. Improvements to a MODIS global terrestrial evapotranspiration algorithm. Remote Sens. Environ. 2011, 115, 1781–1800. [Google Scholar] [CrossRef]
  8. Bella, C.M.D.; Rebella, C.M.; Paruelo, J.M. Evapotranspiration estimates using NOAA AVHRR imagery in the Pampa region of Argentina. Int. J. Remote Sens. 2000, 21, 791–797. [Google Scholar] [CrossRef]
  9. Sumner, D.M.; Jacobs, J.M. Utility of Penman-Monteith, Priestley-Taylor, reference evapotranspiration, and pan evaporation methods to estimate pasture evapotranspiration. J. Hydrol. 2005, 308, 81–104. [Google Scholar] [CrossRef]
  10. Su, Z. The Surface Energy Balance System (SEBS) for estimation of turbulent heat fluxes. Hydrol. Earth Syst. Sci. 2002, 6, 85–99. [Google Scholar] [CrossRef]
  11. Song, L.; Zhuang, Q.; Yin, Y.; Zhu, X.; Wu, S. Spatio-temporal dynamics of evapotranspiration on the Tibetan Plateau from 2000 to 2010. Environ. Res. Lett. 2017, 12, 014011. [Google Scholar] [CrossRef]
  12. Zhang, K.; Kimball, J.S.; Running, S.W. A review of remote sensing based actual evapotranspiration estimation. Wiley Interdiscip. Rev. Water. 2016, 3, 834–853. [Google Scholar] [CrossRef]
  13. Liaqat, U.W.; Choi, M. Accuracy comparison of remotely sensed evapotranspiration products and their associated water stress footprints under different land cover types in Korean peninsula. J. Clean. Prod. 2017, 155, 93–104. [Google Scholar] [CrossRef]
  14. Xu, T.; Guo, Z.; Xia, Y.; Ferreira, V.G.; Liu, S.; Wang, K.; Yao, Y.; Zhang, X.; Zhao, C. Evaluation of twelve evapotranspiration products from machine learning, remote sensing and land surface models over conterminous United States. J. Hydrol. 2019, 578, 124105. [Google Scholar] [CrossRef]
  15. Ma, Z.; Ray, R.L.; He, Y. Assessing the spatiotemporal distributions of evapotranspiration in the Three Gorges Reservoir Region of China using remote sensing data. J. Mt. Sci. 2018, 15, 2676–2692. [Google Scholar] [CrossRef]
  16. Sun, Z.; Wang, Q.; Ouyang, Z.; Watanabe, M.; Matsushita, B.; Fukushima, T. Evaluation of MOD16 algorithm using MODIS and ground observational data in winter wheat field in North China Plain. Hydrol. Process. Int. J. 2007, 21, 1196–1206. [Google Scholar] [CrossRef]
  17. Cheng, L.; Yang, M.; Wang, X.; Wan, G. Spatial and temporal variations of terrestrial evapotranspiration in the upper Taohe River Basin from 2001 to 2018 based on MOD16 ET data. Adv. Meteorol. 2020, 2020, 3721414. [Google Scholar] [CrossRef]
  18. Wu, G.; Liu, Y.; Zhang, Q.; Duan, A.; Wang, T.; Wan, R.; Liang, X. The influence of mechanical and thermal forcing by the Tibetan Plateau on Asian climate. J. Hydrometeorol. 2007, 8, 770–789. [Google Scholar] [CrossRef] [Green Version]
  19. Kuang, X.; Jiao, J.J. Review on climate change on the Tibetan Plateau during the last half century. J. Geophys. Res. Atmos. 2016, 121, 3979–4007. [Google Scholar] [CrossRef]
  20. Chang, S.; Liu, Y.; Hua, S.; Jia, R. Characteristics of Atmospheric Water Vapor over the Qinghai-Tibetan Plateau in Summer with Global Warming. Plateau Meteorol. 2019, 38, 227–236. [Google Scholar]
  21. Han, C.; Ma, Y.; Wang, B.; Zhong, L.; Ma, W.; Chen, X.; Su, Z. Long-term variations in actual evapotranspiration over the Tibetan Plateau. Earth Syst. Sci. Data 2021, 13, 3513–3524. [Google Scholar] [CrossRef]
  22. Wang, L.; He, X.; Ding, Y. Characteristics and influence factors of the evapotranspiration from alpine meadow in central Qinghai-Tibet Plateau. J. Glaciol. Geocryol. 2019, 41, 801–808. [Google Scholar] [CrossRef]
  23. Zhang, Y.; Ma, Y.; Ma, W.; Wang, B.; Wang, Y. Evapotranspiration Variation and Its Correlation with Meteorological Factors on Different Underlying Surfaces of the Tibetan Plateau. J. Arid Meteorol. 2021, 39, 366–373. [Google Scholar] [CrossRef]
  24. Zhang, F.; Li, H.; Wang, W.; Li, Y.; Lin, L.; Guo, X.; Du, Y.; Li, Q.; Yang, Y.; Cao, G. Net radiation rather than surface moisture limits evapotranspiration over a humid alpine meadow on the northeastern Qinghai–Tibetan Plateau. Ecohydrology 2018, 11, e1925. [Google Scholar] [CrossRef]
  25. Quan, C.; Zhou, B.; Han, Y.; Zhao, T.; Xiao, J. A study of evapotranspiration on the degraded alpine wetland surface in the Yangtze River source region. J. Glaciol. Geocryol. 2016, 38, 1249–1257. [Google Scholar] [CrossRef]
  26. Dai, L.; Cao, Y.; Ke, X.; Zhang, F.; Du, Y.; Guo, X.; Cao, G. Response of reference evapotranspiration to meteorological factors in alpine meadows on the Qinghai-Tibet Plateau. Pratacultural Sci. 2018, 35, 2137–2147. [Google Scholar] [CrossRef]
  27. Li, H.; Zhang, F.; Zhu, J.; Guo, X.; Li, Y.; Lin, L.; Zhang, L.; Yang, Y.; Li, Y.; Cao, G. Precipitation rather than evapotranspiration determines the warm-season water supply in an alpine shrub and an alpine meadow. Agric. For. Meteorol. 2021, 300, 108318. [Google Scholar] [CrossRef]
  28. Wang, R.; He, M.; Niu, Z.G. Responses of Alpine Wetlands to Climate Changes on the Qinghai-Tibetan Plateau Based on Remote Sensing. Chin. Geogr. Sci. 2020, 30, 189–201. [Google Scholar] [CrossRef]
  29. Wen, X.; Zhou, J.; Liu, S.; Ma, Y.; Xu, Z.; Ma, J. Spatio-temporal characteristics of surface evapotranspiration in source region of rivers in Southwest China based on multi-source products. Water Resour. Prot. 2021, 37, 32–42. [Google Scholar] [CrossRef]
  30. Wang, L.; Guo, N.; Wang, W.; Lu, Y.; Sha, S. Actual Evapotranspiration Estimated by TESEBS Model over the Tibetan Plateau. Remote Sens. Technol. Appl. 2017, 32, 507–513. [Google Scholar] [CrossRef]
  31. Li, H.; Wang, C.; Zhang, F.; He, Y.; Shi, P.; Guo, X.; Wang, J.; Zhang, L.; Li, Y.; Cao, G. Atmospheric water vapor and soil moisture jointly determine the spatiotemporal variations of CO2 fluxes and evapotranspiration across the Qinghai-Tibetan Plateau grasslands. Sci. Total Environ. 2021, 791, 148379. [Google Scholar] [CrossRef] [PubMed]
  32. Zhang, H.; Dou, R. Interannual and seasonal variability in evapotranspiration of alpine meadow in the Qinghai-Tibetan Plateau. Arab. J. Geosci. 2020, 13, 968. [Google Scholar] [CrossRef]
  33. Bonan, G.B. Forests and climate change: Forcings, feedbacks, and the climate benefits of forests. Science 2008, 320, 1444–1449. [Google Scholar] [CrossRef] [PubMed] [Green Version]
  34. Tian, X.; Zhang, L.; Zhang, X.; Chen, Z.; Zhao, L.; Li, Q.; Gu, S. Evapotranspiration characteristics of degraded meadow and effects of freeze-thaw changes in the Three-River Source Region. Acta Ecol. Sin. 2020, 40, 5649–5662. [Google Scholar] [CrossRef]
  35. Han, G.; Cao, G.; Cao, S.; Chen, K.; Yang, Y.; Liu, Y. Simulation of Evapotranspiration of Xiaopo Lake and Shaliu River Headwater Wetlands Based on Shuttleworth-Wallace Model. Wetl. Sci. 2019, 17, 519–526. [Google Scholar]
  36. Liu, X.; Gao, X.; Ma, Y. Spatio-temporal Evolution of Vegetation Coverage in Qinghai Province, China during the Periods from 2002 to 2015. Arid Zone Res. 2017, 34, 1345–1352. [Google Scholar] [CrossRef]
  37. Zhang, Q.; Zhang, J.; Sun, G.; Di, X. Research on water-vapor distribution in the air over Qilian Mountain. Acta Meteorol. Sin. 2008, 1, 107–118. [Google Scholar]
  38. Peng, S.; Ding, Y.; Liu, W.; Li, Z. 1 km monthly temperature and precipitation dataset for China from 1901 to 2017. Earth Syst. Sci. Data 2019, 11, 1931–1946. [Google Scholar] [CrossRef] [Green Version]
  39. Han, H.; Bai, J.; Ma, G.; Yan, J. Vegetation phenological changes in multiple landforms and responses to climate change. ISPRS Int. J. Geo-Inf. 2020, 9, 111. [Google Scholar] [CrossRef] [Green Version]
  40. Liang, L.; Li, L.; Liu, Q.J.A.; Meteorology, F. Temporal variation of reference evapotranspiration during 1961–2005 in the Taoer River basin of Northeast China. Agric. For. Meteorol. 2010, 150, 298–306. [Google Scholar] [CrossRef]
  41. Gao, G.; Chen, D.; Xu, C.; Simelton, E. Trend of estimated actual evapotranspiration over China during 1960–2002. J. Geophys. Res. Atmos. 2007, 112, D11120. [Google Scholar] [CrossRef] [Green Version]
  42. Ye, H.; Zhang, T.; Yi, G.; Li, J.; Bie, X.; Liu, D.; Luo, L. Spatio-temporal characteristics of evapotranspiration and its relationship with climate factors in the source region of the Yellow River from 2000 to 2014. Acta Geogr. Sin. 2018, 73, 2117–2134. [Google Scholar] [CrossRef]
  43. Zheng, D.; Yao, T. Uplifting of Tibetan Plateau with Its Environmental Effects. Adv. Earth Sci. 2006, 21, 451–458. [Google Scholar] [CrossRef]
  44. Wang, W.; Li, J.; Yu, Z.; Ding, Y.; Xing, W.; Lu, W. Satellite retrieval of actual evapotranspiration in the Tibetan Plateau: Components partitioning, multidecadal trends and dominated factors identifying. J. Hydrol. 2018, 559, 471–485. [Google Scholar] [CrossRef]
  45. Zhang, H.; Sun, J.; Xiong, J. Spatial-temporal patterns and controls of evapotranspiration across the Tibetan Plateau (2000–2012). Adv. Meteorol. 2017, 112, D11120. [Google Scholar] [CrossRef] [Green Version]
  46. Yao, Y.; Liang, S.; Cheng, J.; Liu, S.; Fisher, B.J.; Zhang, X.D.; Jia, K.; Zhao, X.; Qin, Q.; Zhao, B.; et al. MODIS-driven estimation of terrestrial latent heat flux in China based on a modified Priestley–Taylor algorithm. Agric. For. Meteorol. 2013, 171, 187–202. [Google Scholar] [CrossRef]
  47. Cui, M.; Wang, J.; Wang, S.; Yan, H.; Li, Y. Temporal and spatial distribution of evapotranspiration and its influencing factors on Qinghai-Tibet Plateau from 1982 to 2014. J. Resour. Ecol. 2019, 10, 213–224. [Google Scholar] [CrossRef]
  48. Khan, M.S.; Baik, J.; Choi, M. Inter-comparison of evapotranspiration datasets over heterogeneous landscapes across Australia. Adv. Space Res. 2020, 66, 533–545. [Google Scholar] [CrossRef]
  49. Yang, W. A Study on the Dynamic Process of Evapotranspiration and Its Responses to Climate Change on the Tibetan Plateau. Master’s Thesis, Lanzhou University, Lanzhou, China, 2020. [Google Scholar]
  50. Liu, R.; Wen, J.; Wang, X. Spatial–Temporal Variation and Abrupt Analysis of Evapotranspiration over the Yellow River Source Region. Clim. Environ. Res. 2016, 21, 503–511. [Google Scholar] [CrossRef]
  51. Sun, Q. Evapotranspiration Estimation and Its Impact Factors in the Three River Headwater Region. Master’s Theisis, China University of Geosciences, Beijing, China, 2018. [Google Scholar]
  52. Bibi, S.; Wang, L.; Li, X.; Zhang, X.; Chen, D. Response of groundwater storage and recharge in the Qaidam Basin (Tibetan Plateau) to climate variations from 2002 to 2016. J. Geophys. Res. Atmos. 2019, 124, 9918–9934. [Google Scholar] [CrossRef]
  53. Jin, X.; Guo, R.H.; Xia, W. Variation of regional evapotranspiration of Qaidam Basin using MODIS data. Hydrogeol. Eng. Geol. 2013, 40, 8–13. [Google Scholar]
  54. Gu, S.; Tang, Y.; Cui, X.; Du, M.; Zhao, L.; Li, Y.; Xu, S.; Zhou, H.; Kato, T.; Qi, P. Characterizing evapotranspiration over a meadow ecosystem on the Qinghai–Tibetan Plateau. J. Geophys. Res. Atmos. 2008, 113. [Google Scholar] [CrossRef]
  55. Zhen, S. Study on Spatial and Temporal Distribution Characteristics of Surface Evapotranspiration and Its Influence Factors in Southern Slope of Qilian Mountain. Master’s Thesis, Qinghai Normal University, Xining, China, 2017. [Google Scholar]
  56. Ma, Y.; Li, X.; Liu, L.; Yang, X.; Wu, X.; Wang, P.; Lin, H.; Zhang, G.; Miao, C. Evapotranspiration and its dominant controls along an elevation gradient in the Qinghai Lake watershed, northeast Qinghai-Tibet Plateau. J. Hydrol. 2019, 575, 257–268. [Google Scholar] [CrossRef]
  57. Cao, S.; Cao, G.; Han, G.; Wu, F.; Lan, Y. Comparison of evapotranspiration between two alpine type wetland ecosystems in Qinghai lake basin of Qinghai-Tibet Plateau. Ecohydrol. Hydrobiol. 2020, 20, 215–229. [Google Scholar] [CrossRef]
  58. Zhang, T.; Zhu, X.; Wang, Y.; Li, H.; Liu, C. The Impact of Climate Variability and Human Activity on Runoff Changes in the Huangshui River Basin. Resour. Sci. 2014, 36, 2256–2262. [Google Scholar]
  59. Li, X.; Long, D.; Han, Z.; Scanlon, B.R.; Sun, Z.; Han, P.; Hou, A. Evapotranspiration estimation for Tibetan plateau headwaters using conjoint terrestrial and atmospheric water balances and multisource remote sensing. Water Resour. Res. 2019, 55, 8608–8630. [Google Scholar] [CrossRef]
  60. Qiu, L.; Zhang, L.; He, Y.; Chen, Y.; Wang, W. Spatiotemporal Variations of Evapotranspiration and Influence Factors in Oilian Mountain from 2000 to 2018. Res. Soil Water Conserv. 2020, 27, 210–217. [Google Scholar]
  61. Wang, F.; Wang, Z.; Zhang, Y.; Shen, F. Spatio-temporal Variations of Evapotranspiration in Anhui Province Using MOD16 Products. Resour. Environ. Yangtze Basin 2018, 27, 523–534. [Google Scholar] [CrossRef]
  62. Zhang, F.; Geng, M.; Wu, Q.; Liang, Y. Study on the spatial-temporal variation in evapotranspiration in China from 1948 to 2018. Sci. Rep. 2020, 10, 17139. [Google Scholar] [CrossRef]
  63. Yao, T.; Thompson, L.; Yang, W.; Yu, W.; Gao, Y.; Guo, X.; Yang, X.; Duan, K.; Zhao, H.; Xu, B.; et al. Different glacier status with atmospheric circulations in Tibetan Plateau and surroundings. Nat. Clim. Chang. 2012, 2, 663–667. [Google Scholar] [CrossRef]
  64. Shi, Y.; Shen, Y.; Hu, R. Preliminary Study on Signal, Impact and Foreground of Climatic Shift from Warm-Dry to Warm-Humid in Northwest China. J. Glaciol. Geocryol. 2002, 24, 219–226. [Google Scholar]
  65. Zhang, K.; Pan, S.; Cao, L. Spatial and Temporal Trends of Average Wind Speed in Hexi Region in 1961–2010. Sci. Geogr. Sin. 2014, 34, 1404–1408. [Google Scholar] [CrossRef]
  66. Seddon, A.W.R.; Macias-Fauria, M.; Long, P.R.; Benz, D.; Willis, K.J. Sensitivity of global terrestrial ecosystems to climate variability. Nature 2016, 531, 229–232. [Google Scholar] [CrossRef] [PubMed] [Green Version]
  67. Li, Z.; Feng, Q.; Liu, W.; Wang, T.; Gao, Y.; Wang, Y.; Cheng, A.; Li, J.; Liu, L. Spatial and temporal trend of potential evapotranspiration and related driving forces in Southwestern China, during 1961–2009. Quat. Int. 2014, 336, 127–144. [Google Scholar] [CrossRef]
  68. Chen, S.; Liu, Y.; Axel, T. Climatic change on the Tibetan Plateau: Potential evapotranspiration trends from 1961–2000. Clim. Chang. 2006, 76, 291–319. [Google Scholar] [CrossRef]
  69. Arturo, G.R.; Fernando, A.Q.J.; Carlos, A.L. Landform instability and land-use dynamics in tropical high mountains, Central Mexico. J. Mt. Sci. 2012, 9, 414–430. [Google Scholar] [CrossRef]
  70. Thomas, A. Spatial and temporal characteristics of potential evapotranspiration trends over China. Int. J. Climatol. A J. R. Meteorol. Soc. 2000, 20, 381–396. [Google Scholar] [CrossRef]
  71. Sun, J.; Wang, G.; Sun, X.; Lin, S.; Hu, Z.; Huang, K. Elevation-dependent changes in reference evapotranspiration due to climate change. Hydrol. Processes. 2020, 34, 5580–5594. [Google Scholar] [CrossRef]
  72. Zhang, C.; Shen, Y.; Liu, F.; Meng, L. Changes in reference evapotranspiration over an agricultural region in the Qinghai-Tibetan plateau, China. Theor. Appl. Climatol. 2016, 123, 107–115. [Google Scholar] [CrossRef]
  73. Liu, Y.; Yao, X.; Wang, Q.; Yu, J.; Jiang, Q.; Jiang, W.; Li, L. Differences in reference evapotranspiration variation and climate-driven patterns in different altitudes of the Qinghai–Tibet plateau (1961–2017). Water 2021, 13, 1749. [Google Scholar] [CrossRef]
  74. Jia, W.; He, Y.; Li, Z.; Pang, H.; Yaun, L.; Ning, B.; Song, B.; Zhang, N. Spatio-temporal Distribution Characteristics of Climate Change in Qilian Mountain and Hexi Corridor. J. Desert Res. 2008, 6, 1151–1155+1215. [Google Scholar]
  75. Qin, J.; Yang, K.; Liang, H.; Guo, X. The altitudinal dependence of recent rapid warming over the Tibetan Plateau. Clim. Chang. 2009, 97, 321–327. [Google Scholar] [CrossRef]
  76. Shen, M.; Piao, S.; Jeong, S.; Zhou, L.; Zeng, Z.; Ciais, P.; Chen, D.; Huang, M.; Jin, C.; Li, L.Z.X.; et al. Evaporative cooling over the Tibetan Plateau induced by vegetation growth. Proc. Natl. Acad. Sci. USA 2015, 112, 9299–9304. [Google Scholar] [CrossRef] [PubMed] [Green Version]
  77. Feng, Y. Changes of Glaciers and Permafrost in Qinghai-Tibet Plateau and Their Ecological and Hydrological Effects—Take the Yellow River Source, Brahmaputra River Basin and Permafrost Degradation Turning Zone as Typical Study Region. Ph.D. Thesis, China University of Geosciences, Beijing, China, 2020. [Google Scholar]
  78. Ma, Y.J.; Li, X.; Liu, L.; Huang, Y.; Li, Z.; Hu, X.; Wu, X.; Yang, X.; Wang, P.; Zhao, S. Measurements and modeling of the water budget in semiarid high–altitude Qinghai Lake Basin, Northeast Qinghai–Tibet plateau. J. Geophys. Res. Atmos. 2018, 123, 10857–10871. [Google Scholar] [CrossRef]
Figure 1. Location of Qinghai Province and its five ecological function zones.
Water 14 00536 g001
Figure 2. The spatial distribution and temporal changes of annual average T (a,d), P (b,e), and NDVI (c,f) in Qinghai Province during 2000–2020. A–E in the figure represents the Three-River Source region, the Qaidam Basin region, the Qilian Mountain region, the region around Qinghai Lake, and the Hehuang region, respectively.
Water 14 00536 g002
Figure 3. Spatial changes of T (a), NDVI (b), and P (c) in Qinghai Province during 2000–2020. A–E in the figure represents the Three-River Source region, the Qaidam Basin region, the Qilian Mountain region, the region around Qinghai Lake, and the Hehuang region, respectively.
Water 14 00536 g003
Figure 4. Interannual changes and trends of ET in Qinghai Province during 2000–2020.
Water 14 00536 g004
Figure 5. Spatial distribution (a) and changes (b) of ET in Qinghai Province during 2000–2020. A–E in the figure represents the Three-River Source region, the Qaidam Basin region, the Qilian Mountain region, the region around Qinghai Lake, and the Hehuang region, respectively.
Water 14 00536 g005
Figure 6. Characteristics of ET per unit region in five ecological function zones in Qinghai Province during 2000–2020. A–E in the figure represents the Three-River Source region, the Qaidam Basin region, the Qilian Mountain region, the region around Qinghai Lake, and the Hehuang region, respectively.
Water 14 00536 g006
Figure 7. Spatial correlation coefficient distribution map of ET and T, P, and NDVI. (ac) represent the correlation coefficient between ET and T, P, and NDVI; (df) represent the significance test between ET and T, P, and NDVI. A–E in the figure represents the Three-River Source region, the Qaidam Basin region, the Qilian Mountain region, the region around Qinghai Lake, and the Hehuang region, respectively.
Water 14 00536 g007
Figure 8. Variations of ET, T, P, and NDVI with altitudes.
Water 14 00536 g008
Figure 9. Correlation between T and ET on the altitude gradient.
Water 14 00536 g009
Figure 10. Diagram of influencing factors of ET in Qinghai Province. “+” “−” refers to the positive or negative effects of driving factors varying with altitude gradient on ET.
Water 14 00536 g010
Table 1. Introduction table of research data sources.
Data NameData SourcesTime ResolutionSpatial Resolution
Evapotranspiration (ET)https://search.earthdata.nasa.gov/ assessed on 2 June 2021year500 m
Normalized difference vegetation index (NDVI)https://search.earthdata.nasa.gov/ assessed on 2 June 2021month1 km
Digital elevation model(DEM)http://www.gscloud.cn/ assessed on 20 May 2021---90 m
Temperature (T), Precipitation (P)http://www.geodata.cn assessed on 27 June 2021month0.0083333°
Table 2. Comparison of ET in Qinghai Province with the Plateau.
NumberPeriodET (mm/a)DomainReferences
12000–2010320ChinaYao [46]
21982–2008350TPJung [4]
31982–2012378.1TPWang [44]
41982–2014377TPCui [47]
51982–2015373.12TPYang [49]
62000–2010350.3TPSong [11]
72000–2012450–500TPZhang [45]
81979–2014364.45–493.32Yellow River SourceLiu [50]
92001–2015535.01–636.51Three-River HeadwaterSun [51]
102002–201666–379QaidamBibi [52]
112001–2011125.26QaidamJin [53]
122002–2004341, 407, 426alpine meadow of Qilian MountainSong [54]
132000–2015854.23Southern Slope of Qilian MountainZhen [55]
142014–2015496.2Qinghai LakeMa [56]
152015–2016633.3–657.2
341–426
two alpine wetland ecosystems of Qinghai Lake Cao [57]
161966–2010375.54, 378.54Huangshui River Zhang [58]
Table 3. Correlation between ET and T, P, and NDVI on the altitude gradient.
Fitting EquationDetermination
Coefficient (R2) Test
Correlation
Coefficient
Ty = −5.1618x + 447.50.5254p < 0.01
Py = 0.2295x + 370.390.2078p < 0.01
NDVIy = 30.74x + 445.260.0091p > 0.05
Table 4. Correlation between ET and T, P, NDVI at different altitude gradients (p < 0.01).
Altitudes
(m)
TPNDVI
1700–2600y = −11.855x + 482.44y = 0.7059x + 102.5y = 120.15x + 340.77
R2 = 0.5R2 = 0.78R2 = 0.0212 p > 0.05
2600–3800y = −15.632x + 461.3y = 0.3139x + 355.53y = 244.98x + 356.99
R2 = 0.83R2 = 0.81R2 = 0.86
3800–4400y = −16.82x + 451.1y = 1.2654x − 30.292y = −60.18x + 686.54
R2 = 0.98R2 = 0.89R2 = 0.94
4400–5100y = 11.598x + 570.71y = 0.4916x + 309.31Y = 162.61x + 446.56
R2 = 0.96R2 = 0.87R2 = 0.93
5100–6000y = 2.0736x + 496.2y = −0.1975x + 56.05y = 96.302x + 458.73
R2 = 0.88R2 = 0.86R2 = 0.84
Publisher’s Note: MDPI stays neutral with regard to jurisdictional claims in published maps and institutional affiliations.

