Article

Sustainability of the Al-Abila Dam in the Western Desert of Iraq

1
Dams and Water Resources Engineering Department, College of Engineering, University of Anbar, Baghdad 55431, Iraq
2
Soil and Water Department, Agricultural Engineering Sciences College, University of Salahaddin, Erbil 44002, Iraq
3
Soil Physics and Land Management Group, Wageningen University, 6700 AA Wageningen, The Netherlands
*
Author to whom correspondence should be addressed.
Water 2022, 14(4), 586; https://doi.org/10.3390/w14040586
Submission received: 3 January 2022 / Revised: 12 February 2022 / Accepted: 13 February 2022 / Published: 15 February 2022
(This article belongs to the Special Issue Water Management for Climate Smart Agriculture)

Abstract

:
Water scarcity is a major problem in the arid climate of Iraq’s Western Desert and people struggle to manage the precarious water supply. Harvesting rainwater is one sustainable method that can be used to increase the supply of water. Rainwater harvesting systems (RWH) are considered to be sustainable “if they can continue collecting, utilising, and consuming natural water resources for maximum livelihood development”. This study assessed the sustainably of the Al- Abila dam in Iraq’s Western Desert by determining its level of functionality in harvesting water and using it effectively. The reliability of the water supply and its potential productivity and water use efficiency were investigated as well. The balancing storage at the end of each runoff shows that dam storage of this magnitude is insufficient to fulfil the water demand. This research highlighted constraints that have affected system functioning or sustainability and provided suggestions and recommendations for risk-managed rainwater harvesting system installation methods and designs. The water conveyance factor and adequacy of the system were low, with 60% conveyance losses. This research helps policymakers to conduct large-scale, high-level assessments and answer basic problems about small earth dam development and management in Anbar’s Western Desert.

1. Introduction

Until the 1970s, Iraq was considered to have rich water resources due to the proximity of the Tigris and Euphrates Rivers. Unfortunately, dam construction on the tributaries of the rivers in Turkey and Syria has resulted in water scarcity in Iraq [1]. Additionally, Iraq’s growing population has raised the demand for water, while climate change and declining rainfall rates have further restricted the water supply since 2007 [2]. Iraq’s Western Desert is the area most affected by water scarcity. This arid area has had major challenges in providing and managing water. Rainfall distribution is erratic, and the country suffers from high evaporation rates, high temperatures, and a shortage of groundwater and surface water [3]. Iraq’s desert accounts for around 55% of Iraq’s total land area, most of it uninhabitable because of the lack of water. Many larger valleys, such as the Wadi Horan, Wadi Amije, and Wadi Al Awaje, receive comparatively high amounts of floodwater [4]. The need to develop new water sources or to optimize the use of existing sources has become critical. Many studies show that sustainable rainwater collection is essential for better water management, from a socio-economic as well as a biophysical development perspective.
Sustainability is a new term currently used when talking about development methods, and it may be interpreted in a variety of ways depending on the context. It has become an all-encompassing word that is used for nearly every system on the planet. Sustainability is defined as “enhancing human well-being while respecting ecological limits”, according to the International Union for Conservation of Nature (IUCN), the United Nations Environment Programme (UNEP), and the World Wildlife Fund (WWF) [5]. Sustainability assessment (SA) is becoming a more widely recognized technique for assisting in the transition to sustainability [6]. A sustainability assessment evaluates the influence of a proposed or existing policy, plan, program, project, law, or current practice or activity on sustainability [6]. How to measure sustainability is a recurring topic in sustainability evaluations [7].
Rainwater harvesting systems are sustainable if they can be used and the water consumed in the future to improve livelihood [8]. According to [9], rainwater harvesting systems should have the following qualities to be sustainable: reliable water supply and production potential; efficient water use; and minimal environmental consequences. Rainfall amount and quality of runoff, social and economic variables such as expertise and investment capability, labor accessibility, and institutional backing are all elements that influence the long-term viability of rainwater harvesting systems [8].
Rainwater harvesting systems (RWH) have been evaluated using a variety of sustainability criteria. Hashimoto [10] proposed the assessment of a reservoir’s sustainability using reliability, resilience, and vulnerability. Kjeldsen [11] evaluated several techniques for estimating reliability, resilience, and vulnerability, concluding that the maximum values of deficiency duration and volume provide more consistent findings than average values. To assess sustainability, Sandoval [12] presented a geometric average of reliability, resilience, and vulnerability.
Park [13] investigated the long-term sustainability of RWH systems in six major US cities with variable rainfall data. There are several differences between the characteristics of a reservoir and the characteristics of an RWH, and thus, the sustainability index (SI) assessment procedure for the RWH was adjusted. This study introduces a new RWH performance model as well as a method for assessing sustainability indicators.
The management and sustainability of water resources in Iraq’s Western Desert were investigated by [14]. The system was simulated using remote sensing and numerical analysis tools. The yearly water harvesting rate for each basin in the research region was established, and new water collecting places were discovered for diverse agricultural uses and community development.
Abdulhameeda [15] investigated the idea of building a series of small dams to retain rainfall water in order to sustain and enhance the ecological system. The construction of 13 optimal-height dams in the Horan valley would increase the water surface area of reservoirs in this valley from 15 to 90 km2, replenishing groundwater and sustaining rainwater collection systems.
Various disciplines, from engineering to business to policymaking, have suggested and created a large number of methods and conceptual frameworks. Most of these frameworks were formulated in the last decade or so but were never tested. The conceptual frameworks have two primary features: creating objectives and evaluation criteria using sustainable principles, and providing quantitative indicators for each assessment criterion.
This study’s objective was to evaluate the sustainability of a rainwater harvesting system, the Al-Abila dam in the Western Desert of Iraq. In this research, we consider a system to be sustainable if it can provide a reliable supply of water that can be used efficiently and has productivity potential. Moreover, special attention was paid to identifying defects or constraints that have reduced the functionality or sustainability of the system.

2. Materials and Methods

In this study, the Abila Dam in the Wadi Horan (Figure 1) was taken as a case study. Catchment characteristics and physical characteristics were collected and measured to evaluate the study area. To evaluate the sustainability of the dam, we assessed the reliability of the water supply and its production potential (the water balance model was used to estimate water supply and demand) and the effectiveness of the water use.

2.1. Study Area

The Wadi Horan is Iraq’s biggest Wadi, extending from the Saudi border to the Jordanian and Syrian borders. As illustrated in Figure 1, the Wadi Horan is located south of the Euphrates River, at 32°10′44″ to 34°11′00″ N, 39°20′00″ to 42°30′00″ E. The watershed area of the Wadi Horan is 13,370 km2, with a length of 362 km [16]. The average annual rainfall is about 120 mm, of which around half falls in the winter, 35% in spring, and 15% in autumn [17].
The temperature of the research area is similar to that of a continental hot desert [18]. July has the highest monthly mean temperature of 31 °C, whereas December has the lowest monthly mean temperature of 8 °C. The average yearly temperature is around 20 °C. Extreme temperatures and dry conditions result in a high rate of evaporation, estimated to be approximately 3000 mm year. Evaporation averages vary month to month from April through October. The highest monthly average evaporation recorded was 433 mm in July, while the lowest was 79 mm in January.
Designing and implementing RWH in these regions is crucial to enhancing the water supply as well as the quality of life in these communities. Small dams are major structures that have been built in the Western Desert of Iraq to capture and store rainfall for use during the dry seasons. The Wadi Horan’s exposed rocks are mostly solid limestone [17]. The limestone provides a great foundation for dams or barriers, and it can also be used to cover the front side of the barrier, as seen in Figure 2. For building purposes, the dams were placed in hard, narrow valley cross-sections with high shoulders to decrease the need for construction material, minimize evaporation losses and ensure efficient storage.

2.2. Catchment Characteristics

The structural dimensions of the Al-Abila dam were gathered from the dam design report, the small dam management in the Western Desert, and the global positioning system (GPS). Table 1 shows the total amount of water that could potentially be collected behind the dam.

2.3. Physical Characteristics

Soil texture influences both infiltration and runoff. The textural class is determined by sand, silt, and clay content. The actual soils in the research region range from sandy loam to silty sand [20], with sandy and sandy loam soils being two of the most common.
The Horan valley watershed was mapped using remote sensing satellite data. The Landsat 8 image (23 June 2019) with 30-metre spatial resolution was used for land use/cover mapping.

2.4. Water Balance Model

The Al-Abila dam’s water balance was evaluated to estimate runoff and change in water storage volume. A catchment has two main components: a drainage area and a retention area [21]. An area’s water balance equation may be stated as [22]:
Δv= IO
where:
Δv = a storage change over time, in m3.
I = input volume, in m3.
O = output volume, in m3.
A more sophisticated water balance equation is possible with different inflow and outflow variables:
Δv = Vrunoff + VrainfallInfEvp
where:
Vrunoff represents the amount of upstream runoff collecting in the storage basin per unit of time. The Soil Conservation Service Curve Number (SCS CN) model was applied to compute Vrunoff.
Vrainfall = P × As
P = is the max. daily precipitation (mm).
As = is the storage basin’s area (m2).
Inf = the storage basin’s infiltration loss (mm/day).
Evp = the maximum evaporation (mm/day).
Evp = Ev × As
where:
Ev = the average yearly potential evaporation (mm/year).
In the storage area, this volume (Δv) is added to the existing volume (Si).
Si = Si + Δv
If the maximum storage height is hs, then the maximum storage capacity Smax is:
Smax = hs × As
If Si > Smax, an outflow to the next sub-catchment of Vout occurs.
Vout = SiSmax
Using the aforementioned method, the overall change in storage over time (Δvt) is:
Δvt = ΔvVout
Evaporation and infiltration are two types of water losses in the reservoir. Evaporation losses account for a considerable portion of total storage capacity in arid and semi-arid areas. Water depths equal to a reservoir’s yearly evaporation range from 1.50 to 3.00 m, making it an essential parameter in water balance calculations [23]. Evaporation might cause up to half of the water held in dams to evaporate, resulting in a massive loss of resources. Calculating lake and reservoir evaporation is a complicated process, since many variables impact the rate of evaporation, including the water body’s climate and physiography, and its surroundings [24,25,26]. As direct measurements of lake evaporation are difficult to take and usually restricted to extremely short time periods, the percentage of evaporation losses (40%) each year was calculated based on prior research and conversations with local experts during this study. Infiltration differs depending on the soil texture, which includes sand, silt, and clay. The infiltration rate of fine-textured soil is lower than that of coarse-textured soil. The infiltration mechanism and rate are also influenced by soil structure [27]. The design reports of the dams in the Western Desert state that the percentage of infiltration losses in the dam reservoirs is more than 20% [28], and this is the percentage that was used in this study.
The Al-Abila dam’s monthly water balance analysis in MS Excel was used to assess the dam’s ability to satisfy local water needs.

2.5. Assessing the Sustainability of the Al-Abila Dam

2.5.1. Reliability of Water Supply and Potential

For the Al-Abila dam, a supply and demand analysis was conducted. Using an ARCINFO GIS 30 m resolution Digital Elevation Model (DEM), the catchment area, mean slope, type of soil, land use, and land cover of the Al-Abila dam’s source streams were estimated. The surface runoff produced by the dam’s catchment regions was calculated using the SCS CN model. The Curve Number values were selected based on land use, hydrologic soil group (HSG), and antecedent soil moisture (ASM) status [29].
To determine runoff potential, soils were categorized into four HSGs. A-group (>90% sand and <10% clay) had the lowest runoff potential, B-group had a moderately low runoff potential (10–20% clay and 50–90% sand), C-group had a moderately high runoff potential (20–40% clay and <50% sand), and D-group had a high runoff potential (>40% clay and <50% sand). The hydrological soil group map from the data in previous studies [30] was used in this study.
The Al-Abila dam’s water demand was calculated. The Penman–Monteith equation was used to calculate the potential evapotranspiration of widely grown crops [21]. The water needs of the most important crops were calculated. Based on the observed water conveyance factor values and a field application factor of 0.6, the gross irrigation requirement of cultivated crops was estimated [8]. The domestic water requirements were calculated for a home with an average-sized animal herd. To verify the feasibility of fulfilling local water demand, a monthly water balance study of the Al-Abila dam system was performed in MS Excel.

2.5.2. Effectiveness of Water Use

Field observations and conversations with local residents and consumers provided information about water consumption for a specified RWH system. Interviews and a GPS survey were used to acquire data on dam operations such as irrigation size, user count, cropping patterns, farm distance, and allocations. The water conveyance factor and adequacy have both been used to evaluate the effectiveness of dam irrigation systems. The following relationships were used to estimate the values [8].
W a t e r   c o n v e y a n c e = V r   V d
where: Vr is the volume of water received at field in m3, and Vd is the volume of water diverted from the dam in m3.
A d e q u a c y = E T × A   V r × 0.6
Data on the use of water were gathered. Irrigation timing and crop yields were documented. The selection and production of principle crops grown by local farmers were studied to measure possible water consumption.

3. Results and Discussions

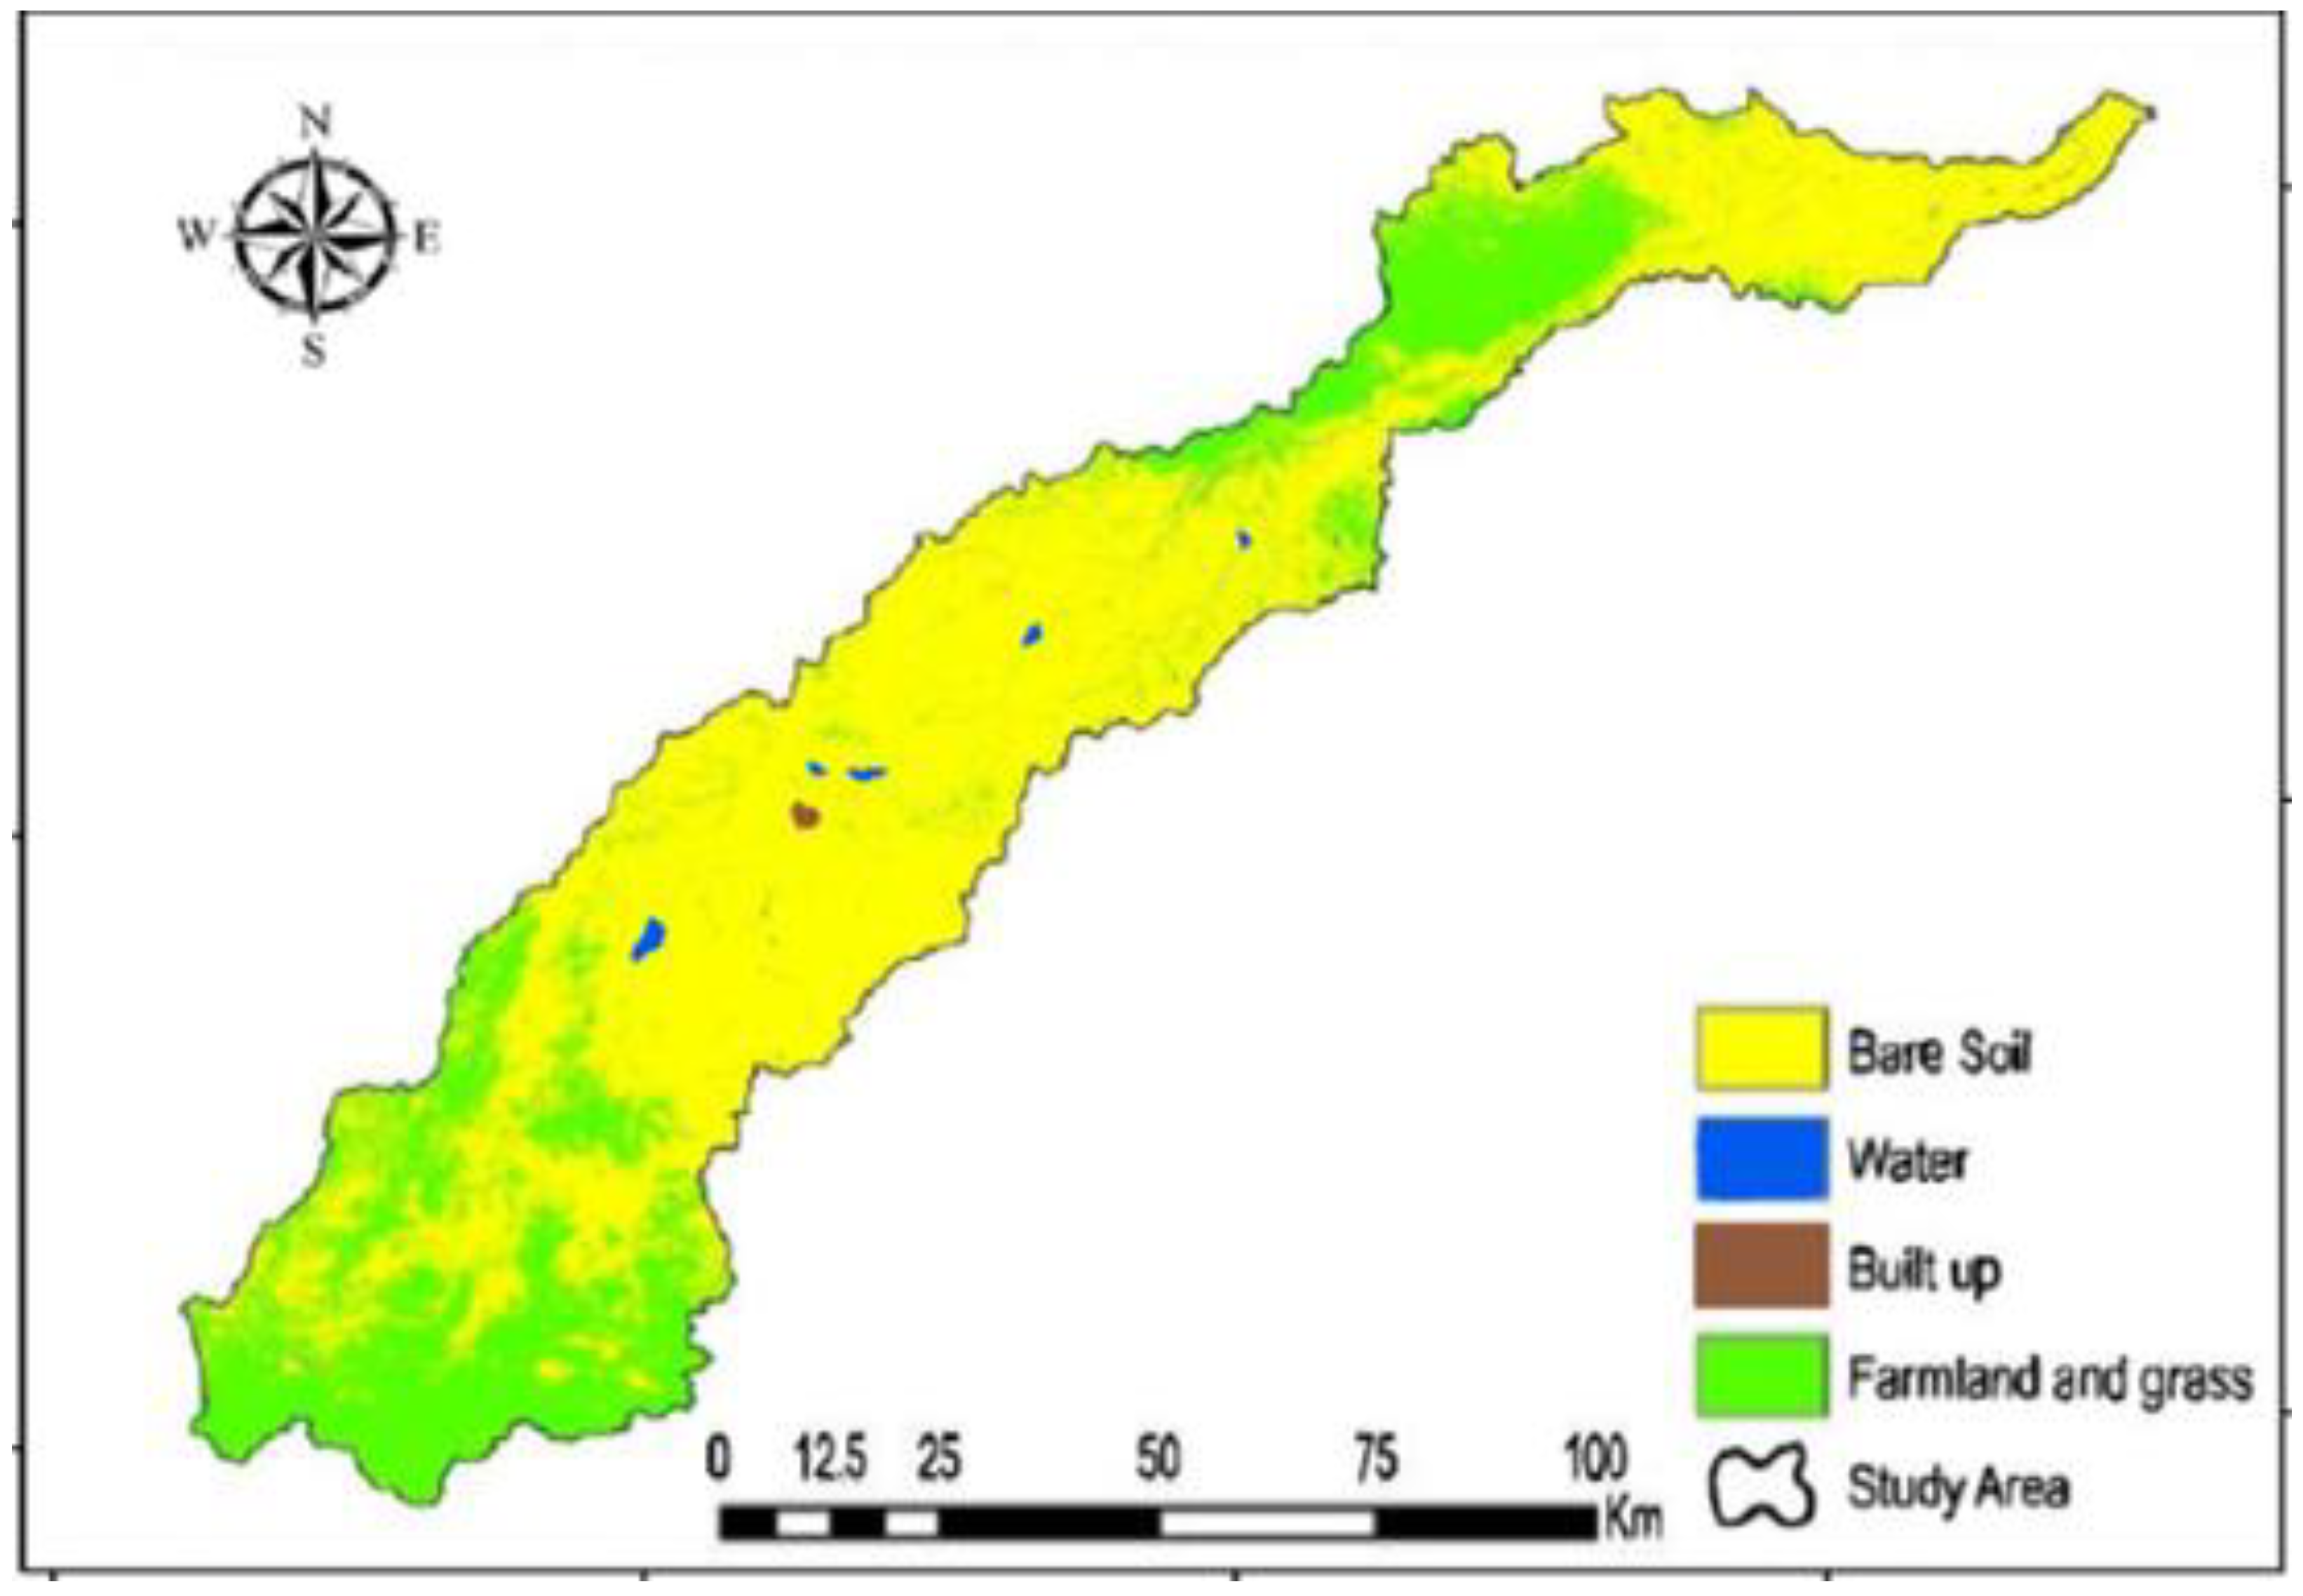
3.1. Land Use/Cover (LU/LC)

A land use/cover map of the Horan valley watershed was created using remote sensing (RS) satellite data. The Landsat 8 image (23-June-2019) with 30-meter spatial resolution was chosen. After downloading the US Geological Survey (USGS) picture, we obtained the composite band using the ArcGIS program, selecting Arc Toolbox > Data Management Tools > Raster > Raster Processing and, finally, Composite Band. A land use/cover map was produced using supervised classification. Bare soil, built-up land in Al-Rutba city, and water bodies such as dam reservoirs, agricultural land, and grass land in the highlands and upstream and downstream of the Horan valley were among the land use/land cover categories in the research area. Bare soil occupyied approximately 70% of the area, and only a small portion of the land was taken up by Al-Rutba city and water bodies, as shown in Figure 3. These findings are consistent with our past research [17].

3.2. Rainwater Harvesting Characteristics

In this study, the hydrological soil group map from earlier studies [30] was employed. For the hydrological soil groups, soil properties were identified, and a GIS map was created. Groups A, B, C, and D are the four types of hydrological soil groups found in the research area, as illustrated in Figure 4.
To obtain the Curve Number (CN) map of the Wadi Horan, the HSGs map and the land use map were overlayed, as shown in Figure 5.
The USGS categorization method was used to produce the Curve Number values for each polygon in the land–soil map, as shown in Table 2. The CN value in Wadi Horan varied from 60 to 92 throughout the whole Horan valley.
Table 3 shows the average characteristics and other key elements such as water availability, catchment area, and average slope of the Al-Abila dam.
According to Table 3, the average CN was 76.5, and based on land use analysis, bare soil accounted for more than 70% of the total area with a CN range from 77 to 94 (as indicated in Table 2). As a consequence, our findings are compatible with the standard CN (Table 2) and other research such as [14,30].

3.3. Assessing the Sustainability of the Al-Abila Dam

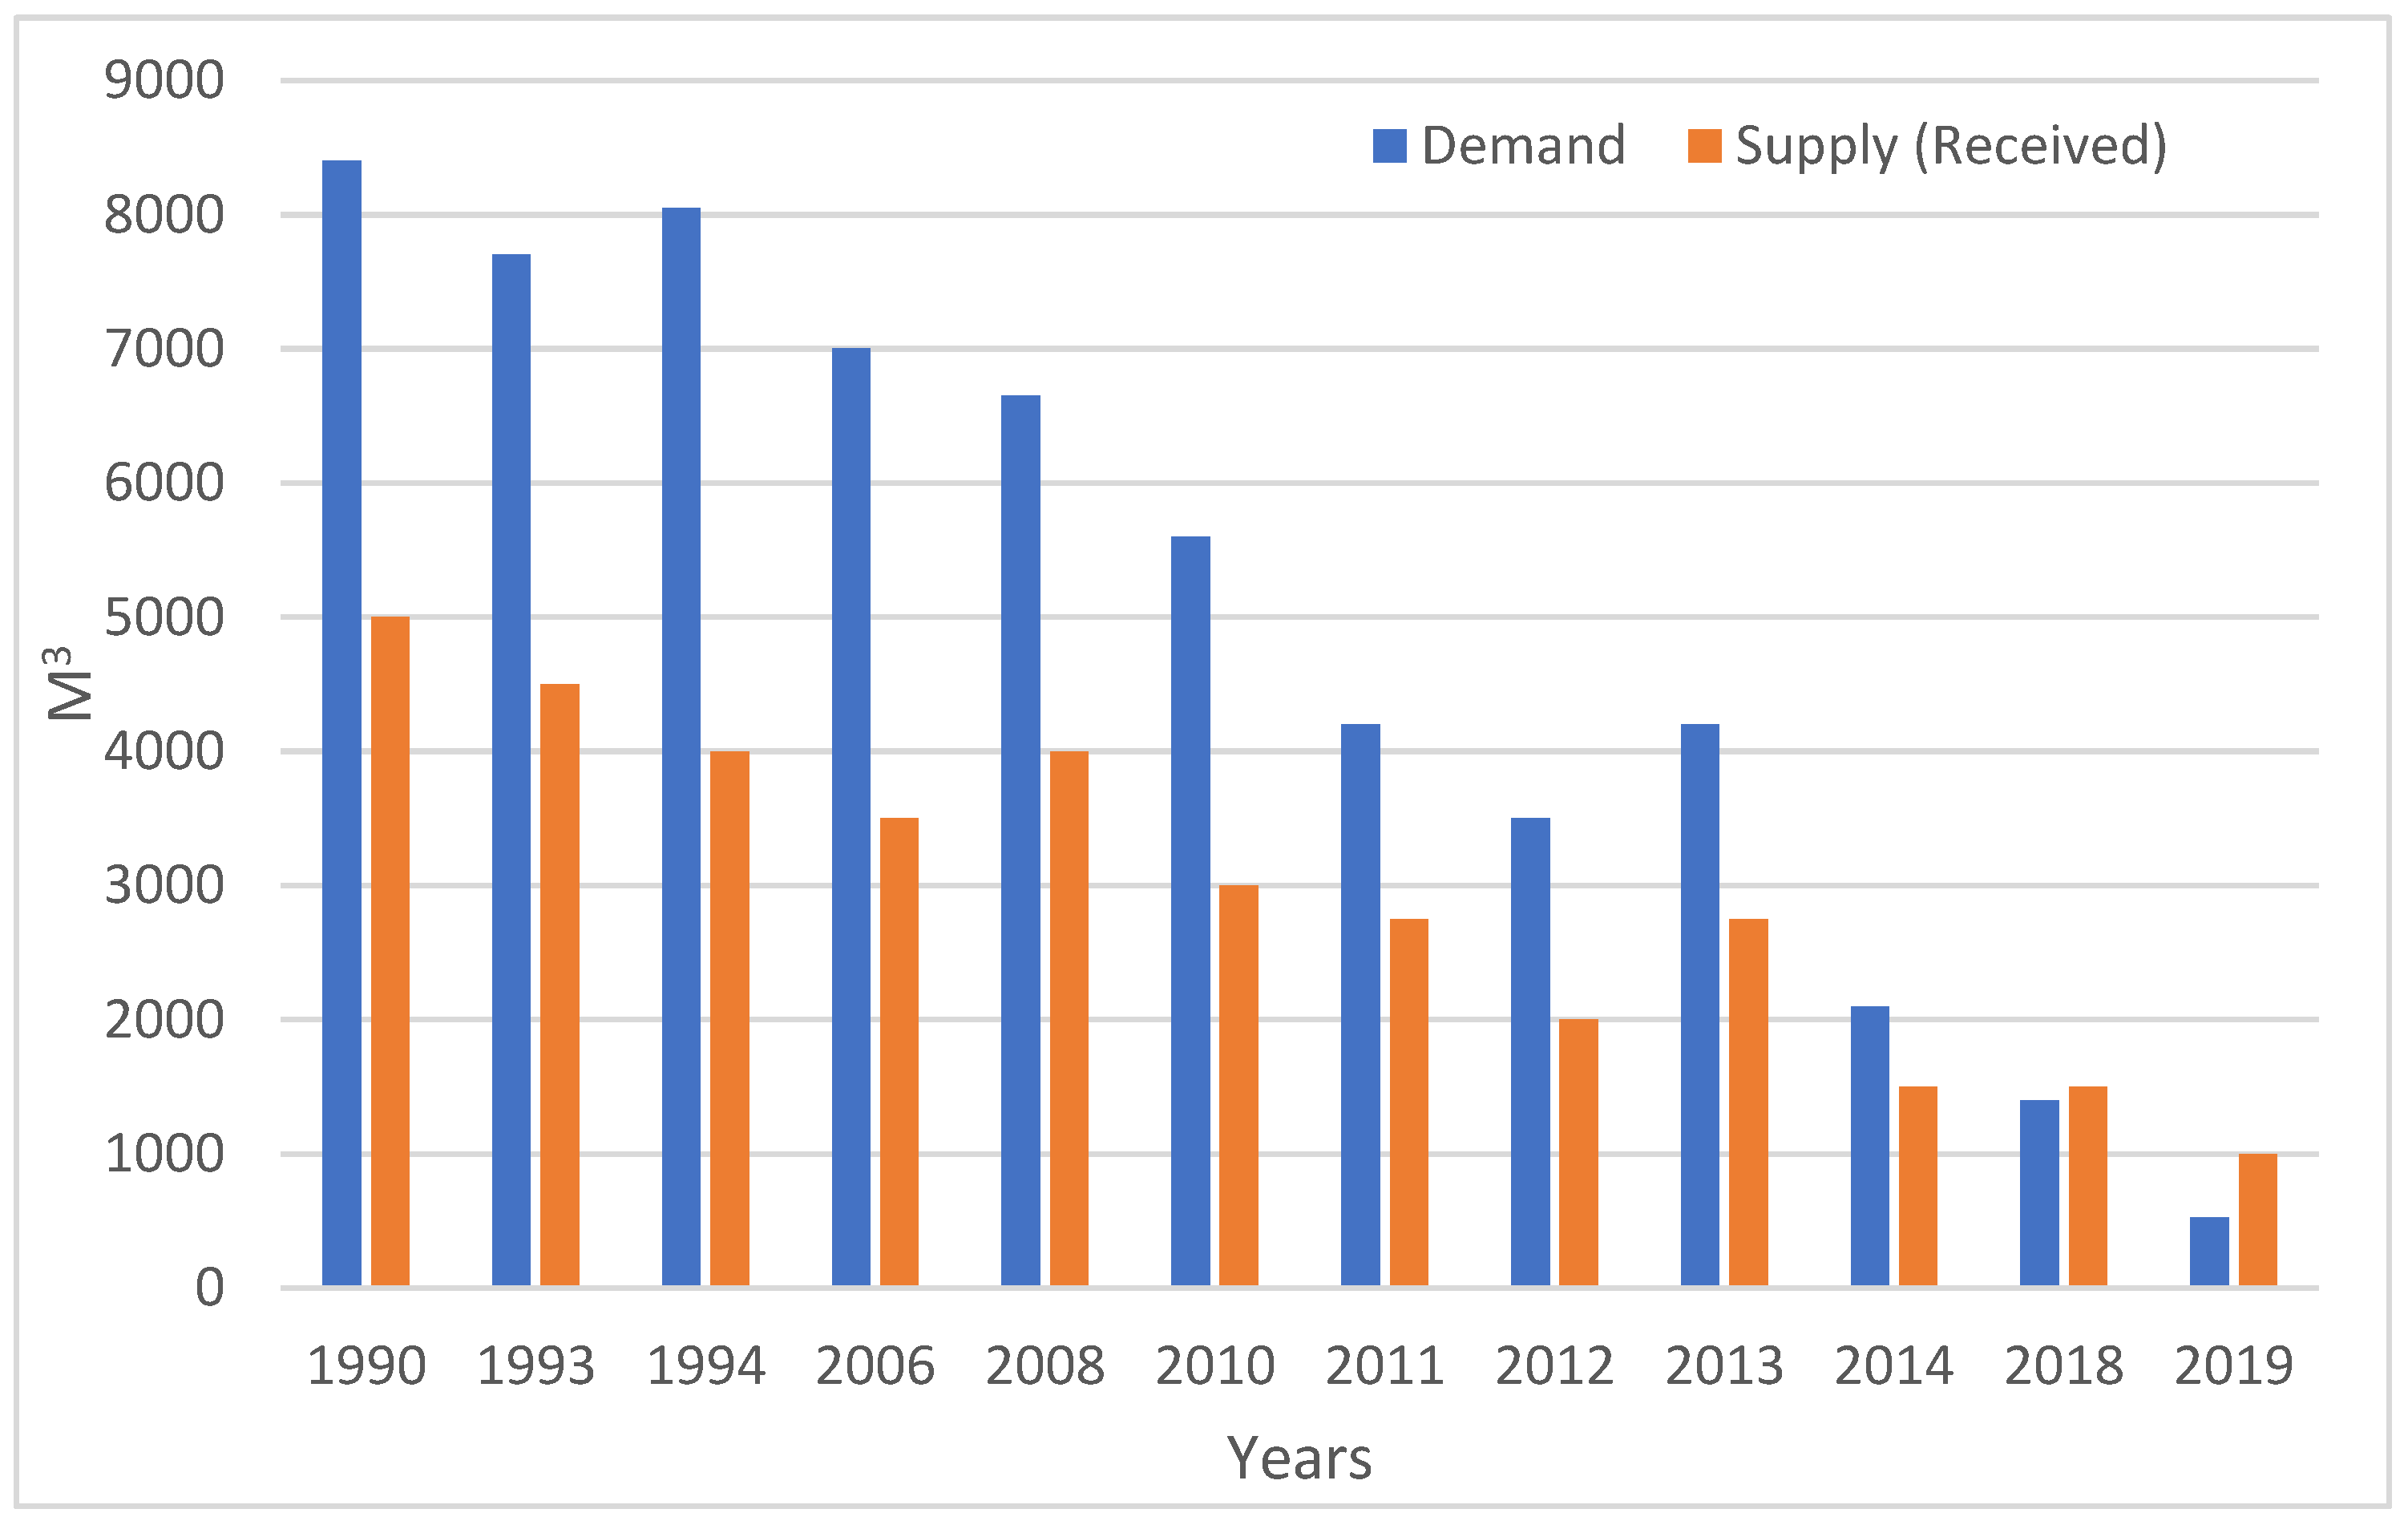
3.3.1. Reliability of the Water Supply and Potential

The SCS CN model was used to determine the surface runoff generated by the dam’s catchment areas. We estimated the water demand for the RWH system. The Penman–Monteith equation was used to compute the potential evapotranspiration of regularly planted crops. The water requirements of the most important crops were calculated. The gross irrigation demand of cultivated crops was calculated using observed water conveyance factor values and a field application factor of 0.6 [8]. Then, the domestic water needs for a residence with an average-sized animal herd were determined.
In MS Excel, a monthly water budget calculation of the RWH system was performed to see if it was enough to fulfil local water demand. Figure 6 depicts the water demand and supply for the runoff years.
The end-of-runoff balance storage indicates that dam storage does not meet the demand. Furthermore, Figure 6 shows a decrease in both water supply and demand from 1990 to 2013, followed by a steep drop in both from 2014 to 2019, as expected. Water supply reduced and fluctuated as a result of unpredictable rainfall, increasing evaporation losses and runoff losses from overland flow, whereas demand declined as a result of the emigration of people from this area due to the ISIS war and agricultural abandonment. This might affect the dam’s long-term sustainability. Furthermore, surface runoff from catchments contains a significant quantity of sediments, and the unlined irrigation channels from the dam have a negative influence on the dam’s sustainability.
Based on statistics, surveys, and interviews with local residents conducted during the inquiry year of 2019, when rainfall was below normal and distribution was poor, it was revealed that each household in this area has around 10 members and owns approximately 2500 sheep. According to previous studies [4,15], the average daily human consumption is 120 L, while the average daily animal consumption is 13 L, so human consumption accounted for around 16% of the total water stored in the reservoir, while animal watering accounted for about 84%, and the storage capacity was depleted in late June, as shown in Table 4.

3.3.2. Effectiveness of Water Use

Throughout dry seasons, the Al-Abila dam allows for the supplemental irrigation of wheat and barley crops, while perennial streams are abstracted and utilized to irrigate vegetable crops during the dry season. In the current scenario, water is transported through unlined earthen channels. As indicated in Table 5, the water conveyance factor and adequacy are poor in region 0.3, which experienced a loss of 60% from the conveyance. Due to erratic rainfall and a lack of assistance and resources for farmers, water from the dam is rarely used. In the investigation year of 2019, the overall volume of water supply was around 498 × 103 m3, 33% of the total supply being used. Although losses accounted for 67%, evaporation was the major contributor, accounting for 56% of the total volume provided.

Constraints

The main constraints of the study were:
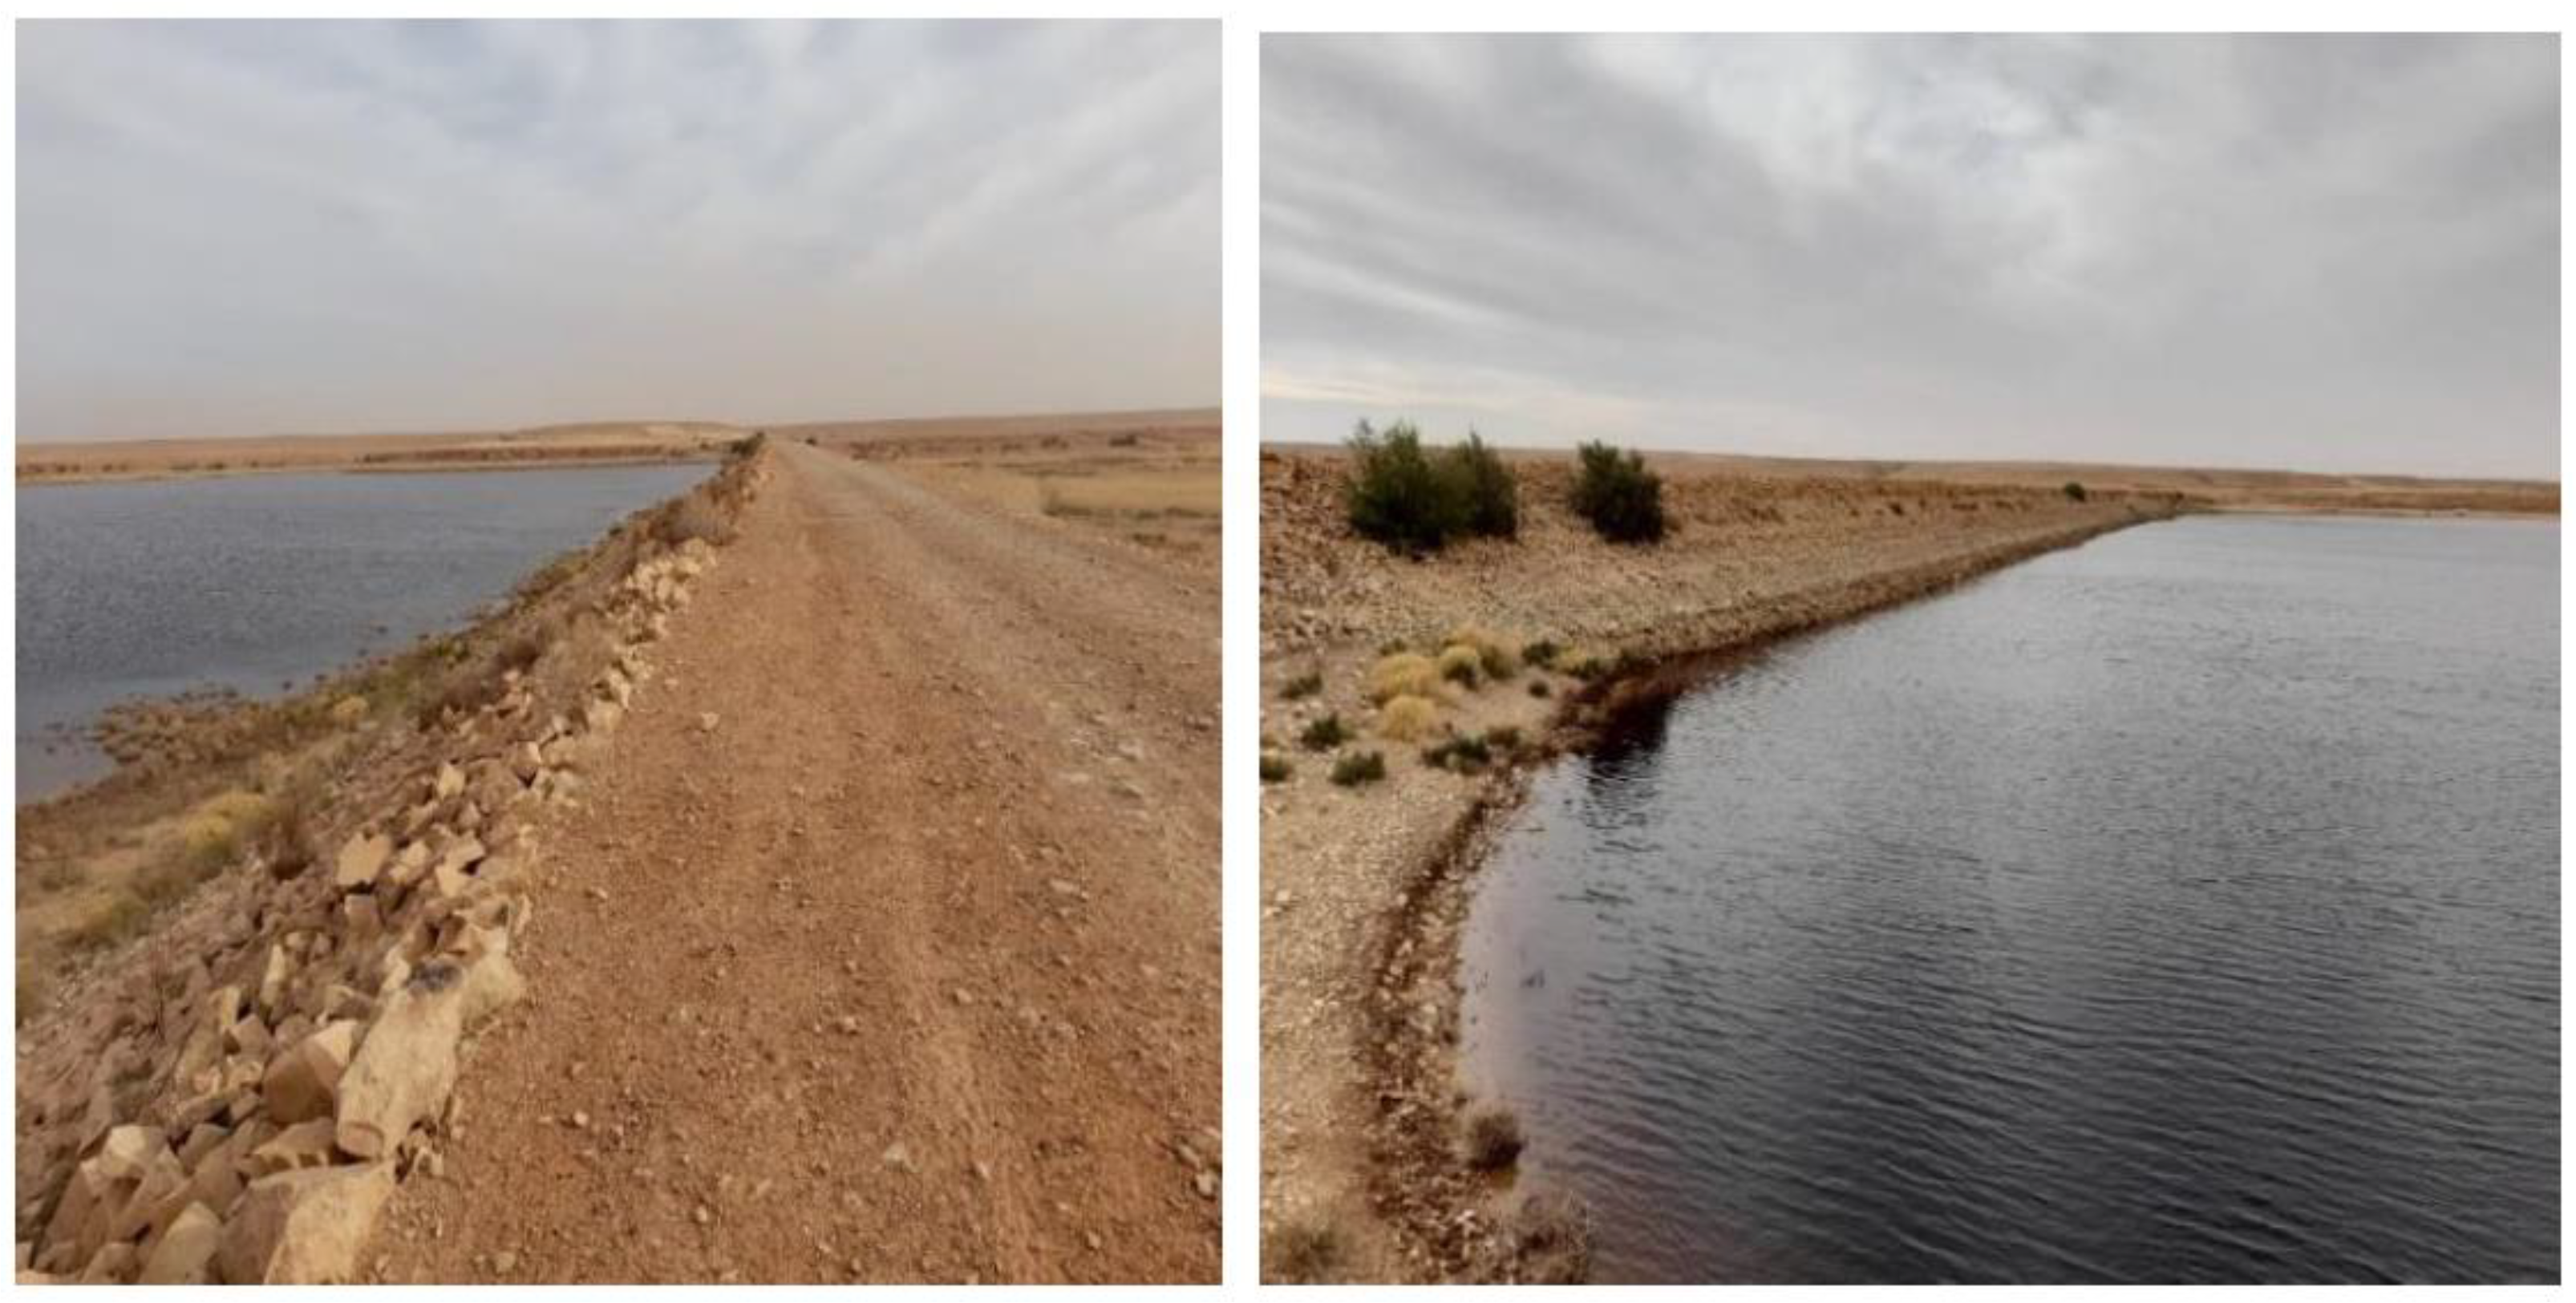
  • After examining the design structure maps and conducting field observations, we discovered that there is no bottom outlet utilized to operate the dam in order to deliver water for irrigation.
  • We detected seepage along the dam’s body based on prior studies and field interviews with engineering supervisors.
  • Unlined irrigation canals cause a lot of water loss, erosion, and sedimentation.
  • The assessment of water projects in Iraq’s Western Desert confirmed that the Western Desert’s water resources are poorly managed. A huge volume of water flows into the river without being used in the Wadies upstream.
  • The Iraqi Western Desert, like all arid and semi-arid regions, suffers from a lack of data, particularly for surface runoff in valleys.
  • Bedouins and those who live near water harvesting systems face a lack of assistance. People are still using simple ways to convey and use water.

Suggestions and Recommendations

  • Maintain and control losses by lining the canals and grouting the concrete along the body of the dam.
  • We propose installing hydrometric stations at the valley outlets in order to obtain accurate surface runoff data.
  • We urge additional researchers to conduct field studies and field observations at small dam sites to develop a better understanding of all the data needed to construct and maintain dams in the Western Desert.
  • Organize seminars and meetings with Bedouins and local farmers to apply modern technology and smart agriculture to this region, resulting in the best possible use of dam irrigation systems to support local livelihoods.

4. Conclusions

The level of functionality and sustainability of the Al-Abila dam was assessed. Rainwater harvesting techniques used in the watershed would help smallholders improve their livelihoods. Dams for stream water abstraction would enable year-round agriculture, which would boost household incomes while also enhancing food supply in the region.
The balancing storage at the end of each runoff shows that dam storage of this magnitude is insufficient to fulfil the water demand. This study indicates that, in the investigation year 2019, when rainfall was below average and distribution was poor, the storage capacity was depleted in late June and negatively affected dam sustainability. Moreover, the results showed that surface runoff from catchments contained a significant quantity of sediments, and the unlined irrigation channels from the dam produced a poor water conveyance factor and adequacy, thus restricting the efficacy of water distribution and usage. This research highlighted faults or constraints that have affected system functioning or sustainability and provided suggestions and recommendations for risk-managed rainwater harvesting system installation methods and/or designs.
This data is critical for managing small reservoirs and storage capacity. It was possible to determine how much water a reservoir could retain at any given time. Furthermore, knowing the storage capabilities will allow planners and water managers to quickly determine how to use and manage the available water in light of alternative applications.

Author Contributions

Conceptualization A.A. and R.A.; methodology, A.A.; software, A.A. and R.A.; validation, A.A. and K.M.; formal analysis, A.A. and M.R.; investigation, A.A. and S.S.; resources, A.A. and C.R.; data curation, S.S.; writing—original draft preparation, A.A. and R.A.; writing—review and editing, C.R.; visualization, A.A., S.S. and K.M.; supervision, C.R.; project administration, C.R. and M.R.; funding acquisition, C.R. All authors have read and agreed to the published version of the manuscript.

Funding

This Research is fully funded by Nuffic Orange Knowledge program OKP-IRA-104278.

Institutional Review Board Statement

Not applicable.

Informed Consent Statement

Not applicable.

Data Availability Statement

Some data in this manuscript were obtained from Ministry of Agriculture and Ministry of Water Resources, small dam management in the Western Desert. The other data are from the field work and previous studies.

Acknowledgments

This study has been conducted in cooperation between Wageningen University & Research (The Netherlands) and the University of Anbar, which was done under the part of Orange Knowledge Programme (OKP-IRA-104278) which is fully funded by Nuffic.

Conflicts of Interest

The authors declare no conflict of interest.

References

  1. Wesseling, J.; Adham, A.; Riksen, M.; Ritsema, C.; Oostindie, K.; Heidema, N. A Microsoft Excel Application to Simulate Water Harvesting in a Catchment. Water Harvest. Res. 2021, 4, 1–18. [Google Scholar]
  2. Sayl, K.N.; Mohammed, A.S.; Ahmed, A.D. GIS-based approach for rainwater harvesting site selection. IOP Conf. Ser. Mater. Sci. Eng. 2020, 737, 012246. [Google Scholar] [CrossRef]
  3. Hussien, B.M. Hydrogeologic condition within al-Anbar governorate. J. Anbar Univ. Pure Sci. 2010, 4, 97–111. [Google Scholar]
  4. Kamel, A.; Sulaiman, S.O.; Sayl, K.N. Hydrologic study for the Iraqi Western Desert to assess water harvesting projects. Iraqi J. Civ. Eng. 2011, 7, 16–27. [Google Scholar]
  5. Dongol, R.; Bohora, R.C.; Chalise, S.R. Sustainability of rainwater harvesting system for the domestic needs: A case of Daugha Village Development Committee, Gulmi, Nepal. Nepal J. Environ. Sci. 2017, 5, 19–25. [Google Scholar] [CrossRef] [Green Version]
  6. Pope, J.; Annandale, D.; A Morrison-Saunders, A. Conceptualising sustainability assessment. Environ. Impact Assess Rev. 2004, 24, 595–616. [Google Scholar] [CrossRef] [Green Version]
  7. Waheed, B.; Khan, F.; Veitch, B. Linkage-Based Frameworks for Sustainability Assessment: Making a Case for Driving Force-Pressure-State-Exposure- Effect-Action (DPSEEA) Frameworks. Sustainability 2009, 1, 441–463. [Google Scholar] [CrossRef] [Green Version]
  8. Pachpute, J.S.; Tumbo, S.D.; Sally, H.; Mul, M.L. Sustainability of rainwater harvesting systems in rural catchment of Sub-Saharan Africa. Water Resour. Manag. 2009, 23, 2815–2839. [Google Scholar] [CrossRef]
  9. Ngigi, S.; Savenije, H.H.G.; Glehuki, F.N. Hydrological impacts of flood storage and management on irrigation water abstraction in Upper Ewaso Ng’iro river basin, Kenya. J. Water Resour. Manag. 2008, 22, 1859–1879. [Google Scholar] [CrossRef] [Green Version]
  10. Hashimoto, T.; Stedinger, J.R.; Loucks, D.P. Reliability, resiliency, and vulnerability criteria for water resource system performance evaluation. Water Resour. Res. 1982, 18, 14–20. [Google Scholar] [CrossRef] [Green Version]
  11. Kjeldsen, T.R.; Rosbjerg, D. Choice of reliability, resilience and vulnerability estimators for risk assessments of water resources systems. Hydrol. Sci. J. 2004, 49, 755–767. [Google Scholar] [CrossRef]
  12. Sandoval-Solis, S.; McKinney, D.C.; Loucks, D.P. Sustainability index for water resources planning and management. J. Water Resour. Plan. Manag. 2011, 137, 381–390. [Google Scholar] [CrossRef] [Green Version]
  13. Park, D.; Um, M.-J. Sustainability Index Evaluation of the Rainwater Harvesting System in Six US Urban Cities Daeryong. Sustainability 2018, 10, 280. [Google Scholar] [CrossRef] [Green Version]
  14. Sulaiman, S.O.; Kamel, A.H.; Sayl, K.N.; Alfadhel, M.Y. Water resources management and sustainability over the Western desert of Iraq. Environ. Earth Sci. 2019, 78, 495. [Google Scholar] [CrossRef]
  15. Abdulhameeda, I.M.; Mohammeda, A.S.; Kamela, A.H.; ALmafrchib, K.Y.; Alhadeethia, I.K.; Fayyadha, A.S.; Al-Esawia, J.S.E. Sustainable Development of Wadi Houran-Western Iraqi Desert. Iraqi J. Civ. Eng. 2020, 15, 45–53. [Google Scholar]
  16. Sayl, K.; Adham, A.; Ritsema, C.J. A GIS-based multicriteria analysis in modeling optimum sites for rainwater harvesting. Hydrology 2020, 7, 51. [Google Scholar] [CrossRef]
  17. Adham, A.; Sayl, K.N.; Abed, R.; Abdeladhim, M.A.; Wesseling, J.G.; Riksen, M.; Ritsema, C.J. A GIS-based approach for identifying potential sites for harvesting rainwater in the Western Desert of Iraq. Int. Soil Water Conserv. Res. 2018, 6, 297–304. [Google Scholar] [CrossRef]
  18. Consortium-Yugoslavia. Hydrogeological Explorations and Hydrotechnical Work-Western Desert of Iraq; Blook7; Directorate of Western Desert Development Projects: Baghdad, Iraq, 1977; Unpublished. [Google Scholar]
  19. Ministry of Water Resources. General Authority for Dams and Reservoirs; Water Resources Department in Al-Anbar Governorate: Baghdad, Iraq, 2015; Unpublished data.
  20. Ministry of Agriculture. Hydrological Explorations and Hydro Technical Works. (Vol 1 Climatology and Hydrology Works); Vol 5: Hydrology Iraq Western Desert—Block 7; Directorate of Western Desert Development Projects: Baghdad, Iraq, 1977.
  21. Adham, A.; Wesseling, J.G.; Abed, R.; Riksen, M.; Ouessar, M.; Ritsema, C.J. Assessing the impact of climate change on rainwater harvesting in the Oum Zessar watershed in Southeastern Tunisia. Agric. Water Manag. 2019, 221, 131–140. [Google Scholar] [CrossRef]
  22. Boers, T.M.; Zondervan, K.; Ben-Asher, J. Micro-catchment-water-harvesting (MCWH) for arid zone development. Agric. Water Manag. 1986, 12, 21–39. [Google Scholar] [CrossRef]
  23. Charman, J.; Kostov, L.; Minetti, J.; Stoutesdijk, D.; Tricoli, D.; Olivier, A. Small Dams and Weirs in Earth and Gabion Materials; Land and Water Development Division, Food and Agriculture Organization of the United Nations: Rome, Italy, 2001. [Google Scholar]
  24. Maestre-Valero, J.F.; Martínez-Granados, D.; Martínez-Alvarez, V.; Calatrava, J. Socio-economic impact of evaporation losses from reservoirs under past, current and future water availability scenarios in the semi-arid Segura Basin. Water Resour. Manag. 2013, 27, 1411–1426. [Google Scholar] [CrossRef]
  25. Martinez-Granados, D.; Francisco Maestre-Valero, J.; Calatrava, J.; Martinez-Alvarez, V. The economic impact of water evaporation losses from water reservoirs in the Segura Basin, SE Spain. Water Resour. Manag. 2011, 25, 3153–3175. [Google Scholar] [CrossRef]
  26. Gallego-Elvira, B.; Martínez-Alvarez, V.; Pittaway, P.; Brink, G.; Martín-Gorriz, B. Impact of micrometeorological conditions on the efficiency of artificial monolayers in reducing evaporation. Water Resour. Manag. 2013, 27, 2251–2266. [Google Scholar] [CrossRef]
  27. Laxman, J. An Artificial Neural Network Approach for the Determination of Infiltration Model Parameters. Ph.D. Thesis, Dept. Faculty of Engineering, Swami Ramanand Teerth Marathwada University, Nanded, India, 2016. [Google Scholar]
  28. Western Desert Dams, Design Report of Horan Dam H/3, H/2; Ministry of Irrigation: Colombo, Sri Lanka, 1994.
  29. Yuan, Y.; Mitchell, J.; Hirschi, M.; Cooke, R. Modified SCS curve number method for predicting subsurface drainage flow. Trans. ASBE 2001, 44, 1673–1682. [Google Scholar] [CrossRef]
  30. Sayl, K.N.; Afan, H.A.; Muhamad, N.S.; Elshafie, A. Development of a Spatial Hydrologic Soil Map Using Spectral Reflecatance Band Recognition and a Multiple-Output Artificial Neural Network Model. Hydrol. Earth Syst. Sci. Discuss 2017, 1–16. [Google Scholar] [CrossRef]
Figure 1. Wadi Horan and the location of the Al-Abila dam (study area) [17].
Water 14 00586 g001
Figure 2. Al-Abila Dam.
Water 14 00586 g002
Figure 3. Land use/land cover map.
Water 14 00586 g003
Figure 4. Hydrological soil group map of the Wadi Horan.
Water 14 00586 g004
Figure 5. CN map for the Wadi Horan.
Water 14 00586 g005
Figure 6. A water balance (supply and demand) of the Al-Abila dam.
Water 14 00586 g006
Table 1. The characteristics of Al-Abila dam [19].
Name of DamCatchment Area (km2)Storage Area (km2)Max. Spillway
Height (m)
Storage Capacity (m3)
Al-Abila dam5801.511310,142
Table 2. Runoff Curve Number [30].
Hydrologic Soil Group (HSG)
Land CoverABCT
Bare Soil77869194
Built up61758387
Water100100100100
Farmland72818891
Grass43657682
Table 3. Source streams of the Al-Abila dam catchment.
Average Slope (m/km)Main Soil TypeSignificant LU/LCWater AvailabilityCatchment
Area (km2)
CNMax. Retention (S)
1.46Sandy loamBare landEphemeral58076.578.2
Table 4. Monthly water use (m3) due to human use and animal watering in the year 2019.
MonthHuman Uses
(m3) ×103
Animal Watering
(m3) ×103
Residual Water
(m3) ×103
May4230.3
June12640.1
July8410
August000
September000
Total24128
Table 5. The water conveyance factor for the runoff years 1990–2019.
YearVolume of Water Diverting (m3)Volume of Water Receiving (m3)Water Conveyance
199015,00050000.33
199313,00045000.35
199414,50040000.28
200612,00035000.29
200811,00040000.36
201010,00030000.3
2011850027500.32
2012780020000.26
2013900027500.31
2014600015000.25
2018550015000.27
2019450010000.22
Average0.3
Publisher’s Note: MDPI stays neutral with regard to jurisdictional claims in published maps and institutional affiliations.

