
Determination of Physicochemical Water Quality of the Ghis-Nekor Aquifer (Al Hoceima, Morocco) Using Hydrochemistry, Multiple Isotopic Tracers, and the Geographical Information System (GIS)

 , , ,
, , ,  , ,
, ,  ,
,  and
and
Abstract
:1. Introduction
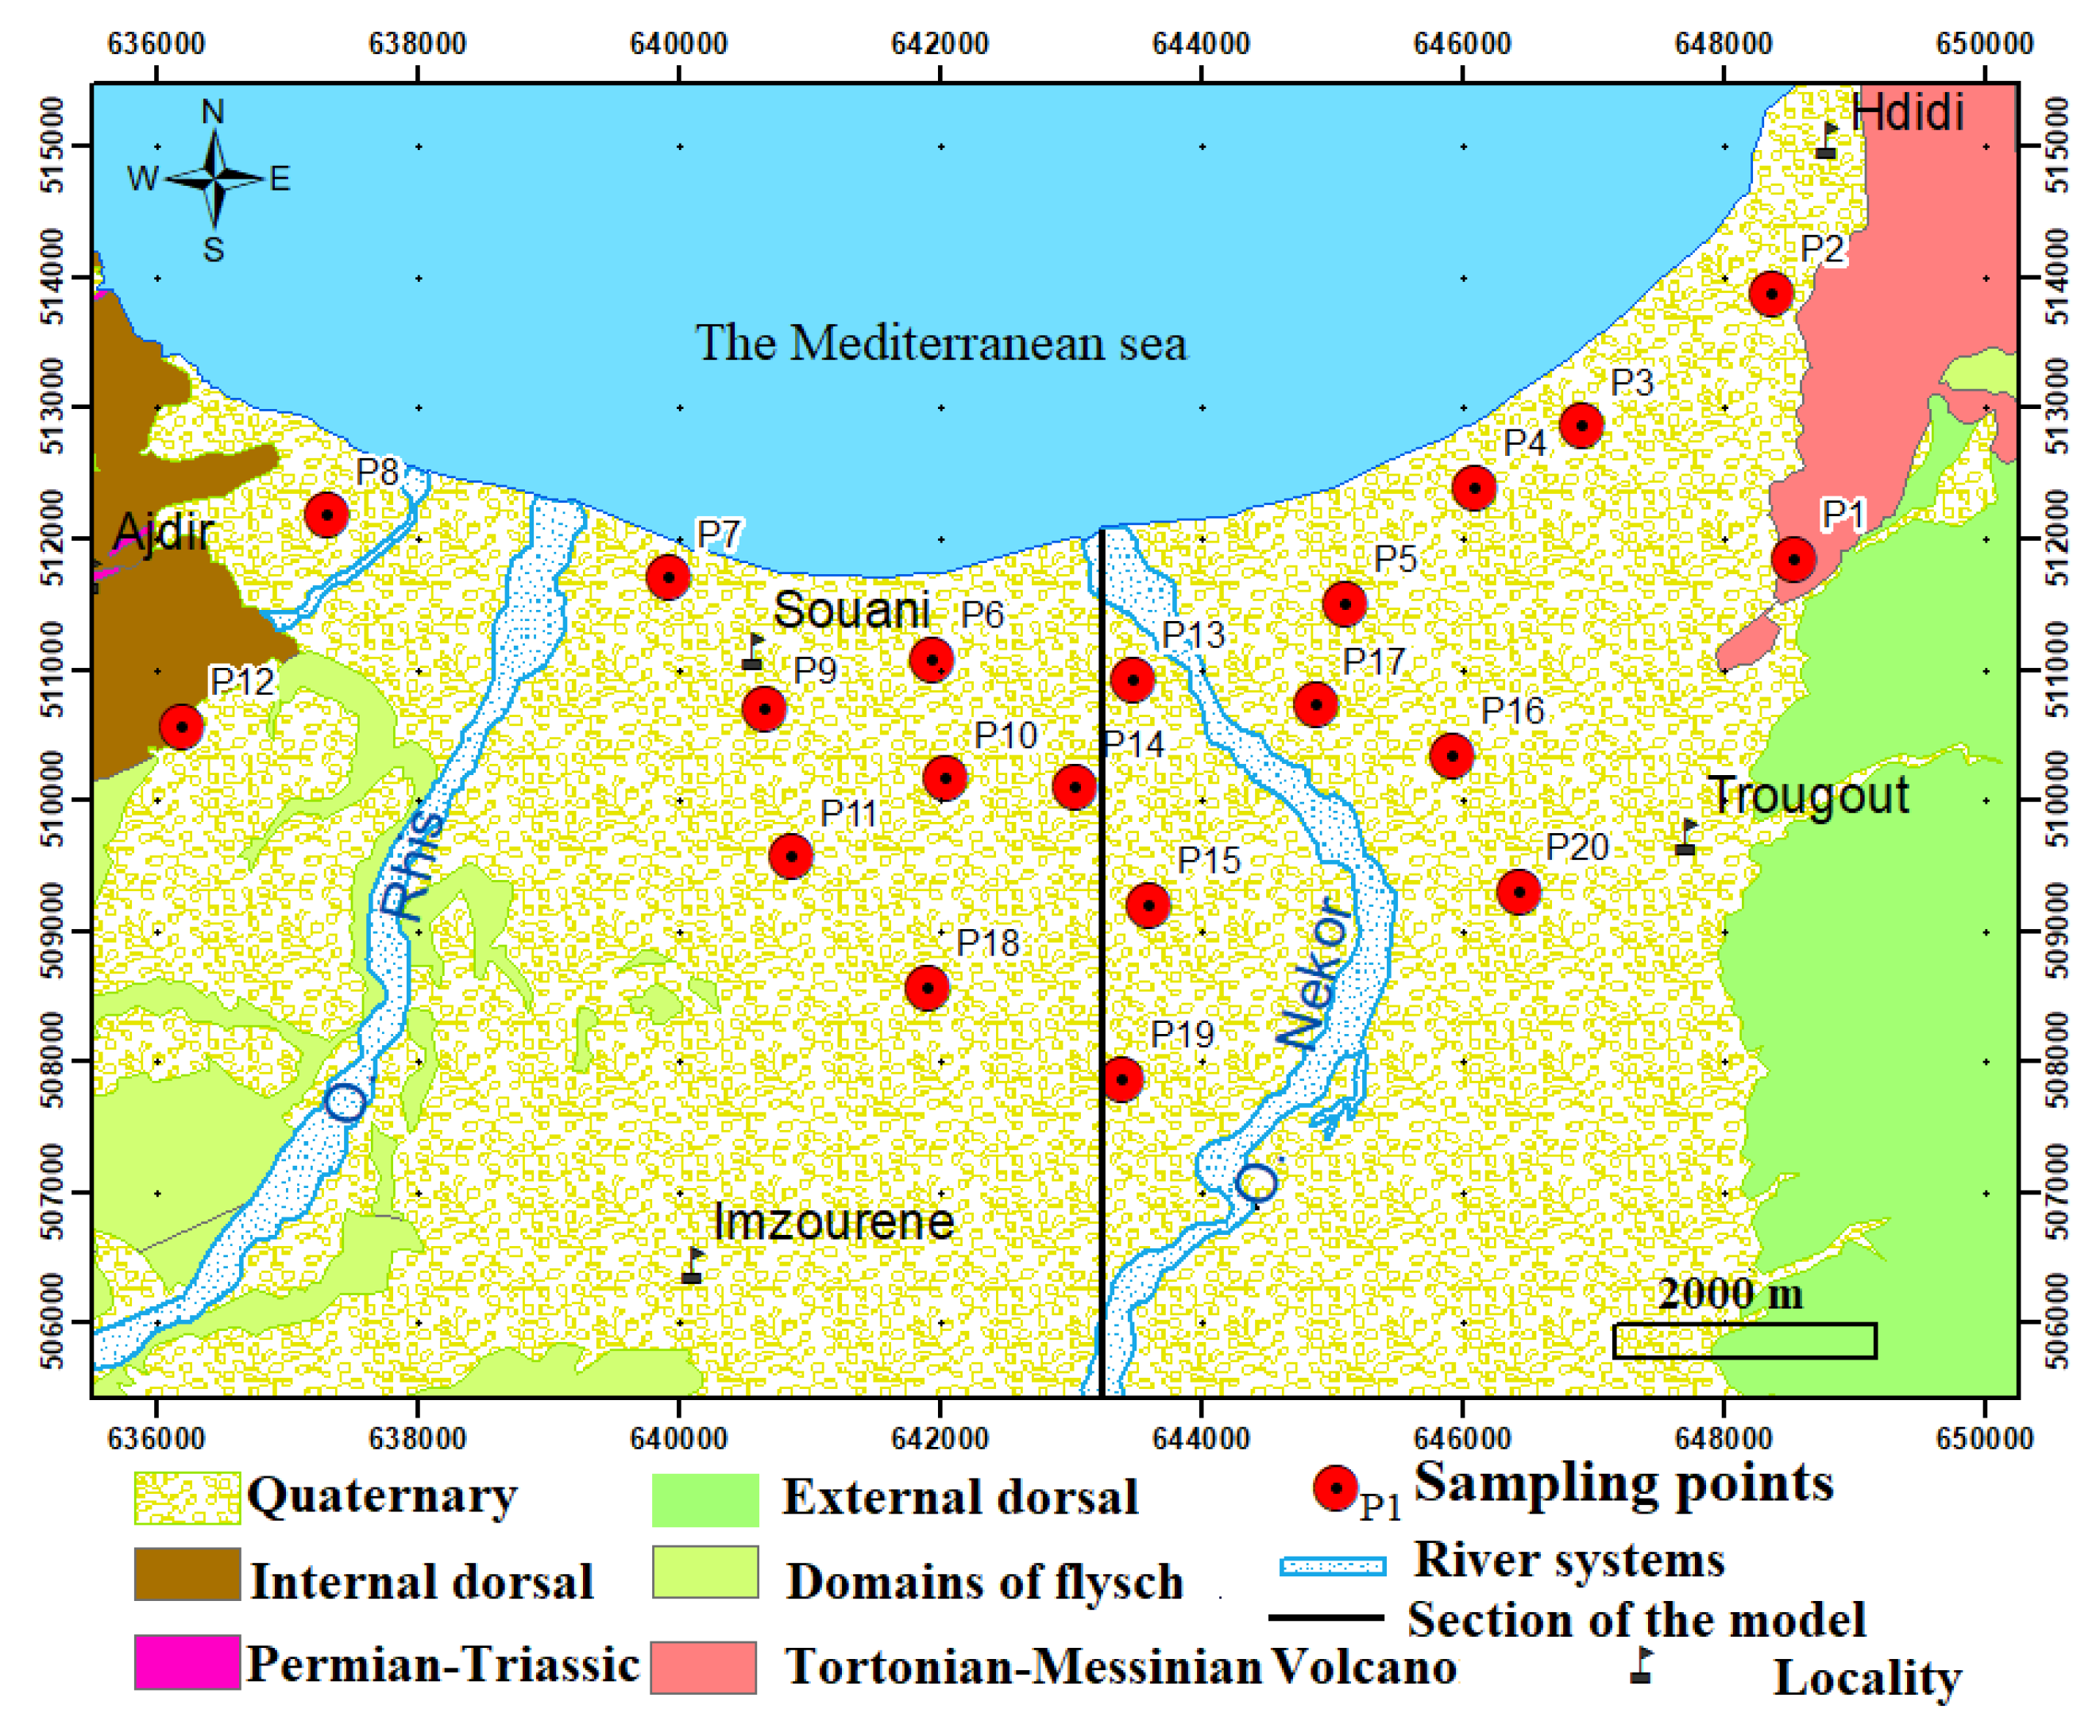
2. Study Area
2.1. Climate and Hydrology
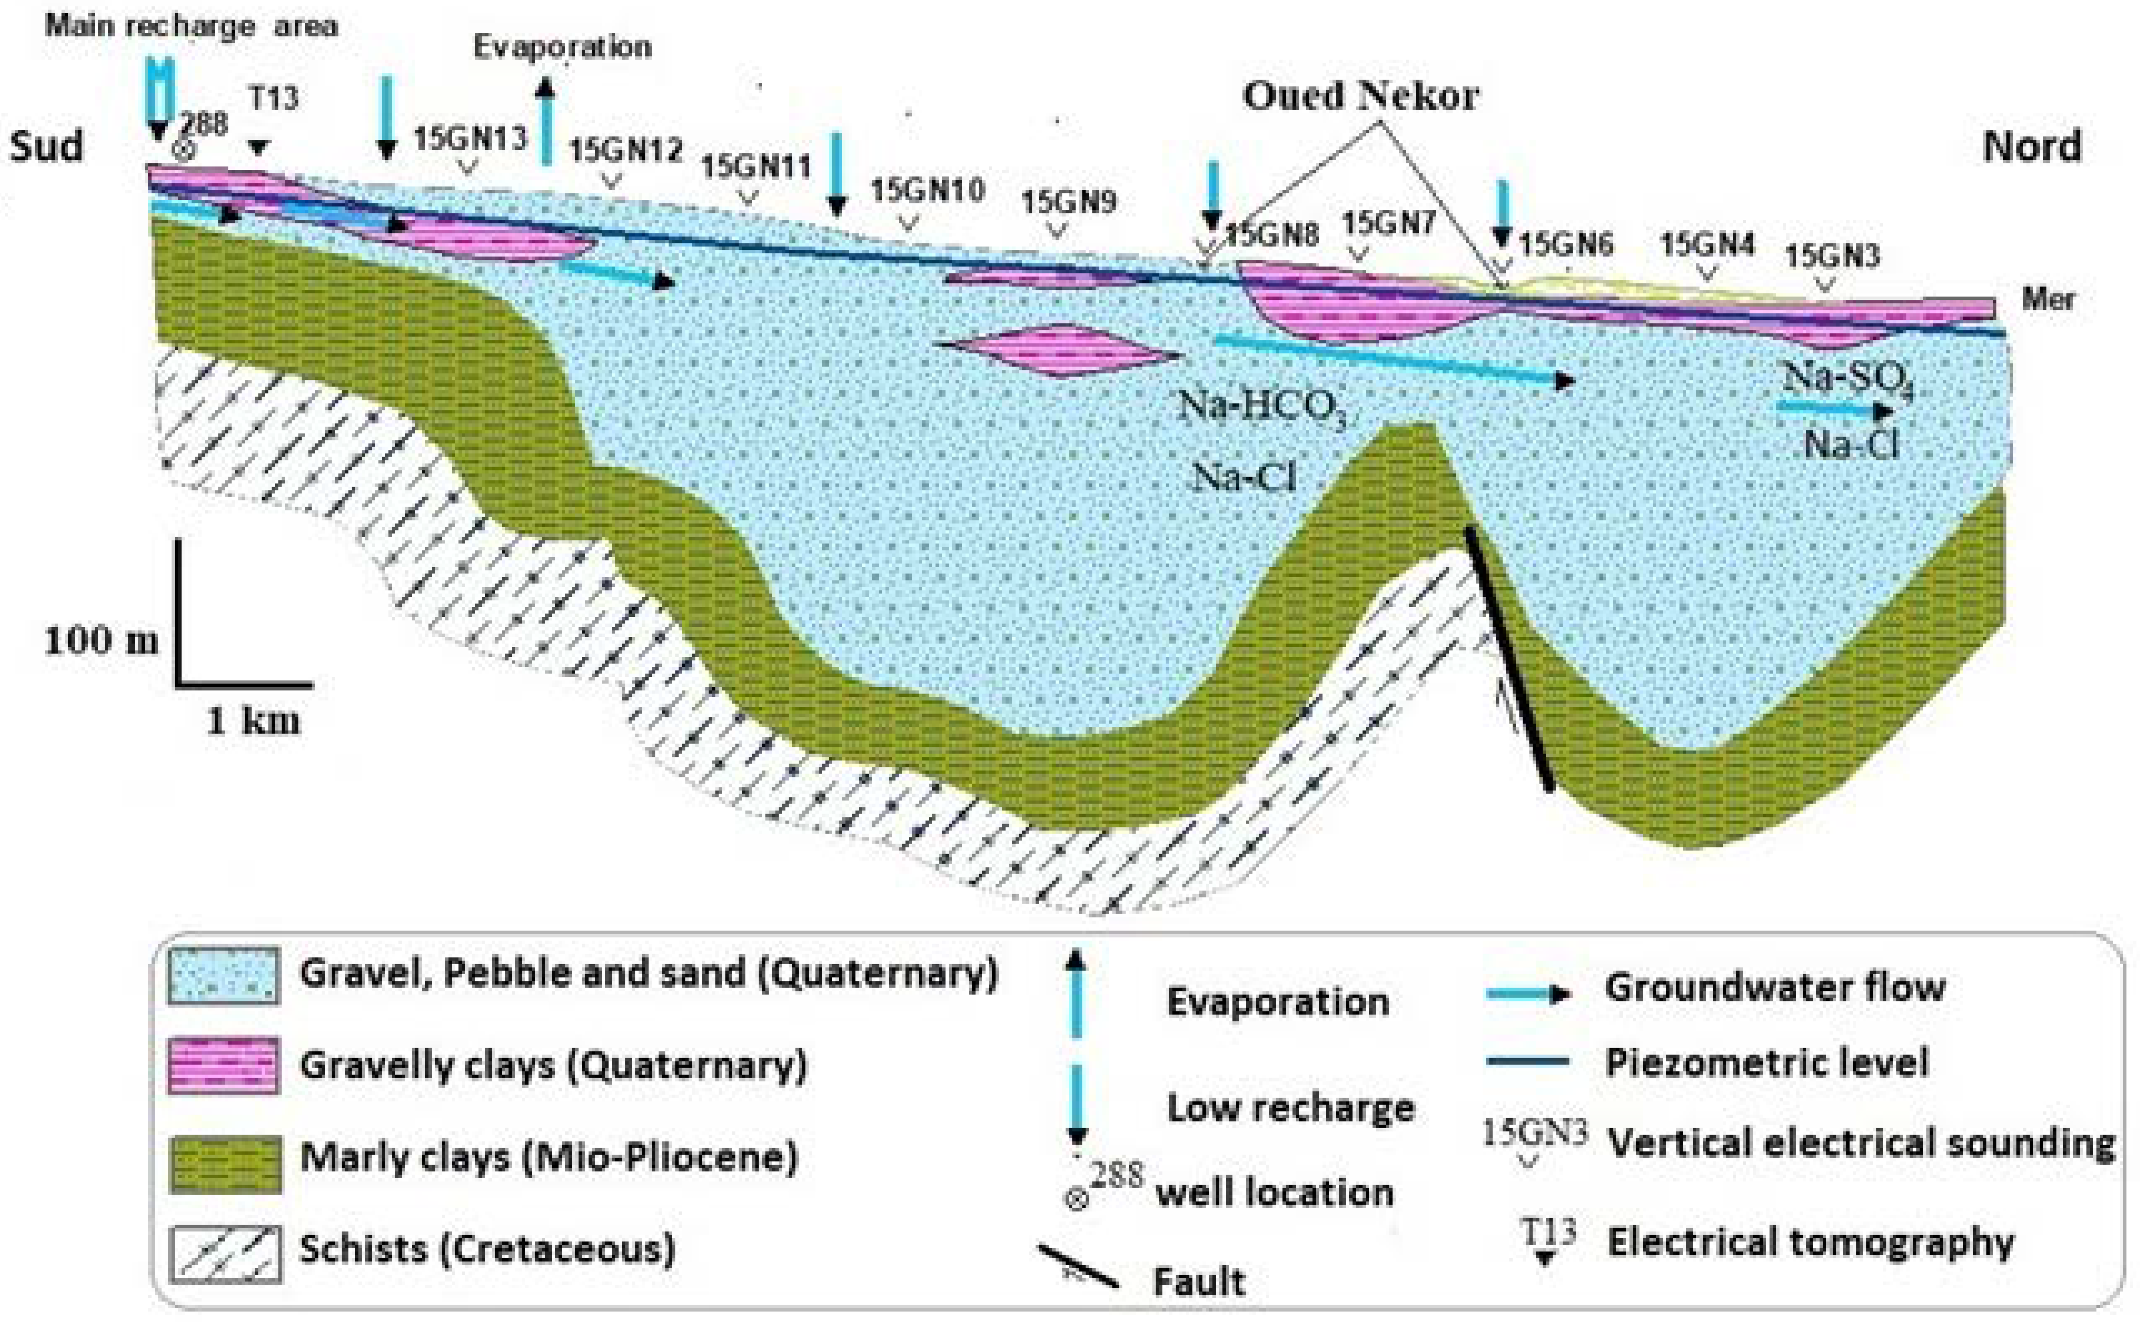
2.2. Geology and Hydrogeology
3. Materials and Methods
4. Results and Discussion
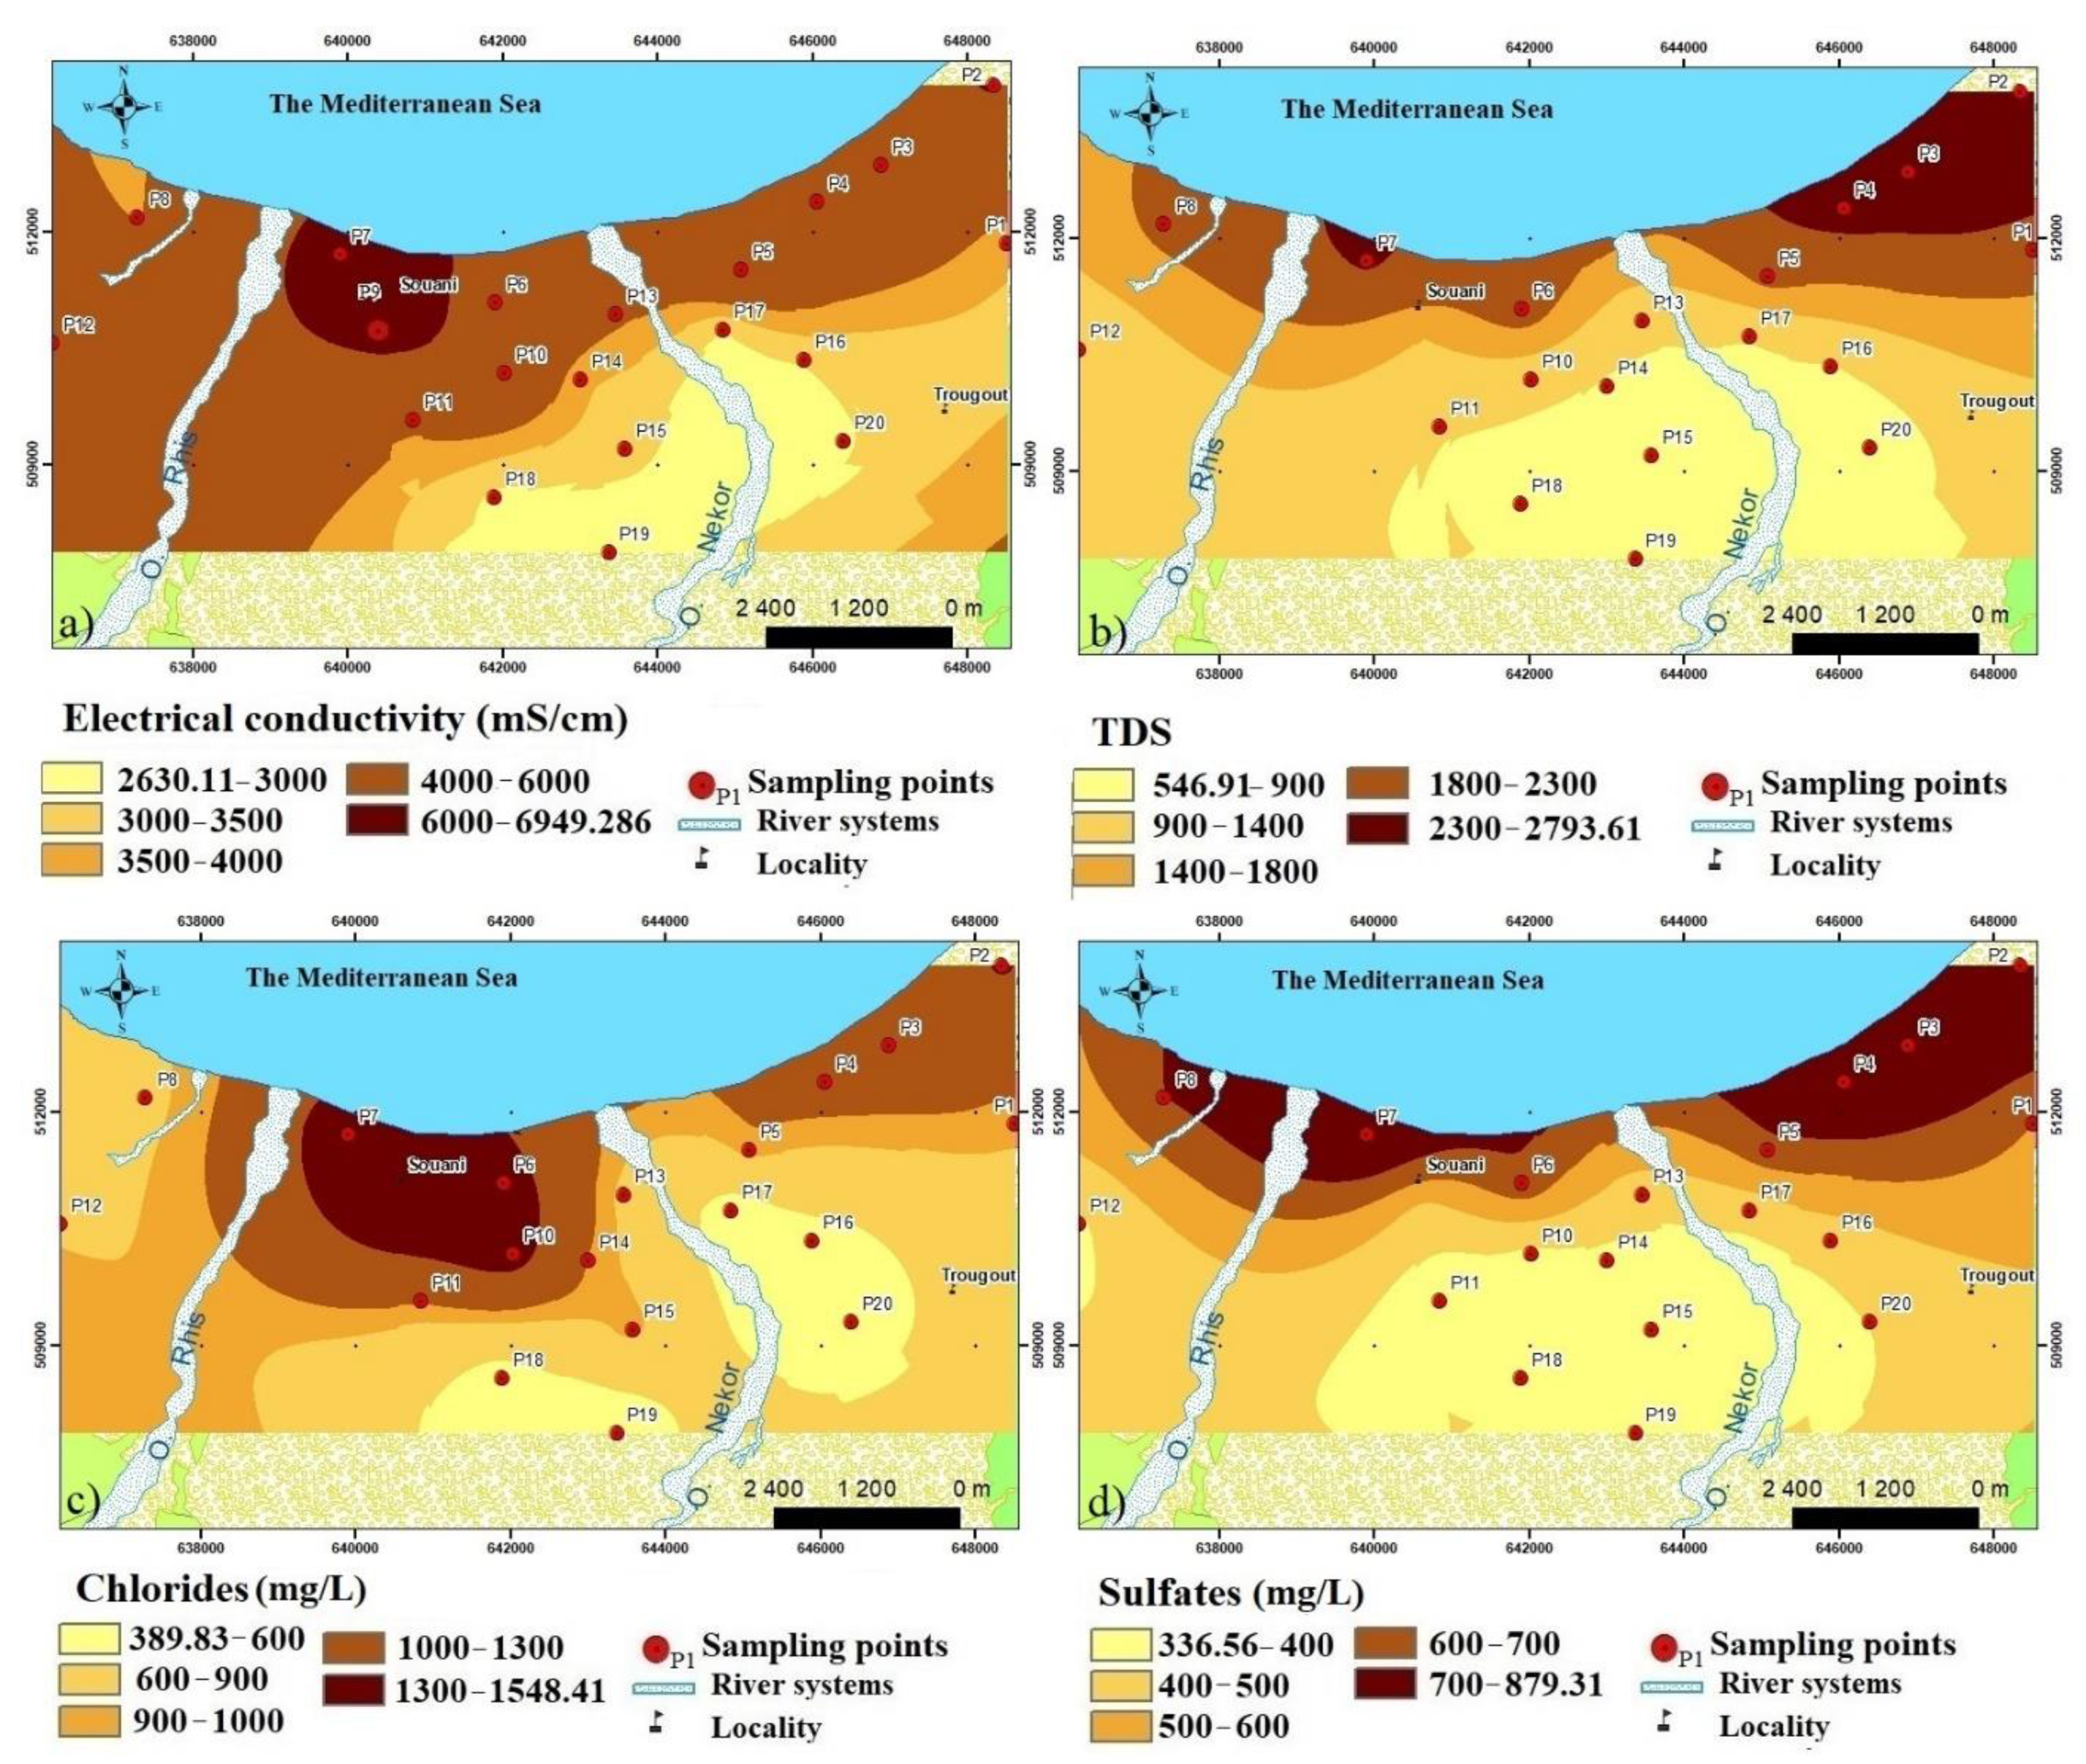
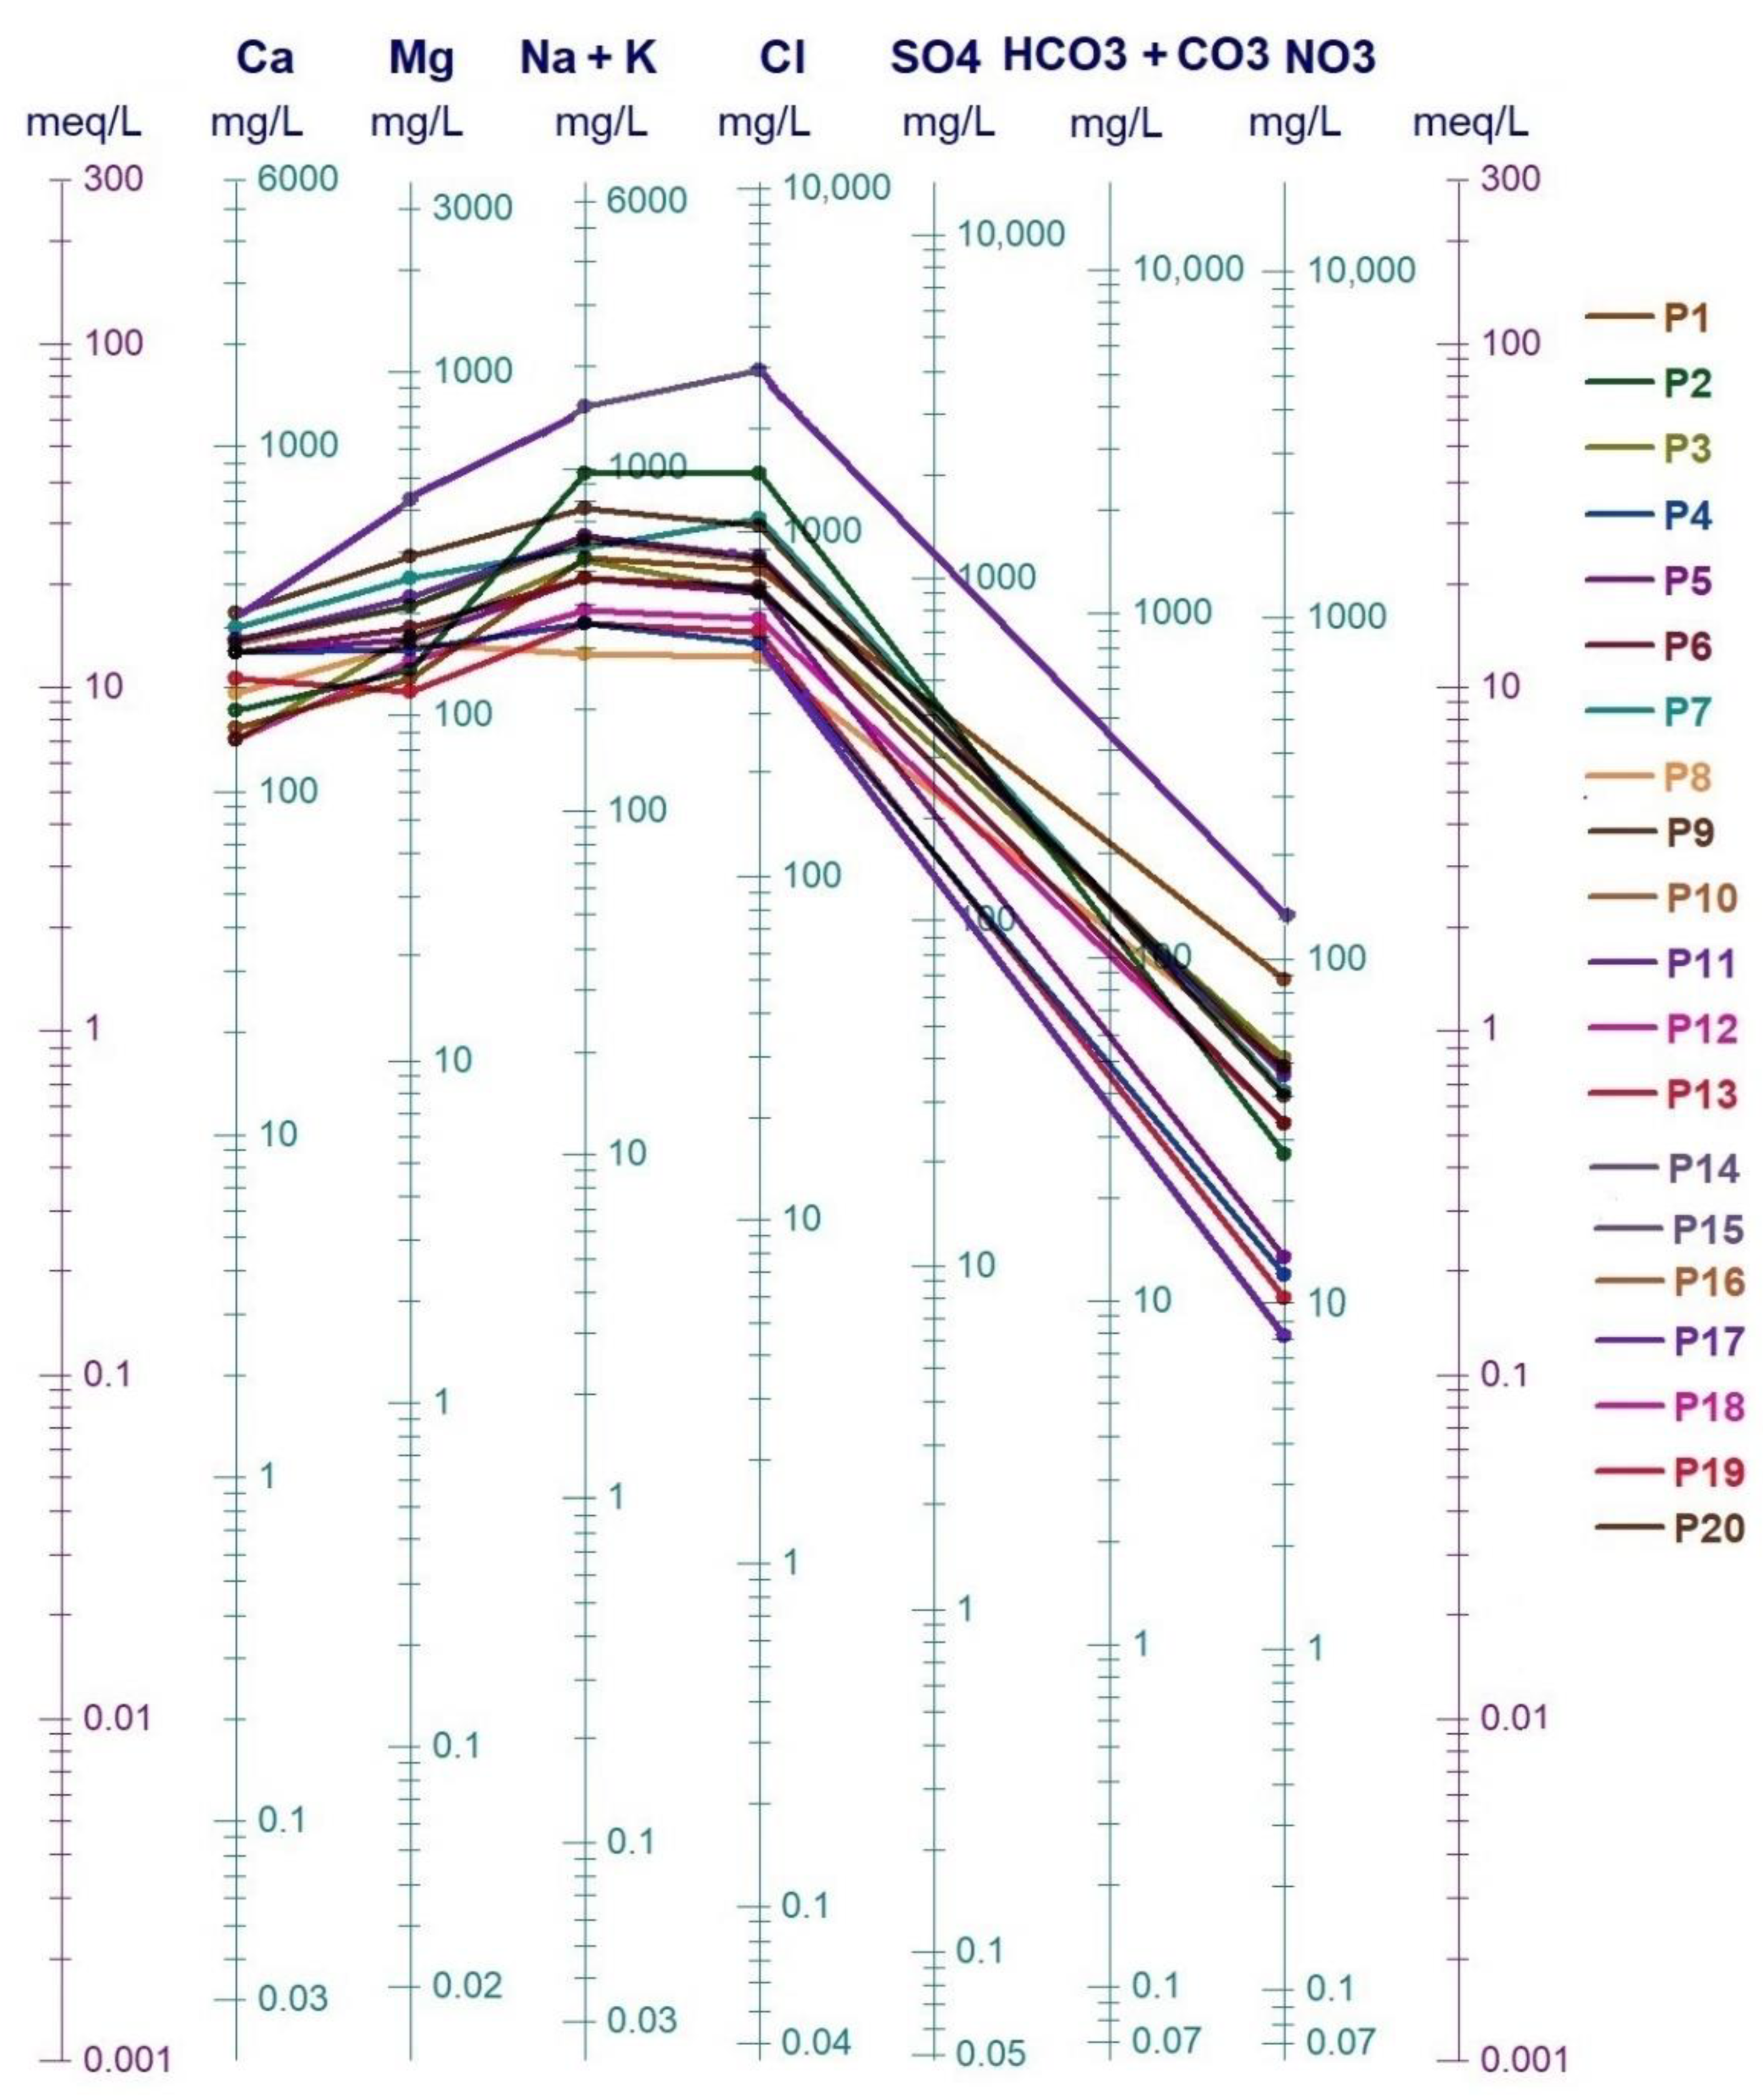
4.1. Hydrochemical Analysis
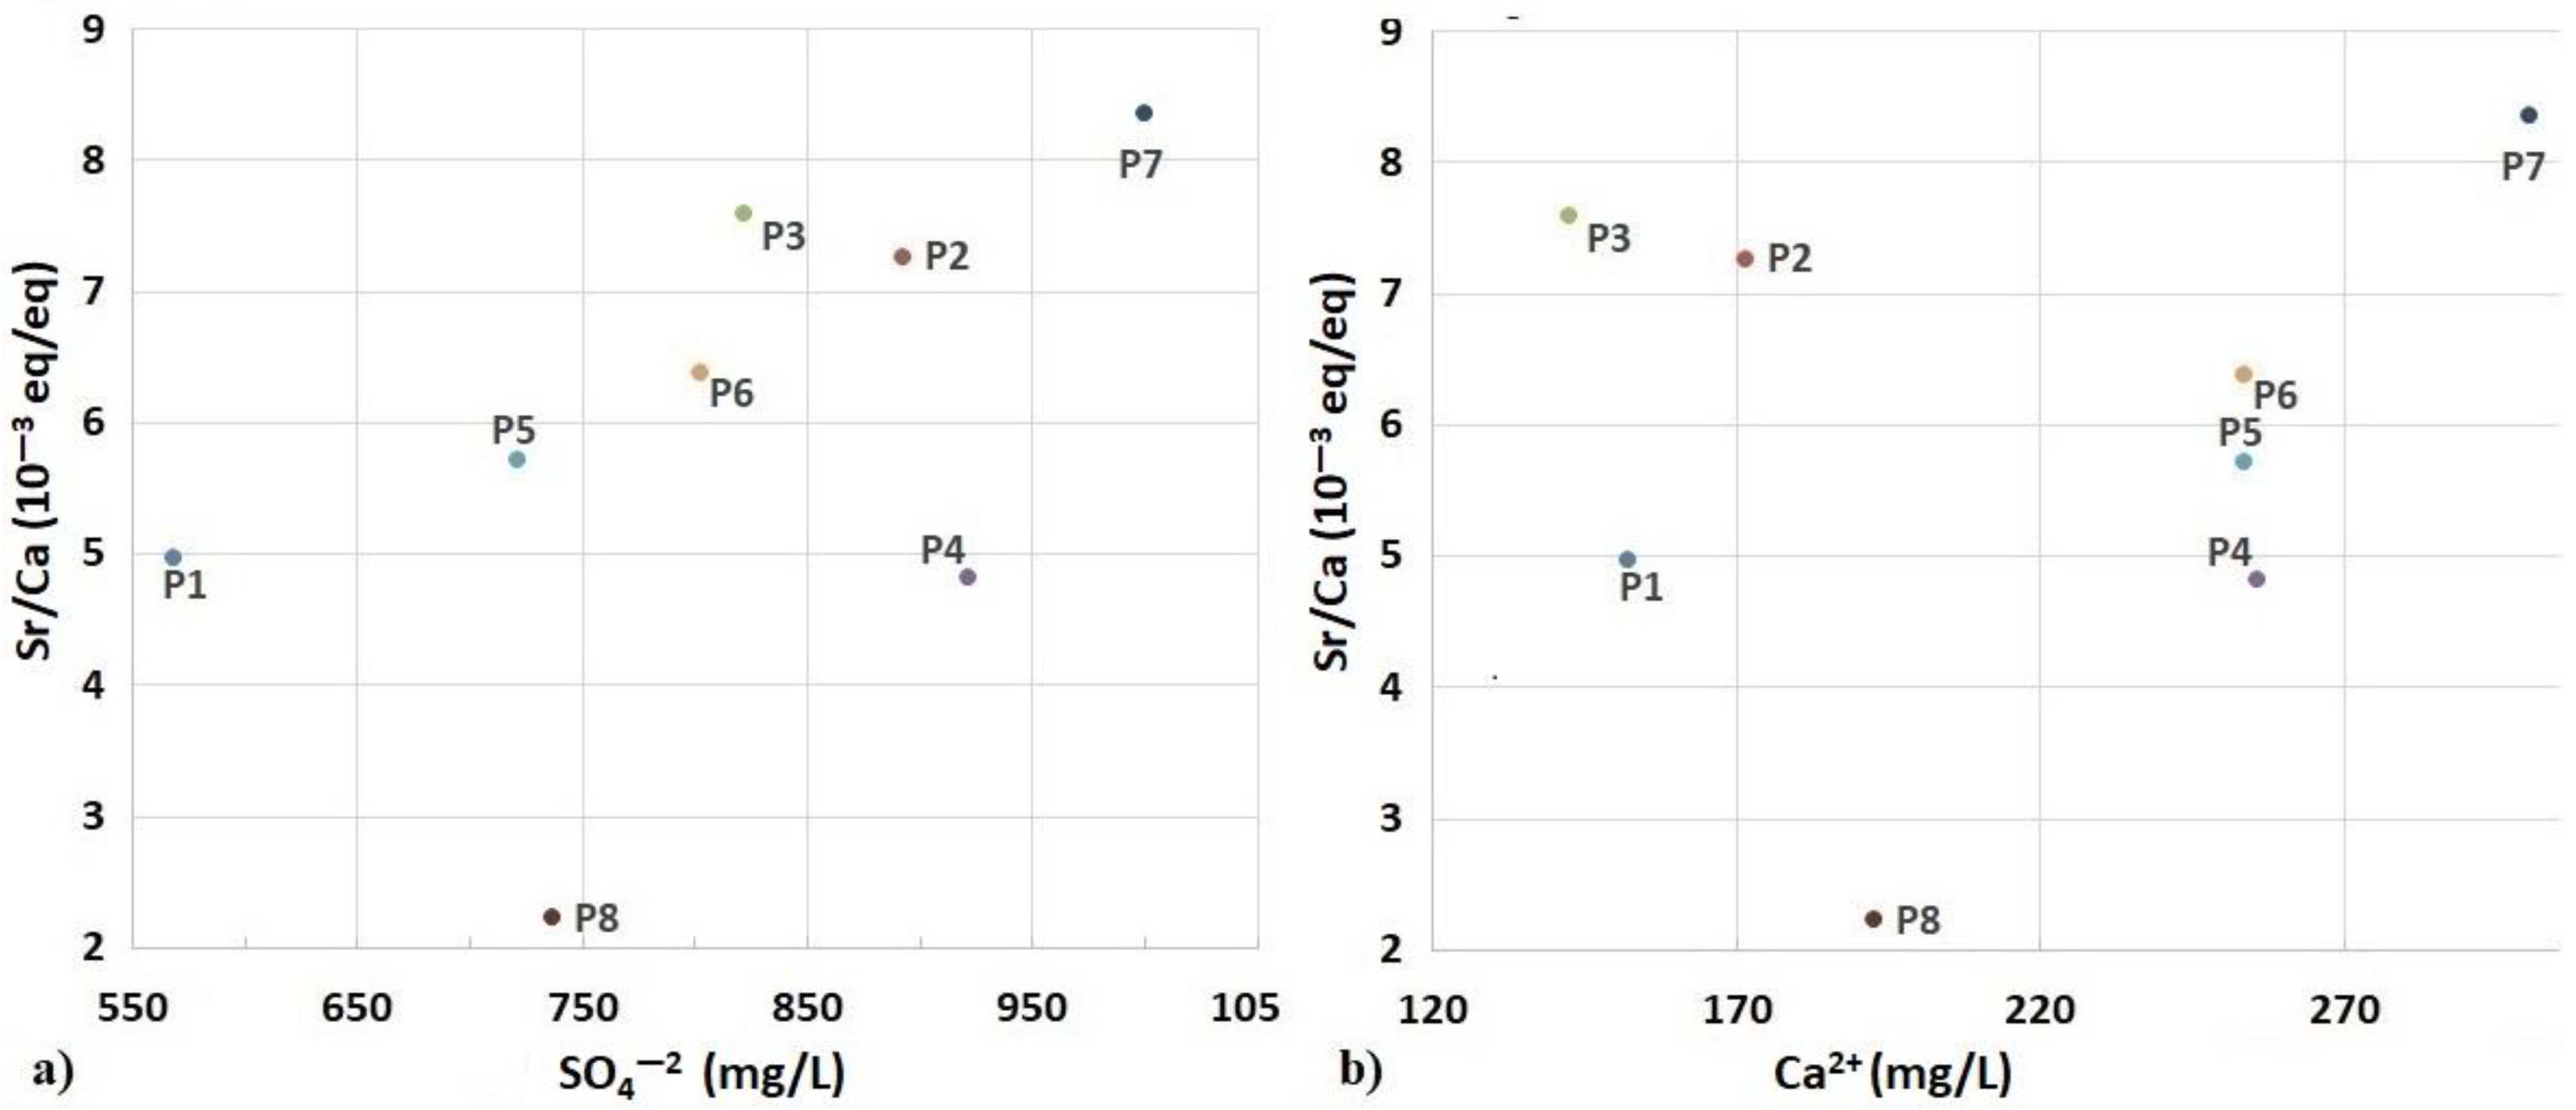
4.1.1. Sr2+/Ca2+ Ratio
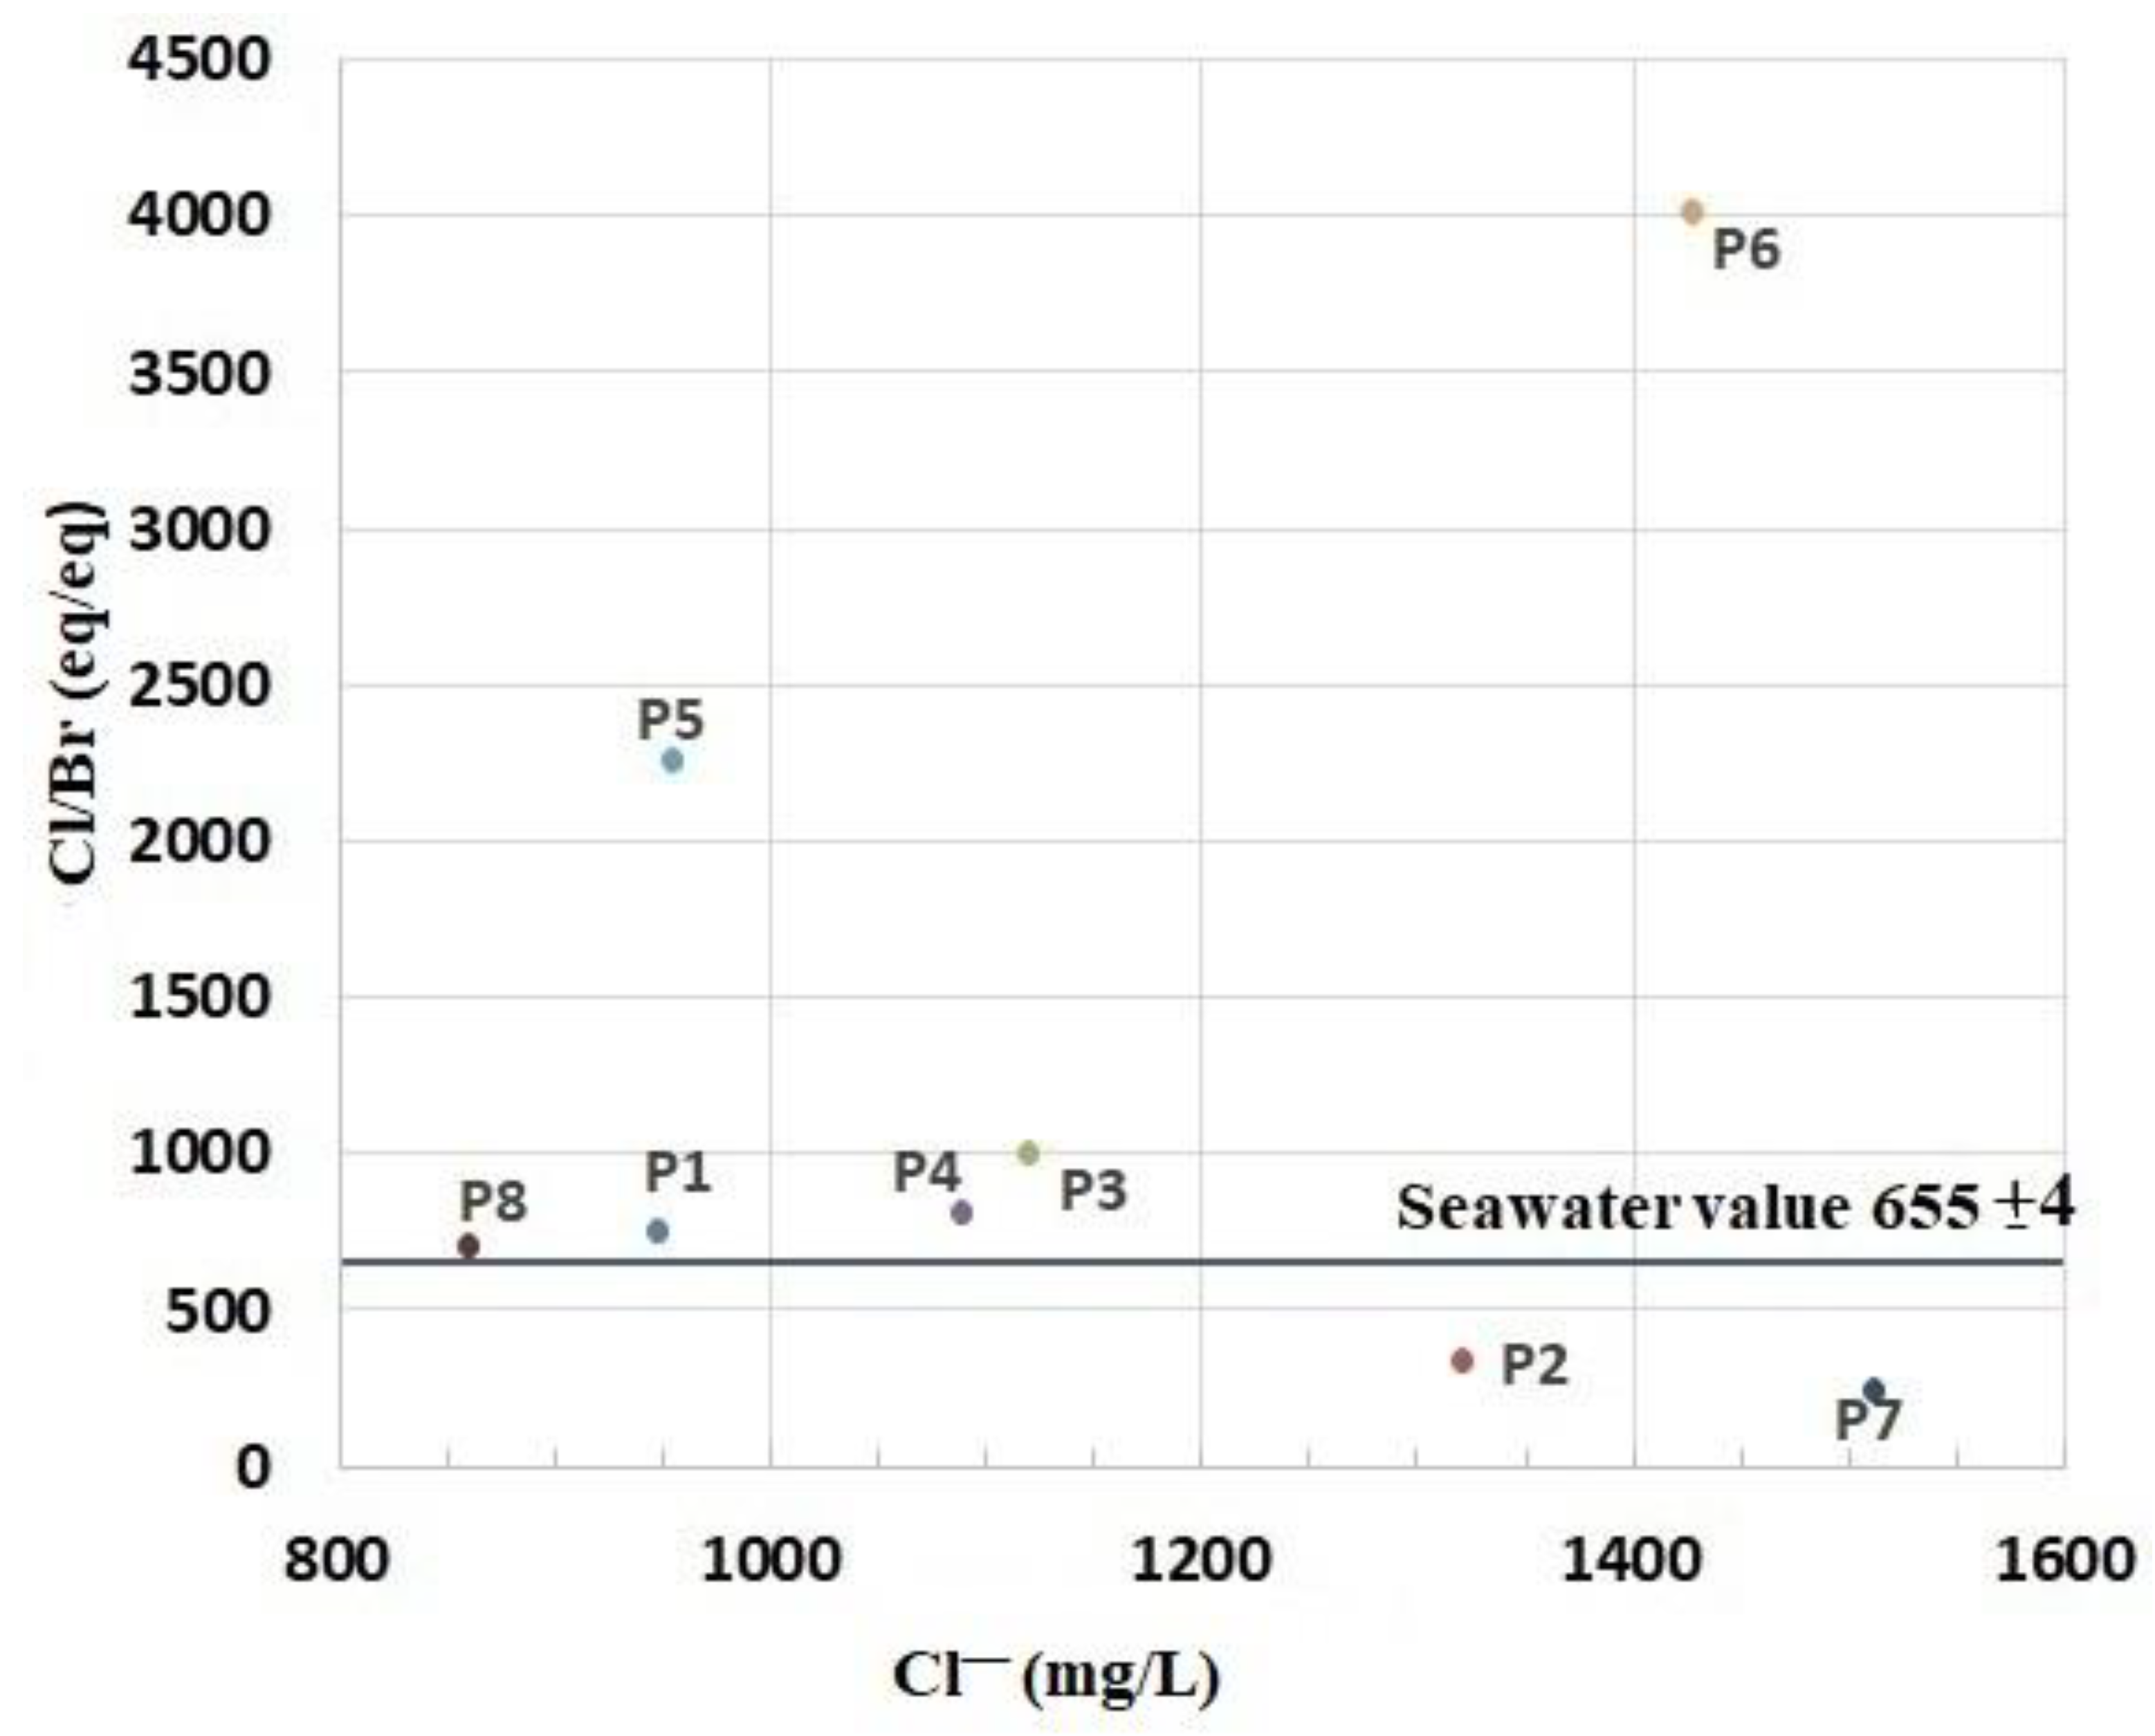
4.1.2. Contribution of the Cl−/Br– Ratio
4.2. Isotopic Analysis
4.2.1. Altitudes of Recharge Areas
4.2.2. Origin of Carbon
- -
- Decomposition of organic matter of aquifer sediments, with a typical isotopic composition δ13C (ratio between 13C and 12C) around −28‰;
- -
- Dissolution of calcites or other carbonate minerals from the rock, with a δ13C value between −14‰ and +1‰;
- -
- Diffusion of the atmospheric CO2, with a δ13C from −6‰ to −8‰.
5. Conclusions
- –
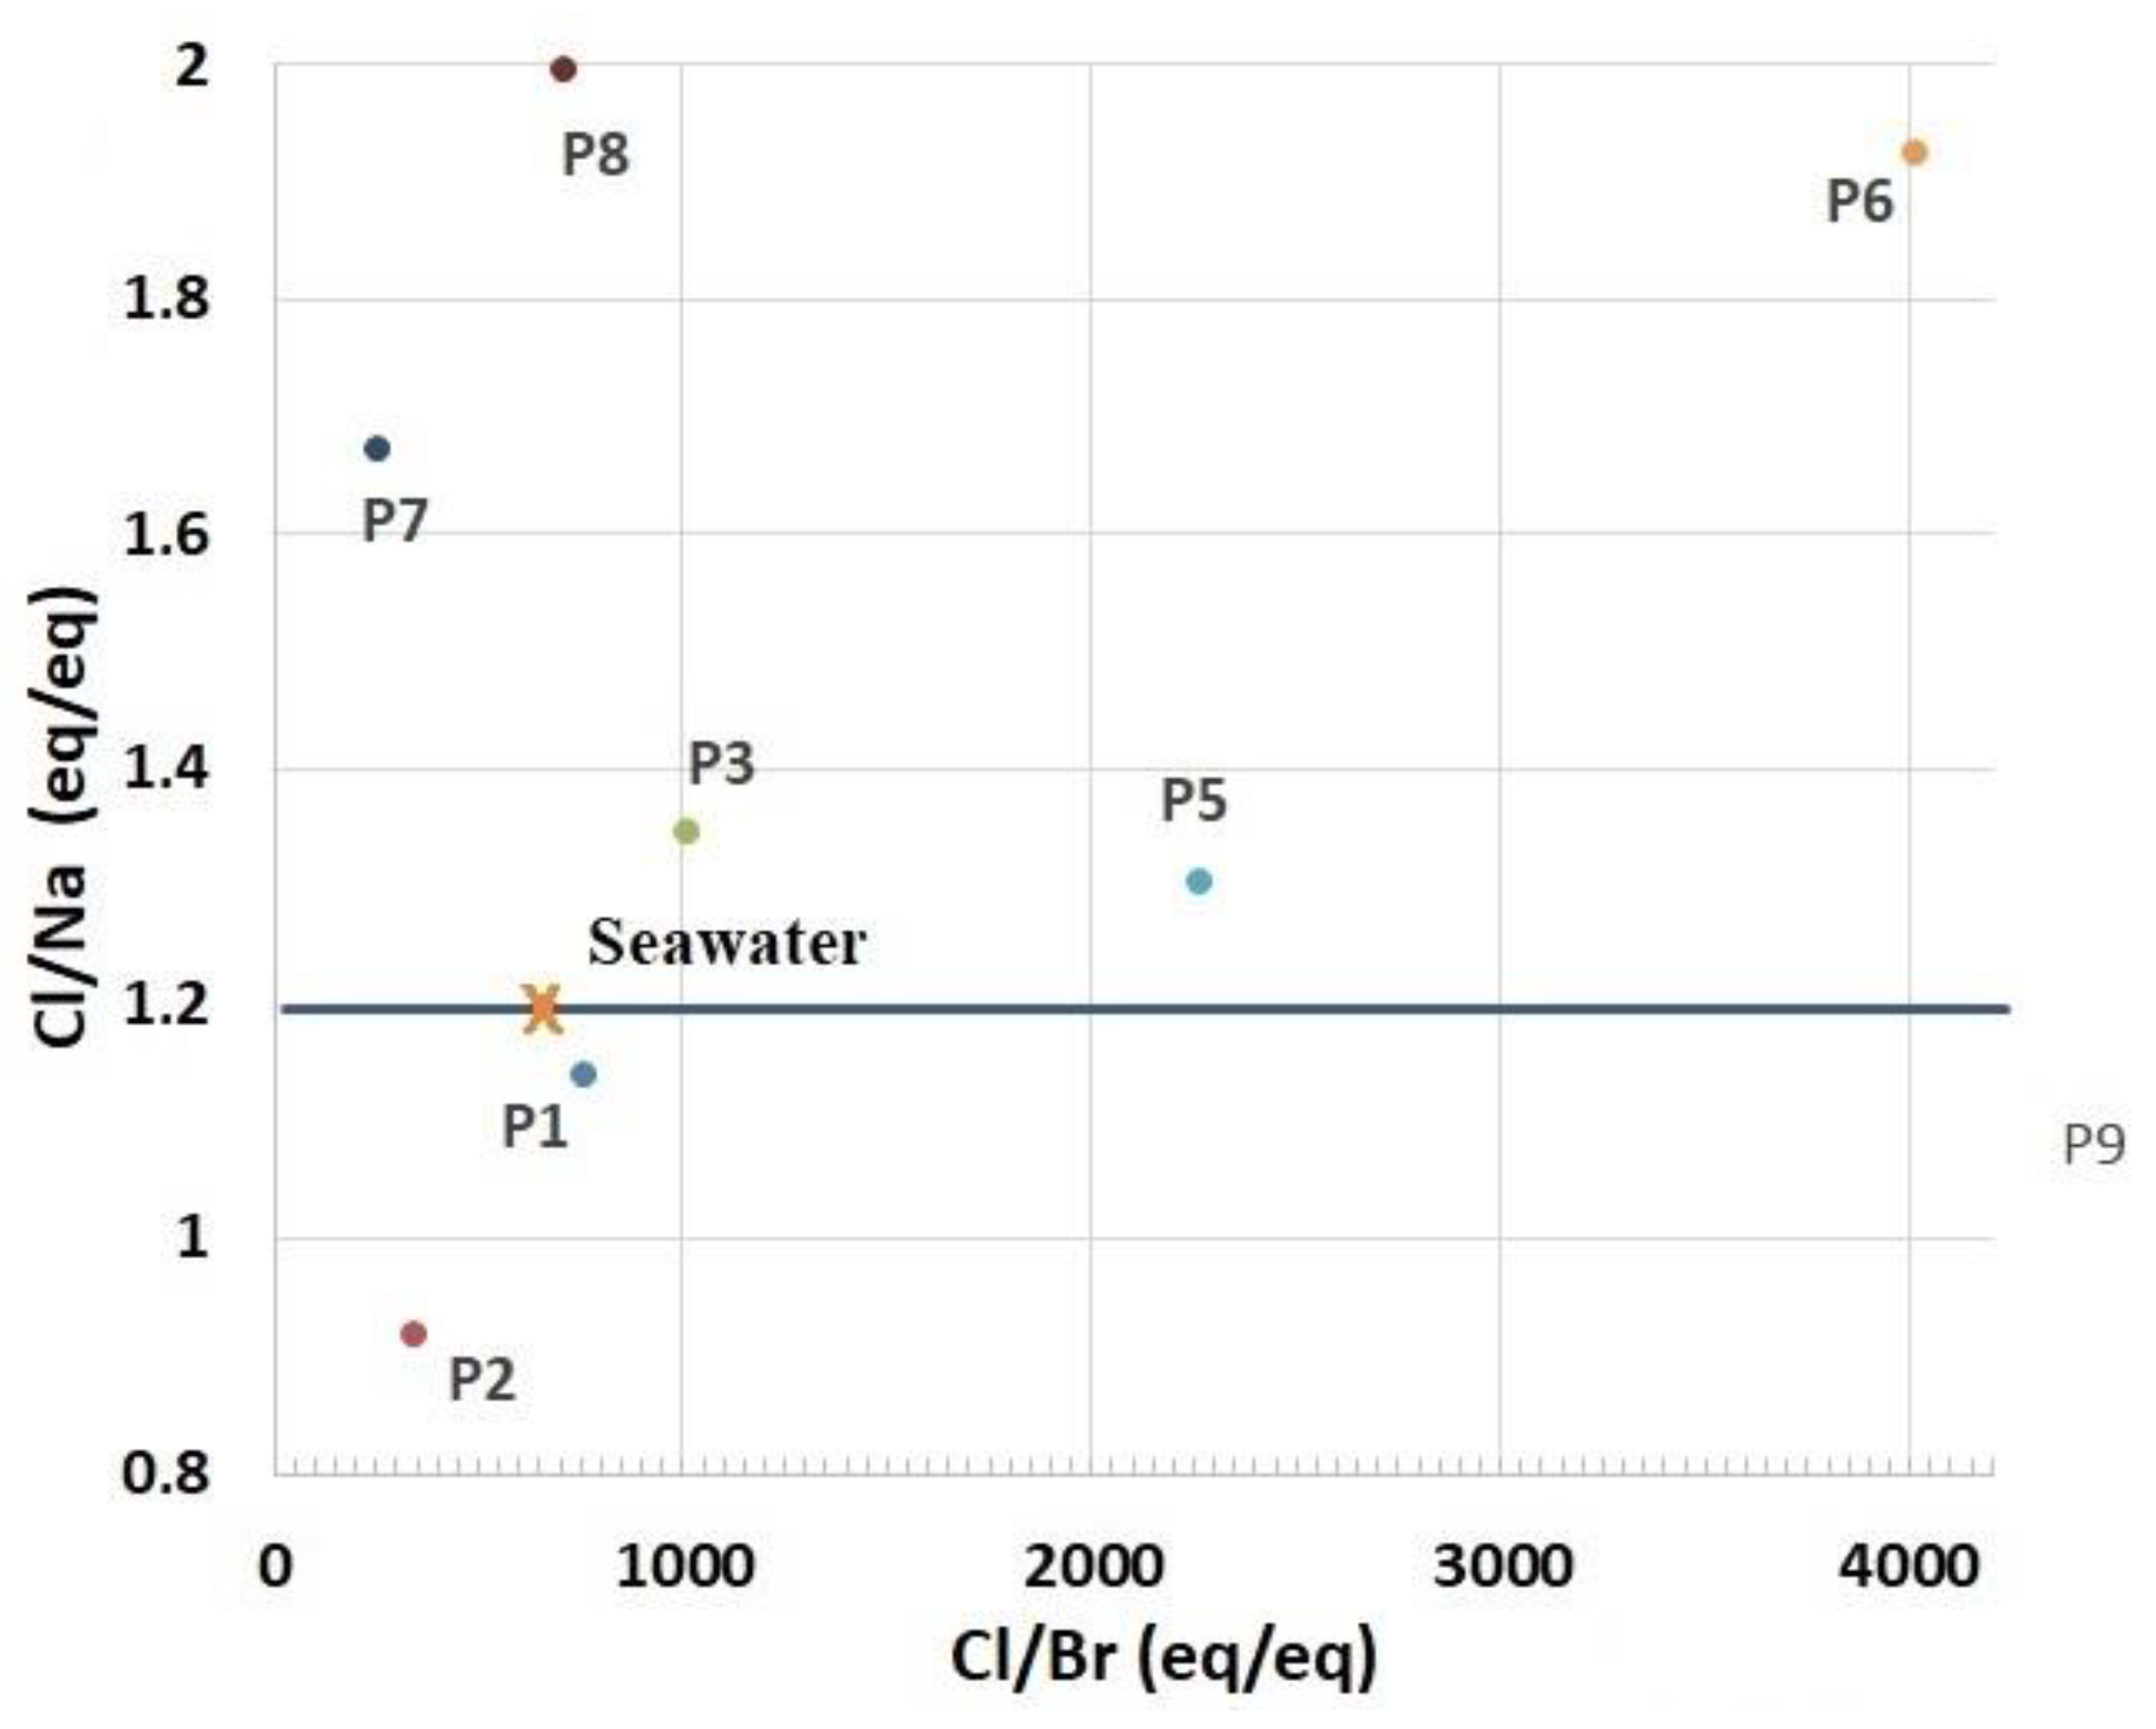
- The aquifer is subject to a notable marine intrusion proved by a water type transition from NaCl to NaSO4. This phenomenon is accentuated in the east. The projection of the analyzed sample results in the Piper diagram shows two distinct facies; the sodium chloride facies and chloride and calcium and magnesium sulfated facies chloride concentrations varied between 277 mg/L and 2976 mg/L. The relationship between Na+ and Cl− shows that some coastal wells, located in the extreme NE of the plain, are located on the NaCl correlation line, and their molar ratio Cl/Na does not differ very tangibly from that of seawater. This indicates the presence of freshwater–saltwater mixing process without ion exchange reactions.
- –
- Cl/Na ratio was also studied and compared with the Cl/Br ratio to attest the possible presence of saltwater intrusion. Besides, NaCl is widely used in various human activities, and a high Cl/Br ratio is generally considered a good indicator of the impact for domestic water. They classified the waters of the plain of the Nekor into two classes, the vulnerable wells in the north affected by high salinity and characterized by Cl/Na and Cl/Br ratios close to sea water (Cl/Na = 1.2; Cl/Br = 650); the salinity of the samples described above is probably attributed to the intrusion of saline water; and the other class located upstream of the basin with lower salinity than in the first class, with the influence of geology, agriculture, and anthropogenic activities.
- –
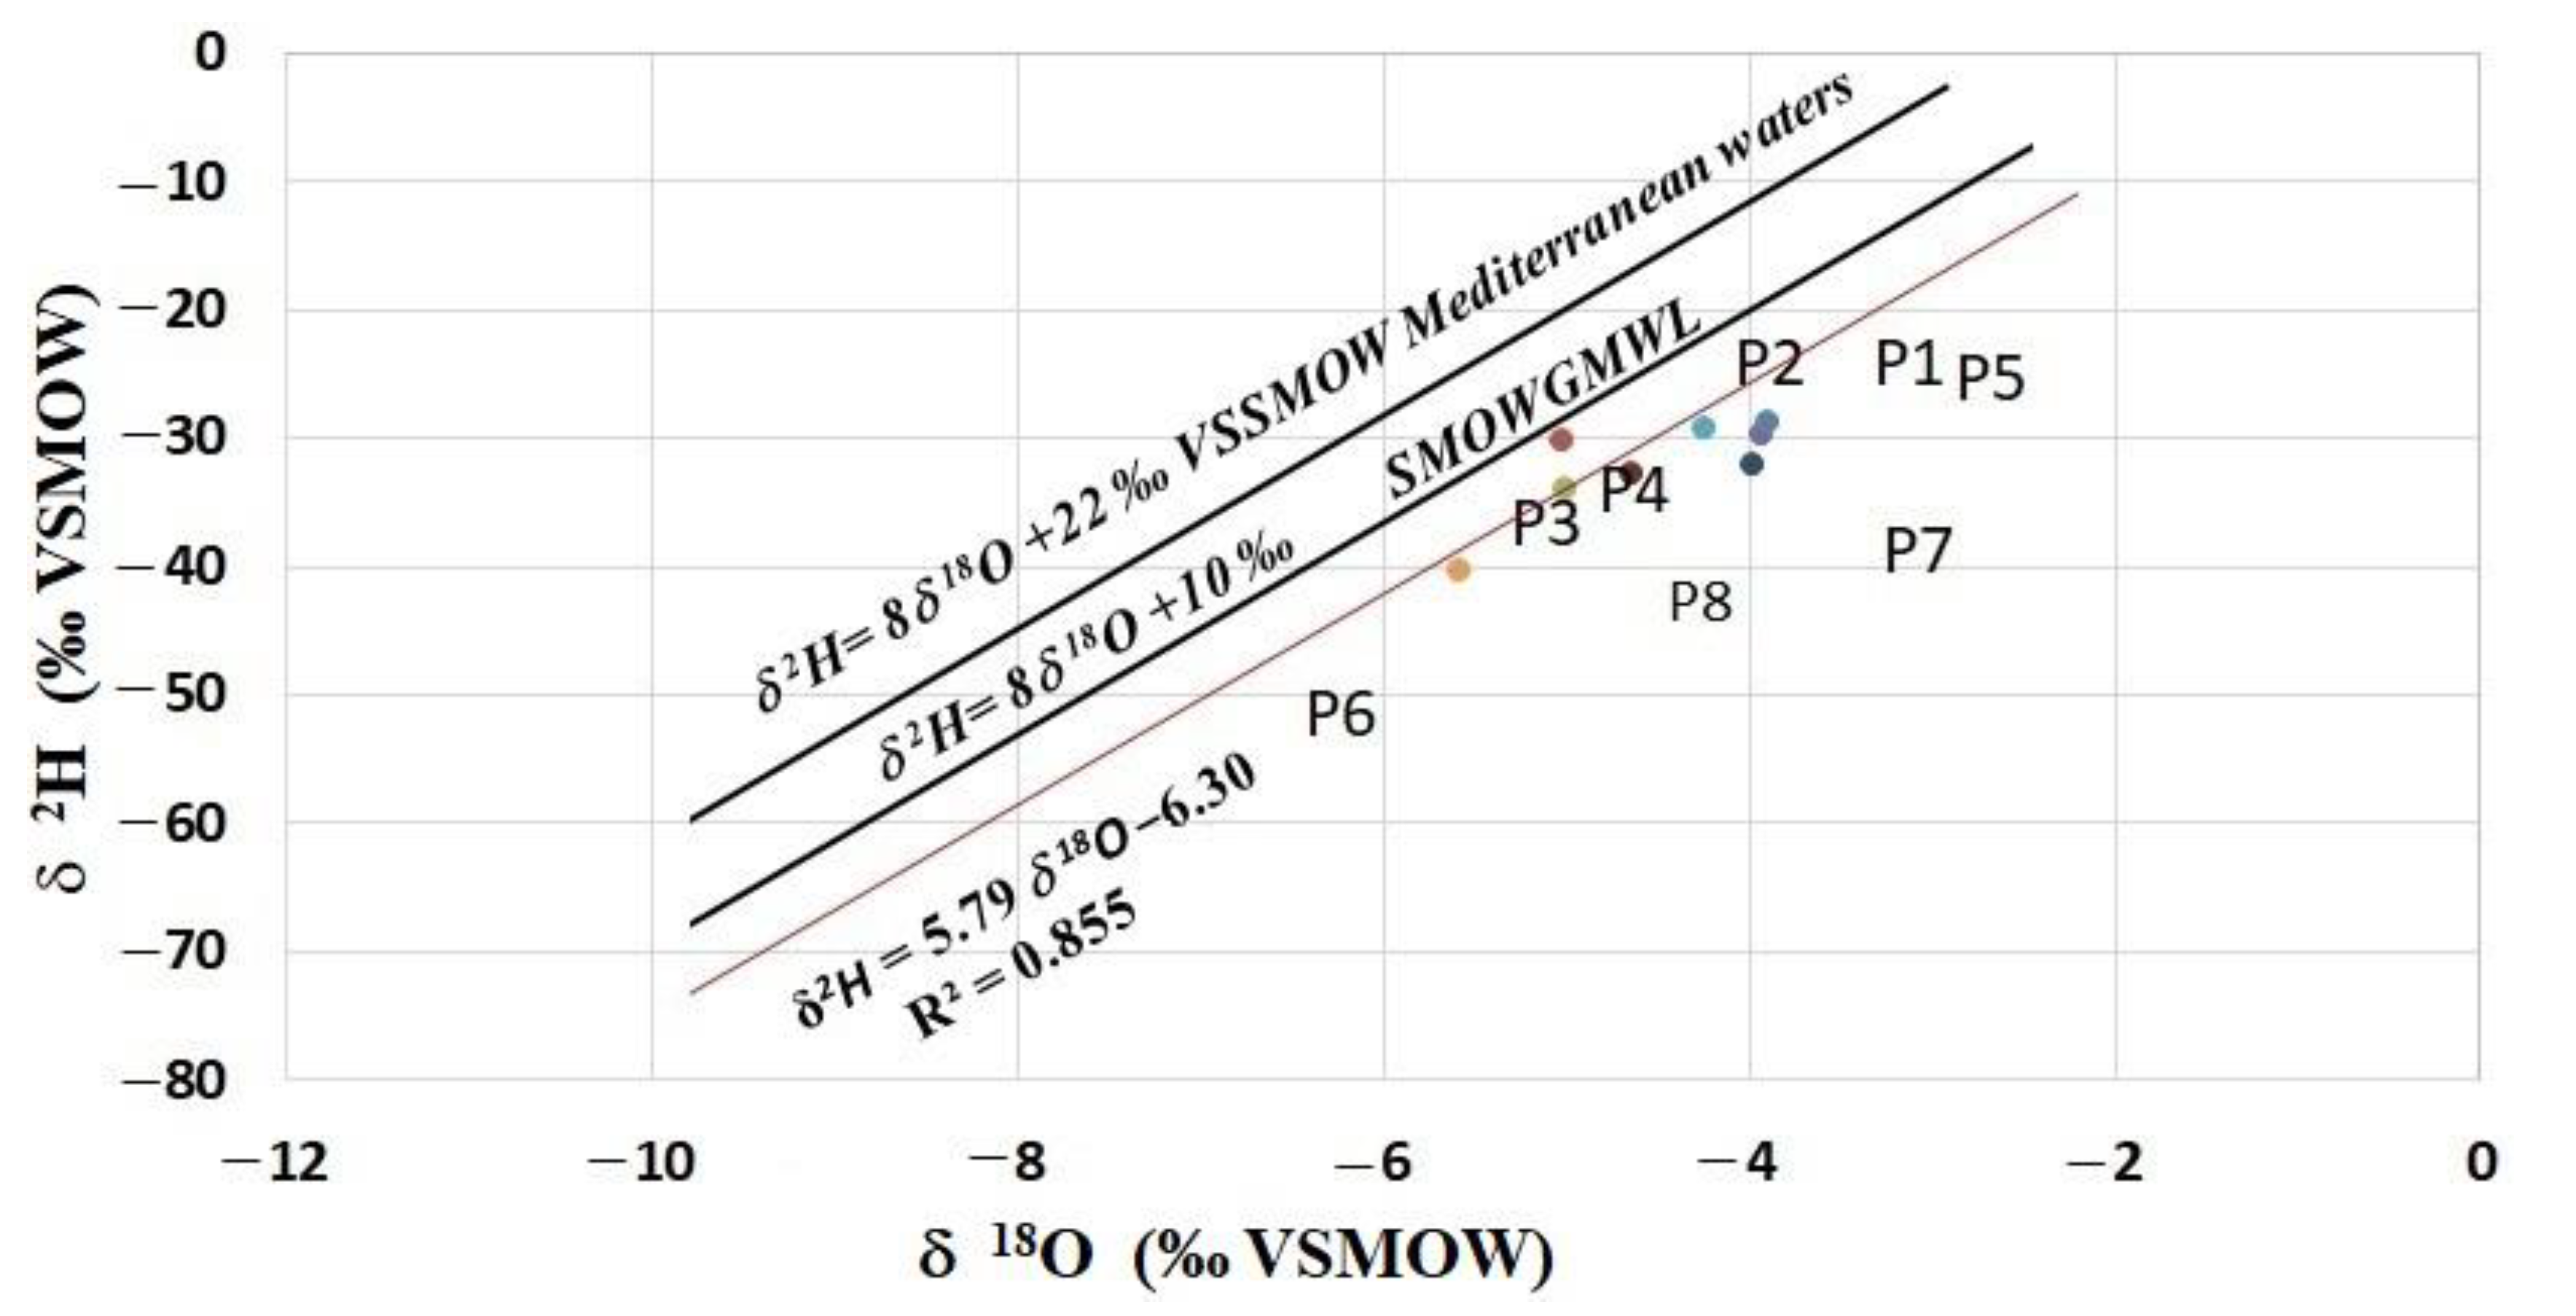
- The δ 18 O values varied between −3.92‰ and −5.60‰, while the δ2H values varied between −28.67‰ and −39.99‰. These ranges of values indicate that the recharge water undergoes evaporation before reaching the aquifer. This proves that resulting rain events result from evaporation or the elements are mixed with evaporated water before infiltrating the aquifer. The sample points followed the line δ2H = 5.79 δ18O −6.30. Comparing with the values of δ2H and δ18O in the western Mediterranean Sea, our isotopic values in the Ghis-Nekor waters are depleted in heavy isotopes.
- –
- The results show that the recharge areas of the points of the study area are situated at altitudes between 190 m and 775 m.
- –
- The calculated δ13C concentration is between −3.15‰ and −8.61‰, which indicates the carbon origin is mainly the dissolution of calcites or other carbonate minerals from the rock.
- –
- The analysis of the bromide and strontium contents made it possible to discriminate the origin of salinity anomalies in the water table. The Br/Cl and Sr/Ca molar ratios distinguished the areas of evaporitic (saliferous facies outcrops) or anthropogenic (wastewater) influence.
Author Contributions
Funding
Institutional Review Board Statement
Informed Consent Statement
Acknowledgments
Conflicts of Interest
References
- Azzirgue, E.M.; Salmoun, F.; Cherif, E.K.; Mejjad, N. Determination of the Jouamaa Groundwater Quality Using Physico-Chemical Water Analysis and Geographic Information System. In Proceedings of the E3S Web of Conferences; EDP Sciences: Les Ulis, France, 2021; Volume 314, p. 07006. [Google Scholar]
- Salhi, A. Géophysique, Hydrogéologie et Cartographie de La Vulnérabilité et Du Risque de Pollution de l’aquifère de Ghis-Nekor (Al Hoceima, Maroc). Ph.D. Thesis, Université Abdelmalek Essaadi, Tétouan, Morocco, 2008. [Google Scholar]
- Benabdelouahab, S.; Salhi, A.; Himi, M.; El Messari, J.E.S.; Ponsati, A.C. Geoelectrical Investigations for Aquifer Characterization and Geoenvironmental Assessment in Northern Morocco. Environ. Earth Sci. 2019, 78, 209. [Google Scholar] [CrossRef]
- Chafouq, D.; Mandour, A.E.; Elgettafi, M.; Himi, M.; Bengamra, S.; Lagfid, Y.; Casas, A. Assessing of Saltwater Intrusion in Ghiz-Nekor Aquifer (North Morocco) Using Electrical Resistivity Tomography; European Association of Geoscientists & Engineers: Barcelona, Spain, 2016; Volume 2016, p. 1. cp 495. [Google Scholar]
- Bourjila, A.; Dimane, F.; Nouayti, N.; Taher, M.; El Ouarghi, H. Use of GIS, Remote Sensing and AHP Techniques to Delineate Groundwater Potential Zones in the Nekor Basin, Central Rif of Morocco. In Proceedings of the 4th Edition of International Conference on Geo-IT and Water Resources 2020, Geo-IT and Water Resources 2020, Al-Hoceima, Morocco, 11–12 March 2020; Association for Computing Machinery: New York, NY, USA, 2020; pp. 1–7. [Google Scholar]
- Chafouq, D.; El Mandour, A.; Elgettafi, M.; Himi, M.; Chouikri, I.; Casas, A. Hydrochemical and Isotopic Characterization of Groundwater in the Ghis-Nekor Plain (Northern Morocco). J. Afr. Earth Sci. 2018, 139, 1–13. [Google Scholar] [CrossRef]
- El Asri, H.; Larabi, A.; Faouzi, M. Climate Change Projections in the Ghis-Nekkor Region of Morocco and Potential Impact on Groundwater Recharge. Theor. Appl. Climatol. 2019, 138, 713–727. [Google Scholar] [CrossRef]
- Kouz, T.; Mansour, S.; Mourabit, T.; Hassani, Z.M.; Etebaai, I.; Dekkaki, H.C. Application of the “PRK Plus” Approach to Evaluate the Sensitivity of the Coastal Aquifer of Ghiss-Nekkour against Pollution (North East of Morocco). Houille Blanche 2019, 105, 16–25. [Google Scholar] [CrossRef]
- Jamal, S.; Salhi, A. Mapping Pollution Vulnerability by Using the Sintacs Method in Arid Area, the Ris-Nekor (Province of Alhoceima, Morocco). In Proceedings of the International Water Conference of Water Resource in Arid Areas, Sultan Qaboos University Water Research Center, Muscat, Sultanate of Oman, 13–16 March 2016. [Google Scholar]
- Khouakhi, A.; Niazi, S.; Raji, O.; Fahchouch, A.N.E. Vulnerability Assessment of Seawater Intrusion Using Hydro-Geological Indices in Moroccan Mediterranean Aquifers. Int. J. Hydrol. Sci. Technol. 2015, 5, 133–148. [Google Scholar] [CrossRef]
- Kouz, T.; Dekkaki, H.C.; Mansour, S.; Zerrouk, M.H.; Mourabit, T. Application of GALDIT Index to Assess the Intrinsic Vulnerability of Coastal Aquifer to Seawater Intrusion Case of the Ghiss-Nekor Aquifer (North East of Morocco). In Proceedings of the Groundwater and Global Change in the Western Mediterranean Area; Calvache, M.L., Duque, C., Pulido-Velazquez, D., Eds.; Springer International Publishing: Cham, Switzerland, 2018; pp. 169–177. [Google Scholar]
- Baite, W.; Boukdir, A.; Zitouni, A.; Dahbi, S.D.; Mesmoudi, H.; Elissami, A.; Sabri, E.; Ikhmerdi, H. Diagnosis of the Ghiss Nekor Aquifer in Order to Elaborate the Aquifer Contract. E3S Web Conf. 2018, 37, 01006. [Google Scholar] [CrossRef] [Green Version]
- Salhi, A.; Messari, J.; Benabdelouahab, S.; Draoui, M.; Himi, M.; Casas, A. Sustainable Management of an Aquifer under Arid Conditions (Ghis-Nekor Aquifer, Al Hoceima, Northeast Morocco). In Proceedings of the EuroMediterranean Scientific Congress on Engineering, Algeciras, Spain, 1 January 2011. [Google Scholar]
- McDonald, M.G.; Harbaugh, A.W. A Modular Three-Dimensional Finite-Difference Ground-Water Flow Model; US Geological Survey: Washington, DC, USA, 1988. [Google Scholar]
- Ahluwalia, R.S.; Rai, S.P.; Jain, S.K.; Kumar, B.; Dobhal, D.P. Assessment of Snowmelt Runoff Modelling and Isotope Analysis: A Case Study from the Western Himalaya, India. Ann. Glaciol. 2013, 54, 299–304. [Google Scholar] [CrossRef] [Green Version]
- Gibson, J.J.; Prepas, E.E.; McEachern, P. Quantitative Comparison of Lake Throughflow, Residency, and Catchment Runoff Using Stable Isotopes: Modelling and Results from a Regional Survey of Boreal Lakes. J. Hydrol. 2002, 262, 128–144. [Google Scholar] [CrossRef]
- Obradovic, M.M.; Sklash, M.G. An Isotopic and Geochemical Study of Snowmelt Runoff in a Small Arctic Watershed. Hydrol. Processes 1986, 1, 15–30. [Google Scholar] [CrossRef]
- Brenot, A.; Cloquet, C.; Vigier, N.; Carignan, J.; France-Lanord, C. Magnesium Isotope Systematics of the Lithologically Varied Moselle River Basin, France. Geochim. Cosmochim. Acta 2008, 72, 5070–5089. [Google Scholar] [CrossRef]
- Camacho, A.; Devesa, R.; Vallés, I.; Serrano, I.; Soler, J.; Blázquez, S.; Ortega, X.; Matia, L. Distribution of Uranium Isotopes in Surface Water of the Llobregat River Basin (Northeast Spain). J. Environ. Radioact. 2010, 101, 1048–1054. [Google Scholar] [CrossRef] [PubMed]
- Ding, T.; Wan, D.; Wang, C.; Zhang, F. Silicon Isotope Compositions of Dissolved Silicon and Suspended Matter in the Yangtze River, China. Geochim. Cosmochim. Acta 2004, 68, 205–216. [Google Scholar] [CrossRef]
- Johannsen, A.; Dähnke, K.; Emeis, K. Isotopic Composition of Nitrate in Five German Rivers Discharging into the North Sea. Org. Geochem. 2008, 39, 1678–1689. [Google Scholar] [CrossRef]
- Sebilo, M.; Billen, G.; Grably, M.; Mariotti, A. Isotopic Composition of Nitrate-Nitrogen as a Marker of Riparian and Benthic Denitrification at the Scale of the Whole Seine River System. Biogeochemistry 2003, 63, 35–51. [Google Scholar] [CrossRef]
- Simpson, H.J.; Herczeg, A.L. Stable Isotopes as an Indicator of Evaporation in the River Murray, Australia. Water Resour. Res. 1991, 27, 1925–1935. [Google Scholar] [CrossRef]
- Jiansheng, C.; Haizhou, D.; Liang, C.; Songtang, Y. Study on leakage of Xin’anjiang dam by oxygen and hydrogen isotope tracer method. Nucl. Tech. 2005, 28, 239–242. [Google Scholar]
- Peng, T.-R.; Wang, C.-H. Identification of Sources and Causes of Leakage on a Zoned Earth Dam in Northern Taiwan: Hydrological and Isotopic Evidence. Appl. Geochem. 2008, 23, 2438–2451. [Google Scholar] [CrossRef]
- Ratiat, A.; Khettal, T.; Meddi, M. The Piezometric and Isotopic Analysis of Leaks in Earth Dams: The Case of the Fountain of Gazelle Dam, Biskra, Algeria. Environ. Earth Sci. 2020, 79, 138. [Google Scholar] [CrossRef]
- Abiye, T.A. The Use of Isotope Hydrology to Characterize and Assess Water Resources in South (Ern) Africa: Report to the Water Research Commission; Water Research Commission: Johannesburg, South Africa, 2013. [Google Scholar]
- Joshi, S.K.; Rai, S.P.; Sinha, R.; Gupta, S.; Densmore, A.L.; Rawat, Y.S.; Shekhar, S. Tracing Groundwater Recharge Sources in the Northwestern Indian Alluvial Aquifer Using Water Isotopes (Δ18O, Δ2H and 3H). J. Hydrol. 2018, 559, 835–847. [Google Scholar] [CrossRef]
- Leaney, F.W.; Herczeg, A.L. Regional Recharge to a Karst Aquifer Estimated from Chemical and Isotopic Composition of Diffuse and Localised Recharge, South Australia. J. Hydrol. 1995, 164, 363–387. [Google Scholar] [CrossRef]
- Moore, W.S. Sources and Fluxes of Submarine Groundwater Discharge Delineated by Radium Isotopes. Biogeochemistry 2003, 66, 75–93. [Google Scholar] [CrossRef]
- Swarzenski, P.W.; Reich, C.; Kroeger, K.D.; Baskaran, M. Ra and Rn Isotopes as Natural Tracers of Submarine Groundwater Discharge in Tampa Bay, Florida. Mar. Chem. 2007, 104, 69–84. [Google Scholar] [CrossRef]
- Thorburn, P.J.; Hatton, T.J.; Walker, G.R. Combining Measurements of Transpiration and Stable Isotopes of Water to Determine Groundwater Discharge from Forests. J. Hydrol. 1993, 150, 563–587. [Google Scholar] [CrossRef]
- Yeh, H.-F.; Lee, C.-H.; Hsu, K.-C. Oxygen and Hydrogen Isotopes for the Characteristics of Groundwater Recharge: A Case Study from the Chih-Pen Creek Basin, Taiwan. Environ. Earth Sci. 2011, 62, 393–402. [Google Scholar] [CrossRef]
- Sherif, M.I.; Sultan, M.; Sturchio, N.C. Chlorine Isotopes as Tracers of Solute Origin and Age of Groundwaters from the Eastern Desert of Egypt. Earth Planet. Sci. Lett. 2019, 510, 37–44. [Google Scholar] [CrossRef]
- Vengosh, A.; Gill, J.; Davisson, M.L.; Hudson, G.B. A Multi-Isotope (B, Sr, O, H, and C) and Age Dating (3H–3He and 14C) Study of Groundwater from Salinas Valley, California: Hydrochemistry, Dynamics, and Contamination Processes. Water Resour. Res. 2002, 38, 9-1–9-17. [Google Scholar] [CrossRef]
- Ayenew, T.; Kebede, S.; Alemyahu, T. Environmental Isotopes and Hydrochemical Study Applied to Surface Water and Groundwater Interaction in the Awash River Basin. Hydrol. Process. 2008, 22, 1548–1563. [Google Scholar] [CrossRef]
- Hunt, R.J.; Coplen, T.B.; Haas, N.L.; Saad, D.A.; Borchardt, M.A. Investigating Surface Water–Well Interaction Using Stable Isotope Ratios of Water. J. Hydrol. 2005, 302, 154–172. [Google Scholar] [CrossRef]
- Martinez, J.L.; Raiber, M.; Cox, M.E. Assessment of Groundwater–Surface Water Interaction Using Long-Term Hydrochemical Data and Isotope Hydrology: Headwaters of the Condamine River, Southeast Queensland, Australia. Sci. Total Environ. 2015, 536, 499–516. [Google Scholar] [CrossRef]
- Négrel, P.; Petelet-Giraud, E.; Barbier, J.; Gautier, E. Surface Water–Groundwater Interactions in an Alluvial Plain: Chemical and Isotopic Systematics. J. Hydrol. 2003, 277, 248–267. [Google Scholar] [CrossRef]
- Xianfang, S.; Xiangchao, L.; Jun, X.; Jingjie, Y.; Changyuan, T. A Study of Interaction between Surface Water and Groundwater Using Environmental Isotope in Huaisha River Basin. Sci. China Ser. D Earth Sci. 2006, 49, 1299–1310. [Google Scholar]
- Yang, L.; Song, X.; Zhang, Y.; Han, D.; Zhang, B.; Long, D. Characterizing Interactions between Surface Water and Groundwater in the Jialu River Basin Using Major Ion Chemistry and Stable Isotopes. Hydrol. Earth Syst. Sci. 2012, 16, 4265–4277. [Google Scholar] [CrossRef] [Green Version]
- Abdullah, T.O.; Ali, S.S.; Al-Ansari, N.A.; Knutsson, S. Assessment of Groundwater Vulnerability to Pollution Using Two Different Vulnerability Models in Halabja-Saidsadiq Basin, Iraq. Groundw. Sustain. Dev. 2020, 10, 100276. [Google Scholar] [CrossRef]
- Sadek, M.; El-Samie, A.S. Pollution Vulnerability of the Quaternary Aquifer near Cairo, Egypt, as Indicated by Isotopes and Hydrochemistry. Hydrogeol. J. 2001, 9, 273–281. [Google Scholar] [CrossRef]
- Carrey, R.; Ballesté, E.; Blanch, A.R.; Lucena, F.; Pons, P.; López, J.M.; Rull, M.; Solà, J.; Micola, N.; Fraile, J.; et al. Combining Multi-Isotopic and Molecular Source Tracking Methods to Identify Nitrate Pollution Sources in Surface and Groundwater. Water Res. 2021, 188, 116537. [Google Scholar] [CrossRef] [PubMed]
- Krishan, G.; Vashisht, R.; Sudarsan, N.; Rao, M.S. Groundwater Salinity and Isotope Characterization: A Case Study from South-West Punjab, India. Environ. Earth Sci. 2021, 80, 169. [Google Scholar] [CrossRef]
- Vengosh, A.; Spivack, A.J.; Artzi, Y.; Ayalon, A. Geochemical and Boron, Strontium, and Oxygen Isotopic Constraints on the Origin of the Salinity in Groundwater from the Mediterranean Coast of Israel. Water Resour. Res. 1999, 35, 1877–1894. [Google Scholar] [CrossRef]
- Zhang, Y.; Li, F.; Zhang, Q.; Li, J.; Liu, Q. Tracing Nitrate Pollution Sources and Transformation in Surface- and Ground-Waters Using Environmental Isotopes. Sci. Total Environ. 2014, 490, 213–222. [Google Scholar] [CrossRef]
- Kahsay, K.D.; Pingale, S.M.; Hatiye, S.D. Impact of Climate Change on Groundwater Recharge and Base Flow in the Sub-Catchment of Tekeze Basin, Ethiopia. Groundw. Sustain. Dev. 2018, 6, 121–133. [Google Scholar] [CrossRef]
- Ouhamdouch, S.; Bahir, M.; Ouazar, D.; Carreira, P.M.; Zouari, K. Evaluation of Climate Change Impact on Groundwater from Semi-Arid Environment (Essaouira Basin, Morocco) Using Integrated Approaches. Environ. Earth Sci. 2019, 78, 449. [Google Scholar] [CrossRef]
- Marcé, A. Contribution Des Méthodes Isotopiques à l’étude Des Modalités d’alimentation et de Renouvellement Des Réserves de Quelques Nappes Souterraines Du Maroc; Rapp. TP: Rabat, Morocco, 1975; p. 131. [Google Scholar]
- Castany, G.; Marce, A.; Margat, J. Contribution des traceurs naturels à l’évaluation des ressources en eau souterraine. La Houille Blanche 1976, 62, 253–259. [Google Scholar] [CrossRef] [Green Version]
- Kabbaj, A.; Zeryouhi, I.; Carlier, P.; Marce, A. Contribution Des Isotopes Du Milieu á l’étude de Grands Aquifers Du Maroc [Contribution of Environmental Isotopes to the Study of Large Aquifers of Morocco]. In Proceedings of the International Symposium on Isotope Hydrology, Vienna, Austria, 27 March–1 April 2011; Volume 2, pp. 491–523. [Google Scholar]
- Michelot, J.L.; Sinan, M.; Krimissa, M.; Krimissa, M.; Bichara, S.; Louvat, D. Hydrologie Isotopique Des Systèmes Aquifères de Fès-Meknès, Er-Rachidia et Kheng El Hamam Rap; AIEA MOR/008/4: Vienne, Austria, 1992. [Google Scholar]
- Ouda, B.; Marah, H.; Mokadem, K.; Zine, N.; Filali, M.; Lahmouri, A.; Mudry, J. Geochemical and Isotopic Characterization of Groundwater Resources in Maidere Basin (Southern Part of Morocco). Adv. Isot. Hydrol. Its Role Sustain. Water Resour. Manag. IHS—2007. 2007, 21, 149. [Google Scholar]
- Bouchaou, L.; Michelot, J.L.; Qurtobi, M.; Zine, N.; Gaye, C.B.; Aggarwal, P.K.; Marah, H.; Zerouali, A.; Taleb, H.; Vengosh, A. Origin and Residence Time of Groundwater in the Tadla Basin (Morocco) Using Multiple Isotopic and Geochemical Tools. J. Hydrol. 2009, 379, 323–338. [Google Scholar] [CrossRef]
- Hsissou, Y.; Chauve, P.; Mania, J. The aquifer of Turonian limestones (Tadla Basin, Morocco). Local and remote groundwater recharge from the Atlas. J. Hydrol. 1996, 3–4, 433–443. [Google Scholar] [CrossRef]
- El Ouali, A. Modalités d’alimentation et échanges Entre Aquifères de Piémont en Conditions Climatiques Arides. Cas des Systèmes Aquifères du Haut Atlas/Bassin Crétacé d’Errachidia (Maroc); Université Mohamed-V & Ecole Mohammadia d’ingénieurs: Rabat, Morocco, 1999. [Google Scholar]
- Marjoua, A.; Olive, P.; Jusserand, C. Apports des outils chiniques et isotopiques à l’identification des origines de la salinisation des eaux: Cas de la nappe de La Chaouia côtière (Maroc). Rev. Sci. Eau J. Water Sci. 1997, 10, 489–505. [Google Scholar] [CrossRef] [Green Version]
- ABHL. Lokous Hydraulic Basin Agency, Morocco. Available online: http://www.abhloukkos.ma/index.php/fr/ (accessed on 28 January 2022).
- ABHL. Etude d’élaboration Du Schéma d’aménagement Des Ressources En Eau Du Bassin de Ghiss-Nekkor. Mission 1: Évaluation Des Ressources En Eau Sous-Mission 1.2: Evaluation Quantitative Des Ressources En Eau; ABHL: Rabat, Morocco, 2015. [Google Scholar]
- Révész, K.M.; Doctor, D.H. Automated Determination of the Stable Carbon Isotopic Composition (δ 13C) of Total Dissolved Inorganic Carbon (DIC) and Total Nonpurgeable Dissolved Organic Carbon (DOC) in Aqueous Samples: RSIL Lab Codes 1851 and 1852. Tech. Methods Book 2014, 10. [Google Scholar] [CrossRef] [Green Version]
- Waldron, S.; Scott, E.M.; Vihermaa, L.E.; Newton, J. Quantifying Precision and Accuracy of Measurements of Dissolved Inorganic Carbon Stable Isotopic Composition Using Continuous-Flow Isotope-Ratio Mass Spectrometry. Rapid Commun. Mass Spectrom. 2014, 28, 1117–1126. [Google Scholar] [CrossRef] [Green Version]
- Torres, M.E.; Mix, A.C.; Rugh, W.D. Precise Δ13C Analysis of Dissolved Inorganic Carbon in Natural Waters Using Automated Headspace Sampling and Continuous-Flow Mass Spectrometry. Limnol. Oceanogr. Methods 2005, 3, 349–360. [Google Scholar] [CrossRef]
- Ministre de l’Equipement et du Transport du Ministre de la Santé, du Ministre de l’Aménagement du territoire, de l’Eau et de l’Environnement et du Ministre de l’Industrie, du Commerce et des Télécommunications. NM 03.7.001. Available online: https://pdfcoffee.com/nm-037001-norme-maroccaine-eau-alimentation-4-pdf-free.html (accessed on 15 July 2021).
- Piper, A.M. A Graphic Procedure in the Geochemical Interpretation of Water-Analyses. Eos Trans. Am. Geophys. Union 1944, 25, 914–928. [Google Scholar] [CrossRef]
- Schoeller, H. Qualitative Evaluation of Groundwater Resources. In Methods and Techniques of Groundwater Investigations and Development; The United Nations Educational, Scientific and Cultural Organization: Paris, France, 1965; pp. 54–83. [Google Scholar]
- Ghalit, M.; Yousfi, E.B.; Zouhairi, M.; Gharibi, E.; Taupin, J.D. Hydrochemical Characterization of Groundwater in the Nekor Basin Located in the North-East of the Rif of Morocco. Moroc. J. Chem. 2017, 5, 272–284. [Google Scholar] [CrossRef]
- Lamhamdi, A.; Ghalit, M.; Gharibi, E.; Anaflous, A.; Elyounsi, K.; Essaki, F.; Azzaoui, K.; Zarrouk, A. Physico-Chemical and Bacteriological Study of Water from a Few Sources in al Hoceima Region–Morocco. Pharm. Lett. 2015, 7, 195–202. [Google Scholar]
- Petalas, C.P.; Diamantis, I.B. Origin and Distribution of Saline Groundwaters in the Upper Miocene Aquifer System, Coastal Rhodope Area, Northeastern Greece. Hydrogeol. J. 1999, 7, 305–316. [Google Scholar] [CrossRef]
- Carre, J. Geochemistry of Strontium in Groundwater and Surface Water in the Paris Region. Ph.D. Thesis, University of Paris VI, Paris, France, 1975. [Google Scholar]
- Naily, W. Cl/Br Ratio to Determine Groundwater Quality. In Proceedings of the IOP Conference Series: Earth and Environmental Science; IOP Publishing: Tokyo, Japan, 2018; Volume 314, p. 07006. [Google Scholar]
- Alcalá, F.J.; Custodio, E. Using the Cl/Br Ratio as a Tracer to Identify the Origin of Salinity in Aquifers in Spain and Portugal. J. Hydrol. 2008, 359, 189–207. [Google Scholar] [CrossRef]
- Bouchaou, L.; Michelot, J.-L.; Chauve, P.; Mania, J.; Mudry, J. Apports Des Isotopes Stables à l’étude Des Modalités d’alimentation Des Aquifères Du Tadla (Maroc) Sous Climat Semi-Aride. C. R. Académie Sci. Sér. 2 Sci. Terre Planètes 1995, 320, 95–101. [Google Scholar]
- Aeschbach-Hertig, W.; El-Gamal, H.; Dahab, K.; Friedrich, R.; Kipfer, R.; Hajdase, I. Identifying and Dating the Origin of Groundwater Resources in Reclamation Areas of Egypt. In Proceedings of the Advances in Isotope Hydrology and its Role in Sustainable Water Resources Management. International Atomic Energy Agency (IAEA), Vienna, Austria, 21–25 May 2007; pp. 395–403. [Google Scholar]
- Qurtobi, M.; Marah, H.; El Mahboul, A.; Emblanch, C. Groundwater Tracing Using Stable Isotope in the Western Mediterranean (Case of Rif Chain in the North of Morocco). In Advances in Research in Karst Media; Springer: Berlin/Heidelberg, Germany, 2010; pp. 183–188. [Google Scholar]
- Alia, A.C. Etude Hydrogéologique et Hydrochimique de La Plaine Côtiere de Bou-Areg (Maroc Nord-Oriental). Ph.D. Thesis, University of Gent, Gent, Belgium, 2001. [Google Scholar]
- Elgettafi, M.; Elmandour, A.; Himi, M.; Casas, A. The Use of Environmental Markers to Identify Groundwater Salinization Sources in a Neogene Basin, Kert Aquifer Case, NE Morocco. Int. J. Environ. Sci. Technol. 2013, 10, 719–728. [Google Scholar] [CrossRef] [Green Version]
- Clark, I.D.; Fritz, P. Environmental Isotopes in Hydrogeology; Taylor & Francis Group: Boca Raton, FL, USA, 1997; 348p. [Google Scholar]
- Winckel, A.; Marlin, C.; Dever, L.; Morel, J.-L.; Morabiti, K.; Makhlouf, M.B.; Chalouan, A. Apport Des Isotopes Stables Dans l’estimation Des Altitudes de Recharge de Sources Thermales Du Maroc. C. R. Geosci. 2002, 334, 469–474. [Google Scholar] [CrossRef]
- Julián, J.J.C.S.; Benavente, J.; Garrido, J.C.M.; Moral, F.; Araguás, L.; Vera, F.L. Deuterium And Oxygen-18 Content in Karstic Aquifers in the Sierras de Cazorla and Segura (Betic Cordillera, Spain). Water Resour. Mt. Reg. Parriaux Ed Memoires IAH 1990, 22, 424–433. [Google Scholar]
- Bouaissa, M.; Gharibi, E.; Ghalit, M.; Taupin, J.D.; El Khattabi, J. Identifying the Origin of Groundwater Salinization in the Bokoya Massif (Central Rif, Northern Morocco) Using Hydrogeochemical and Isotopic Tools. Groundw. Sustain. Dev. 2021, 14, 100646. [Google Scholar] [CrossRef]
- Porowska, D. Determination of the Origin of Dissolved Inorganic Carbon in Groundwater around a Reclaimed Landfill in Otwock Using Stable Carbon Isotopes. Waste Manag. 2015, 39, 216–225. [Google Scholar] [CrossRef] [PubMed]


| Well | PH | Temperature (°C) | EC (mS/cm) | Ca2+ | Mg2+ | Na+ | K+ | HCO3− | Cl− | Alk | TDS | ||
|---|---|---|---|---|---|---|---|---|---|---|---|---|---|
| (mg/L) | |||||||||||||
| P1 | <7.25 | 21.90 | 3550 | 152.0 | 128.9 | 537.1 | 9.00 | 583.5 | 947.8 | 567.3 | 86.90 | 583.5 | 3040 |
| P2 | 7.26 | 23.07 | 6190 | 171.3 | 137.0 | 930.3 | 36.28 | 532.5 | 1320 | 891.3 | 27.25 | 532.5 | 4610 |
| P3 | 7.36 | 21.93 | 5770 | 142.1 | 170.0 | 537.4 | 4.16 | 460.2 | 1120 | 820.8 | 51.20 | 460.2 | 2840 |
| P4 | 7.36 | 21.93 | 5590 | 255.3 | 157.3 | 346.5 | 5.04 | 374.1 | 1090 | 920.0 | 12.03 | 374.1 | 2600 |
| P5 | 7.36 | 21.93 | 5660 | 253.3 | 167.7 | 474.4 | 3.04 | 376.2 | 956.0 | 720.0 | 13.65 | 376.2 | 2930 |
| P6 | 7.26 | 23.07 | 5190 | 253.0 | 180.0 | 480.0 | 1.39 | 340.0 | 1430 | 801.3 | 33.23 | 340.0 | 3170 |
| P7 | 7.37 | 22.63 | 6950 | 300.0 | 255.1 | 585.0 | 7.32 | 530.2 | 1510 | 999.2 | 41.36 | 530.2 | 4520 |
| P8 | 7.43 | 22.23 | 3890 | 192.4 | 162.4 | 279.0 | 10.1 | 447.1 | 860.0 | 735.6 | 48.70 | 447.1 | 2390 |
| P9 | 7.26 | 23.07 | 6540 | 329.4 | 295.0 | 762.2 | 4.02 | 537.0 | 1510 | 332.1 | 40.00 | 537.0 | 4770 |
| P10 | 7.37 | 22.63 | 5800 | 270.0 | 209.4 | 615.3 | 2.33 | 475.0 | 1430 | 321.5 | 48.39 | 475.0 | 3670 |
| P11 | 7.43 | 22.23 | 4100 | 271.9 | 221.0 | 630.2 | 2.88 | 476.0 | 1020 | 313.1 | 46.00 | 476.0 | 3670 |
| P12 | 7.36 | 21.93 | 5900 | 141.2 | 145.2 | 386.2 | 1.22 | 679.8 | 892.0 | 339.2 | 33.02 | 679.8 | 2630 |
| P13 | 7.25 | 21.90 | 4200 | 212.3 | 118.9 | 348.9 | 1.33 | 283.7 | 845.5 | 387.2 | 10.23 | 283.7 | 2100 |
| P14 | 7.40 | 21.52 | 3510 | 278.5 | 208.7 | 629.7 | 3.70 | 463.7 | 987.8 | 365.0 | 47.00 | 463.7 | 3690 |
| P15 | 7.35 | 21.03 | 3320 | 341.1 | 372.3 | 1500 | 9.01 | 390.0 | 947.8 | 338.2 | 122.3 | 390.0 | 1950 |
| P16 | 7.44 | 20.70 | 3030 | 211.3 | 143.4 | 377.7 | 5.06 | 423.8 | 515.3 | 399.1 | 12.00 | 423.8 | 2700 |
| P17 | 7.49 | 20.24 | 2820 | 182.0 | 115.7 | 333.0 | 2.60 | 434.6 | 480.0 | 391.4 | 8.20 | 434.6 | 2410 |
| P18 | 7.65 | 19.02 | 2790 | 189.0 | 115.0 | 264.3 | 1.03 | 352.7 | 465.0 | 386.0 | 17.50 | 352.7 | 1950 |
| P19 | 7.52 | 18.78 | 2630 | 168.2 | 120.6 | 266.3 | 1.56 | 372.0 | 408.3 | 390.3 | 23.00 | 372.0 | 2340 |
| P20 | 7.49 | 19.72 | 2890 | 323.5 | 160.7 | 619.5 | 1.20 | 370.4 | 456.0 | 398.1 | 41.48 | 370.4 | 3720 |
| Well | δ18O (‰ VSMOW) | δ2H (‰ VSMOW) | δ13C (‰ VPDB) | Sr (mg/L) | Br (mg/L) |
|---|---|---|---|---|---|
| P1 | −30.48 | −8.18 | −8.18 | 1.66 | 2.84 |
| P2 | −31.40 | −7.42 | −7.42 | 2.72 | 8.80 |
| P3 | −35.20 | −5.91 | −5.91 | 2.36 | 2.50 |
| P4 | −31.01 | −4.28 | −4.28 | 2.70 | 3.00 |
| P5 | −36.01 | −5.56 | −5.56 | 3.17 | 0.954 |
| P6 | −37.02 | −3.70 | −3.77 | 3.53 | 0.802 |
| P7 | −37.02 | −8.61 | −8.61 | 5.49 | 13.81 |
| P8 | −39.03 | −3.15 | −3.15 | 0.94 | 2.76 |
Publisher’s Note: MDPI stays neutral with regard to jurisdictional claims in published maps and institutional affiliations. |
© 2022 by the authors. Licensee MDPI, Basel, Switzerland. This article is an open access article distributed under the terms and conditions of the Creative Commons Attribution (CC BY) license (https://creativecommons.org/licenses/by/4.0/).
Share and Cite
Nouayti, N.; Cherif, E.K.; Algarra, M.; Pola, M.L.; Fernández, S.; Nouayti, A.; Esteves da Silva, J.C.G.; Driss, K.; Samlani, N.; Mohamed, H.; et al. Determination of Physicochemical Water Quality of the Ghis-Nekor Aquifer (Al Hoceima, Morocco) Using Hydrochemistry, Multiple Isotopic Tracers, and the Geographical Information System (GIS). Water 2022, 14, 606. https://doi.org/10.3390/w14040606
Nouayti N, Cherif EK, Algarra M, Pola ML, Fernández S, Nouayti A, Esteves da Silva JCG, Driss K, Samlani N, Mohamed H, et al. Determination of Physicochemical Water Quality of the Ghis-Nekor Aquifer (Al Hoceima, Morocco) Using Hydrochemistry, Multiple Isotopic Tracers, and the Geographical Information System (GIS). Water. 2022; 14(4):606. https://doi.org/10.3390/w14040606
Chicago/Turabian StyleNouayti, Nordine, El Khalil Cherif, Manuel Algarra, Mᵃ Luisa Pola, Sara Fernández, Abderrahim Nouayti, Joaquim C. G. Esteves da Silva, Khattach Driss, Nouha Samlani, Hilali Mohamed, and et al. 2022. "Determination of Physicochemical Water Quality of the Ghis-Nekor Aquifer (Al Hoceima, Morocco) Using Hydrochemistry, Multiple Isotopic Tracers, and the Geographical Information System (GIS)" Water 14, no. 4: 606. https://doi.org/10.3390/w14040606