Feasibility Analysis of Energy Recovery Using PATs in Water Distribution Networks
Abstract
:1. Introduction
2. Methodology
2.1. The Relationship between Pressure Reduction and Leakage Rate in a WDN
2.2. Determination of Leakage in WDNs
2.3. Determination of Electricity Generation and Profit of the PAT
2.4. Feasibility and Cost Analysis of PAT Implementation
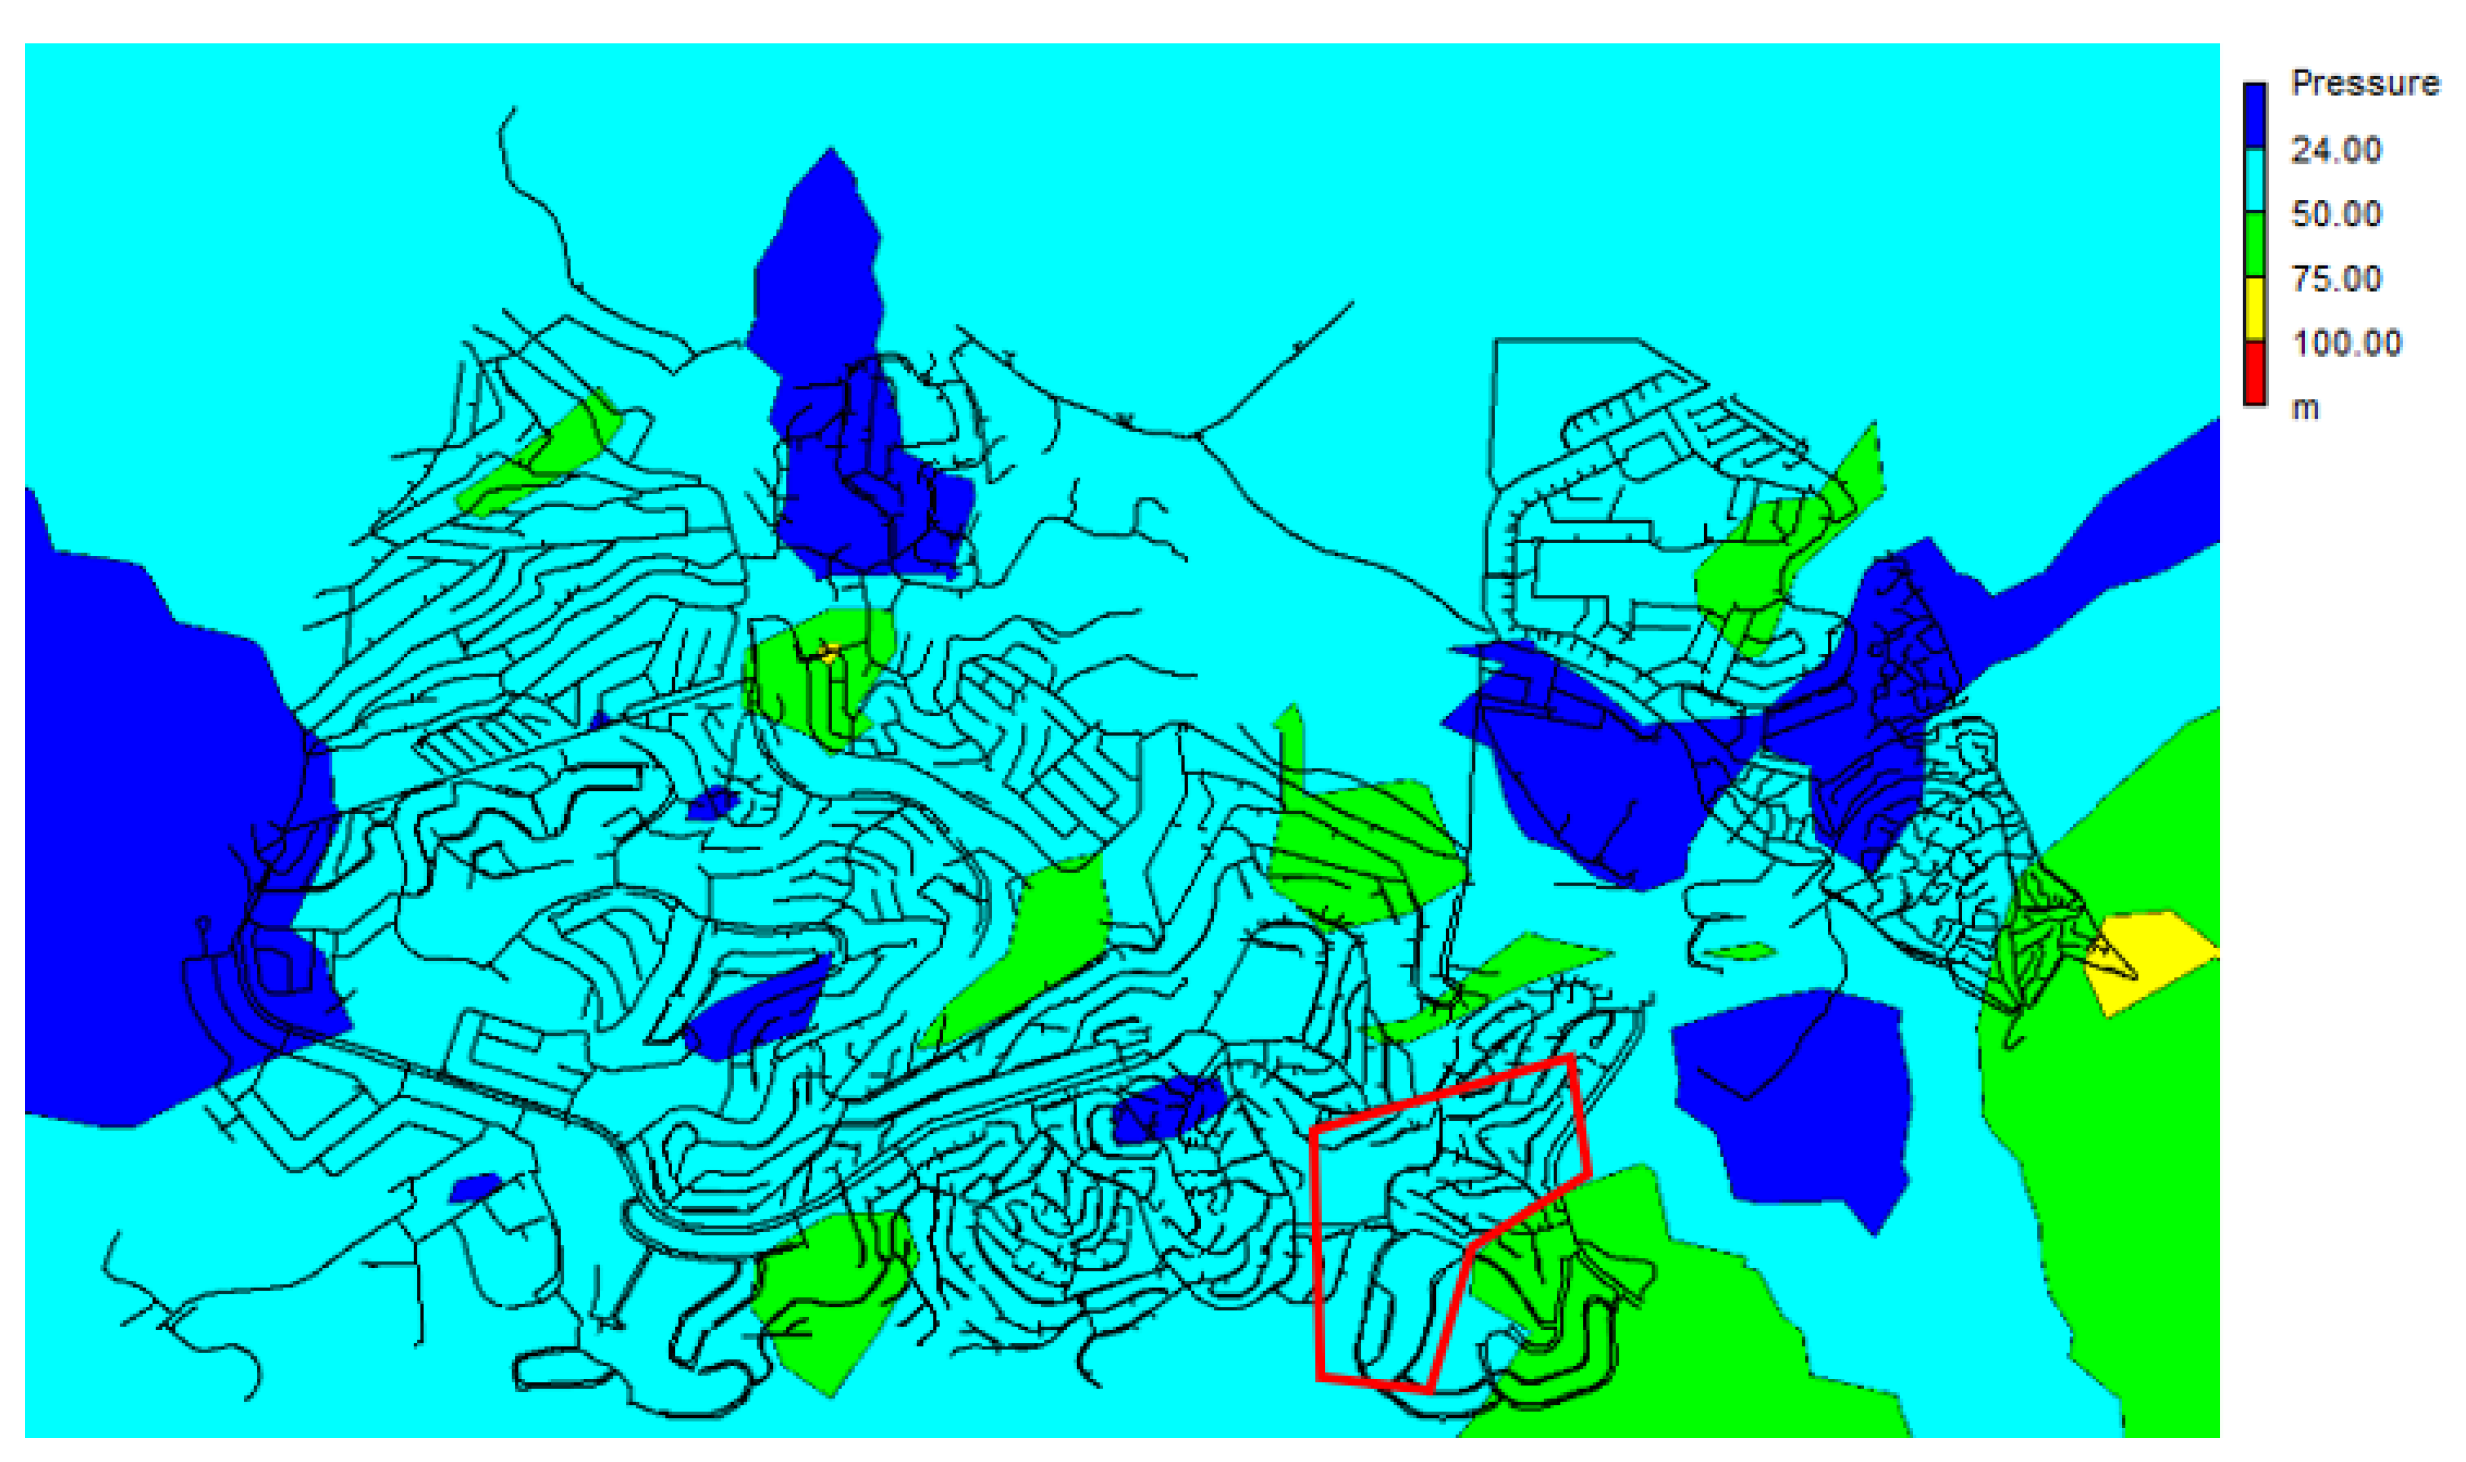
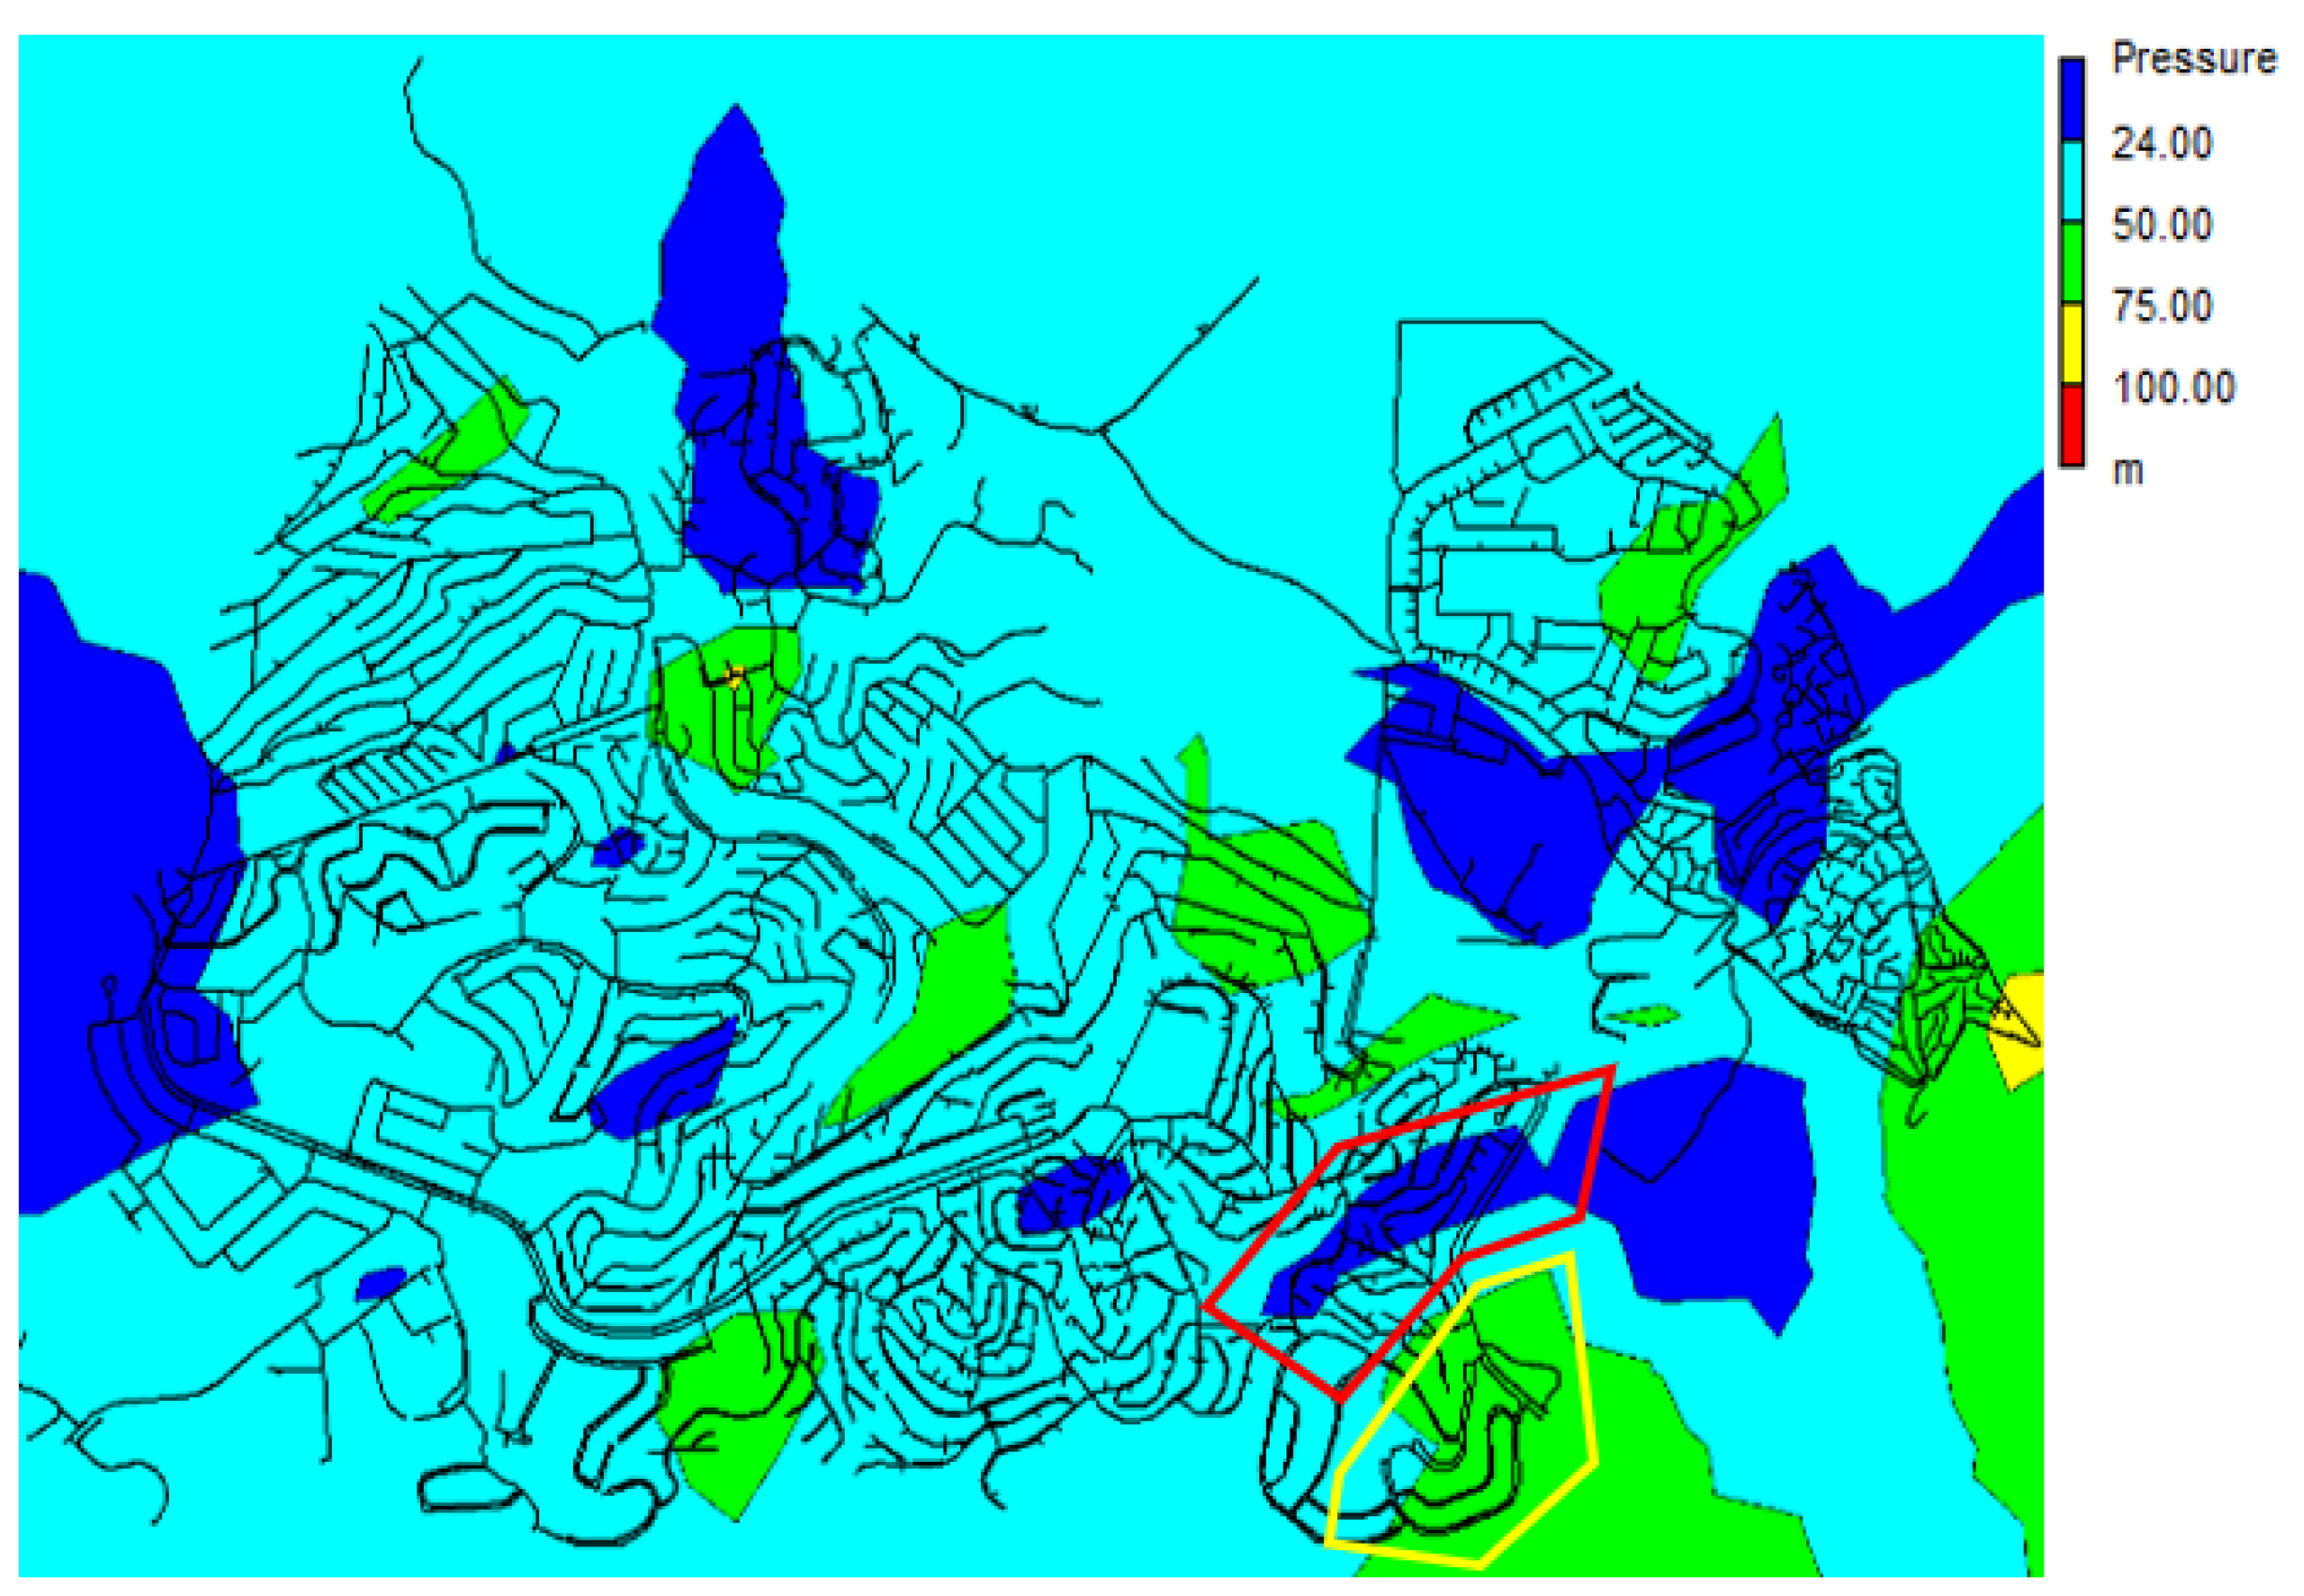
3. Study Area Description
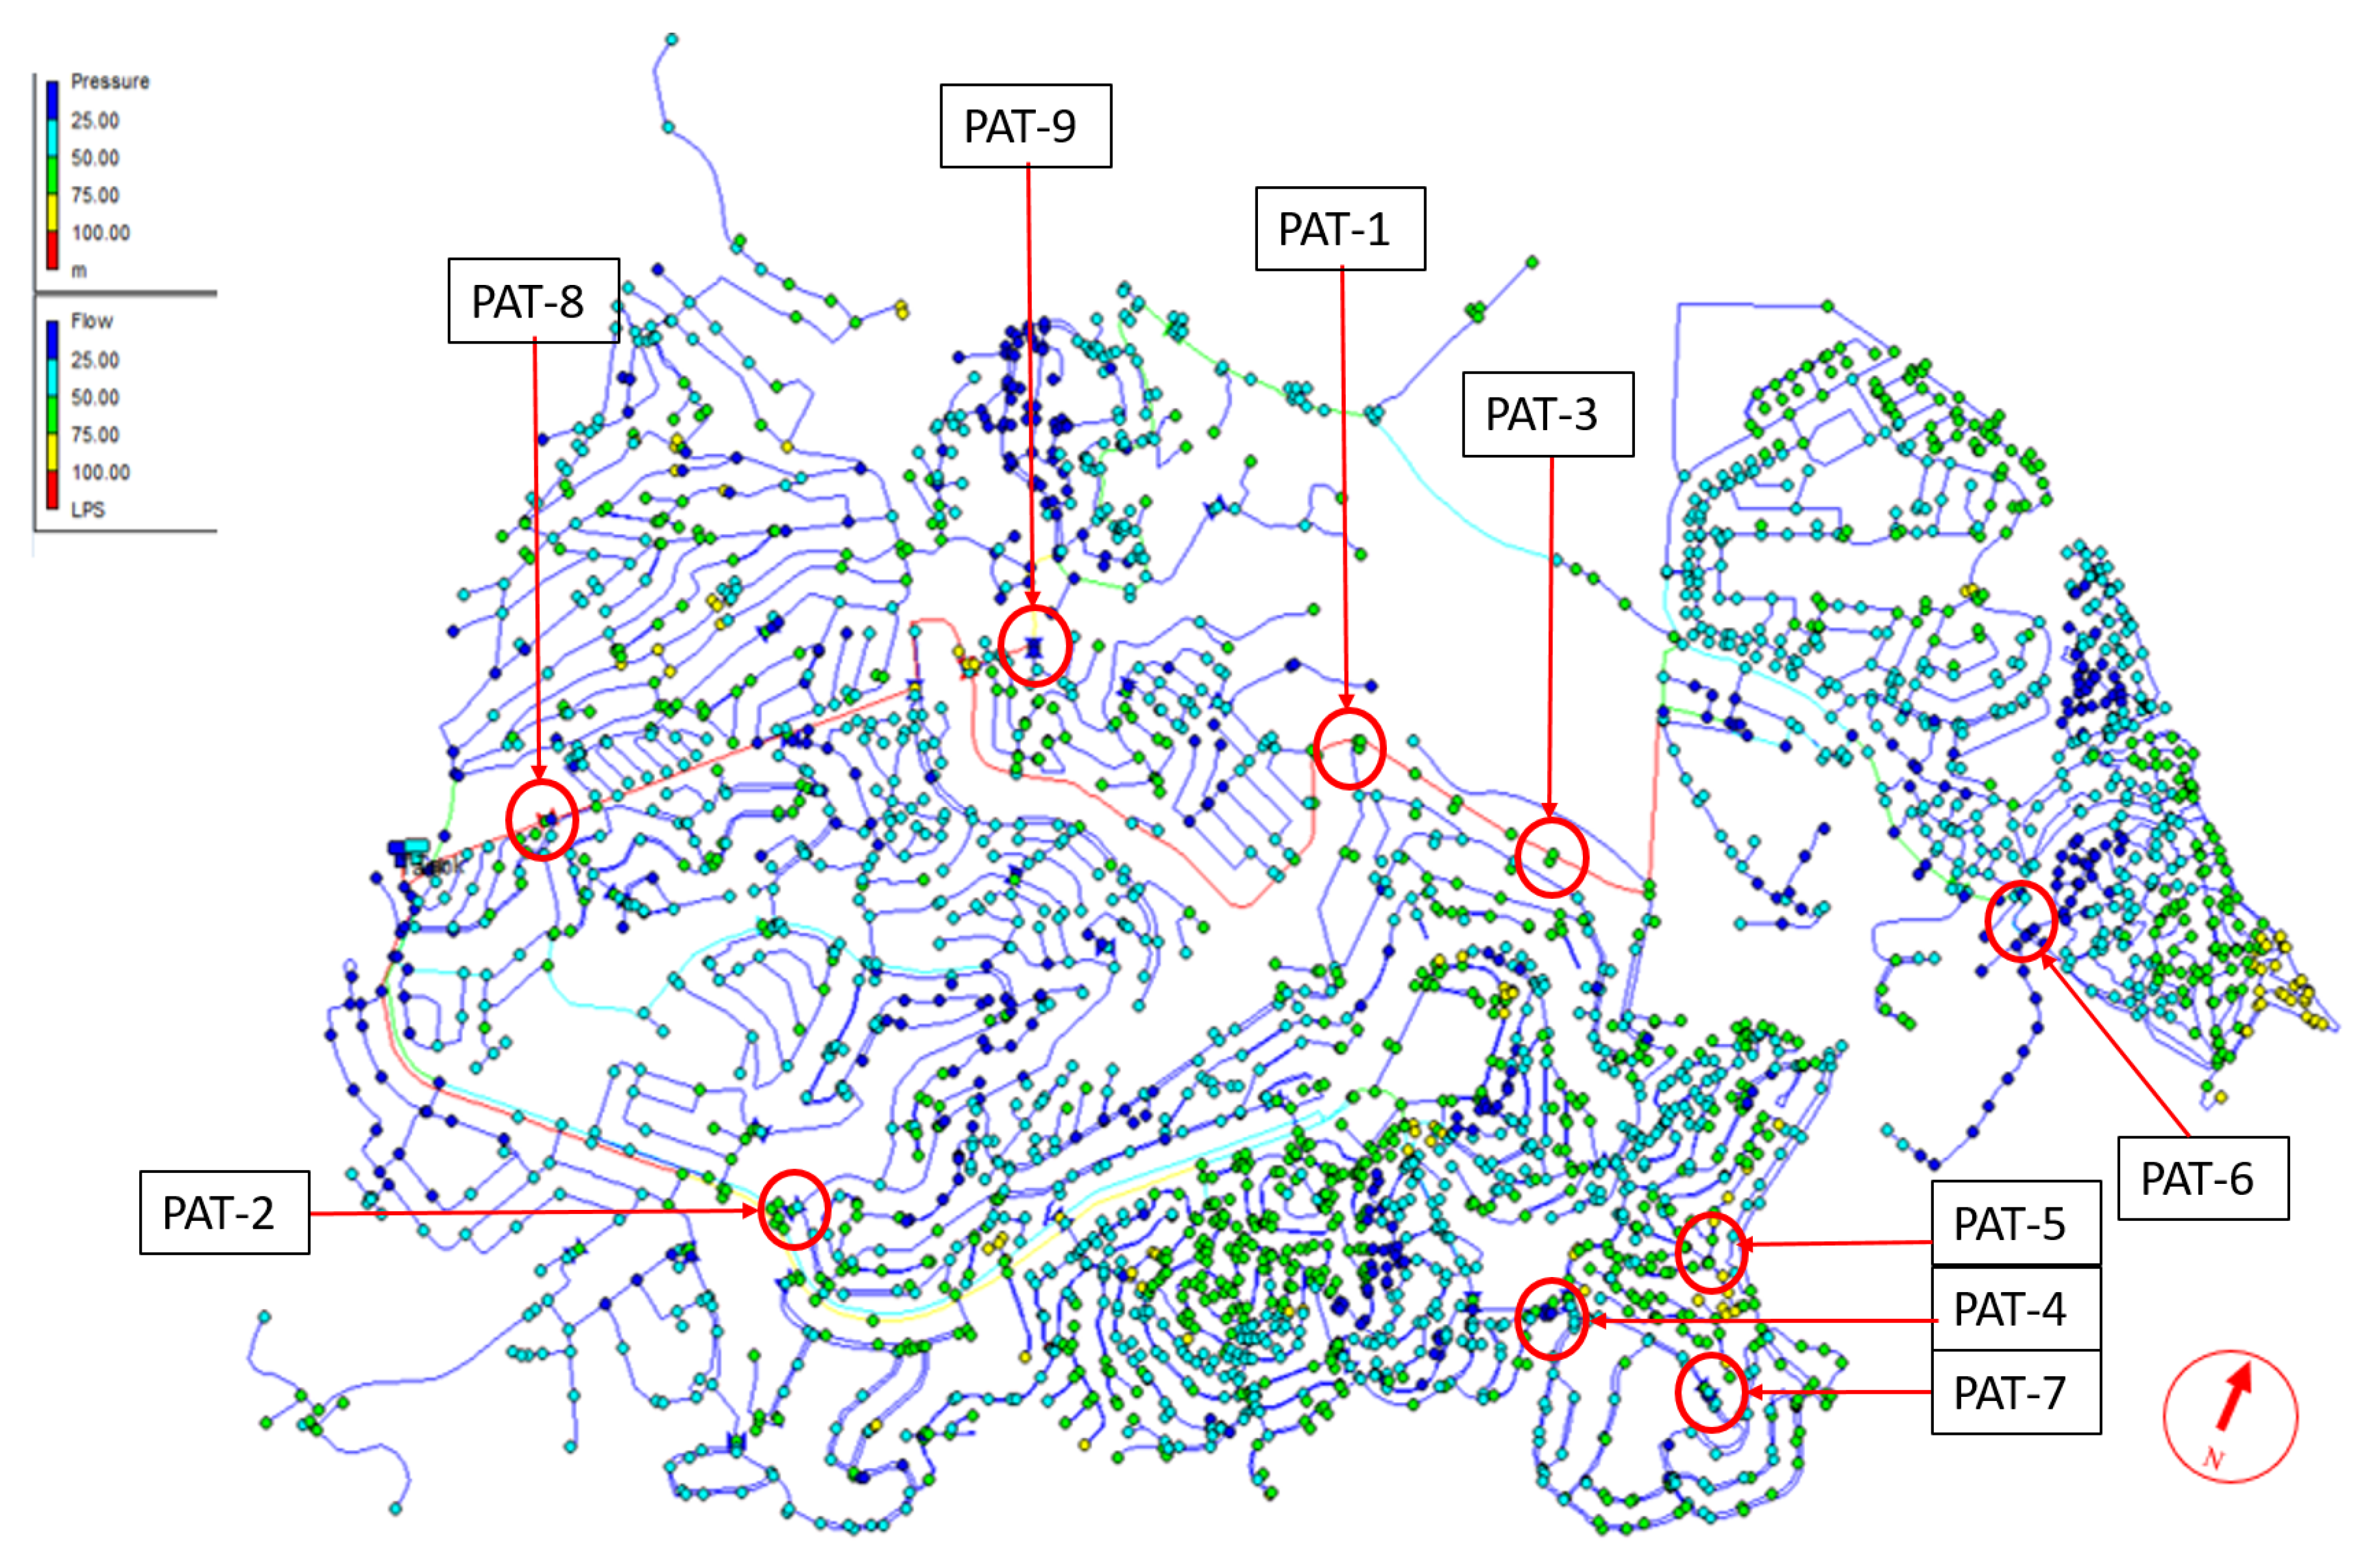
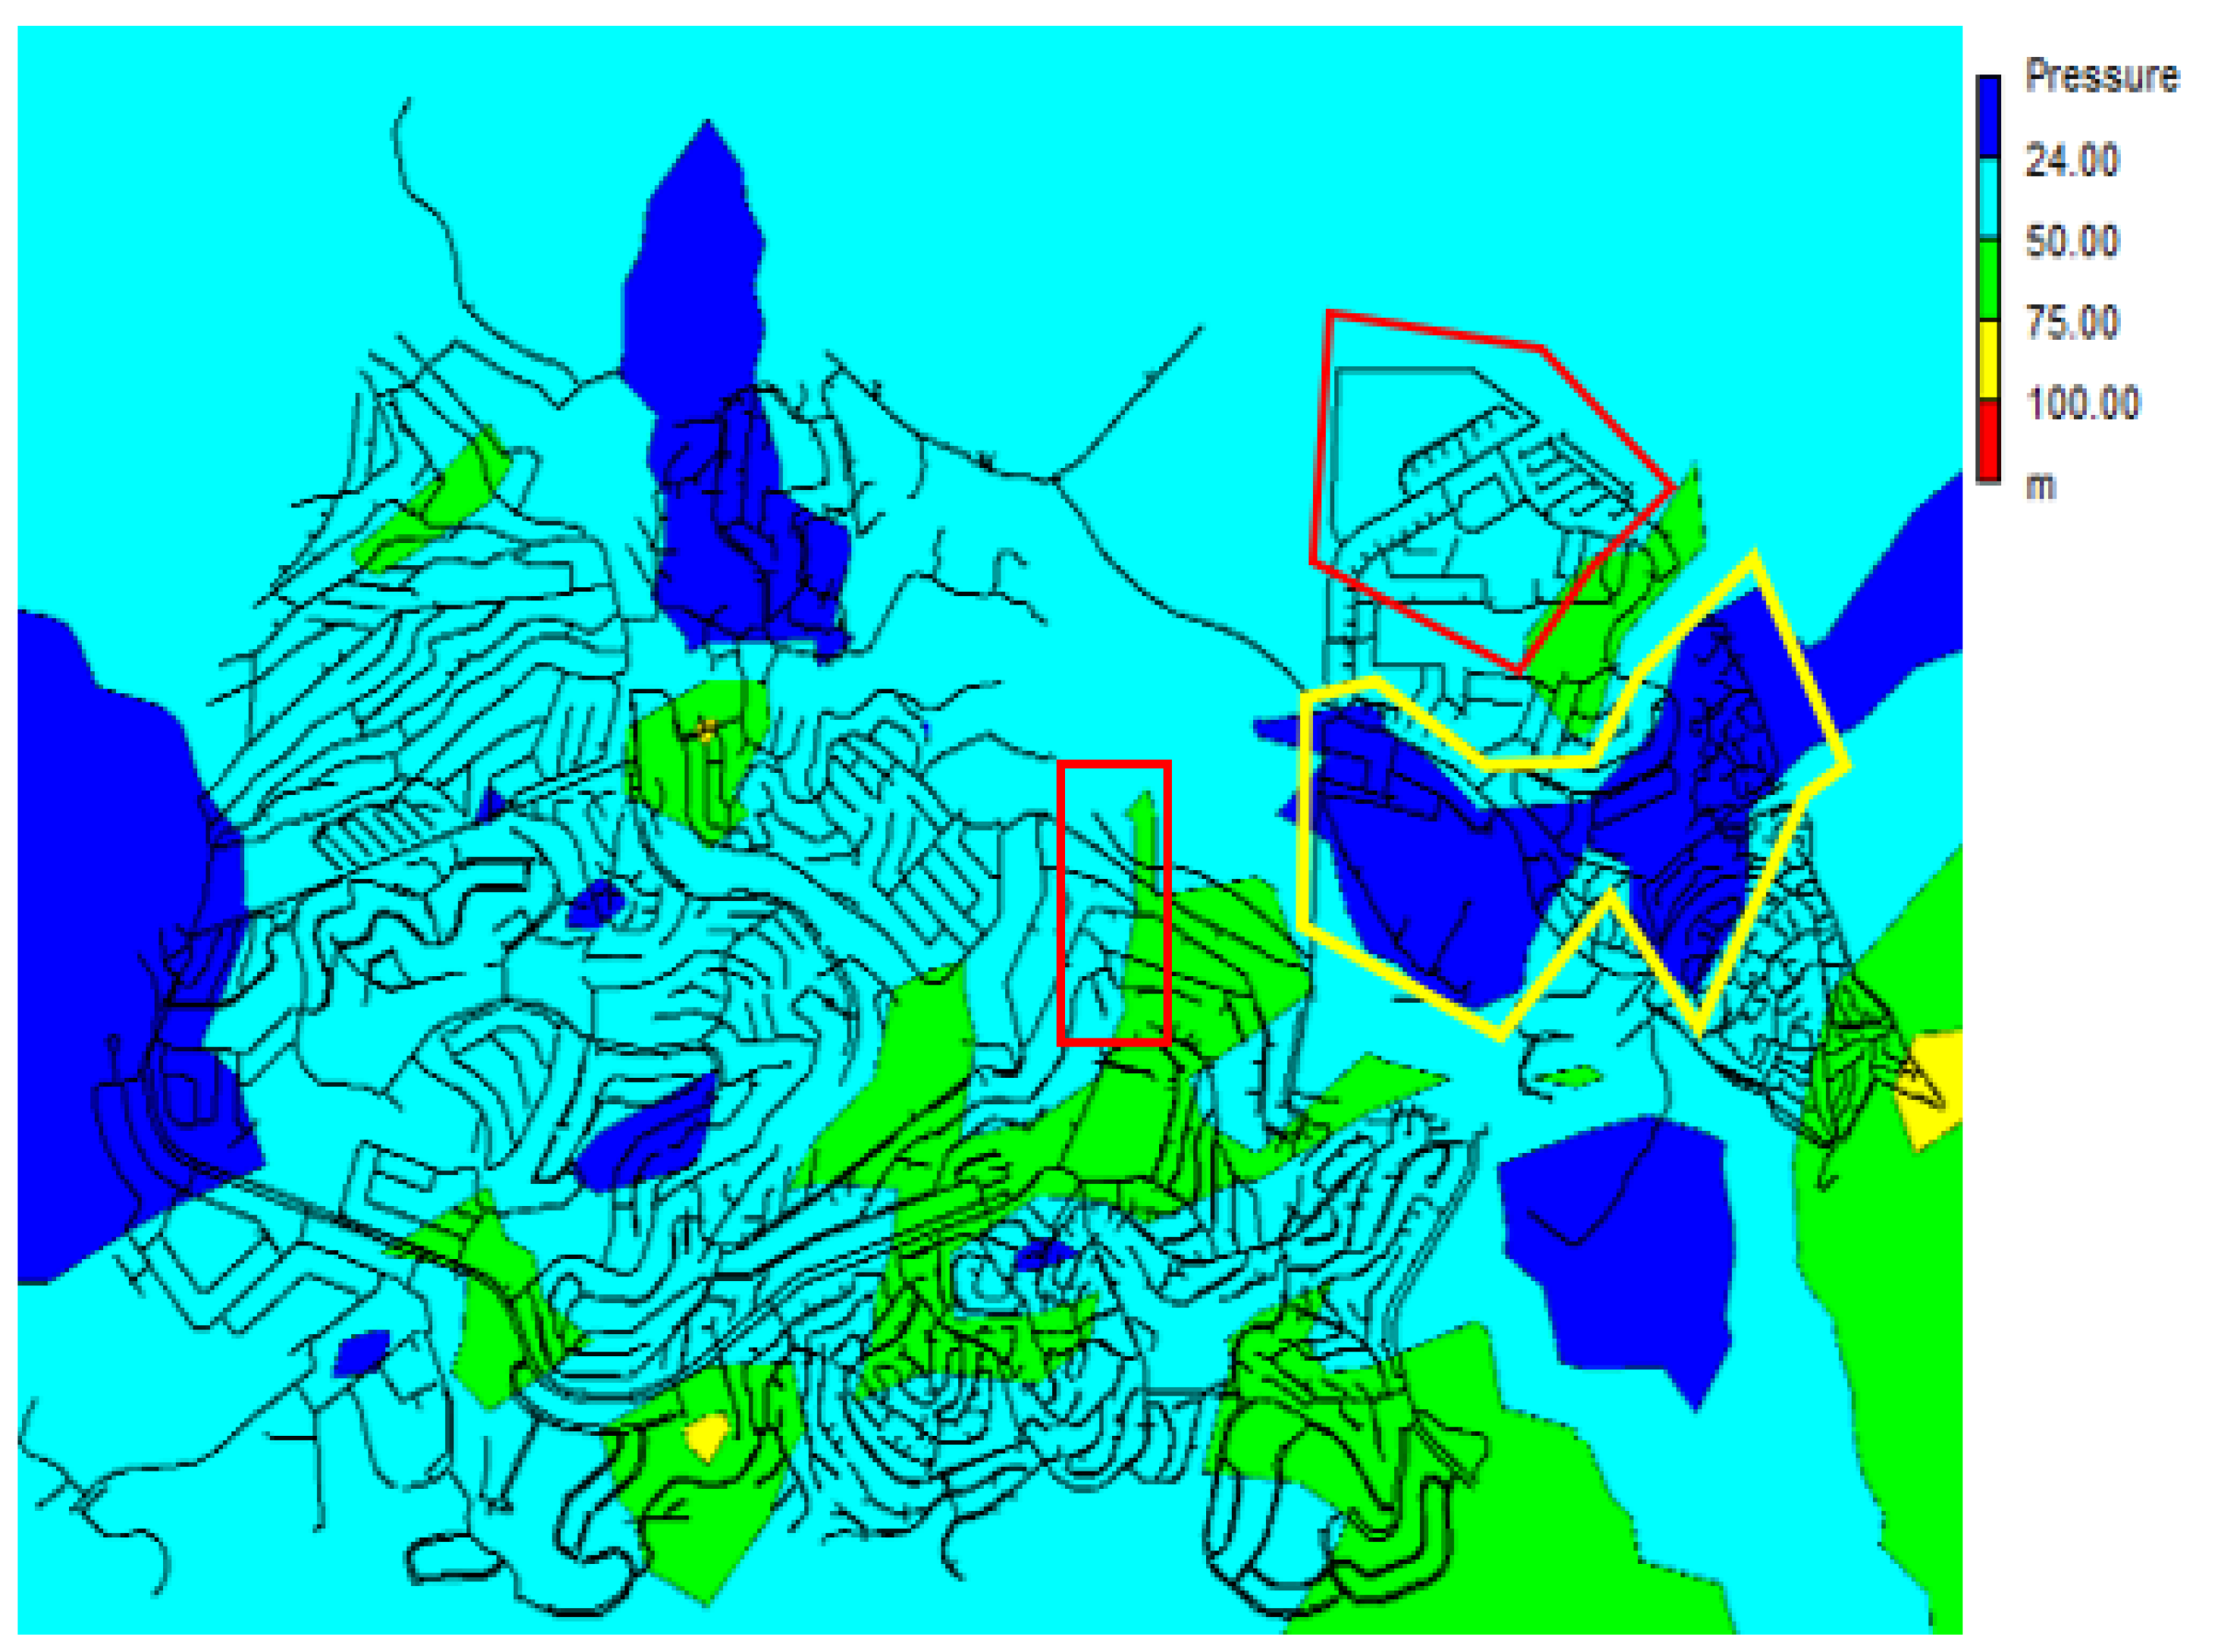
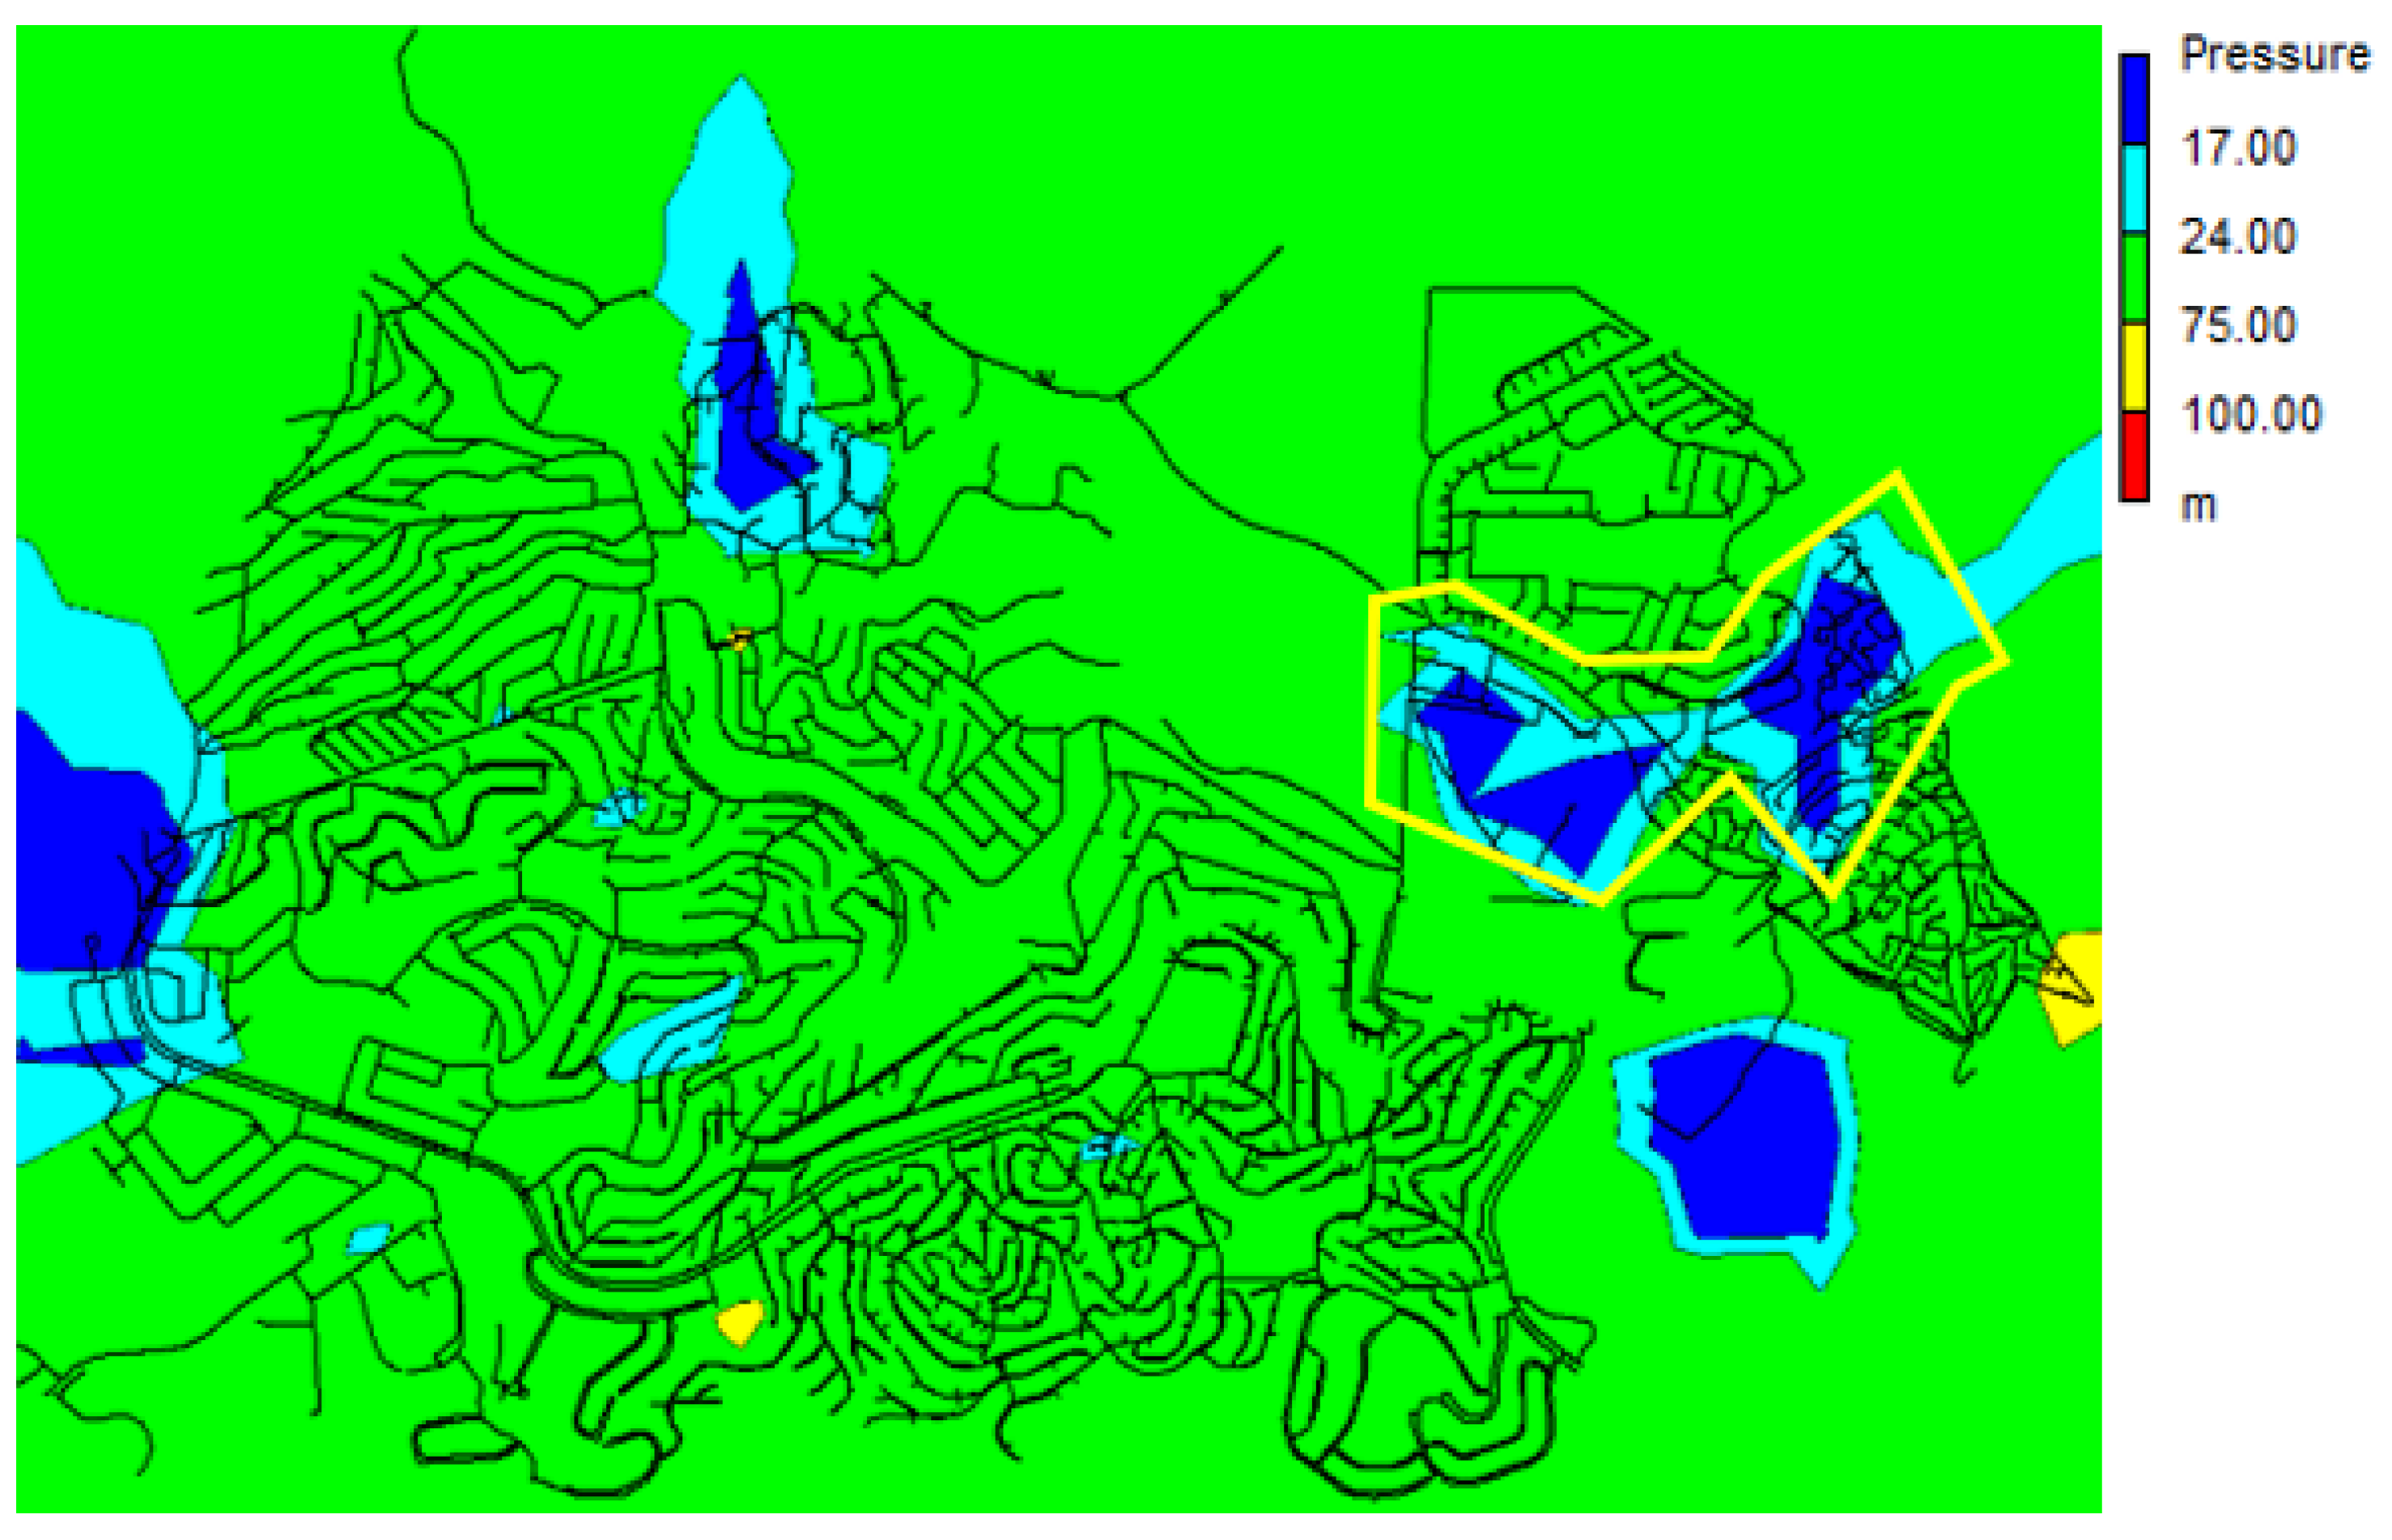
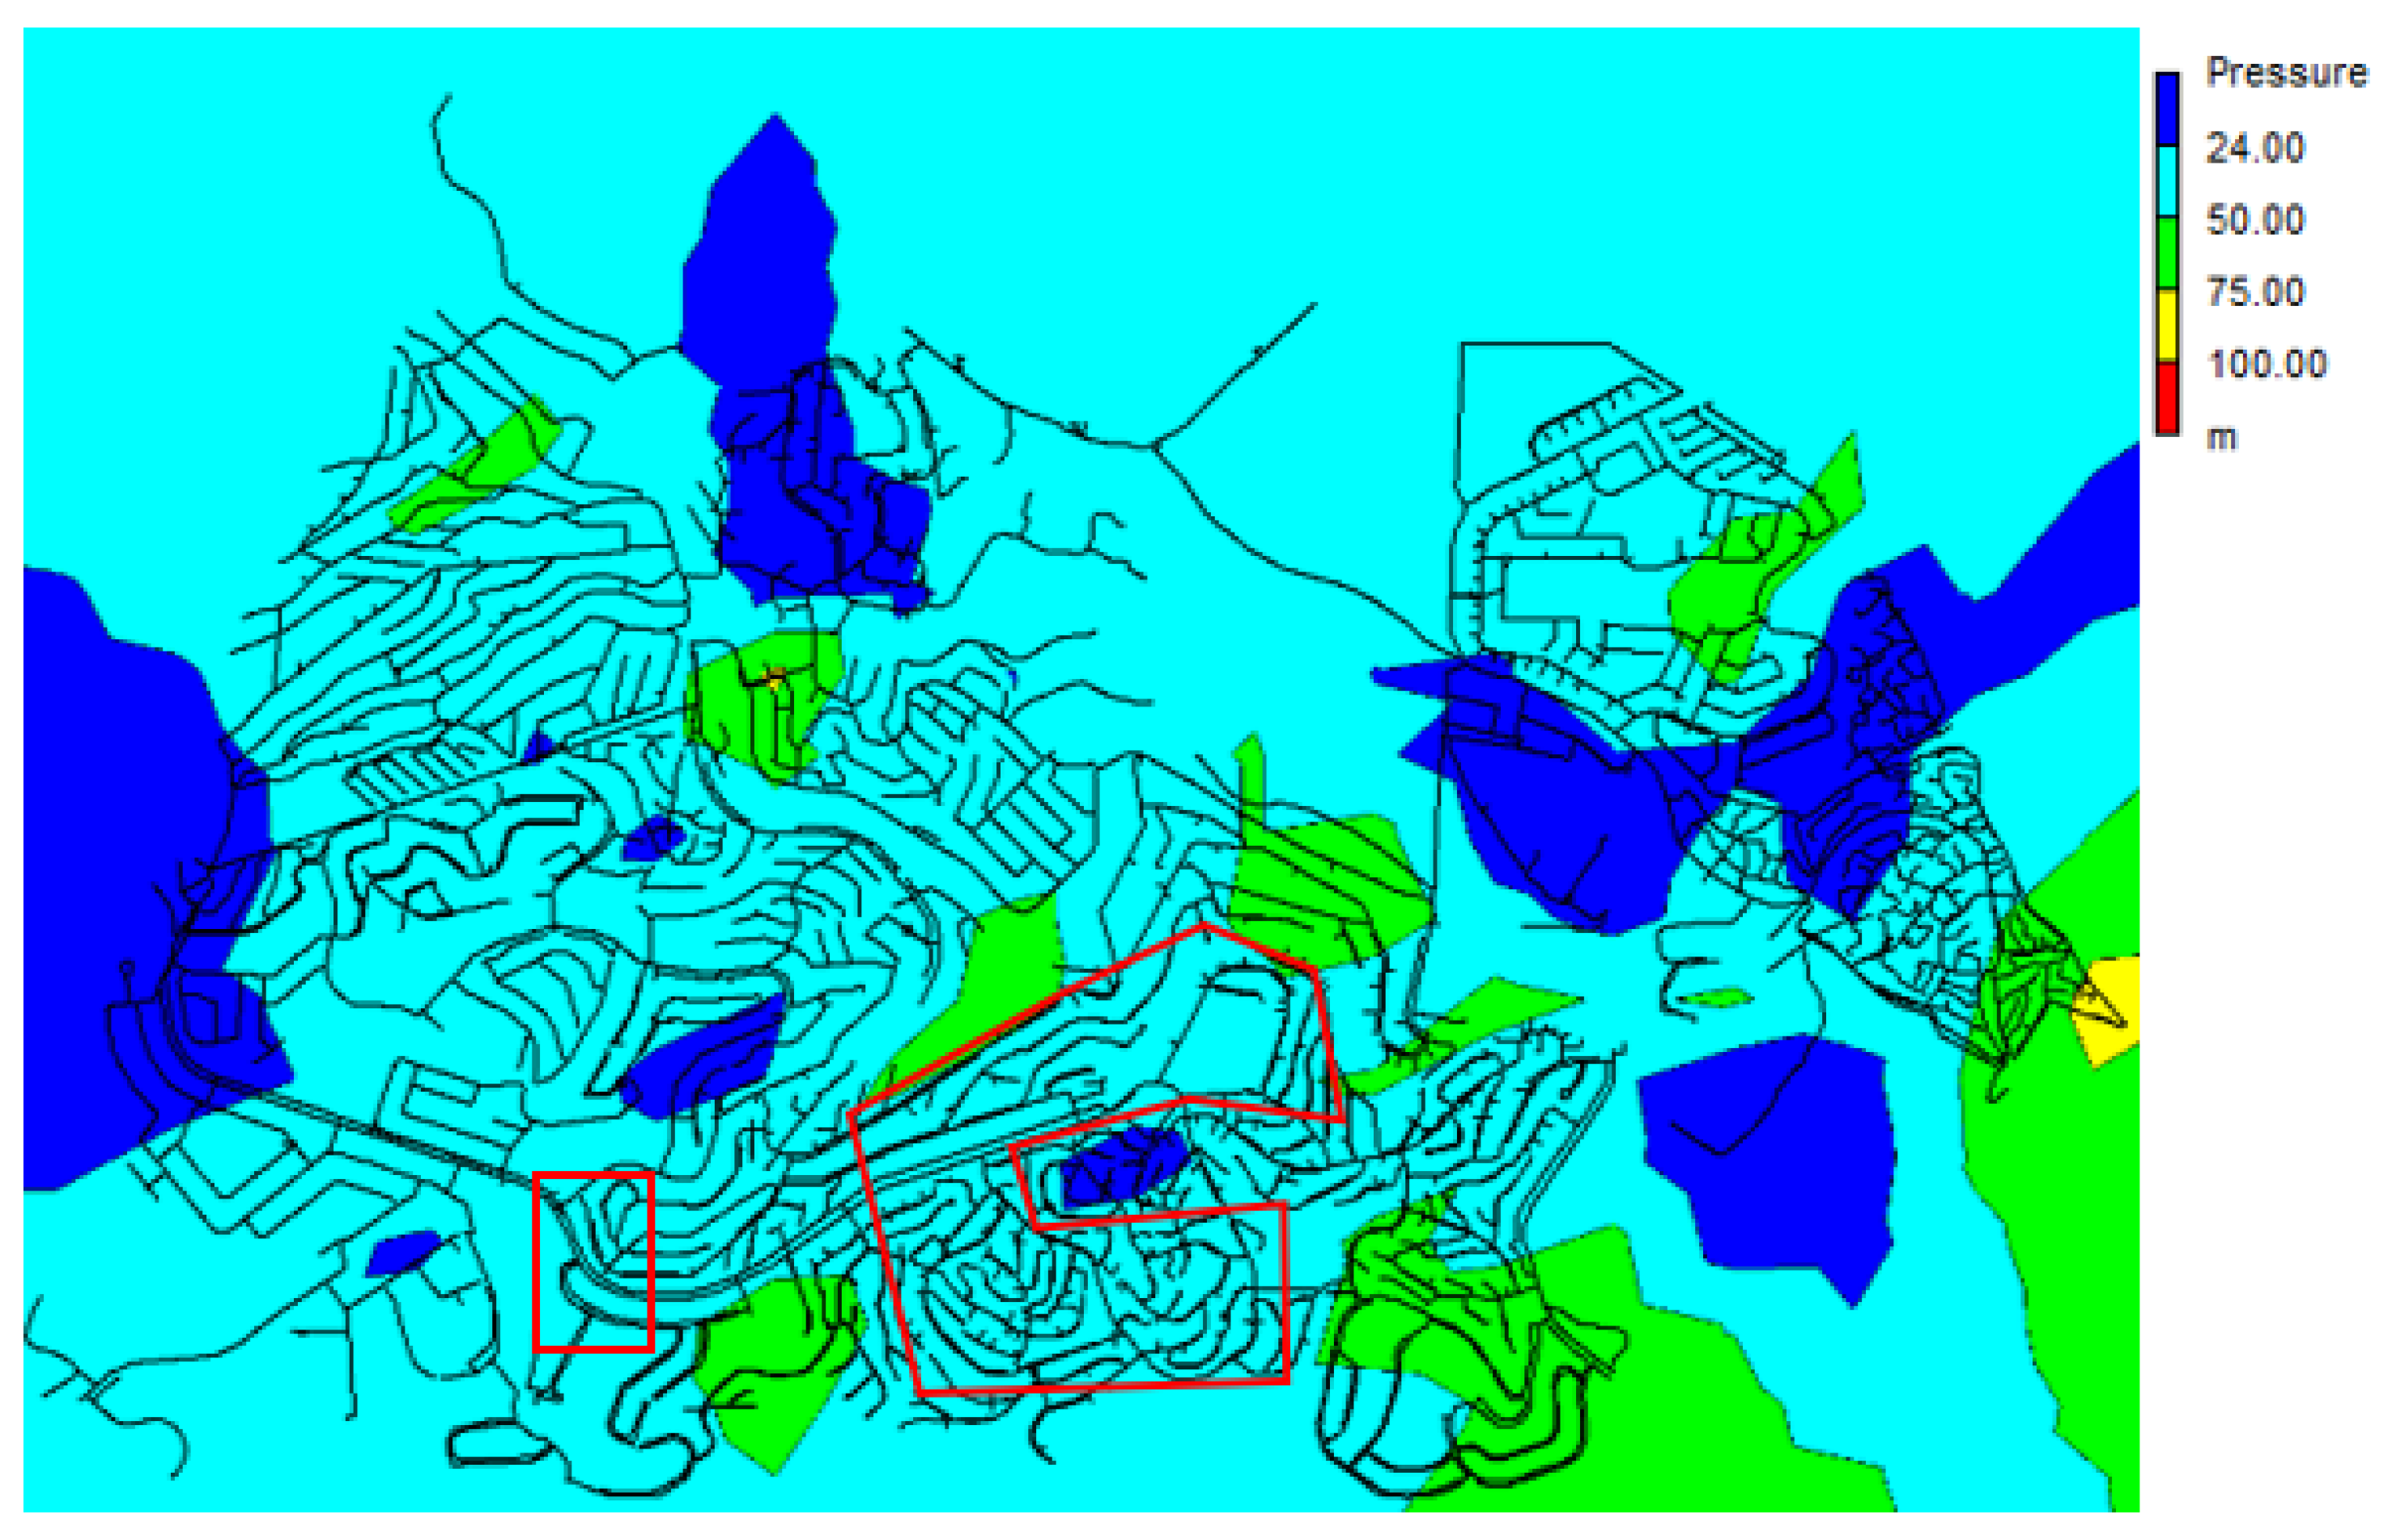
4. Summary of Results
4.1. Scenario 1
4.2. Scenario 2
4.3. Scenario 3
4.4. Scenario 4
4.5. Scenario 5
4.6. Scenario 6
4.7. Leakage in the WDN
5. Discussion
6. Conclusions
Author Contributions
Funding
Institutional Review Board Statement
Informed Consent Statement
Data Availability Statement
Conflicts of Interest
References
- Rossi, M.; Righetti, M.; Renzi, M. Pump-as-Turbine for energy recovery applications: The case study of an aqueduct. Energy Procedia 2016, 101, 1207–1214. [Google Scholar] [CrossRef]
- Kanakoudis, V.; Gonelas, K. Applying pressure management to reduce water losses in two Greek cities’ WDSs: Expectations, problems, results and revisions. Procedia Eng. 2014, 89, 318–325. [Google Scholar] [CrossRef] [Green Version]
- Patelis, M.; Kanakoudis, V.; Gonelas, K. Combining pressure management and energy recovery benefits in a water distribution system installing PATs. J. Water Supply Res. Technol. 2017, 66, 520–527. [Google Scholar] [CrossRef] [Green Version]
- De Marchis, M.; Fontanazza, C.; Freni, G.; Messineo, A.; Milici, B.; Napoli, E.; Notaro, V.; Puleo, V.; Scopa, A. Energy recovery in water distribution networks. Implementation of pumps as turbine in a dynamic numerical model. Procedia Eng. 2014, 70, 439–448. [Google Scholar] [CrossRef] [Green Version]
- South African Wind Energy Association. The Cost Benefits of Renewable Energy, 1st ed.; South African Wind Energy Association: Johannesburg, South Africa, 2019; pp. 1–20. [Google Scholar]
- GlobalPetrolPrices.com: South Africa Energy Prices. March 2020. Available online: https://www.globalpetrolprices.com/South-Africa/ (accessed on 21 December 2020).
- South African Department of Energy. Potential Developers of Renewable Energy Projects under the REFIT Programme in South Africa (On-Shore Wind, Solar, Biomass, Biogas, Small Hydropower and Landfill Gas) and Potential Developers of Cogeneration Projects, 1st ed.; South African Department of Energy: Pretoria, South Africa, 2010.
- Novara, D.; McNabola, A. Design and Year-Long Performance Evaluation of a Pump as Turbine (PAT) Pico-Hydropower Energy Recovery Device in a Water Network. Water 2021, 13, 3014. [Google Scholar] [CrossRef]
- Derakhshan, S.; Nourbakhsh, A. Theoretical, numerical and experimental investigation of centrifugal pumps in reverse operation. Exp. Therm. Fluid Sci. 2008, 32, 1620–1627. [Google Scholar] [CrossRef]
- Derakhshan, S.; Nourbakhsh, A. Experimental study of characteristic curves of centrifugal pumps working as turbines in different specific speeds. Exp. Therm. Fluid Sci. 2008, 32, 800–807. [Google Scholar] [CrossRef]
- Carravetta, A.; Del Giudice, G.; Fecarotta, O.; Ramos, H.M. Energy production in water distribution networks: A PAT design strategy. Water Resour. Manag. 2012, 26, 3947–3959. [Google Scholar] [CrossRef]
- Olifant, N. IOL: Ethekwini Loses 237 Million Litres Daily. February 2015. Available online: https://www.iol.co.za/news/south-africa/kwazulu-natal/ethekwini-loses-237-million-litres-daily-1814726 (accessed on 4 October 2020).
- Shammas, N.K.; Al-Dhowalia, K.H. Effect of pressure on leakage rate in water distribution networks. J. King Saud Univ.-Eng. Sci. 1993, 5, 213–226. [Google Scholar] [CrossRef]
- CSIR Building and Construction Technology. Guidelines for Human Settlement Planning and Design, 2nd ed.; CSIR Building and Construction Technology: Pretoria, South Africa, 2005; Volume 2, Chapter 9; pp. 1–40. [Google Scholar]
- Strijdom, J. Evaluation of Minimum Pressure Head during Peak Flow as Design Criterion for Water Distribution Systems. Ph.D. Thesis, Stellenbosch University, Stellenbosch, South Africa, 2016. [Google Scholar]
- Fontana, N.; Giugni, M.; Portolano, D. Losses reduction and energy production in water-distribution networks. J. Water Resour. Plan. Manag. 2012, 138, 237–244. [Google Scholar] [CrossRef]
- De Marchis, M.; Freni, G. Pump as turbine implementation in a dynamic numerical model: Cost analysis for energy recovery in water distribution network. J. Hydroinform. 2015, 17, 347–360. [Google Scholar] [CrossRef] [Green Version]
- De Marchis, M.; Milici, B.; Volpe, R.; Messineo, A. Energy saving in water distribution network through pump as turbine generators: Economic and environmental analysis. Energies 2016, 9, 877. [Google Scholar] [CrossRef] [Green Version]
- Germanopoulos, G.; Jowitt, P. Leakage Reduction by Excess Pressure Minimization in a Water Supply Network. Proc. Inst. Civ. Eng. 1989, 87, 195–214. [Google Scholar] [CrossRef]
- Van Zyl, J. The effect of pressure on leaks in water distribution systems. In Proceedings of the 2004 Water Institute of Southern Africa (WISA) Biennial Conference, Cape Town, South Africa, 2–6 May 2004; pp. 1104–1109. [Google Scholar]
- Ferraiuolo, R.; De Paola, F.; Fiorillo, D.; Caroppi, G.; Pugliese, F. Experimental and numerical assessment of water leakages in a PVC-A Pipe. Water 2020, 12, 1804. [Google Scholar] [CrossRef]
- Babić, B.; Đukić, A.; Stanić, M. Managing water pressure for water savings in developing countries. Water Sa 2014, 40, 221–232. [Google Scholar] [CrossRef] [Green Version]
- Mckenzie, R.; Wegelin, W. Challenges facing the implementation of water demand management initiatives in Gauteng Province. Water SA 2009, 35, 168–174. [Google Scholar] [CrossRef] [Green Version]
- WSA/WCA. Engineering and Operational Committee, Managing Leakage: UK Water Industry Managing Leakage Reports A–J. Report A—Summary Report; Report B—Reporting Comparative Leakage Performance; Report C—Setting Economic Leakage Targets; Report D—Estimating Unmeasured Water Delivered; Report E—Interpreting Measured Night Flows; Report F—Using Night Flow Data; Report G—Managing Water Pressure; Report H—Dealing With Customer’s Leakage; Report J—Techniques, Technology and Training; WSA/WCA: London, UK, 1994. [Google Scholar]
- Nyirenda, M. Cornubia Integrated Human Settlement Development Phase 2A—Gravity Network Hydraulic Modelling Report; EThekwini Municipality: Durban, South Africa, 2019. [Google Scholar]
- Rakibuzzaman, M.; Jung, K.Y.; Suh, S.H. A study on the use of existing pump as turbine. E3S Web Conf. EDP Sci. 2019, 128, 06004. [Google Scholar] [CrossRef]
- Van Vuuren, S.; Blersch, C.; Van Dijk, M. Modelling the feasibility of retrofitting hydropower to existing South African dams. Water SA 2011, 37, 679–692. [Google Scholar] [CrossRef] [Green Version]
- Sustainable Energy Africa. Sustainable Energy Solutions for South African Local Government: A Practical Guide, 1st ed.; Sustainable Energy Africa: Cape Town, South Africa, 2017; pp. 1–20. [Google Scholar]


| Pressure Correction Factor (PCF) for Variable AZNP | |||||||||
|---|---|---|---|---|---|---|---|---|---|
| AZNP (m) | 20 | 30 | 40 | 50 | 60 | 70 | 80 | 90 | 100 |
| PCF | 0.33 | 0.53 | 0.75 | 1.0 | 1.27 | 1.57 | 1.88 | 2.23 | 2.59 |
| Background Night Leakage Components at Standard AZNP = 50 m | ||||
|---|---|---|---|---|
| Leakage Components | Unit | Infrastructure Conditions | ||
| Good | Average | Poor | ||
| C1: Distribution Mains | Lit/(km h) | 20 | 40 | 60 |
| C2: Communication Pipes | Lit/(conn h) | 1.5 | 3.0 | 4.5 |
| C3: Underground Supply Pipes | Lit/(conn h) | 0.5 | 1.0 | 1.5 |
| PAT Power Generation and Profit | Feasibility Analysis | ||||||||
|---|---|---|---|---|---|---|---|---|---|
| PATs | Power | Power/Year | Profit (R) | Price (R) | EGE | CW | MC | AF | CPP (Yr) |
| Scenario 2 | |||||||||
| PAT-1 | 13.56 kW | 4.54 MW | 45,196.53 | 62,452 | 81,188 | 24,356 | 15,832 | 94,757 | 1.11 |
| Scenario 3 | |||||||||
| PAT-1 | 13.56 kW | 4.54 MW | 45,196.53 | 62,452 | 81,188 | 24,356 | 15,832 | 94,757 | 1.11 |
| PAT-2 | 16.65 kW | 5.58 MW | 55,516.12 | 66,980 | 87,074 | 26,122 | 16,980 | 118,860 | 0.95 |
| PAT-3 | 1.24 kW | 0.42 MW | 4142.62 | 40,617 | 52,802 | 15,840 | 10,296 | −160 | −429.15 |
| Scenario 4 | |||||||||
| PAT-1 | 13.56 kW | 4.54 MW | 45,196.53 | 62,452 | 81,188 | 24,356 | 15,832 | 94,757 | 1.11 |
| PAT-2 | 16.65 kW | 5.58 MW | 55,516.12 | 66,980 | 87,074 | 26,122 | 16,980 | 118,860 | 0.95 |
| PAT-4 | 7.05 kW | 2.36 MW | 23,507.64 | 52,898 | 68,767 | 20,630 | 13,410 | 44,110 | 2.03 |
| PAT-5 | 0.51 kW | 0.17 MW | 1687.67 | 40,617 | 52,802 | 15,840 | 10,296 | −6167 | −11.13 |
| PAT-6 | 0.59 kW | 0.196 MW | 1951.08 | 40,617 | 52,802 | 15,840 | 10,296 | −5522 | −12.43 |
| Scenario 5 | |||||||||
| PAT-1 | 13.56 kW | 4.54 MW | 45,196.53 | 62,452 | 81,188 | 24,356 | 15,832 | 94,757 | 1.11 |
| PAT-2 | 16.65 kW | 5.58 MW | 55,516.12 | 66,980 | 87,074 | 26,122 | 16,980 | 118,860 | 0.95 |
| PAT-4 | 7.05 kW | 2.36 MW | 23,507.64 | 52,898 | 68,767 | 20,630 | 13,410 | 44,110 | 2.03 |
| PAT-7 | 2.34 kW | 0.78 MW | 7806.20 | 40,617 | 52,802 | 15,840 | 10,296 | 8804 | 7.80 |
| PAT-8 | 74.04 kW | 24.80 MW | 246,850.62 | 174,869 | 227,330 | 68,199 | 44,329 | 559,676 | 0.53 |
| PAT-9 | 55.01 kW | 18.43 MW | 183,421.61 | 154,616 | 201,001 | 60,300 | 39,195 | 409,610 | 0.64 |
| Best PAT Scenario—Scenario 6 | |||||||||
| PAT-1 | 13.56 kW | 4.54 MW | 45,196.53 | 62,452 | 81,188 | 24,356 | 15,832 | 94,757 | 1.11 |
| PAT-2 | 16.65 kW | 5.58 MW | 55,516.12 | 66,980 | 87,074 | 26,122 | 16,980 | 118,860 | 0.95 |
| PAT-4 | 7.05 kW | 2.36 MW | 23,507.64 | 52,898 | 68,767 | 20,630 | 13,410 | 44,110 | 2.03 |
| PAT-8 | 74.04 kW | 24.80 MW | 246,850.62 | 174,869 | 227,330 | 68,199 | 44,329 | 559,676 | 0.53 |
| PAT-9 | 55.01 kW | 18.43 MW | 183,421.61 | 154,616 | 201,001 | 60,300 | 39,195 | 409,610 | 0.64 |
| Total Scenario 6 | 166.31 kW | 55.71 MW | 554,492.52/year | ||||||
Publisher’s Note: MDPI stays neutral with regard to jurisdictional claims in published maps and institutional affiliations. |
© 2022 by the authors. Licensee MDPI, Basel, Switzerland. This article is an open access article distributed under the terms and conditions of the Creative Commons Attribution (CC BY) license (https://creativecommons.org/licenses/by/4.0/).
Share and Cite
Pillay, E.; Kumarasamy, M.; Adu, J.; Thirumuruganandham, S.P.; Paruk, A.; Naidoo, M. Feasibility Analysis of Energy Recovery Using PATs in Water Distribution Networks. Water 2022, 14, 1150. https://doi.org/10.3390/w14071150
Pillay E, Kumarasamy M, Adu J, Thirumuruganandham SP, Paruk A, Naidoo M. Feasibility Analysis of Energy Recovery Using PATs in Water Distribution Networks. Water. 2022; 14(7):1150. https://doi.org/10.3390/w14071150
Chicago/Turabian StylePillay, Ethan, Muthukrishnavellaisamy Kumarasamy, Joy Adu, Saravana Prakash Thirumuruganandham, Ayesha Paruk, and Maranka Naidoo. 2022. "Feasibility Analysis of Energy Recovery Using PATs in Water Distribution Networks" Water 14, no. 7: 1150. https://doi.org/10.3390/w14071150
APA StylePillay, E., Kumarasamy, M., Adu, J., Thirumuruganandham, S. P., Paruk, A., & Naidoo, M. (2022). Feasibility Analysis of Energy Recovery Using PATs in Water Distribution Networks. Water, 14(7), 1150. https://doi.org/10.3390/w14071150


