
Ecosystem Service Assessment of Soil and Water Conservation Based on Scenario Analysis in a Hilly Red-Soil Catchment of Southern China


Abstract
:1. Introduction
2. Methods
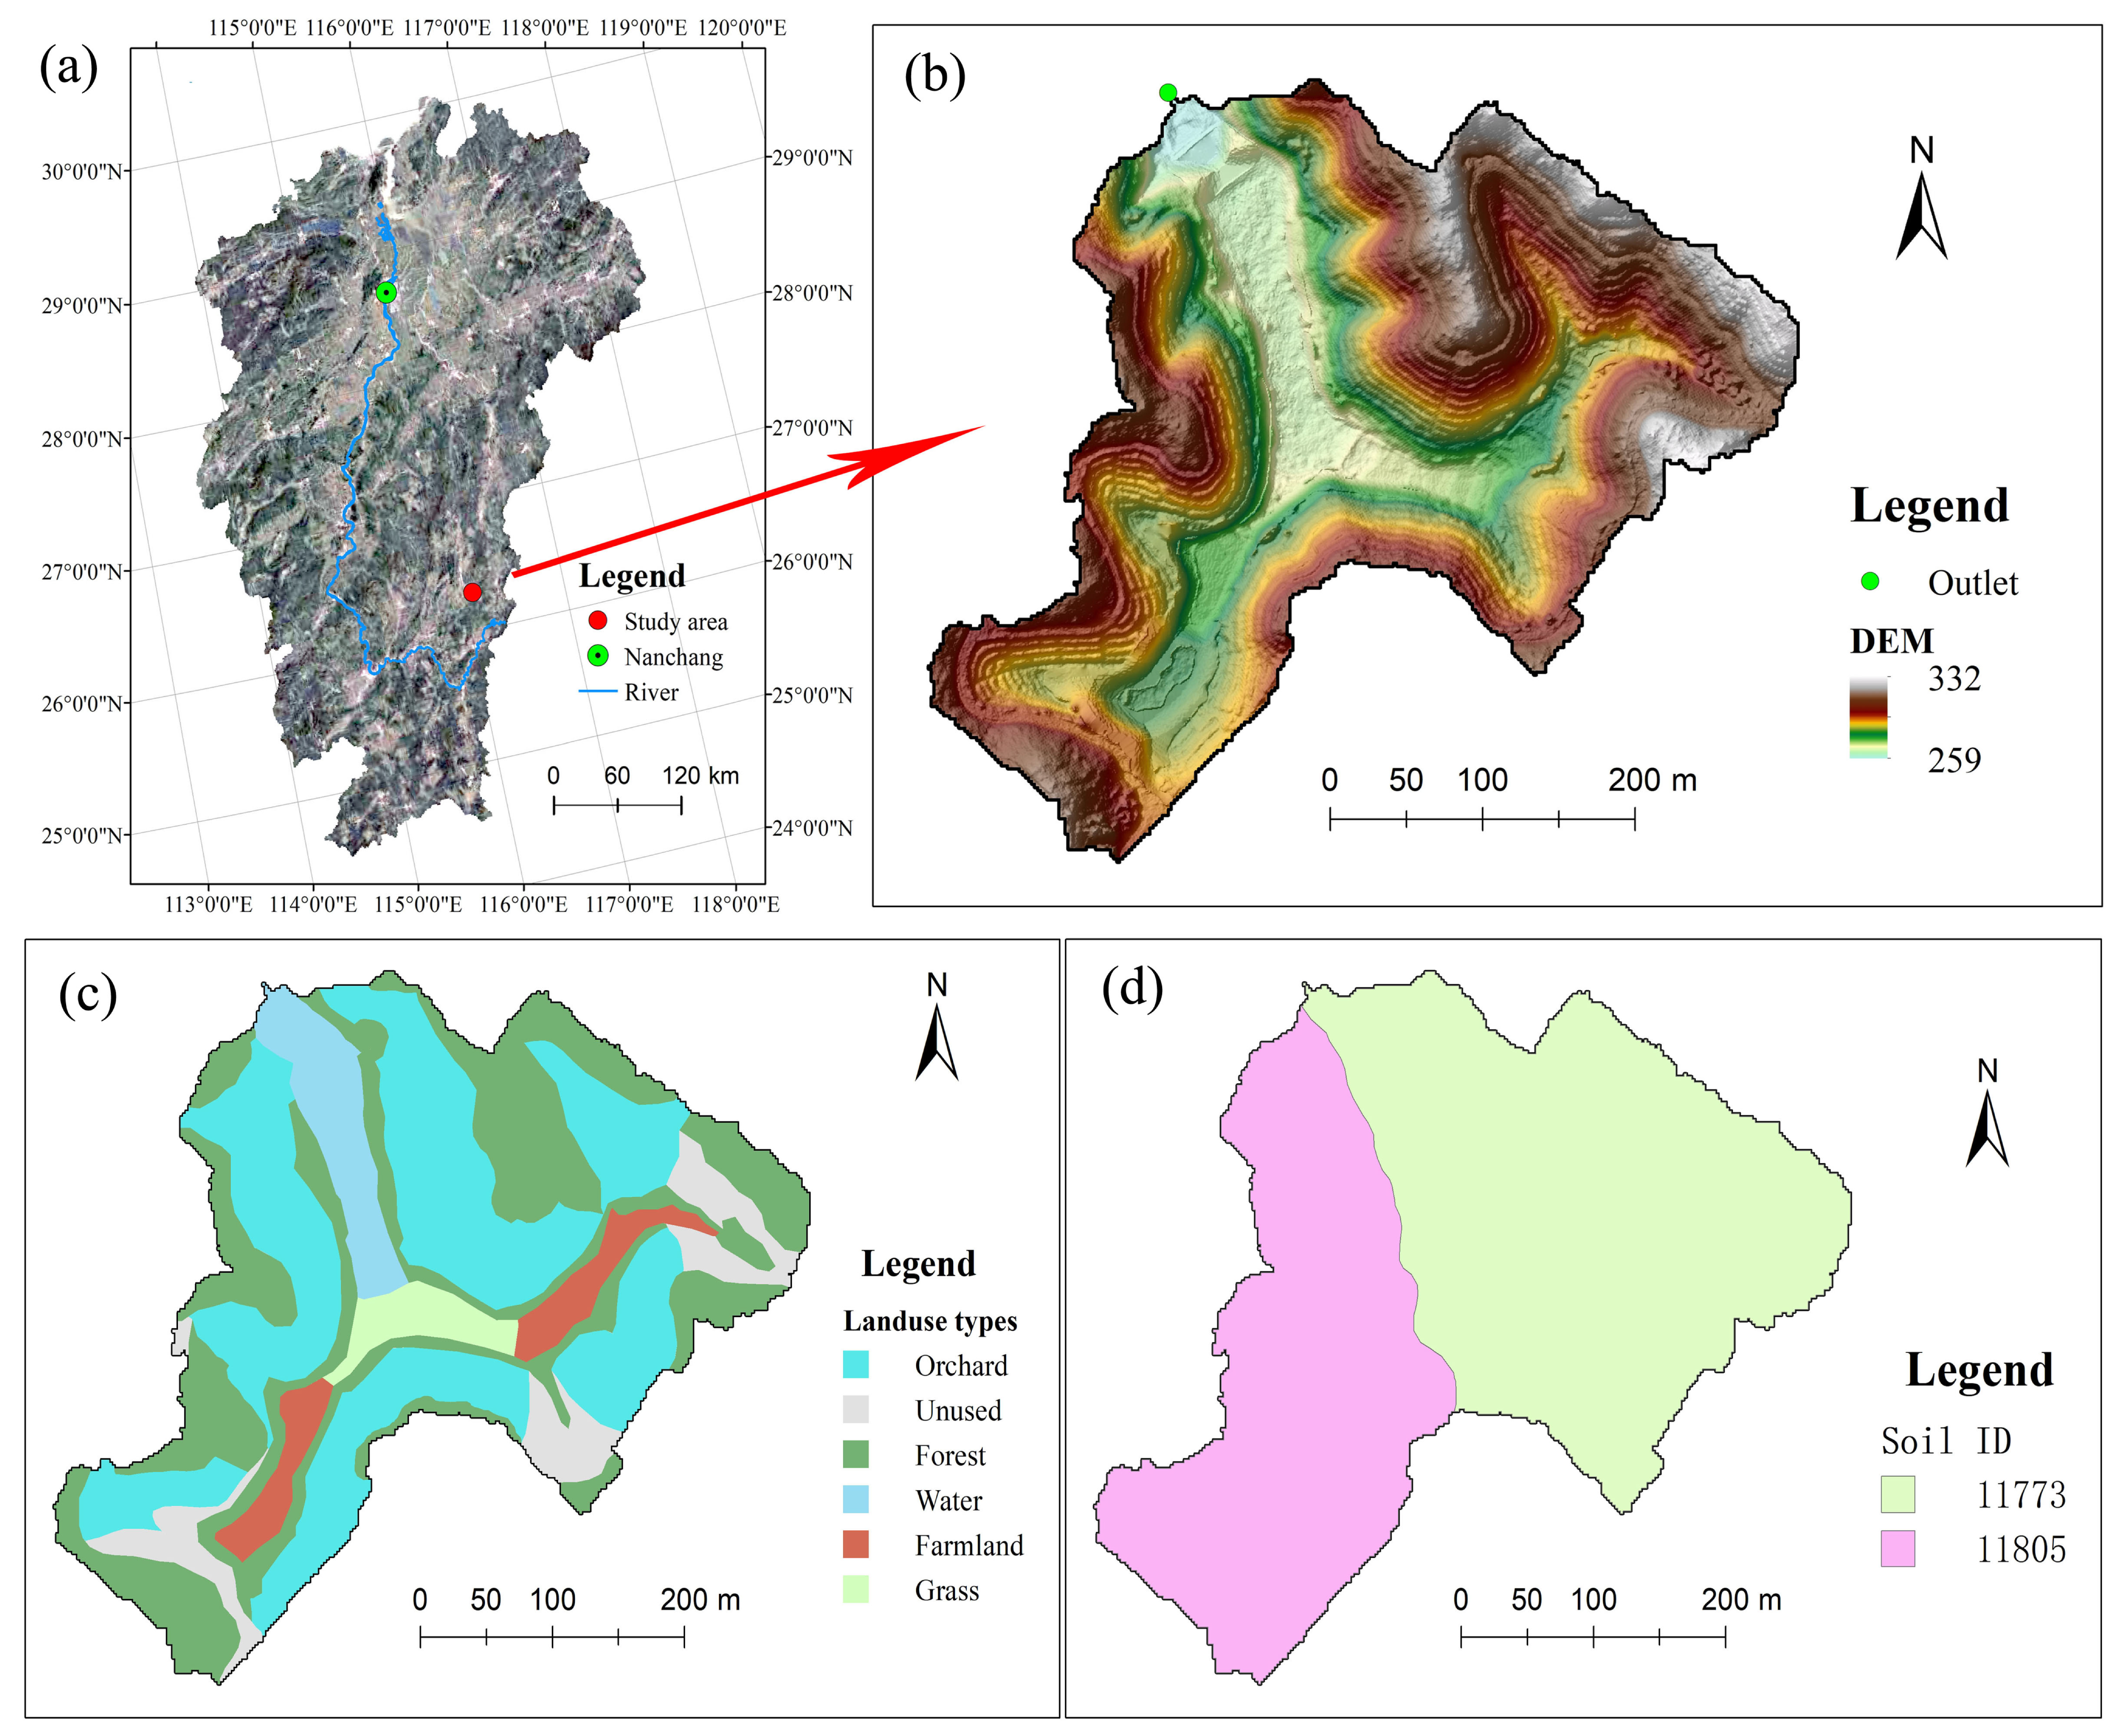
2.1. Study Area and Data Sources
2.2. Soil and Water Conservation Practices
2.3. Scenario Design
2.3.1. Baseline Scenario
2.3.2. Alternative Scenarios

| ID | Name | Objectives | Practices | Distribution |
|---|---|---|---|---|
| S0 | The baseline scenario | To compare with S1, S2, and S3 | Traditional farming with no conservation practices (NCP) | Figure 3a |
| S1 | The scenario of dominant soil and water conservation | To prevent soil loss and water regulation in rainy and dry seasons | AST, SR, CHM, BF, HCD | Figure 3b |
| S2 | The scenario of leading economic development | To increase the economic incomes of local farmers | AST, SR, CHM, BF, HCD | Figure 3c |
| S3 | The scenario of the trade-offs between S1 and S2 | To achieve or balance both objectives of S1 and S2 | AST, SR, CHM, BF, HCD | Figure 3d |
2.4. Evaluation Objectives of the Scenarios
2.4.1. Mapping Ecosystem Services
2.4.2. Calculating Ecosystem Services
| ID | Indicators of ES | Equations and Descriptions | Data and Model | Weights |
|---|---|---|---|---|
| 1 | Sediment loss rate (SLR) | SLR = A/T, SLR is the sediment loss rate, A is the sediment loss (t/(km2·a)), and T is the acceptable soil loss (t/(km2·a)); the MUSLE method is used to calculate A, and T is accessed from the local standard, e.g., 500 t/(km2·a). When A > T, it indicates that the sediment loss of this area cannot meet the local standard, and the score is 0. When 0 ≤ A < T, the score is (1 − A/T) ∗ 100. | SEIMS model used for computing sediment loss. | 0.08 |
| 2 | Soil and water conservation rate (SWCR) | SWCR = S1/S ∗ 100. S1 is the soil erosion free area, which refers to the land area with less than slight soil erosion intensity in the region. S is the total area of the region. The standard of soil and water conservation rate (D) is 11.35%. If SWCR ≥ D, the score is 100; if SWCR ≥ 0.9 ∗ D, the score is 90; if SWCR ≥ 0.8 ∗ D, the score is 80; and so on. | SEIMS model used for computing the area of soil erosion. | 0.08 |
| 3 | Runoff regulation rate in rainy season (RRR_R) | RRR_R = (Rr1 − Rr2)/Rr1, RRR_R is the regulation rate of runoff in rainy season, Rr2 is the water yield of the study area under SWC practices, and Rr1 is the water yield of the study area without SWC practices. The SCS CN method was used to calculate Rr1 and Rr2. The score is (1 − RRR_R) ∗ 100. | SEIMS model used for computing runoff in rainy season. | 0.048 |
| 4 | Runoff regulation rate in dry season (RRR_D) | RRR_D = (Rd1 − Rd2)/Qn, Rd2 is the water yield of the study area under SWC practices and Rd1 is the water yield of the study area without SWC practices. The SCS CN method was used to calculate Rd1 and Rd2. Calculation of ecological water demand (Qn) by area quota method. When RRR_D < 0, the score is 0. When RRR_D > 1, the score is 100. Otherwise, the score is RRR_D ∗ 100. | SEIMS model used for computing runoff in dry season. | 0.072 |
| 5 | Soil fertility index (SFI) | Soil fertility index (SFI) = (FTNs ∗ W1 + FTPs ∗ W2 + FTKs ∗ W3 + FSOM ∗ W4)/4, FTNs is the soil total nitrogen content (g/kg), FTPs is the soil total phosphorus content (g/kg), FTKs is the soil total potassium (g/kg) and FSOM is the soil organic matter content (g/kg). W1~W4 are the coefficients of different soil parameters. In this study, the values are 0.5, 10, 5, and 0.025, respectively. When SFI > 1, the score is 100. Otherwise, the score is SFI ∗ 100. | Soil properties data used in Table 1, and referenced from Wang’s research [45]. | 0.06 |
| 6 | Aquatic habitat index (AHI) | . AHI is the aquatic habitat index, A1~A5 are the percentages of river water volume in the river channel (%), the water quality score (according to surface water classification standard), the depth:width ratio of the riverbed (%), the riverbank vegetation coverage (%), and the percentage of riverbank human activities (%), respectively. score (Ai) is the score obtained by looking up the table of river habitat quality evaluation index and standard. | Land-use types derived from the image data of UAV in Table 1, and referenced from Wang’s research [46] | 0.06 |
| 7 | Species richness index (SRI) | , SRI is the species richness index, r is the number of species, and pi is the proportion of individuals belonging to species i in the sample. | Local species data in Table 1 and referenced from Shannon-Wiener Index [47] | 0.195 |
| 8 | Carbon sequestration index (CSI) | CSI = C_above + C_below + C_soil + C_dead, C_above, C_below, C_soil, and C_dead are the carbon density in aboveground mass (Mg/Ha), carbon density in belowground mass (Mg/Ha), carbon density in soil (Mg/Ha) and carbon density in dead mass (Mg/Ha). The average carbon density of the forest ecosystem in Jiangxi Province is 147.57 t/hm2 as the standard (STC). If CSI ≥ 2 ∗ STC, the score is 100; if CSI ≥ 1.5 ∗ STC, the score is 90; if CSI ≥ STC, the score is 80; if CSI ≥ 0.7 ∗ STC, the score is 70; if CSI ≥ 0.6 ∗ STC, the score is 60; and so on. | Derived from soil sampling data in Table 1 and referenced from InVEST User’s Guide [48] | 0.105 |
| 9 | Forest and grass coverage (FGC) | The percentage of area of forest land and grassland in the total area of the watershed (FGC). When FGC > 60%, the score is 100; when FGC < 20%, the score is 0; in other case, the score can be calculated by . | Land-use types derived from the image data of UAV. | 0.04 |
| 10 | Area index (AI) | The area index is expressed by patch density (PD) = N/A, that is, the number of patches per unit area. N is the total number of patches of a certain type of landscape (vegetation type), and A is the total area of patches corresponding to a certain type of landscape. When PD ≥ 30 and PD ≤ 3, the score is 0. In other cases, the score is calculated by . | Land-use types derived from the image data of UAV and referenced from Fragstats [49] | 0.0264 |
| 11 | Shape index (SI) | , E is the total length of all patch boundaries in the landscape, and A is the total area of landscape patches. When SI ≥ 20, the score is 100. When SI < 20, the score is SI/20 ∗ 100. | Land-use types derived from the image data of UAV and referenced from Fragstats [49] | 0.0084 |
| 12 | Diversity index (DI) | , m is the total number of patch types in the landscape, Pi is the area ratio of patch type i in the total landscape types. When DI ≥ 3.4, the score is 100. When DI < 3.4, the score is calculated by DI/3.4 × 100. | Land-use types derived from the image data of UAV and referenced from Shannon–Wiener Index [47] | 0.0252 |
| 13 | Pond fish production (PFP) | This index is characterized by the pond aquacul-ture output (Fp). The scoring standard value refers to the regional statistical yearbook, and takes twice the average value of pond aquaculture output (2RfP) in the regional statistical yearbook as the standard. When Fp ≥ 2RfP, the score is 100. In other case, the score is calculated by . | The data of pond aquaculture output by investigation. | 0.064 |
| 14 | Orchard yield (OY) | Orchard yield (OY) is scored by taking 2 times of the average value of orchard yield (2Roy) in the regional statistical yearbook as the standard. When OY ≥ 2 Roy, the score is 100. In other case, the score is calculated by | The data of orchard yield by investigation. | 0.136 |
| 15 | Comprehensive score of ES (ES score) | Comprehensive score of ES (ES score) is described by the weighted sum value of the above 14 indicators. The ES score is calculated by in which the Xi is the i-th indicator, and Wi is the weight of the i-th indicator. | Analytic hierarchy process (AHP) [42,43] used to calculate weights. |
2.4.3. Estimating Economic Value
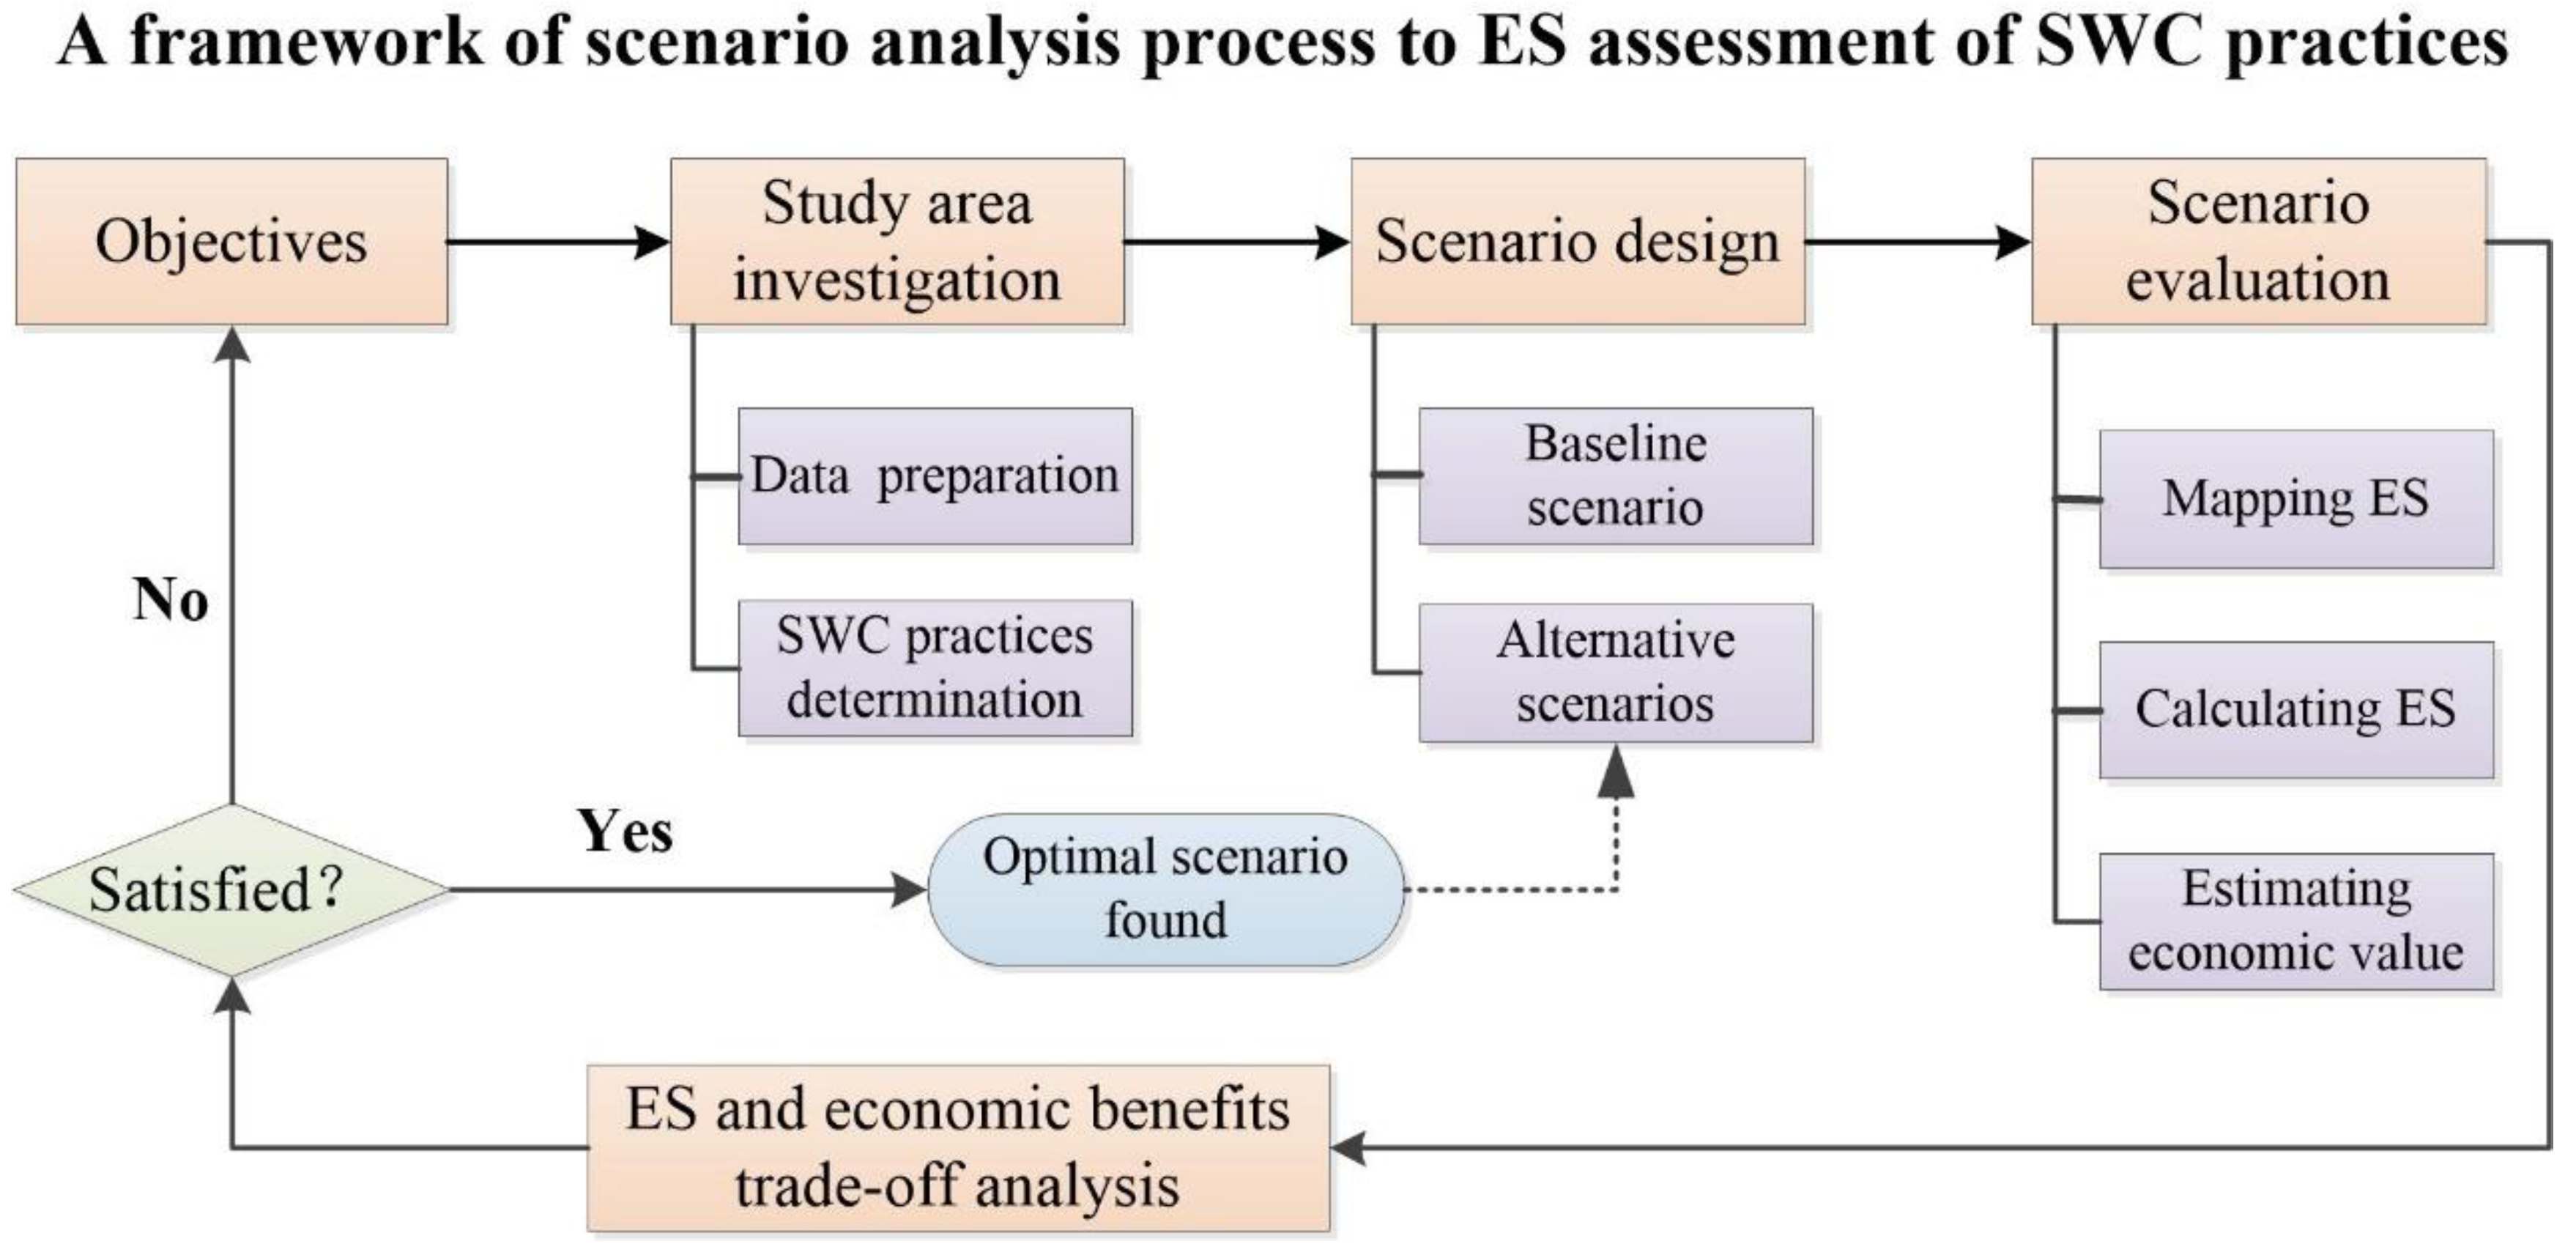
2.5. Framework of Scenario Analysis
3. Results and Discussion
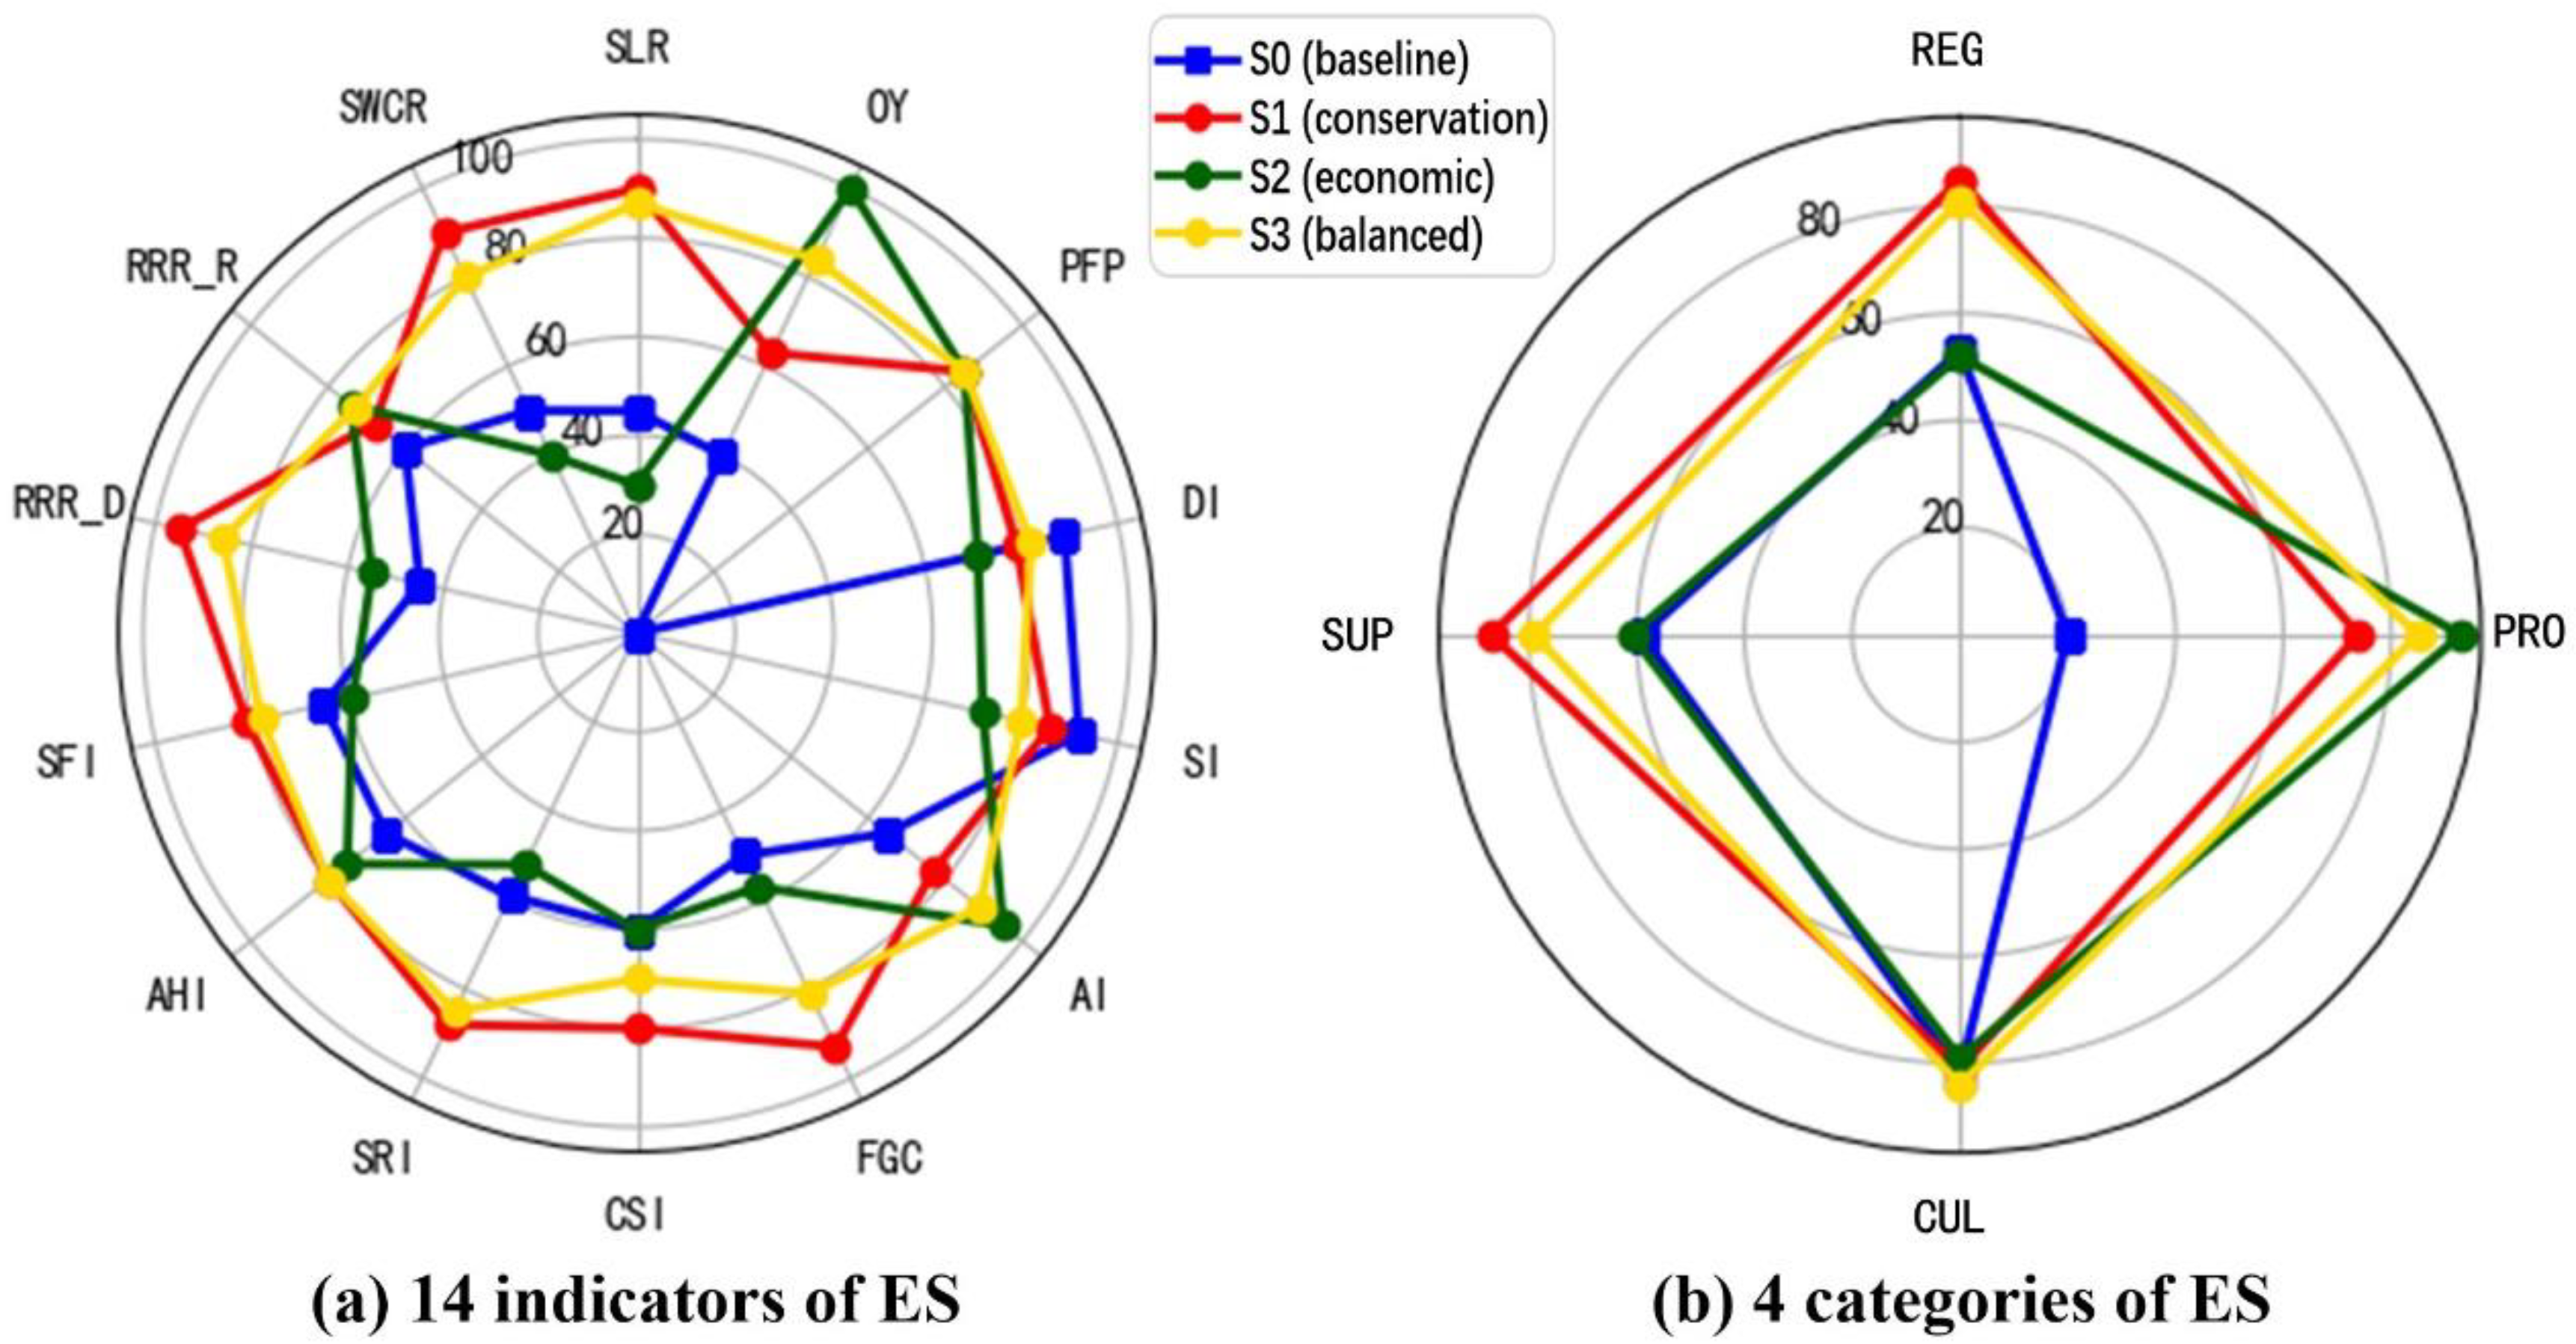
3.1. Indicators of ES for Each Scenario
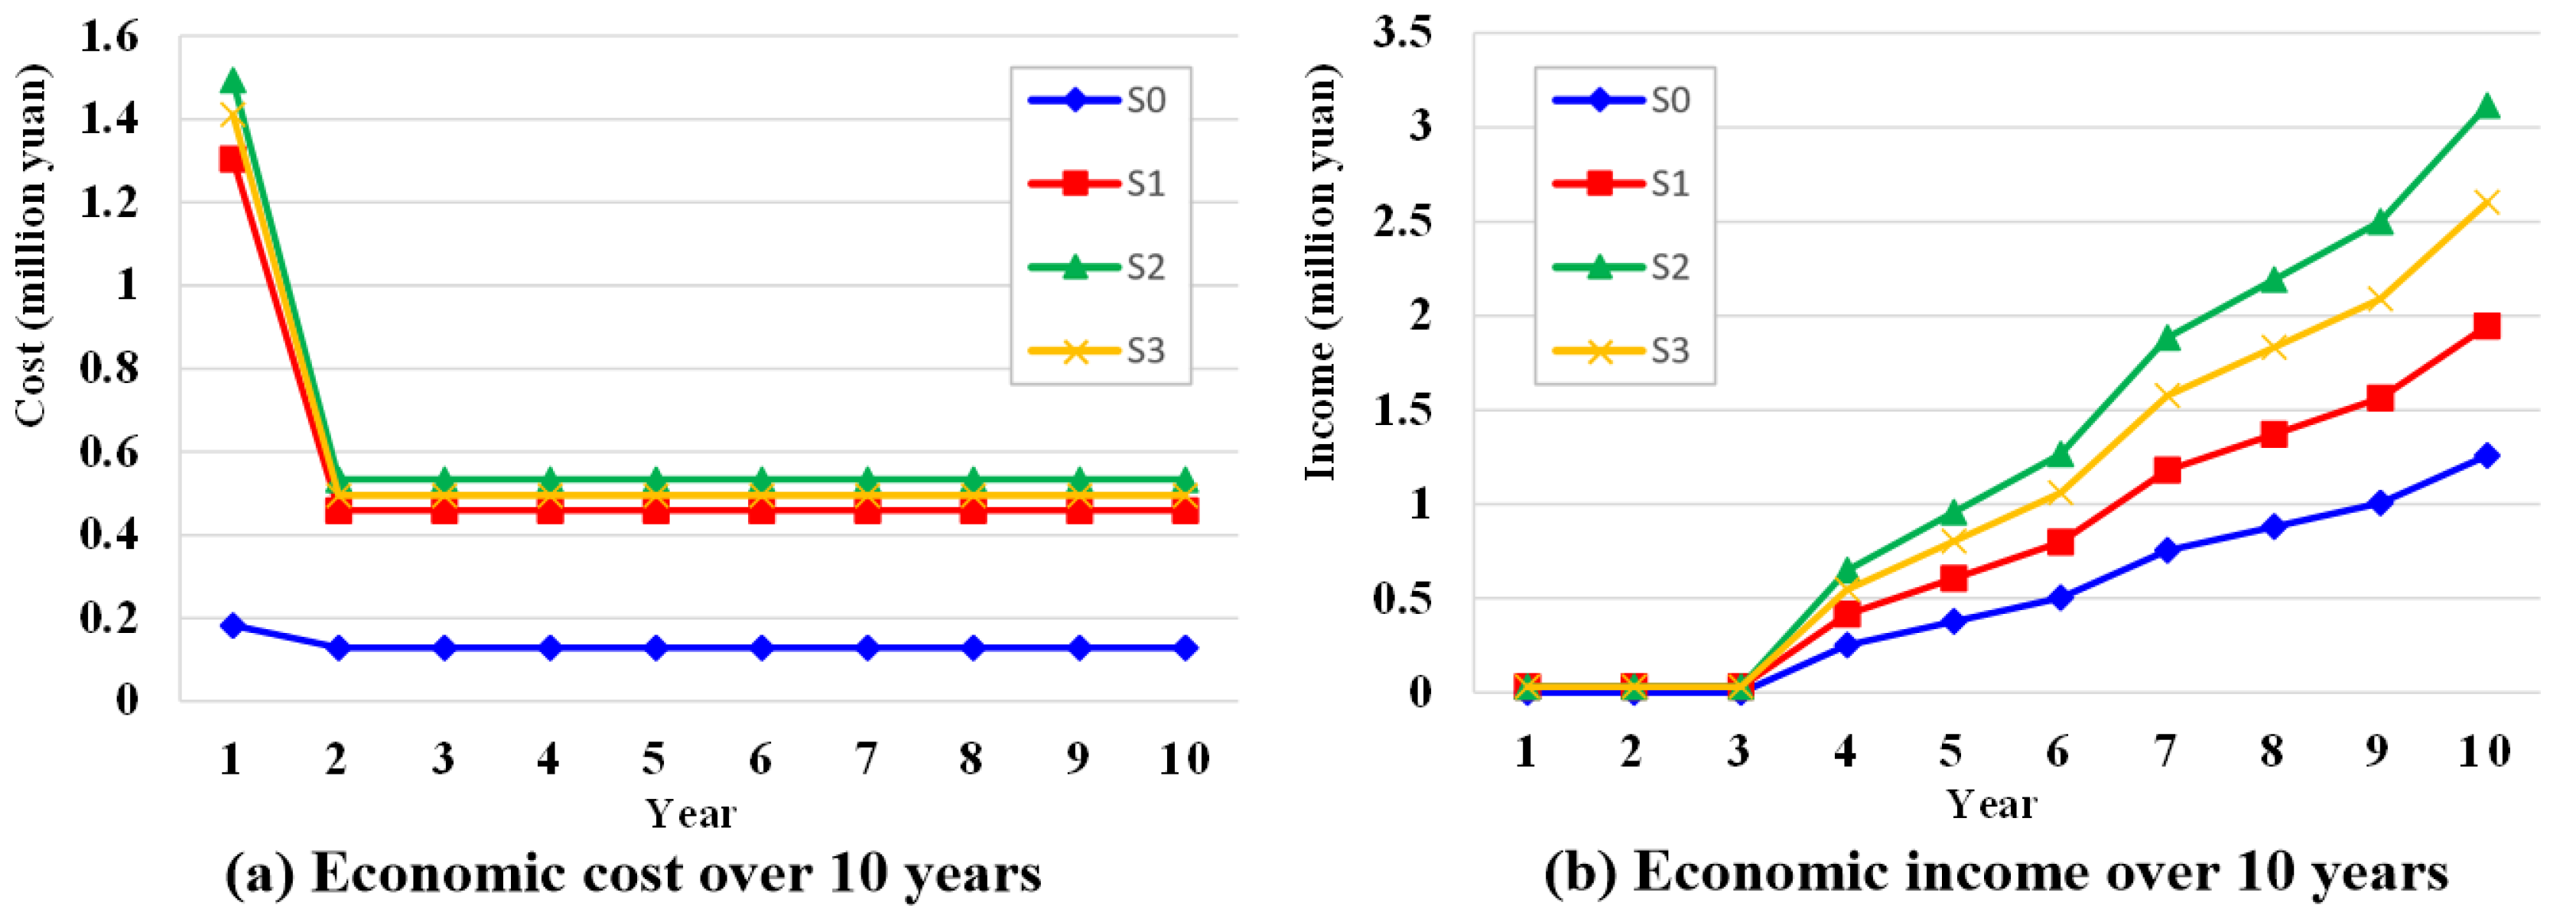
3.2. Comprehensive ES Score and Economic Analysis
3.3. Discussion and Future Research
4. Conclusions
Author Contributions
Funding
Institutional Review Board Statement
Informed Consent Statement
Acknowledgments
Conflicts of Interest
References
- Li, H.; Zhang, X.; Chen, X.; Lu, W. Soil and Water Conservation Strategies on the Red and Yellow Soils of South China. In Proceedings of the 10th International Soil Conservation Organization Meeting, West Lafayette, IN, USA, 24–29 May 1999 2001; pp. 165–170. [Google Scholar]
- Qiguo, Z. Red soils of hilly region in china: Ecological environment and strategies for integrated development. Red Lateritic Soils 1998, 2, 53. [Google Scholar]
- Wang, X. Analysis of agricultural development planning in low hilly red soil region based on planting structure. Appl. Ecol. Environ. Res. 2019, 17, 8395–8415. [Google Scholar] [CrossRef]
- Nyamekye, C.; Thiel, M.; Schönbrodt-Stitt, S.; Zoungrana, B.J.-B.; Amekudzi, L.K. Soil and water conservation in Burkina Faso, West Africa. Sustainability 2018, 10, 3182. [Google Scholar] [CrossRef] [Green Version]
- Cord, A.F.; Bartkowski, B.; Beckmann, M.; Dittrich, A.; Hermans-Neumann, K.; Kaim, A.; Lienhoop, N.; Locher-Krause, K.; Priess, J.; Schröter-Schlaack, C.; et al. Towards systematic analyses of ecosystem service trade-offs and synergies: Main concepts, methods and the road ahead. Ecosyst. Serv. 2017, 28, 264–272. [Google Scholar] [CrossRef]
- Palm, C.; Blanco-Canqui, H.; DeClerck, F.; Gatere, L.; Grace, P. Conservation agriculture and ecosystem services: An overview. Agric. Ecosyst. Environ. 2014, 187, 87–105. [Google Scholar] [CrossRef] [Green Version]
- Millennium Ecosystem Assessment. Ecosystems and Human Well-Being; Island Press: Washington, DC, USA, 2005; Volume 5. [Google Scholar]
- Farber, S.; Costanza, R.; Childers, D.L.; Erickson, J.; Gross, K.; Grove, M.; Hopkinson, C.S.; Kahn, J.; Pincetl, S.; Troy, A. Linking ecology and economics for ecosystem management. Bioscience 2006, 56, 121–133. [Google Scholar] [CrossRef] [Green Version]
- Fagerholm, N.; Torralba, M.; Burgess, P.J.; Plieninger, T. A systematic map of ecosystem services assessments around European agroforestry. Ecol. Indic. 2016, 62, 47–65. [Google Scholar] [CrossRef]
- Turner, K.G.; Anderson, S.; Gonzales-Chang, M.; Costanza, R.; Courville, S.; Dalgaard, T.; Dominati, E.; Kubiszewski, I.; Ogilvy, S.; Porfirio, L.; et al. A review of methods, data, and models to assess changes in the value of ecosystem services from land degradation and restoration. Ecol. Model. 2016, 319, 190–207. [Google Scholar] [CrossRef]
- Luo, R.; Yang, S.; Zhou, Y.; Gao, P.; Zhang, T. Spatial Pattern Analysis of a Water-Related Ecosystem Service and Evaluation of the Grassland-Carrying Capacity of the Heihe River Basin under Land Use Change. Water 2021, 13, 2658. [Google Scholar] [CrossRef]
- Costanza, R. Ecosystem services: Multiple classification systems are needed. Biol. Conserv. 2008, 141, 350–352. [Google Scholar] [CrossRef]
- Bai, Y.; Jiang, B.; Alatalo, J.M.; Zhuang, C.; Wang, X.; Cui, L.; Xu, W. Impacts of land management on ecosystem service delivery in the Baiyangdian river basin. Environ. Earth Sci. 2016, 75, 258. [Google Scholar] [CrossRef]
- Peters, M.K.; Hemp, A.; Appelhans, T.; Becker, J.N.; Behler, C.; Classen, A.; Detsch, F.; Ensslin, A.; Ferger, S.W.; Frederiksen, S.B. Climate–land-use interactions shape tropical mountain biodiversity and ecosystem functions. Nature 2019, 568, 88–92. [Google Scholar] [CrossRef] [PubMed]
- Hao, F.; Lai, X.; Ouyang, W.; Xu, Y.; Wei, X.; Song, K. Effects of land use changes on the ecosystem service values of a reclamation farm in Northeast China. Environ. Manag. 2012, 50, 888–899. [Google Scholar] [CrossRef] [PubMed]
- Metzger, M.; Rounsevell, M.; Acosta-Michlik, L.; Leemans, R.; Schröter, D. The vulnerability of ecosystem services to land use change. Agric. Ecosyst. Environ. 2006, 114, 69–85. [Google Scholar] [CrossRef]
- Fu, B.; Zhang, L.; Xu, Z.; Zhao, Y.; Wei, Y.; Skinner, D. Ecosystem services in changing land use. J. Soils Sediments 2015, 15, 833–843. [Google Scholar] [CrossRef]
- Kremen, C.; Williams, N.M.; Aizen, M.A.; Gemmill-Herren, B.; LeBuhn, G.; Minckley, R.; Packer, L.; Potts, S.G.; Roulston, T.A.; Steffan-Dewenter, I. Pollination and other ecosystem services produced by mobile organisms: A conceptual framework for the effects of land-use change. Ecol. Lett. 2007, 10, 299–314. [Google Scholar] [CrossRef]
- Liu, Y.; Li, J.; Zhang, H. An ecosystem service valuation of land use change in Taiyuan City, China. Ecol. Model. 2012, 225, 127–132. [Google Scholar] [CrossRef]
- Gachene, C.K.K.; Nyawade, S.O.; Karanja, N.N. Soil and Water Conservation: An Overview. In Zero Hunger; Leal Filho, W., Azul, A.M., Brandli, L., Özuyar, P.G., Wall, T., Eds.; Springer International Publishing: Cham, Switzerland, 2020; pp. 810–823. [Google Scholar]
- Francesconi, W.; Srinivasan, R.; Pérez-Miñana, E.; Willcock, S.P.; Quintero, M. Using the Soil and Water Assessment Tool (SWAT) to model ecosystem services: A systematic review. J. Hydrol. 2016, 535, 625–636. [Google Scholar] [CrossRef]
- Bai, Y.; Ouyang, Z.; Zheng, H.; Li, X.; Zhuang, C.; Jiang, B. Modeling soil conservation, water conservation and their tradeoffs: A case study in Beijing. J. Environ. Sci. 2012, 24, 419–426. [Google Scholar] [CrossRef]
- Tallis, H.; Polasky, S. Mapping and valuing ecosystem services as an approach for conservation and natural-resource management. Ann. N. Y. Acad. Sci. 2009, 1162, 265–283. [Google Scholar] [CrossRef]
- Liu, J.; Li, J.; Qin, K.; Zhou, Z.; Yang, X.; Li, T. Changes in land-uses and ecosystem services under multi-scenarios simulation. Sci. Total Environ. 2017, 586, 522–526. [Google Scholar] [CrossRef] [PubMed]
- Fu, Q.; Hou, Y.; Wang, B.; Bi, X.; Li, B.; Zhang, X. Scenario analysis of ecosystem service changes and interactions in a mountain-oasis-desert system: A case study in Altay Prefecture, China. Sci. Rep. 2018, 8, 12939. [Google Scholar] [CrossRef] [PubMed]
- Hu, Y.; Peng, J.; Liu, Y.; Tian, L. Integrating ecosystem services trade-offs with paddy land-to-dry land decisions: A scenario approach in Erhai Lake Basin, southwest China. Sci. Total Environ. 2018, 625, 849–860. [Google Scholar] [CrossRef] [PubMed]
- Gong, J.; Liu, D.; Zhang, J.; Xie, Y.; Cao, E.; Li, H. Tradeoffs/synergies of multiple ecosystem services based on land use simulation in a mountain-basin area, western China. Ecol. Indic. 2019, 99, 283–293. [Google Scholar] [CrossRef]
- Peng, J.; Hu, X.; Wang, X.; Meersmans, J.; Liu, Y.; Qiu, S. Simulating the impact of Grain-for-Green Programme on ecosystem services trade-offs in Northwestern Yunnan, China. Ecosyst. Serv. 2019, 39, 100998. [Google Scholar] [CrossRef]
- Schipanski, M.E.; Barbercheck, M.; Douglas, M.R.; Finney, D.M.; Haider, K.; Kaye, J.P.; Kemanian, A.R.; Mortensen, D.A.; Ryan, M.R.; Tooker, J. A framework for evaluating ecosystem services provided by cover crops in agroecosystems. Agric. Syst. 2014, 125, 12–22. [Google Scholar] [CrossRef]
- Schulte, R.P.; Creamer, R.E.; Donnellan, T.; Farrelly, N.; Fealy, R.; O’Donoghue, C.; O’huallachain, D. Functional land management: A framework for managing soil-based ecosystem services for the sustainable intensification of agriculture. Environ. Sci. Policy 2014, 38, 45–58. [Google Scholar] [CrossRef] [Green Version]
- Sun, X.; Crittenden, J.C.; Li, F.; Lu, Z.; Dou, X. Urban expansion simulation and the spatio-temporal changes of ecosystem services, a case study in Atlanta Metropolitan area, USA. Sci. Total Environ. 2018, 622, 974–987. [Google Scholar] [CrossRef]
- Sun, X.; Lu, Z.; Li, F.; Crittenden, J.C. Analyzing spatio-temporal changes and trade-offs to support the supply of multiple ecosystem services in Beijing, China. Ecol. Indic. 2018, 94, 117–129. [Google Scholar] [CrossRef]
- Power, A.G. Ecosystem services and agriculture: Tradeoffs and synergies. Philos. Trans. R. Soc. B Biol. Sci. 2010, 365, 2959–2971. [Google Scholar] [CrossRef]
- Andrew, M.E.; Wulder, M.A.; Nelson, T.A.; Coops, N.C. Spatial data, analysis approaches, and information needs for spatial ecosystem service assessments: A review. GISci. Remote Sens. 2015, 52, 344–373. [Google Scholar] [CrossRef] [Green Version]
- Hu, X.; Li, Z.; Nie, X.; Wang, D.; Huang, J.; Deng, C.; Shi, L.; Wang, L.; Ning, K. Regionalization of Soil and Water conservation Aimed at ecosystem Services improvement. Sci. Rep. 2020, 10, 3469. [Google Scholar] [CrossRef] [PubMed] [Green Version]
- Haines-Young, R.; Potschin, M. Common international classification of ecosystem services (CICES, Version 4.1). Eur. Environ. Agency 2012, 33, 107. [Google Scholar]
- Frank, S.; Fürst, C.; Koschke, L.; Witt, A.; Makeschin, F. Assessment of landscape aesthetics—Validation of a landscape metrics-based assessment by visual estimation of the scenic beauty. Ecol. Indic. 2013, 32, 222–231. [Google Scholar] [CrossRef]
- Zhu, L.-J.; Liu, J.-Z.; Qin, C.-Z.; Zhu, A.-X. A modular and parallelized watershed modeling framework. Environ. Model. Softw. 2019, 122, 104526. [Google Scholar] [CrossRef]
- Qin, C.-Z.; Gao, H.-R.; Zhu, L.-J.; Zhu, A.-X.; Liu, J.-Z.; Wu, H. Spatial optimization of watershed best management practices based on slope position units. J. Soil Water Conserv. 2018, 73, 504–517. [Google Scholar] [CrossRef] [Green Version]
- Wu, H.; Zhu, A.-X.; Liu, J.-Z.; Liu, Y.; Jiang, J. Best Management Practices Optimization at Watershed Scale: Incorporating Spatial Topology among Fields. Water Resour. Manag. 2018, 32, 155–177. [Google Scholar] [CrossRef]
- Zhu, L.-J.; Qin, C.-Z.; Zhu, A.-X.; Liu, J.-Z.; Wu, H. Effects of different spatial configuration units for the spatial optimization of watershed best management practice scenarios. Water 2019, 11, 262. [Google Scholar] [CrossRef] [Green Version]
- Vaidya, O.S.; Kumar, S. Analytic hierarchy process: An overview of applications. Eur. J. Oper. Res. 2006, 169, 1–29. [Google Scholar] [CrossRef]
- Saaty, T.L. Decision making with the analytic hierarchy process. Int. J. Serv. Sci. 2008, 1, 83–98. [Google Scholar] [CrossRef] [Green Version]
- Tian, J.; Guo, S.; Deng, L.; Yin, J.; Pan, Z.; He, S.; Li, Q. Adaptive optimal allocation of water resources response to future water availability and water demand in the Han River basin, China. Sci. Rep. 2021, 11, 7879. [Google Scholar] [CrossRef] [PubMed]
- Wang, X.; Zhang, X.; Guo, X. Spatial-Temporal variation of soil fertility quality of Jiangxi province in the past 30 years. Jiangsu Agric. Sci. 2018, 46, 284–288. (In Chinese) [Google Scholar]
- Wang, J.; Tian, J.; Lu, X. Assessment of stream habitat quality in Naoli River Watershed, China. Acta Ecol. Sin. 2010, 20, 481–486. (In Chinese) [Google Scholar]
- Spellerberg, I.F. Shannon–Wiener Index. In Encyclopedia of Ecology; Jørgensen, S.E., Fath, B.D., Eds.; Academic Press: Oxford, UK, 2008; pp. 3249–3252. [Google Scholar]
- Sharp, R.; Tallis, H.; Ricketts, T.; Guerry, A.; Wood, S.A.; Chaplin-Kramer, R.; Nelson, E.; Ennaanay, D.; Wolny, S.; Olwero, N. InVEST User’s Guide; The Natural Capital Project: Stanford, CA, USA, 2014. [Google Scholar]
- McGarigal, K. FRAGSTATS: Spatial Pattern Analysis Program for Quantifying Landscape Structure; US Department of Agriculture, Forest Service, Pacific Northwest Research Station: Portland, OR, USA, 1995; Volume 351.
- Kishita, Y.; Hara, K.; Uwasu, M.; Umeda, Y. Research needs and challenges faced in supporting scenario design in sustainability science: A literature review. Sustain. Sci. 2016, 11, 331–347. [Google Scholar] [CrossRef]
- Momblanch, A.; Connor, J.D.; Crossman, N.D.; Paredes-Arquiola, J.; Andreu, J. Using ecosystem services to represent the environment in hydro-economic models. J. Hydrol. 2016, 538, 293–303. [Google Scholar] [CrossRef]
- Cardozo, E.G.; Muchavisoy, H.M.; Silva, H.R.; Zelarayán, M.L.C.; Leite, M.F.A.; Rousseau, G.X.; Gehring, C. Species richness increases income in agroforestry systems of east-ern Amazonia. Agrofor. Syst. 2015, 89, 901–916. [Google Scholar] [CrossRef]
- Losey, J.E.; Vaughan, M. The economic value of ecological services provided by insects. Bioscience 2006, 56, 311–323. [Google Scholar] [CrossRef] [Green Version]
- Lal, R. Soil conservation and ecosystem services. Int. Soil Water Conserv. Res. 2014, 2, 36–47. [Google Scholar] [CrossRef] [Green Version]
- Dunford, R.; Harrison, P.; Smith, A.; Dick, J.; Barton, D.N.; Martin-Lopez, B.; Kelemen, E.; Jacobs, S.; Saarikoski, H.; Turkelboom, F. Integrating methods for ecosystem service assessment: Experiences from real world situations. Ecosyst. Serv. 2018, 29, 499–514. [Google Scholar] [CrossRef] [Green Version]
- Sherman, J.; Gent, D.H. Concepts of sustainability, motivations for pest management ap-proaches, and implications for communicating change. Plant Dis. 2014, 98, 1024–1035. [Google Scholar] [CrossRef] [Green Version]


| Data Name | Description | Data Source |
|---|---|---|
| Precipitation | Time serial, daily | REDCP, http://www.resdc.cn (accessed on 26 February 2022) |
| DEM | Grid size: 30 m and 2 m | REDCP and data of UAV |
| Land use | Grid size: 30 m and 2 m | REDCP and data of UAV |
| Soil type | Grid size: 30 m | Harmonized World Soil Database |
| Soil properties | Soil particle size, total nitrogen, total phosphorus, total potassium and organic matter in soil | Laboratory measurements |
| Local species | Number of species and population of each specie in ecosystem | Field investigations |
| Hydrologic characteristics | Runoff and sediment records, time serial, daily | Hydrologic yearbook |
| ID | Indicators of ES | Associated Soil and Water Conservation Practices | Categories of ES |
|---|---|---|---|
| 1 | Sediment loss rate | AST, CHM, BF, HCD | Regulating service (REG) |
| 2 | Soil and water conservation rate | AST, CHM, BF, HCD | |
| 3 | Runoff regulation rate in rainy season | AST, CHM, BF, HCD | |
| 4 | Runoff regulation rate in dry season | AST, CHM, BF, HCD | |
| 5 | Soil fertility index | AST, CHM, HCD | |
| 6 | Aquatic habitat index | SR, BF | Supporting service (SUP) |
| 7 | Species richness index | CHM, BF, HCD | |
| 8 | Carbon sequestration index | AST, CHM, BF, HCD | |
| 9 | Forest and grass coverage | CHM, BF | |
| 10 | Area index | AST, CHM, BF, HCD, SR | Cultural service (CUL) |
| 11 | Shape index | AST, CHM, BF, HCD, SR | |
| 12 | Diversity index | AST, CHM, BF, HCD, SR | |
| 13 | Pond culture yield | SR | Provisioning service (PRO) |
| 14 | Orchard yield | AST |
| Practices ID | Cost of One-Time Investment | Cost of Annual Investment |
|---|---|---|
| 1 for AST | Terrace land preparation cost and fruit tree | Grass planting cost and fertilization cost |
| 2 for SR | Small reservoir construction cost | Fish fry cost |
| 3 for CHM | Seedling cost | Replant Seedling cost |
| 4 for BF | Seedling cost | Replant Seedling cost |
| 5 for HCD | Ditch excavation cost | Hedgerow planting cost |
| Year | 1 | 2 | 3 | 4 | 5 | 6 | 7 | 8 | 9 | 10 |
|---|---|---|---|---|---|---|---|---|---|---|
| Income | 0 | 0 | 0 | 5 | 7.4 | 9.9 | 14.9 | 17.3 | 19.8 | 24.8 |
| Scenarios | S0 (Baseline) | S1 (Conservation) | S2 (Economic) | S3 (Balanced) |
|---|---|---|---|---|
| ES scores | 53 | 81 | 71 | 82 |
| Total cost over 10 years (million CNY) | 1.35 | 5.44 | 6.30 | 5.87 |
| Total income over 10 years (million CNY) | 5.03 | 7.98 | 12.66 | 10.60 |
| Net income over 10 years (million CNY) | 3.68 | 2.54 | 6.36 | 4.73 |
| Income:cost ratio, (N) | N = 3.7 | N = 1.5 | N = 2.0 | N = 1.8 |
Publisher’s Note: MDPI stays neutral with regard to jurisdictional claims in published maps and institutional affiliations. |
© 2022 by the authors. Licensee MDPI, Basel, Switzerland. This article is an open access article distributed under the terms and conditions of the Creative Commons Attribution (CC BY) license (https://creativecommons.org/licenses/by/4.0/).
Share and Cite
Wu, H.; Sun, L.; Liu, Z. Ecosystem Service Assessment of Soil and Water Conservation Based on Scenario Analysis in a Hilly Red-Soil Catchment of Southern China. Water 2022, 14, 1284. https://doi.org/10.3390/w14081284
Wu H, Sun L, Liu Z. Ecosystem Service Assessment of Soil and Water Conservation Based on Scenario Analysis in a Hilly Red-Soil Catchment of Southern China. Water. 2022; 14(8):1284. https://doi.org/10.3390/w14081284
Chicago/Turabian StyleWu, Hui, Liying Sun, and Zhe Liu. 2022. "Ecosystem Service Assessment of Soil and Water Conservation Based on Scenario Analysis in a Hilly Red-Soil Catchment of Southern China" Water 14, no. 8: 1284. https://doi.org/10.3390/w14081284
APA StyleWu, H., Sun, L., & Liu, Z. (2022). Ecosystem Service Assessment of Soil and Water Conservation Based on Scenario Analysis in a Hilly Red-Soil Catchment of Southern China. Water, 14(8), 1284. https://doi.org/10.3390/w14081284