Article

Peak Spring Flood Discharge Magnitude and Timing in Natural Rivers across Northern Finland: Long-Term Variability, Trends, and Links to Climate Teleconnections

1
Water, Energy and Environmental Engineering Research Unit, Faculty of Technology, University of Oulu, 90014 Oulu, Finland
2
IHE Delft Institute for Water Education, 2611 AX Delft, The Netherlands
3
Department of Water Engineering, Faculty of Agriculture, University of Tabriz, Tabriz 5166616471, Iran
4
Department of Geography, Ferdowsi University of Mashhad, Mashhad 9177948974, Iran
5
Geographic Information Science/System and Remote Sensing Laboratory (GISSRS: Lab), Ferdowsi University of Mashhad, Mashhad 9177948974, Iran
6
WSP USA, Portland, OR 97204, USA
*
Author to whom correspondence should be addressed.
Water 2022, 14(8), 1312; https://doi.org/10.3390/w14081312
Submission received: 22 March 2022 / Revised: 12 April 2022 / Accepted: 13 April 2022 / Published: 18 April 2022
(This article belongs to the Special Issue River Flow in Cold Climate Environments)

Abstract

:
In northern regions, like Finland, peak river discharge is principally controlled by maximum snowmelt runoff during spring (March–May). Global warming and climate change extensively influence both the quantity and temporal characteristics of peak discharge in northern rivers by altering snowpack accumulation and melt processes. This study analyzed peak spring flood discharge (PSFD) magnitude (PSFDM) and timing (PSFDT) in four natural rivers (Simojoki, Kuivajoki, Kiiminkijoki, and Temmesjoki) across northern Finland, in terms of long-term (1967–2011) variability, trends, and links to large-scale climate teleconnections. The PSFDM significantly (p < 0.05) declined in the Simojoki, Kuivajoki, and Kiiminkijoki rivers over time. Both the Simojoki and Kuivajoki rivers also experienced significant decreasing trends of about −0.33 and −0.3 (days year−1), respectively, in the PSFDT during 1967–2011. In these two rivers, the less and earlier PSFDs were principally attributable to the warmer spring seasons positively correlated with the North Atlantic Oscillation (NAO) in recent decades. Moreover, daily precipitation time series corresponding to the PSFD events showed no considerable effects on PSFDM and PSFDT changes in all the natural rivers studied. This suggests that less and earlier historical PSFDs in natural rivers at higher latitudes in northern Finland were primarily induced by warmer springtime temperatures influencing snowpack dynamics.

1. Introduction

Global surface air temperature (SAT) was about 1.1 °C warmer during 2011–2020 than 1850–1900 [1]. In particular, the highest rate of mean SAT increases was found over the high latitudes of the Northern Hemisphere [1]. Such warming trends resulted primarily from extensive increases in the atmospheric concentrations of greenhouse gas emissions (GHG), significantly changing the climate system of our planet [1,2]. This unequivocal, continuing climate change has already affected the availability of water resources on Earth by prominently altering different hydrological cycle processes [1,3,4]. Understanding and assessment of historical variability and trends in such processes have received considerable attention in recent studies about climate change, water resources, and environmental protection on both regional and global scales [5,6,7].
Snowpack is a natural freshwater reservoir that plays an important role in the climate dynamics (albedo), hydrological cycle, ecosystem services, and human primary activities (e.g., agriculture, irrigation, energy, forestry, and recreation) in Nordic regions, including Finland [8]. Water is normally stored in the snowpack during winter and gradually releases into rivers through the spring and/or early summer as snowmelt [9]. Such snowpack meltwater runoff often produces the major volume of annual flow in northern rivers and controls their peak spring flood discharge (PSFD) [10]. Hence, at high latitudes, one of the critical global warming impacts on water resources is extensive alterations in the flow of rivers in response to changes in different snowmelt runoff characteristics, in terms of quantity and timing [11]. Increases in SAT would decrease the number of wintertime cold days, resulting in less snowfall and/or more rainfall [12], thereby reducing snowpack accumulation on the ground [13]. A warmer SAT would also intensify the wintertime snowmelt rate, declining the depth and extent of accumulated snowpack [12,14]. All these changes can principally decrease the water content of snowpack, reduce snowmelt runoff, and result consequently in less and earlier PSFD in northern rivers [8,13]. Accordingly, more frequent wintertime floods [15,16], a decline in springtime groundwater level, less summertime baseflow, and a higher level of summertime drought risk [17] are expected and already foreseen. On the other hand, however, intensive snowfall because of more wintertime precipitation can deliver adequate snowpack accumulation and offset the climate warming impacts [18]. Hence, changes in PSFD magnitude (PSFDM) and timing (PSFDT) are mainly dependent on snowpack hydrological processes controlled by both precipitation and SAT patterns [19].
In general, variations in regional climatic conditions (particularly precipitation and SAT) are controlled by large-scale oceanic-atmospheric circulation patterns, e.g., the Arctic Oscillation [20]. These patterns are defined as insistent, recurring, and broad modes of atmospheric pressure anomalies describing the dominant airflow across a large geographical area [21]. They also reveal the durable variability in the natural incidence of chaotic comportments in the climate system of Earth [20]. The power and effects of such patterns over a particular region during a specific period of the year are commonly expressed by numerical teleconnection indices (hereafter climate teleconnections). Many previous studies have already reviewed the main characteristics and descriptions of these climate teleconnections (e.g., [20]) and their relationships with precipitation, SAT, snowpack dynamics, and river discharge in different parts of the world (e.g., [22,23,24,25,26,27]), including Finland (e.g., [28,29,30,31,32]). Although a few studies have previously focused on the relationships of shifts in snowmelt-dominated river discharge regimes with climate teleconnections (e.g., [26,33]), understanding their role in historical variability and trends in PSFDM and PSFDT in northern rivers, particularly in Finland, is still lacking.
The overall aim of the present study was to investigate changes in both PSFDM and PSFDT in four natural rivers across northern Finland during 1967–2011 in relation to climate teleconnections. The specific objectives were to: (1) analyze long-term variability and trends in PSFDM and PSFDT in northern Finland’s natural rivers; (2) measure relationships of such alterations in PSFDM and PSFDT with influential climate teleconnections; and (3) assess the impacts of changes in climatic conditions (precipitation and SAT) on both PSFDM and PSFDT in natural rivers across northern Finland. According to [34], such observational-based studies improve our understanding of historical variability and changes in the discharge regime of northern rivers, leading boreal climate regions on Earth towards attaining water security and consequently achieving the 2030 Agenda for Sustainable Development adopted by all countries of the United Nations (UN) in 2015 [35].

2. Materials and Methods

2.1. Study Area

Finland extends ~1320 km in the south–north direction throughout northern Europe (Figure 1a). The Köppen–Trewartha (K–T) climate classification system characterized this country as a temperate or boreal environment [36]. Hence, the climate in Finland is predominantly influenced by the Arctic Ocean, the Atlantic Ocean, the Baltic Sea, continental Eurasia, the Scandinavian Mountain range, and the latitudinal gradient [37]. In this country, both annual precipitation and mean SAT naturally decrease from south to north [38,39], while annual snow depth and cover days increase [14]. On a national scale, springtime (March–May) precipitation and mean SAT are generally about 99.8 mm and 0.8 °C, respectively [38,39]. Furthermore, the snow cover days are less (more) than 130 (205) in the southern (northern) areas of Finland [40].
For this study, we selected four natural or unregulated rivers across northern Finland [41]: Simojoki, Kuivajoki, Kiiminkijoki, and Temmesjoki (Figure 1b). According to [42], Finnish river systems are divided into three groups based on their discharge regime. Hence, the River Temmesjoki with an area of about 1181 km2 belongs to the third group that comprises small and medium-sized river basins with only a few lakes. The river basins in this group are particularly located in the coastal regions of the Gulf of Bothnia and the Gulf of Finland. The second group, however, comprises different large rivers in northern Finland, such as the Simojoki, Kuivajoki, and Kiiminkijoki river basins with an area of ~3160, 1356, and 3814 km2, respectively. The first group covers the watersheds of lake regions throughout central and southern Finland, where the large storage capacity flattens seasonal discharge variability. Additionally, the rivers in this group are strongly regulated for flood protection and energy production usage [43]. Thus, no rivers from the first group were selected for this study.

2.2. Data Description

Long-term (1967–2011) daily discharge time series for the natural rivers of Simojoki, Kuivajoki, Kiiminkijoki, and Temmesjoki across northern Finland were collected from the Finnish Environment Institute (SYKE) (https://www.syke.fi/en-US/Services (accessed on 10 December 2021)). During the study period (1967–2011), there were no missing values in the daily discharge time series for any of the natural rivers studied. According to the current understanding of influential large-scale oceanic-atmospheric circulation patterns for regional climate variability across Finland [38,39,44], this study also selected seven different teleconnection indices (Nos. 1–7 in Table 1). The monthly time series (1967–2011) for these climate teleconnections were obtained from the website of the Climate Prediction Center (CPC) at the National Oceanic and Atmospheric Administration (NOAA), Washington, WA, USA, openly available at https://www.cpc.ncep.noaa.gov/data/teledoc/telecontents.shtml (accessed on 10 December 2021). The main components and characteristics of these teleconnections and their natural effects on regional climate variability around the world were comprehensively reviewed by [20]. Additionally, we obtained daily gridded (10 × 10 km2) precipitation and mean SAT datasets throughout the natural rivers selected across northern Finland for the years from 1967 to 2011 (Figure 1c) from the PaITuli-Spatial Data for Research and Teaching, the CSC IT Centre for Science Ltd. (https://www.csc.fi/en/home (accessed on 10 December 2021)). More details about such gridded precipitation and mean SAT time series can be found in the studies by [45] and [46], respectively.

2.3. Statistical Analyses

The Mann–Kendall (MK) non-parametric test [52] is generally used to detect statistically significant (p < 0.05) trends in hydrometeorological time series. To estimate the slope of such significant trends, the Sen’s method [53] is commonly applied. The Spearman’s rank correlation (rho) is preferably employed to measure the relationships of hydrometeorological time series with different climate teleconnections [54]. This is mainly attributable to the fact that the rho, unlike the Pearson’s correlation coefficient (r), assigns no specific distribution functions for hydrometeorological time series [54]. In the existence of positive autocorrelation in hydrometeorological time series, however, the use of the trend-free pre-whitening (TFPW) method [55] is recommended to determine statistically significant trends, and the residual bootstrap (RB) approach [56] with 5000 independent replications to examine the standard deviation of the rho. Accordingly, this study employed such statistical methods for investigating historical (1967–2011) PSFDM and PSFDT in four natural rivers across northern Finland and their links with the climate teleconnections. In this study, PSFDM and PSFDT are referred to the maximum daily discharge value and its date (calendar-based day) in natural rivers across northern Finland during the spring (March–May) season of each year. For different climate teleconnections, then, spring (March–May) season time series were computed using their monthly datasets. Furthermore, seasonal mean SAT (°C) for spring (March–May) and daily precipitation corresponding to PSFDT were computed on the basin-scale of four natural rivers studied across northern Finland using daily gridded (10 × 10 km2) hydrometeorological datasets obtained from the CSC-IT Center for Science (https://www.csc.fi/en/home (accessed on 10 December 2021)).

3. Results

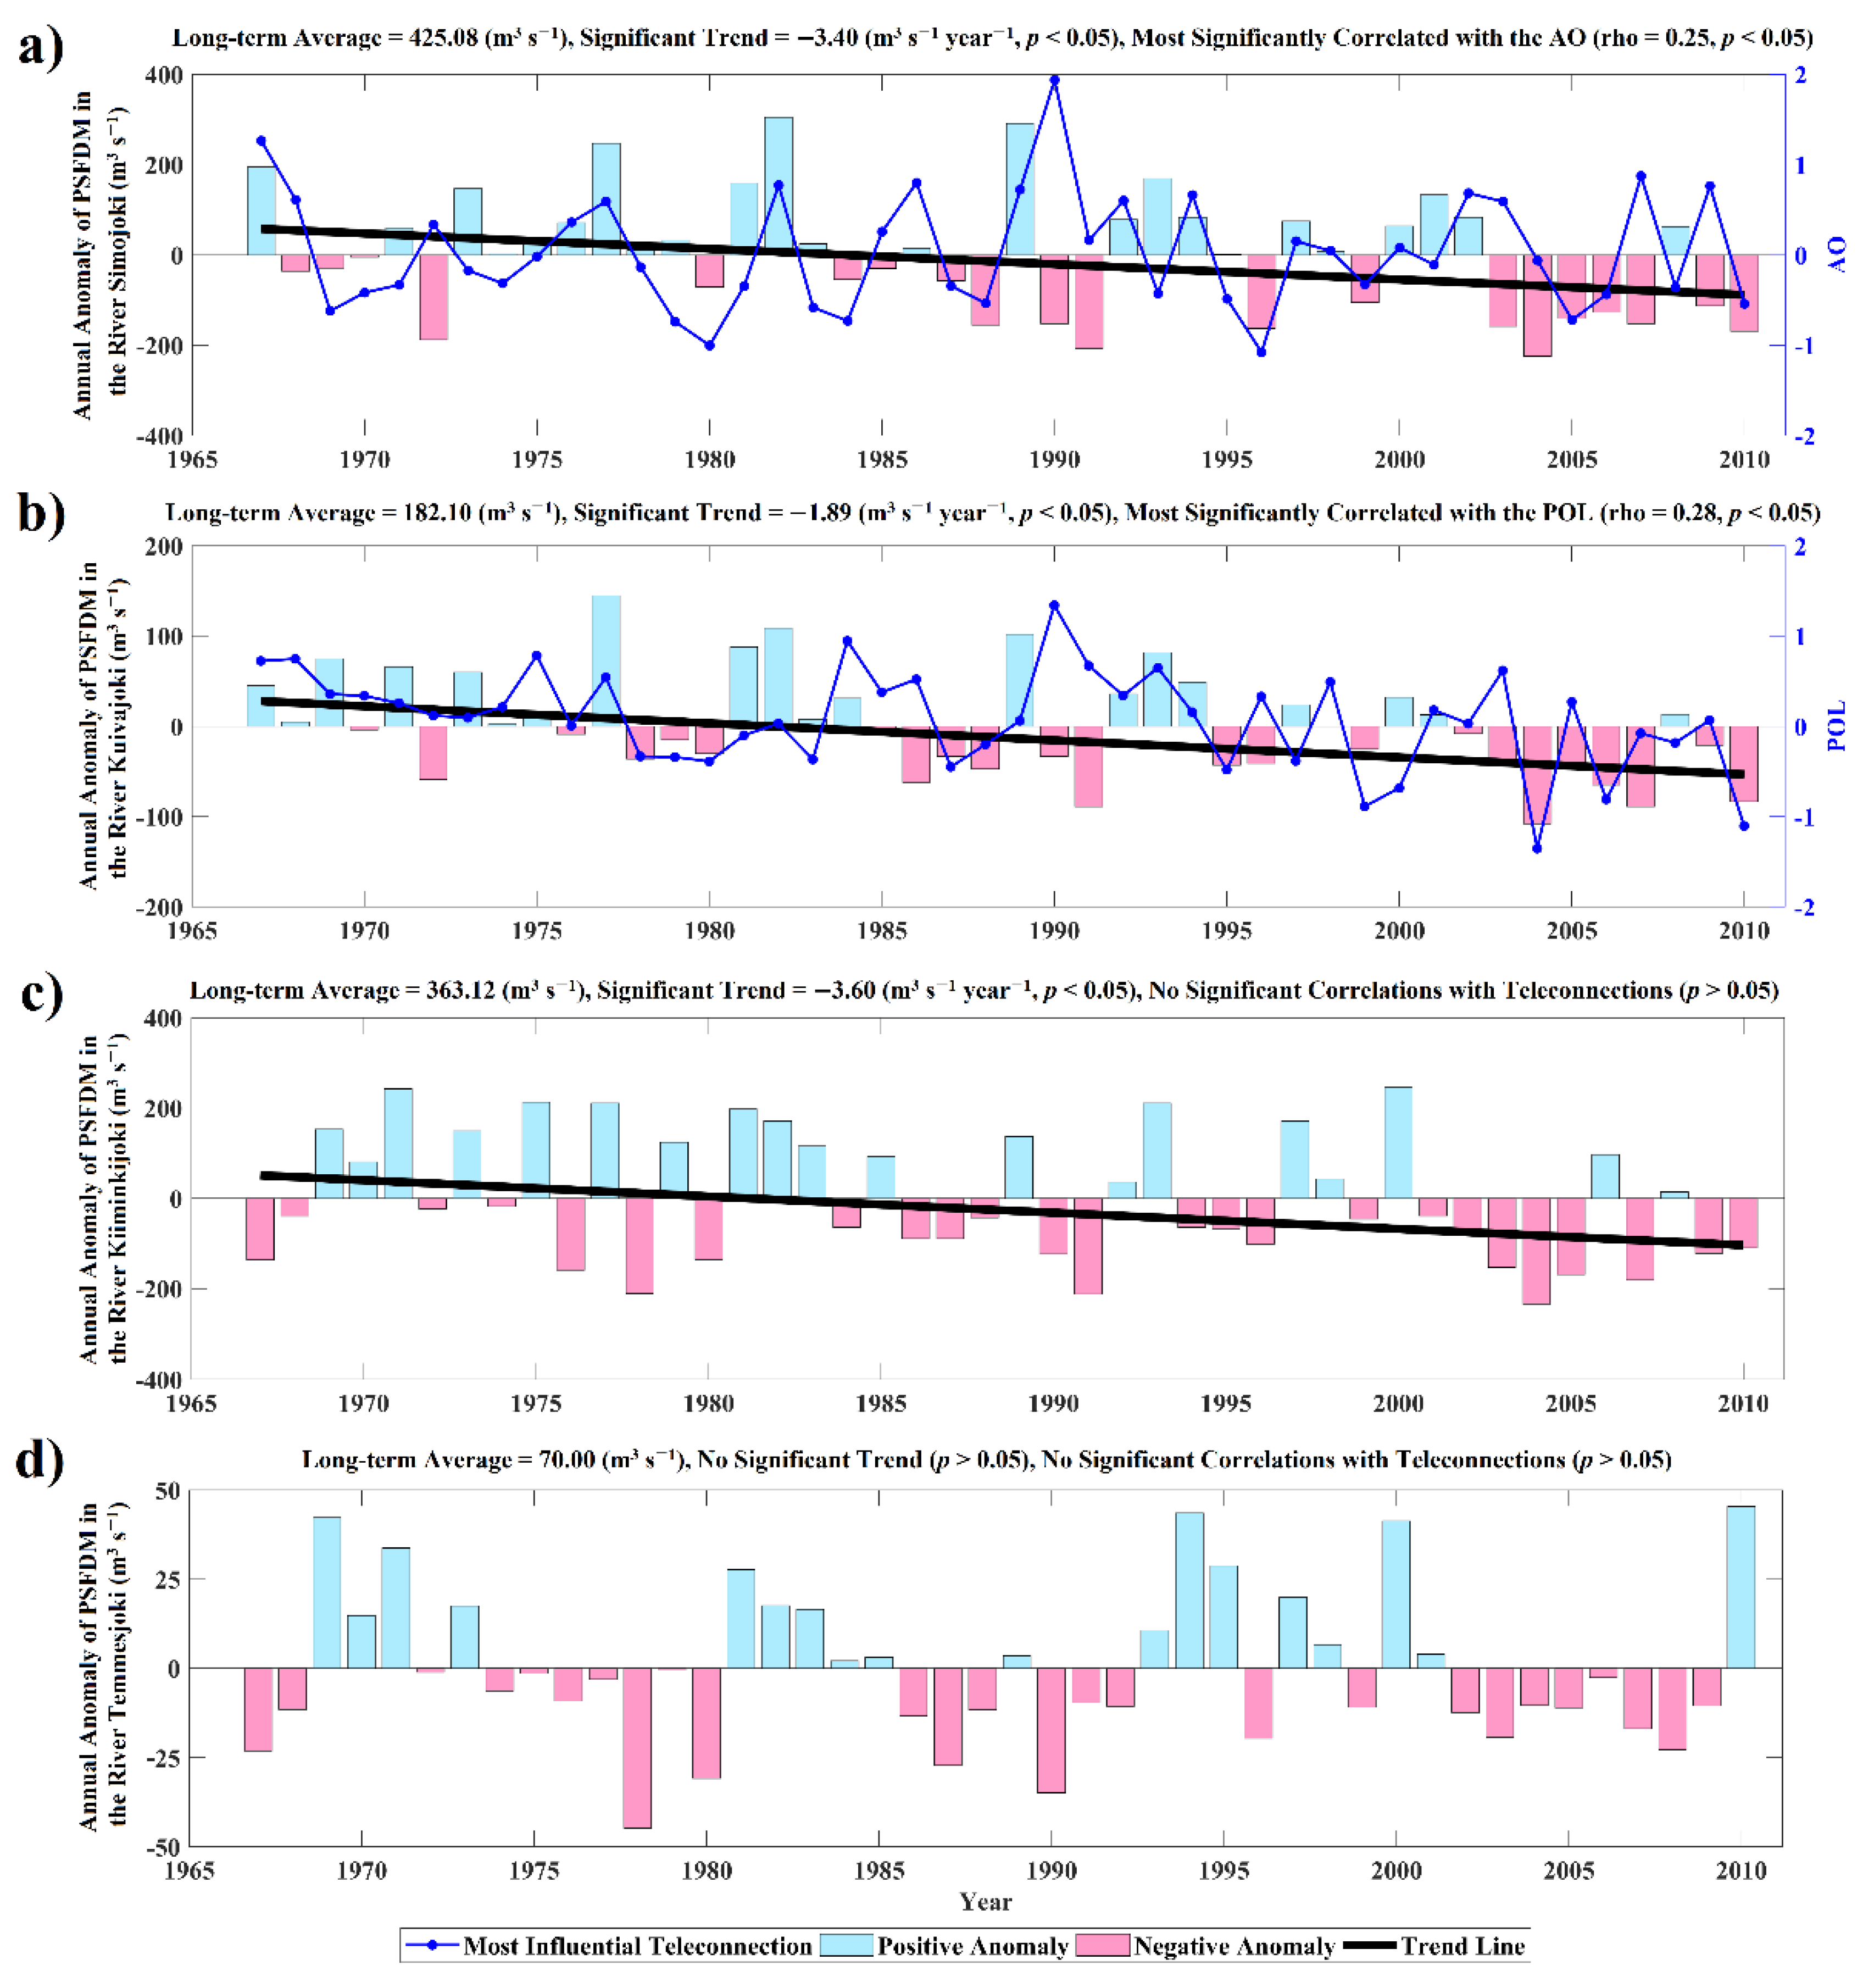
PSFDM generally declined in natural rivers studied across northern Finland in recent decades. Statistically significant (p < 0.05) decreasing trends of −3.40, −1.89, and −3.60 (m3 s−1 year−1) were found in the PSFDM of Simojoki, Kuivajoki, and Kiiminkijoki rivers during 1967–2011, respectively (Figure 2a–c). All three rivers showed the lowest PSFDM of ~201 (Simijoki), 74 (Kuivajoki), and 142 m3 s−1 (Kiiminkijoki) in 2004 (Figure 2a–c). In northern Finland, all the natural rivers mostly experienced below-average PSFDMs after 2000 (Figure 2). In the River Temmesjoki, however, the highest PSFDM (~115 m3 s−1) was observed in 2011 (Figure 2d). The historical variations in the PSFDM time series for the Simojoki and Kuivajoki rivers showed the most significant (p < 0.05) correlations with the springtime AO (rho = 0.25) and POL (rho = 0.28) patterns, respectively (Figure 2a,b). However, there were no clear relationships between different springtime climate teleconnections and the PSFDM variability in the Kiiminkijoki and Temmesjoki rivers (Figure 2c,d).
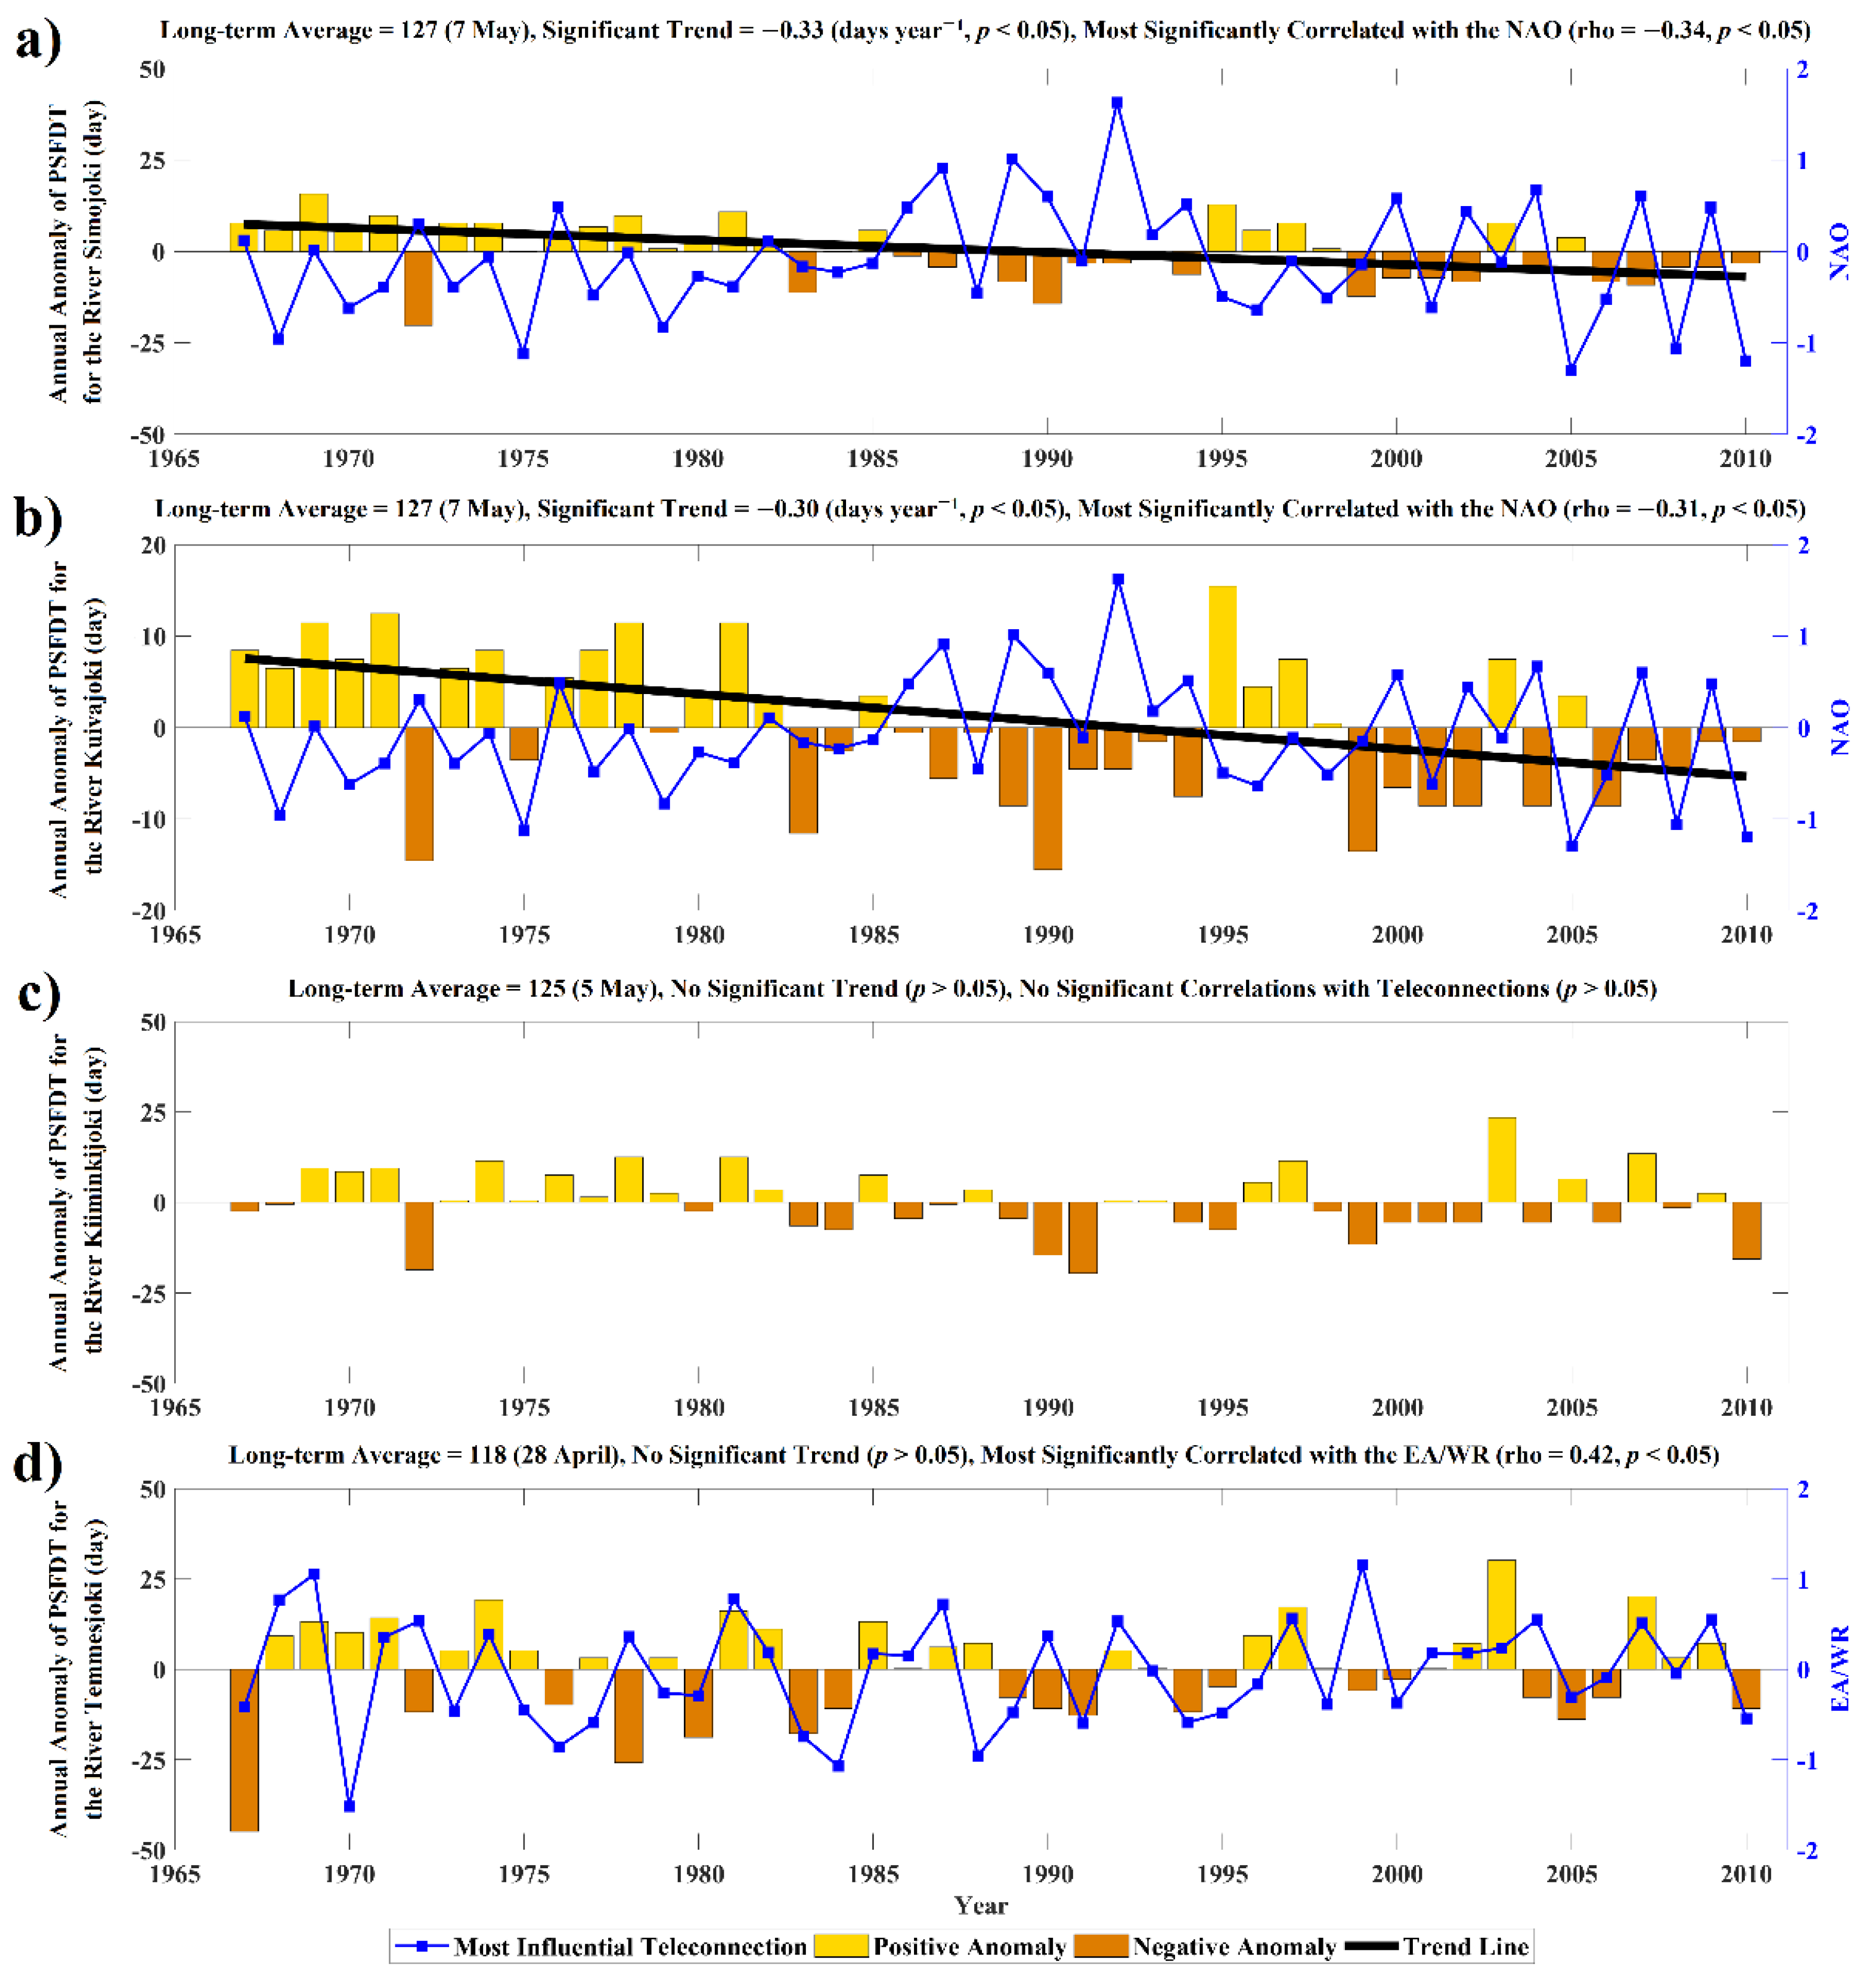
Both Simojoki and Kuivajoki rivers experienced earlier PSFD in recent decades. The statistically significant decreasing trends in the PSFDT were about −0.33 and −0.3 (days year−1) for the Simojoki and Kuivajoki rivers during 1967–2011, respectively (Figure 3a,b). In these two rivers, the PSFDTs have generally shifted towards being earlier in the year since the early 1980s (Figure 3a,b). However, the substantially later PSFDTs were seen in the years 1995–1997. Moreover, the PSFDT was generally around the 7th of May in both Simojoki and Kuivajoki rivers (Figure 3a,b). Although there was no clear trend in the historical PSFDTs time series of the River Kiiminkijoki, earlier PSFDs than the normal PSFDT (5 May) were mostly seen during 1983–2011 (Figure 3c). Similar to the River Kiiminkijoki, the River Temmesjoki experienced the latest PSFD on the 28th of May 2003 (Figure 3c,d). The historical PSFDT time series for the River Temmesjoki showed the most significant relationship with the springtime EA/WR pattern (rho = 0.42) (Figure 3d), while this was found for both the Simojoki (rho = −0.34) and Kuivajoki (rho = −0.31) rivers with the springtime NAO (Figure 3a,b). There were also significant correlations between the springtime EA pattern and the PSFDT time series for the Simojoki (rho = −0.31) and Kuivajoki (rho = −0.29) rivers (Figure 4).
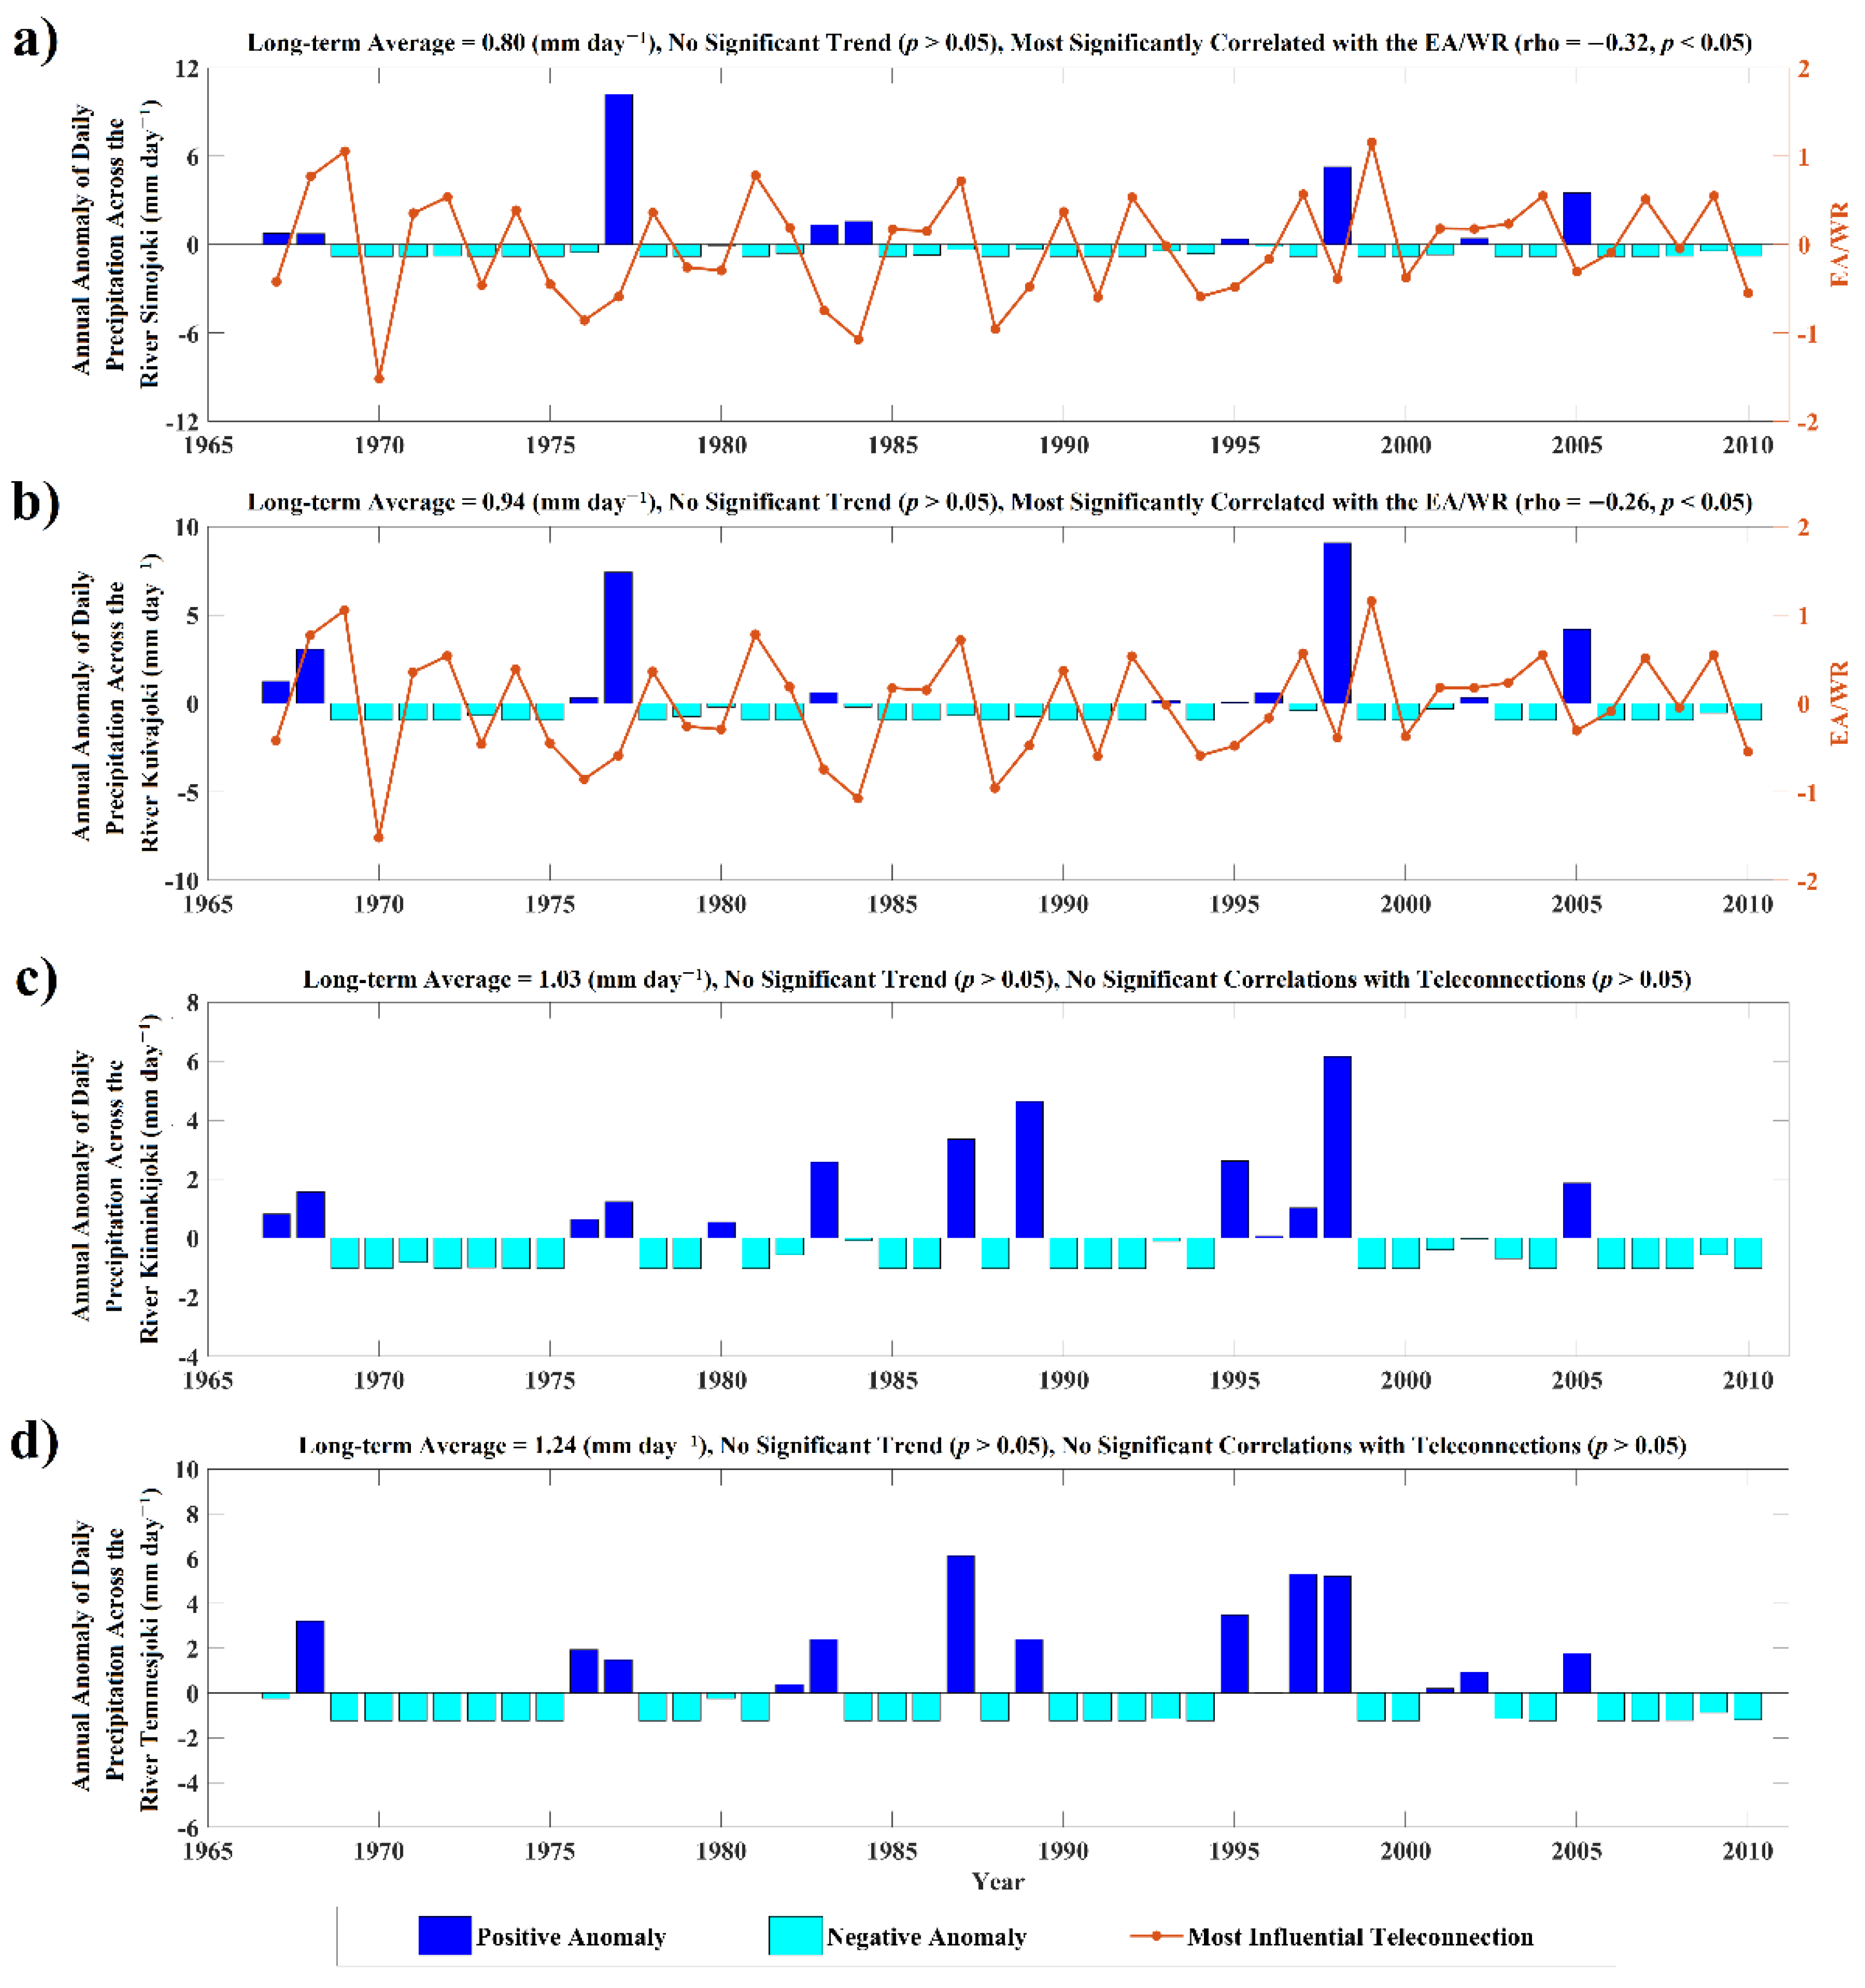
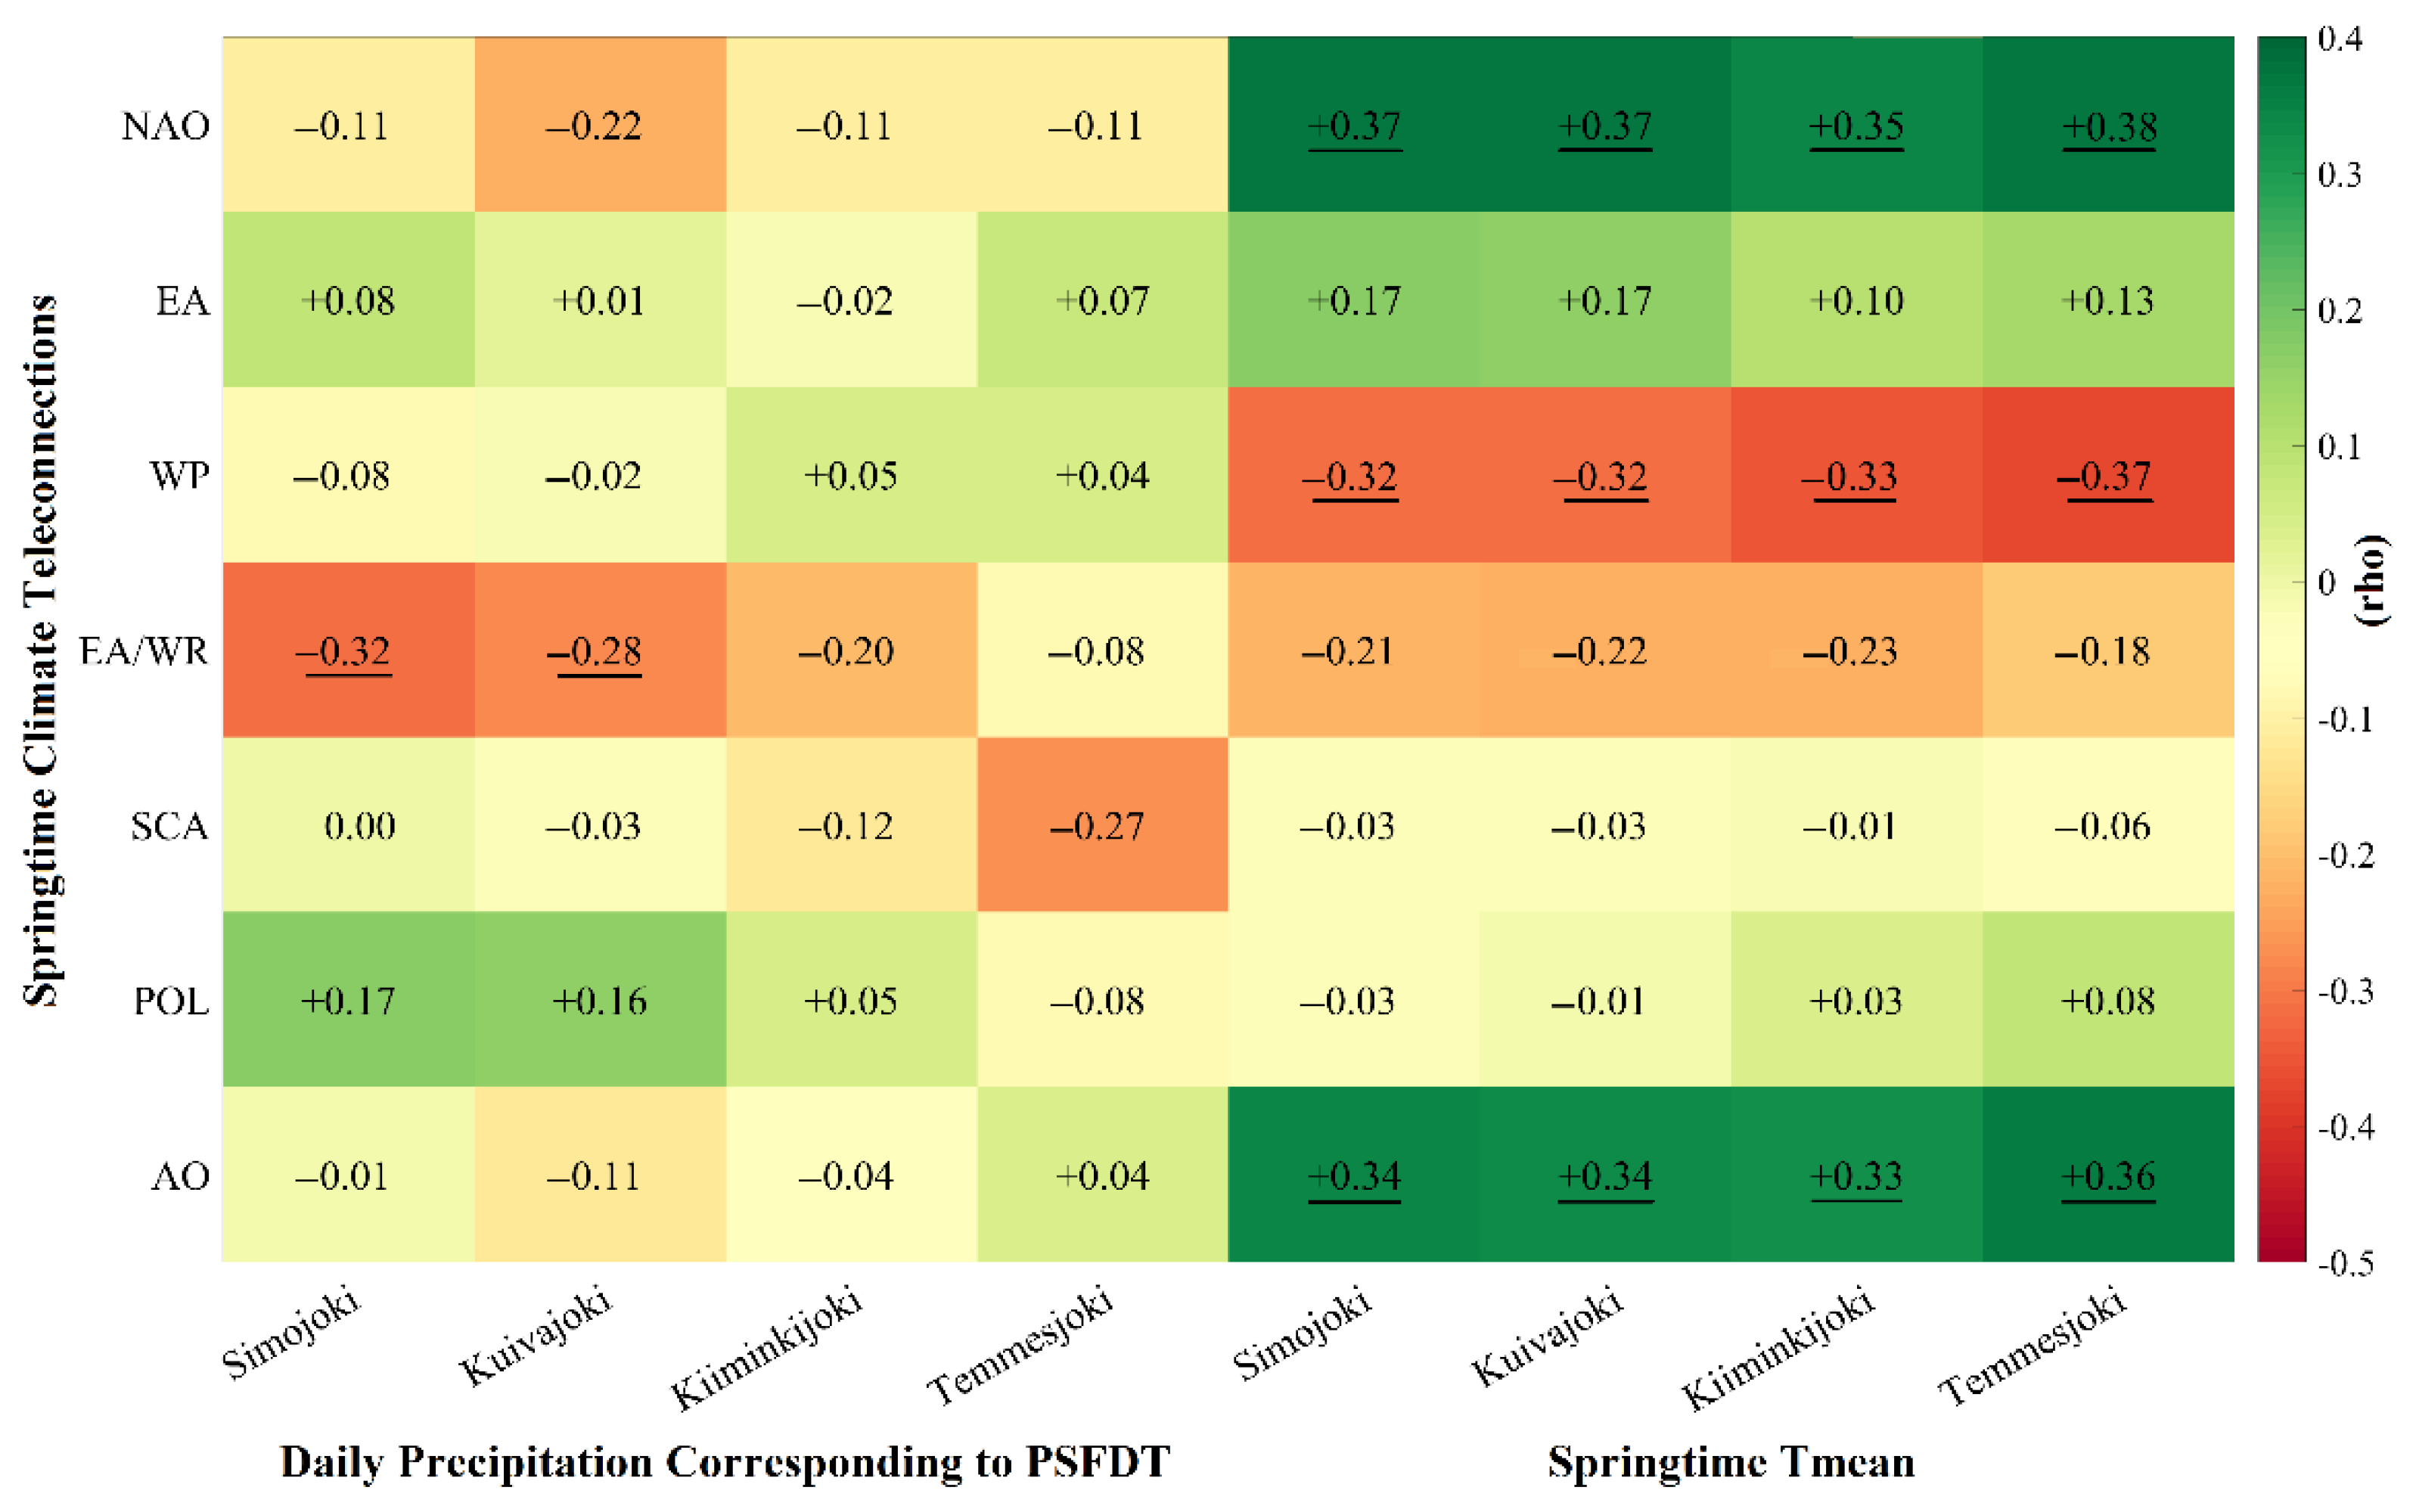
No statistically significant trends were found in daily precipitation during the PSFDT in the natural rivers studied across northern Finland during 1967–2011 (Figure 5). The days corresponding to the PSFD in all these rivers were mostly below-average of their daily precipitation amounts after the year 2000 (Figure 5). The long-term (1967–2011) average values for such daily precipitation time series naturally increased from the north to the south of Finland: Simojoki (0.80 mm), Kuivajoki (0.94 mm), Kiiminkijoki (1.03 mm), and Temmesjoki 1.25 (mm) (Figure 5). The daily precipitation time series corresponding to the PSFD showed most significant correlations with the springtime EA/WR pattern in both the Simojoki (rho = −0.32) and the Kuivajoki (rho = −0.26) rivers (Figure 5a,b), but no clear (p > 0.05) relationships with the other two rivers (Kiiminkijoki and Temmesjoki) (Figure 5c,d).
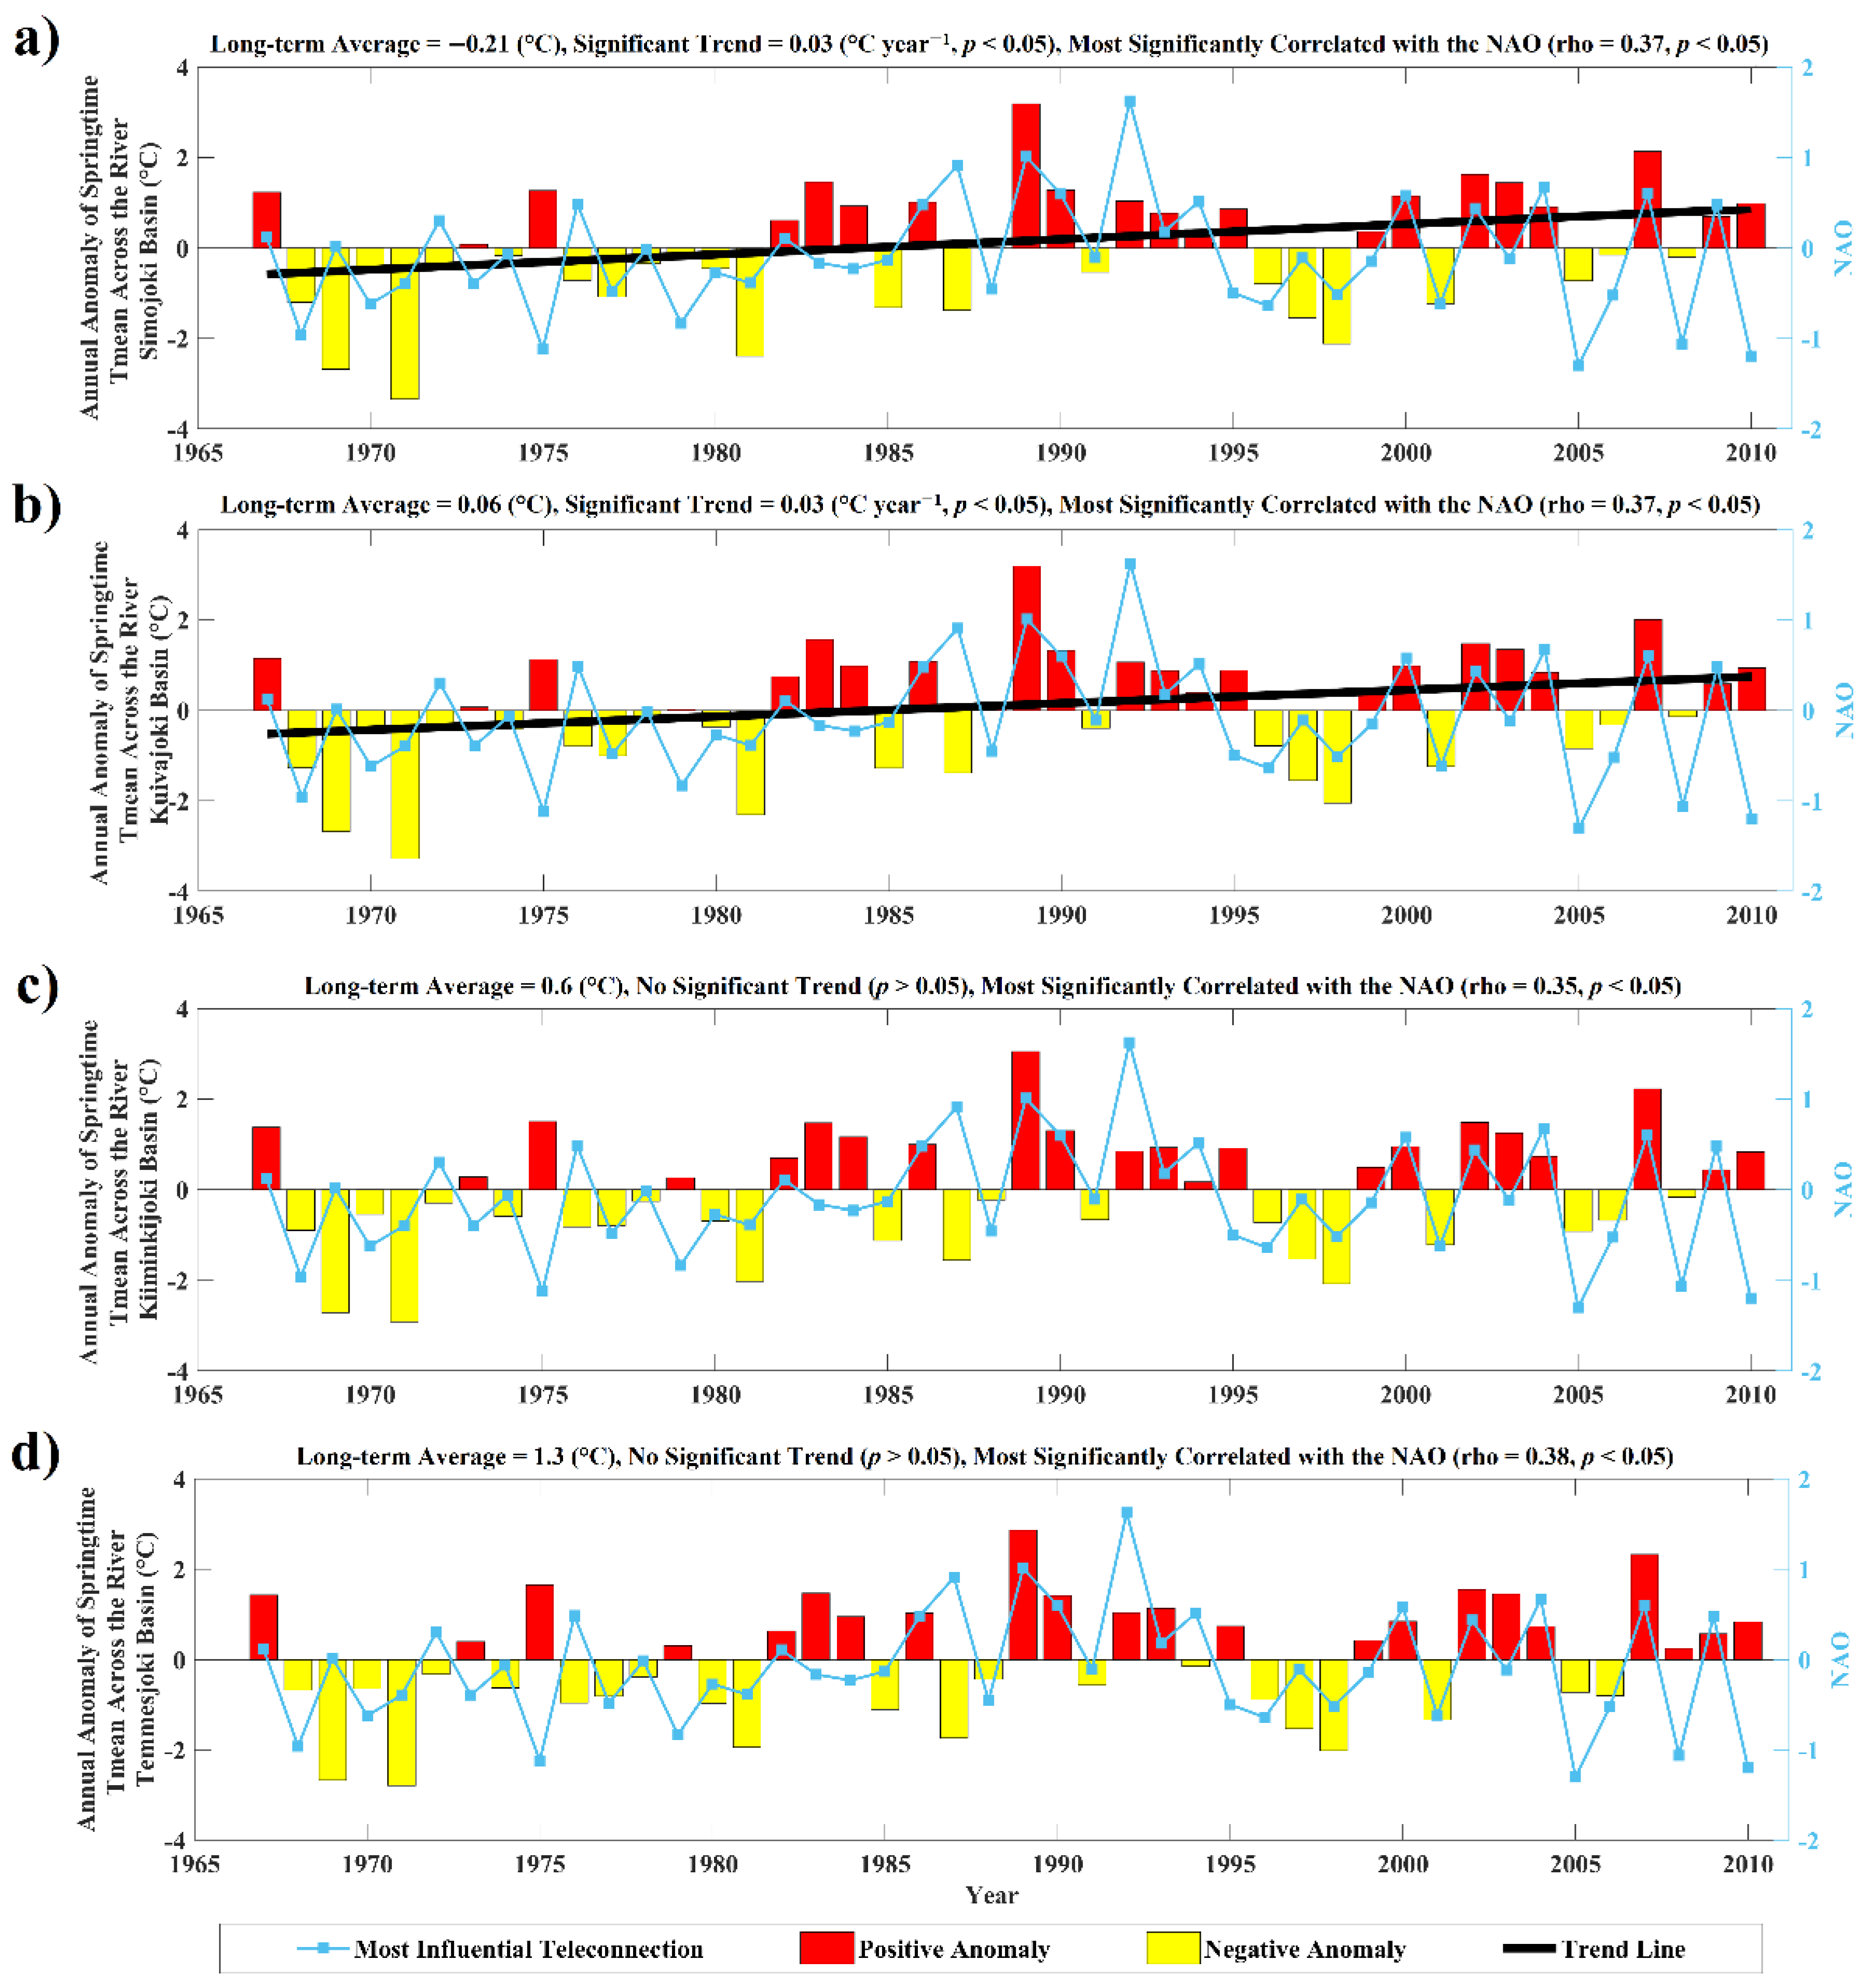
On the basin scale, the spring mean temperature (Tmean) significantly increased in both Simojoki and Kuivajoki rivers during 1967–2011, at a rate of 0.30 (°C year−1) (Figure 6a,b). The long-term average values for such spring Tmean time series increased from the north to the south of Finland: −0.21 °C (Simojoki), 0.06 °C (Kuivajoki), 0.60 °C (Kiiminkijoki), and 1.3 °C (Temmesjoki) (Figure 6). For all river basins, the warmest and coldest spring Tmean were observed in 1989 and 1971, respectively (Figure 6). From the early 1980s, all these river basins mostly experienced more years with above-average spring Tmean (Figure 6). The variations in the spring Tmean time series for the Simojoki, Kuivajoki, Kiiminkijoki, and Temmesjoki rivers showed the most significant relationships with the NAO, rho = 0.35–0.38 (Figure 6). Both AO and WP were also influential climate teleconnections for spring Tmean variability across all the natural rivers studied across northern Finland (Figure 7).
The correlations of PSFDMs in the Simojoki and the Kuivajoki (rho = 0.84) were stronger than in the Kuivajoki and the Kiiminkijoki (rho = 0.72) as well as in the Kiiminkijoki and the Temmesjoki (rho = 0.64) (Figure 8). Similar relationships were found in the PSFDTs of natural rivers studied across northern Finland, with rho = 0.67–0.97 (Figure 8). The Kiiminkijoki and the Temmesjoki showed the highest correlation (rho = +0.92) between daily precipitation time series corresponding to the PSFDTs (Figure 8). Spring Tmean variability was strongly similar over the basin of all the natural rivers studied, with rho = 0.97–0.99 (Figure 8). The negative effects of spring Tmean were stronger on the PSFDT in the Simojoki (rho = −0.48) and the Kuivajoki (rho = −0.45) rivers than in the Kiiminkijoki (rho = −0.34) and Temmesjoki (rho = −0.26) rivers (Figure 8).

4. Discussion

4.1. Peak Spring Flood Discharge Magnitude and Timing

Substantial alterations in river flow regime, particularly seasonality shift, are among the main hydrological responses to climate change in cold regions [57]. This study found statistically significant decreasing trends in both PSFDM and PSFDT in the natural rivers of Simojoki and Kuivajoki across northern Finland during 1967–2011. Analyzing long-term (1912–2004) observational river flow records, [42] similarly reported that PSFDT has shifted towards occurring earlier in northern Finland, where the PSFD is generally controlled by snowmelt runoff. There are also other studies reporting less and earlier snowmelt runoff in different cold climate zones around the world, e.g., western North America [27], the Japanese Alps region [58], the Russian Arctic [59], and Lithuania [60]. Likewise, for northern Finland, [19] concluded that 1-day snowpack peak outflow has decreased and shifted to occurring earlier during the last 100 years. Such changes in both quantity and temporal characteristics of snowmelt runoff in northern Finland showed positive correlations with springtime SAT, while there were no clear relationships with daily precipitation [19]. The present study also found that the spring SAT plays a critical role in less and earlier PSFD in the natural rivers of Simojoki and Kuivajoki across northern Finland. Generally speaking, statistically significant trends found in both PSFDM and PSFDT in these two natural rivers reflect less and earlier snowmelt runoff in response to increases in springtime SAT across northern Finland during recent decades.
PSFDM and PSFDT changes in the Kiiminkijoki and Temmesjoki rivers were dissimilar to the Simojoki and Kuivajoki rivers. The PSFDM decreased in the Kiiminkijoki river during 1967–2011 but showed no clear changes in the Temmesjoki river. In these two rivers, no statistically significant trends in historical PSFDT were found. During spring flood periods, the Kiiminkijoki river is bifurcated by the Iijoki river. This can principally influence variability and changes in both PSFDM and PSFDT in the Kiiminkijoki river. Different behaviors in both quantity and temporal characteristics of PSFD in the Temmesjoki river are principally related to the location, geology, and topography of its basin [61]. The Temmesjoki river basin is also heavily influenced by agriculture and sandy silt, which significantly control hydrological processes, particularly infiltration, during the spring season, and consequently the generation of PSFD [61]. On the other hand, both the Simojoki and Kuivajoki rivers have experienced significant drainage (mainly peatland forest) operations, which could impact both the magnitude and timing of PSFD.
Less and earlier PSFDs generally increase the risk of summer droughts in snow-dominant river basins [17]. Previous studies reported that Finland experienced severe droughts in the summer of 2003 and 2006 [42,62,63,64]. Besides the effects of changes in precipitation and SAT [62], such droughts were principally associated with less and earlier PSFD, respectively, in northern Finland. The summer drought in 2003 substantially decreased both crop yield and hydropower production, and thus, caused considerable economic losses in Finland [65]. As a social impact, meanwhile, small households and buildings in Finland faced a considerable decline in water supply during the summer 2003 drought. In the autumn season following the summer drought in 2006, river basins with acid sulfate soils in Finland released acidity to streams and thereby deteriorated their water quality [66]. Other studies also reported low groundwater levels [17] and poor water quality in rivers and lakes [67] as key environmental impacts of such summer droughts in Finland.

4.2. Changes in Wintertime Snowpack Accumulation and Melt Processes

Besides the warmer spring seasons, changes in wintertime climate can also influence snowpack accumulation and melt processes [14], and consequently control PSFD in northern rivers. Previous studies reported considerable declines in historical snowpack water equivalent (SWE) throughout central and northern Finland, particularly in Kajaani, which is located near all four natural river basins selected by this study [14]. Such decreases in SWE were mainly due to the significant decreases in annual snowfall/total precipitation ratio in both central and northern Finland [44], which particularly experienced less annual [44] and wintertime snowfall over time [14]. Throughout these two parts of Finland, such decreases in snowfall were associated with warming trends in snowfall-day SAT during 1959–2008 [44], but not with changes in wintertime SAT [14]. In the winter season, however, snowfall showed stronger correlations with precipitation than with SAT [14]. Hence, less/more wintertime precipitation can significantly decrease/increase snowfall, and consequently caused a considerable decline/rise in snowpack accumulation in central and northern Finland during the winter season [14].
Although there were significant positive correlations between wintertime precipitation and SAT (rainfall), less precipitation could not result in significant decreases/changes in SAT (rainfall) during winter [14]. Similarly, [14] reported negative relationships between wintertime SAT and snowpack meltout, both of which showed no significant changes in northern Finland. However, a sensitivity analysis [14] indicated that warmer wintertime SAT, up to 3 °C, would increase (decrease) wintertime rainfall and snowpack meltout (snowfall and peak SWE) in northern Finland, while more wintertime precipitation, up to 30%, can primarily increase wintertime snowfall and peak SWE without any effects on wintertime snowpack meltout. In addition, increases in both wintertime SAT (up to 3 °C) and precipitation (up to 30%) would sequentially result in more wintertime snowfall, peak SWE, rainfall, and snowpack meltout in Northern Finland [14]. Similar to the present study, this indicates that snowpack accumulation in northern Finland is primarily dependent on changes in wintertime precipitation patterns. However, more frequent wintertime floods are expected in northern Finland primarily due to such snowpack meltout during the winter season, with serious economic, environmental, and social impacts [14,19,68].

4.3. The Role of Climate Teleconnections

Springtime SAT variability over the basins of natural rivers studied throughout northern Finland was significantly influenced by the NAO, AO, and WP during 1967–2011. The NAO and AO were also the most influential climate teleconnections for historical variations in PSFDT and PSFDM, respectively, in both the Simojoki and Kuivajoki rivers. These two climate teleconnections (NAO and AO) are the predominant large-scale atmospheric circulation patterns controlling SAT variability over medium-high latitudes throughout the Atlantic/European zone and Arctic region [20]. The NAO indicates the power of westerly circulation from the North Atlantic towards the Atlantic European part, and the AO describes the intensity of the circumpolar vortex. Previous studies also reported that the NAO can generally be considered a key component of the AO [69]. The positive values of these teleconnections express the strengthening of westerlies and consequently prevailing of mild maritime airflow over northern Europe, particularly during the cold months [20]. Hence, substantial increases in both the NAO (0.20 decade−1) and AO (0.26 decade−1) indices not only reflect stronger westerly circulation but also explain warmer SAT during the cold half-year over the Fenno-Scandinavian region in recent decades [70]. Such positive relationships of these teleconnections with SAT over northern Europe, including Finland, have previously been reported in some studies (e.g., [30,39,46]). Accordingly, more powerful NAO and AO indices have led to (i) decreases in snow water equivalent (SWE), (ii) increases in snowmelt rate, and (iii) less and earlier snowpack peak outflow in the boreal environment of Nordic countries in recent decades [14,19,44,71]. With such effects on snowpack hydrological processes, these two climate teleconnections principally control the natural flow regime, particularly PSFD, in snow-dominated river basins at higher latitudes in northern Finland as determined by this study. Similarly, [71] concluded that the NAO and AO significantly influence springtime flow in snow-dominated rivers throughout northern Sweden, particularly the basins located in the area of the Simojoki and Kuivajoki rivers selected by the present study.

5. Conclusions

This study investigated long-term (1967–2011) variability, trends, and links to climate teleconnections for peak spring flood discharge magnitude (PSFDM), timing (PSFDT), corresponding daily precipitation (Daily P), and spring mean temperature (Tmean) in four natural rivers across northern Finland. Through the years 1967–2011, both the Simojoki and Kuivajoki rivers experienced less and earlier PSFD principally due to significant increases in spring mean temperatures. The NAO and AO were generally the climate teleconnections deriving such warmer springs and consequently decreasing trends in the PSFDM and PSFDT of these two rivers. Both NAO and AO were significantly correlated with the spring Tmean time series over the basins of the Kiiminkijoki and Temmesjoki rivers, but without any controllable effects on their PSFDM and PSFDT variability and changes. Across northern Finland, long-term daily precipitation time series corresponding to PSFDs showed no substantial trends over the basins of natural rivers studied, with no powerful roles in their PSFDM and PSFDT changes. Generally speaking, warmer spring seasons associated with stronger NAO phases have caused less and earlier PSFD in the natural rivers located at higher latitudes in northern Finland. The findings of this study lay a foundation for further studies on understanding, assessing, and mitigating different impacts of climate change on water resource security and consequently sustainable development in snow-dominant environments around the world.

Author Contributions

Conceptualization, M.I. and H.M.; Methodology, M.I. and S.A.; Software, S.A. and A.S.; Validation, M.I. and S.A.; Formal analysis, A.S.; Investigation, M.M. and B.A.; Resources, H.M. and M.M.; Data curation, M.I., M.M. and H.M.; Writing—original draft preparation, M.I.; Writing—review and editing, M.I. and B.A.; Visualization, M.I., S.A. and M.M.; Supervision, M.I. and H.M.; Project administration, H.M.; Funding acquisition, M.I. All authors have read and agreed to the published version of the manuscript.

Funding

This study was funded by the ARCTIC INTERACTION RESEARCH PROFILE ACTION supported by the University of Oulu and the Academy of Finland PROFI4, grant number 318930.

Institutional Review Board Statement

Not applicable.

Informed Consent Statement

Not applicable.

Data Availability Statement

All datasets analyzed during this study are publicly available through the references given in the manuscript.

Acknowledgments

The authors acknowledge the Finnish Environment Institute (SYKE) for measuring and recording historical daily discharge in Finnish rivers, the CSC_IT Center for Science Ltd. for providing gridded daily precipitation and mean temperature datasets for Finland, and the Climate Prediction Center (CPC) at the National Oceanic and Atmospheric Administration (NOAA) of the United States for making available online the standardized monthly values of climate teleconnections used in this study.

Conflicts of Interest

The authors declare that they have no known competing financial interest or personal relationship that could have appeared to influence the work reported in this paper.

References

  1. IPCC; Masson-Delmotte, V.; Zhai, P.; Pirani, A.; Connors, S.L.; Péan, C.; Berger, S.; Caud, N.; Chen, Y.; Goldfarb, L.; et al. Climate Change 2021: The Physical Science Basis. Contribution of Working Group I to the Sixth Assessment Report of the Intergovernmental Panel on Climate Change; IPCC: Geneva, Switzerland, 2021. [Google Scholar]
  2. Iz, H.B. Is the Global Sea Surface Temperature Rise Accelerating? Geod. Geodyn. 2018, 9, 432–438. [Google Scholar] [CrossRef]
  3. Konapala, G.; Mishra, A.K.; Wada, Y.; Mann, M.E. Climate Change Will Affect Global Water Availability through Compounding Changes in Seasonal Precipitation and Evaporation. Nat. Commun. 2020, 11, 3044. [Google Scholar] [CrossRef] [PubMed]
  4. Berghuijs, W.R.; Larsen, J.R.; van Emmerik, T.H.M.; Woods, R.A. A Global Assessment of Runoff Sensitivity to Changes in Precipitation, Potential Evaporation, and Other Factors. Water Resour. Res. 2017, 53, 8475–8486. [Google Scholar] [CrossRef] [Green Version]
  5. AghaKouchak, A.; Chiang, F.; Huning, L.S.; Love, C.A.; Mallakpour, I.; Mazdiyasni, O.; Moftakhari, H.; Papalexiou, S.M.; Ragno, E.; Sadegh, M. Climate Extremes and Compound Hazards in a Warming World. Annu. Rev. Earth Planet. Sci. 2020, 48, 519–548. [Google Scholar] [CrossRef] [Green Version]
  6. Hugelius, G.; Loisel, J.; Chadburn, S.; Jackson, R.B.; Jones, M.; MacDonald, G.; Marushchak, M.; Olefeldt, D.; Packalen, M.; Siewert, M.B.; et al. Large Stocks of Peatland Carbon and Nitrogen Are Vulnerable to Permafrost Thaw. Proc. Natl. Acad. Sci. USA 2020, 117, 20438–20446. [Google Scholar] [CrossRef] [PubMed]
  7. Gudmundsson, L.; Boulange, J.; Do, H.X.; Gosling, S.N.; Grillakis, M.G.; Koutroulis, A.G.; Leonard, M.; Liu, J.; Schmied, H.M.; Papadimitriou, L.; et al. Globally Observed Trends in Mean and Extreme River Flow Attributed to Climate Change. Science 2021, 371, 1159–1162. [Google Scholar] [CrossRef]
  8. Barnett, T.P.; Adam, J.C.; Lettenmaier, D.P. Potential Impacts of a Warming Climate on Water Availability in Snow-Dominated Regions. Nature 2005, 438, 303–309. [Google Scholar] [CrossRef]
  9. Jansson, P.; Hock, R.; Schneider, T. The Concept of Glacier Storage: A Review. J. Hydrol. 2003, 282, 116–129. [Google Scholar] [CrossRef]
  10. Wilson, D.; Hisdal, H.; Lawrence, D. Has Streamflow Changed in the Nordic Countries?—Recent Trends and Comparisons to Hydrological Projections. J. Hydrol. 2010, 394, 334–346. [Google Scholar] [CrossRef]
  11. Pohl, S.; Marsh, P.; Bonsal, B.R. Modeling the Impact of Climate Change on Runoff and Annual Water Balance of an Arctic Headwater Basin. Arctic 2009, 60, 173–186. [Google Scholar] [CrossRef] [Green Version]
  12. Kivinen, S.; Kaarlejärvi, E.; Jylhä, K.; Räisänen, J. Spatiotemporal Distribution of Threatened High-Latitude Snowbed and Snow Patch Habitats in Warming Climate. Environ. Res. Lett. 2012, 7, 34024. [Google Scholar] [CrossRef] [Green Version]
  13. Kivinen, S.; Rasmus, S. Observed Cold Season Changes in a Fennoscandian Fell Area over the Past Three Decades. Ambio 2015, 44, 214–225. [Google Scholar] [CrossRef] [PubMed] [Green Version]
  14. Irannezhad, M.; Ronkanen, A.-K.; Kløve, B. Wintertime Climate Factors Controlling Snow Resource Decline in Finland. Int. J. Climatol. 2016, 36, 110–131. [Google Scholar] [CrossRef]
  15. Barnett, T.P.; Pierce, D.W.; Hidalgo, H.G.; Bonfils, C.; Santer, B.D.; Das, T.; Bala, G.; Wood, A.W.; Nozawa, T.; Mirin, A.A.; et al. Human-Induced Changes in the Hydrology of the Western United States. Science 2008, 319, 1080–1083. [Google Scholar] [CrossRef] [Green Version]
  16. Steele-Dunne, S.; Lynch, P.; McGrath, R.; Semmler, T.; Wang, S.; Hanafin, J.; Nolan, P. The Impacts of Climate Change on Hydrology in Ireland. J. Hydrol. 2008, 356, 28–45. [Google Scholar] [CrossRef]
  17. Okkonen, J.; Kløve, B. A Conceptual and Statistical Approach for the Analysis of Climate Impact on Ground Water Table Fluctuation Patterns in Cold Conditions. J. Hydrol. 2010, 388, 1–12. [Google Scholar] [CrossRef]
  18. Räisänen, J. Warmer Climate: Less or More Snow? Clim. Dyn. 2008, 30, 307–319. [Google Scholar] [CrossRef]
  19. Irannezhad, M.; Ronkanen, A.-K.; Kløve, B. Effects of Climate Variability and Change on Snowpack Hydrological Processes in Finland. Cold Reg. Sci. Technol. 2015, 118, 14–29. [Google Scholar] [CrossRef]
  20. Lau, N.C. Teleconnections Linking Worldwide Climate Anomalies: Scientific Basis and Societal Impact; Glantz, M.H., Katz, R., Nicholls, N., Eds.; Cambridge University Press: Cambridge, UK, 2009; ISBN 9780521106849 0521106842. [Google Scholar]
  21. Chen, D.; Chen, Y. Association between Winter Temperature in China and Upper Air Circulation over East Asia Revealed by Canonical Correlation Analysis. Glob. Planet. Chang. 2003, 37, 315–325. [Google Scholar] [CrossRef]
  22. Bartolini, E.; Claps, P.; D’Odorico, P. Connecting European Snow Cover Variability with Large Scale Atmospheric Patterns. Adv. Geosci. 2010, 26, 93–97. [Google Scholar] [CrossRef] [Green Version]
  23. Ghasemifar, E.; Irannezhad, M.; Minaei, F.; Minaei, M. The Role of ENSO in Atmospheric Water Vapor Variability during Cold Months over Iran. Theor. Appl. Climatol. 2022, 148, 795–817. [Google Scholar] [CrossRef]
  24. Hoy, A.; Sepp, M.; Matschullat, J. Large-Scale Atmospheric Circulation Forms and Their Impact on Air Temperature in Europe and Northern Asia. Theor. Appl. Climatol. 2013, 113, 643–658. [Google Scholar] [CrossRef]
  25. Irannezhad, M.; Liu, J. Evaluation of Six Gauge-Based Gridded Climate Products for Analyzing Long-Term Historical Precipitation Patterns Across the Lancang-Mekong River Basin. Geogr. Sustain. 2022, 3, 85–103. [Google Scholar] [CrossRef]
  26. Wang, H.; Chen, Y.; Li, W. Characteristics in Streamflow and Extremes in the Tarim River, China: Trends, Distribution and Climate Linkage. Int. J. Climatol. 2015, 35, 761–776. [Google Scholar] [CrossRef]
  27. Stewart, I.T.; Cayan, D.R.; Dettinger, M.D. Changes toward Earlier Streamflow Timing across Western North America. J. Clim. 2005, 18, 1136–1155. [Google Scholar] [CrossRef]
  28. Irannezhad, M.; Marttila, H.; Chen, D.; Kløve, B. Century-Long Variability and Trends in Daily Precipitation Characteristics at Three Finnish Stations. Adv. Clim. Chang. Res. 2016, 7, 54–69. [Google Scholar] [CrossRef]
  29. Irannezhad, M.; Chen, D.; Kløve, B. The Role of Atmospheric Circulation Patterns in Agroclimate Variability in Finland, 1961–2011. Geogr. Ann. Ser. A Phys. Geogr. 2016, 98, 287–301. [Google Scholar] [CrossRef]
  30. Kiani, S.; Irannezhad, M.; Ronkanen, A.-K.; Moradkhani, H.; Kløve, B. Effects of Recent Temperature Variability and Warming on the Oulu-Hailuoto Ice Road Season in the Northern Baltic Sea. Cold Reg. Sci. Technol. 2018, 151, 1–8. [Google Scholar] [CrossRef] [Green Version]
  31. Rödel, R. Varying Spatial Patterns of Trend and Seasonality in Eurasian Runoff Time Series. Adv. Geosci. 2006, 9, 93–100. [Google Scholar] [CrossRef] [Green Version]
  32. Irannezhad, M. Effects of Temperature Variability and Warming on the Timing of Snowmelt Events in Southern Finland during the Past 100 Years. Reg.-Water Conserv. 2020, 3. [Google Scholar] [CrossRef]
  33. Fritze, H.; Stewart, I.T.; Pebesma, E. Shifts in Western North American Snowmelt Runoff Regimes for the Recent Warm Decades. J. Hydrometeorol. 2011, 12, 989–1006. [Google Scholar] [CrossRef]
  34. Irannezhad, M.; Ahmadi, B.; Liu, J.; Chen, D.; Matthews, J.H. Global Water Security: A Shining Star in the Dark Sky of Achieving the Sustainable Development Goals. Sustain. Horizons 2022, 1, 100005. [Google Scholar] [CrossRef]
  35. United Nations. About the Sustainable Development Goals-United Nations Sustainable Development. In Sustainable Development Goals; United Nations: New York, NY, USA, 2015. [Google Scholar]
  36. De Castro, M.; Gallardo, C.; Jylha, K.; Tuomenvirta, H. The Use of a Climate-Type Classification for Assessing Climate Change Effects in Europe from an Ensemble of Nine Regional Climate Models. Clim. Chang. 2007, 81, 329–341. [Google Scholar] [CrossRef]
  37. Käyhkö, J. Muuttuuko Pohjolan Ilmasto? (Fennoscandian Climate in Change?); Geography Department of the University of Turku: Turku, Finland, 2004; Volume 168, pp. 19–35. [Google Scholar]
  38. Irannezhad, M.; Marttila, H.; Kløve, B. Long-Term Variations and Trends in Precipitation in Finland. Int. J. Climatol. 2014, 34, 3139–3153. [Google Scholar] [CrossRef]
  39. Irannezhad, M.; Chen, D.; Kløve, B. Interannual Variations and Trends in Surface Air Temperature in Finland in Relation to Atmospheric Circulation Patterns, 1961–2011. Int. J. Climatol. 2015, 35, 3078–3092. [Google Scholar] [CrossRef]
  40. Pirinen, P.; Simola, H.; Aalto, J.; Kaukoranta, J.P.; Karlsson, P.; Ruuhela, R. Tilastoja Suomen Ilmastosta 1981–2010; Ilmatieteen laitos: Helsinki, Finland, 2012. [Google Scholar]
  41. Korhonen, J. Long-Term Changes in Lake Ice Cover in Finland. Hydrol. Res. 2006, 37, 347–363. [Google Scholar] [CrossRef]
  42. Korhonen, J.; Kuusisto, E. Long-Term Changes in the Discharge Regime in Finland. Hydrol. Res. 2010, 41, 253–268. [Google Scholar] [CrossRef]
  43. Bin Ashraf, F.; Haghighi, A.T.; Riml, J.; Alfredsen, K.; Koskela, J.J.; Kløve, B.; Marttila, H. Changes in Short Term River Flow Regulation and Hydropeaking in Nordic Rivers. Sci. Rep. 2018, 8, 17232. [Google Scholar] [CrossRef]
  44. Irannezhad, M.; Ronkanen, A.-K.; Kiani, S.; Chen, D.; Kløve, B. Long-Term Variability and Trends in Annual Snowfall/Total Precipitation Ratio in Finland and the Role of Atmospheric Circulation Patterns. Cold Reg. Sci. Technol. 2017, 143, 23–31. [Google Scholar] [CrossRef]
  45. Irannezhad, M.; Chen, D.; Kløve, B.; Moradkhani, H. Analysing the Variability and Trends of Precipitation Extremes in Finland and Their Connection to Atmospheric Circulation Patterns. Int. J. Climatol. 2017, 37, 1053–1066. [Google Scholar] [CrossRef]
  46. Irannezhad, M.; Moradkhani, H.; Kløve, B. Spatiotemporal Variability and Trends in Extreme Temperature Events in Finland over the Recent Decades: Influence of Northern Hemisphere Teleconnection Patterns. Adv. Meteorol. 2018, 2018, 7169840. [Google Scholar] [CrossRef]
  47. Thompson, D.W.J.; Wallace, J.M. The Arctic Oscillation Signature in the Wintertime Geopotential Height and Temperature Fields. Geophys. Res. Lett. 1998, 25, 1297–1300. [Google Scholar] [CrossRef] [Green Version]
  48. Barnston, A.G.; Livezey, R.E. Classification, Seasonality and Persistence of Low-Frequency Atmospheric Circulation Patterns. Mon. Weather Rev. 1987, 115, 1083–1126. [Google Scholar] [CrossRef]
  49. Lim, Y.K.; Kim, H.D. Impact of the Dominant Large-Scale Teleconnections on Winter Temperature Variability over East Asia. J. Geophys. Res. Atmos. 2013, 118, 7835–7848. [Google Scholar] [CrossRef] [Green Version]
  50. Bueh, C.; Nakamura, H. Scandinavian Pattern and Its Climatic Impact. Q. J. R. Meteorol. Soc. 2007, 133, 2117–2131. [Google Scholar] [CrossRef]
  51. Wallace, J.M.; Gutzler, D.S. Teleconnections in the Geopotential Height Field during the Northern Hemisphere Winter. Mon. Weather Rev. 1981, 109, 784–812. [Google Scholar] [CrossRef]
  52. Mann, H.B. Non-Parametric Test Against Trend. Econometrica 1945, 13, 245–259. [Google Scholar] [CrossRef]
  53. Sen, P.K. Estimates of the Regression Coefficient Based on Kendall’s Tau. J. Am. Stat. Assoc. 1968, 63, 1379–1389. [Google Scholar] [CrossRef]
  54. Helsel, D.R.; Hirsch, R.M. Statistical Methods in Water Resources; Elsevier: Hoboken, NJ, USA, 1992. [Google Scholar] [CrossRef]
  55. Yue, S.; Pilon, P.; Phinney, B.; Cavadias, G. The Influence of Autocorrelation on the Ability to Detect Trend in Hydrological Series. Hydrol. Process. 2002, 16, 1807–1829. [Google Scholar] [CrossRef]
  56. Park, E.; Lee, Y.J. Estimates of Standard Deviation of Spearman’s Rank Correlation Coefficients with Dependent Observations. Commun. Stat. Part B Simul. Comput. 2001, 30, 129–142. [Google Scholar] [CrossRef]
  57. Blöschl, G.; Bierkens, M.F.P.; Chambel, A.; Cudennec, C.; Destouni, G.; Fiori, A.; Kirchner, J.W.; McDonnell, J.J.; Savenije, H.H.G.; Sivapalan, M.; et al. Twenty-Three Unsolved Problems in Hydrology (UPH)—A Community Perspective. Hydrol. Sci. J. 2019, 64, 1141–1158. [Google Scholar] [CrossRef] [Green Version]
  58. Yamanaka, T.; Wakiyama, Y.; Suzuki, K. Is Snowmelt Runoff Timing in the Japanese Alps Region Shifting toward Earlier in the Year? Hydrol. Res. Lett. 2012, 6, 87–91. [Google Scholar] [CrossRef] [Green Version]
  59. Shiklomanov, A.I.; Lammers, R.B.; Rawlins, M.A.; Smith, L.C.; Pavelsky, T.M. Temporal and Spatial Variations in Maximum River Discharge from a New Russian Data Set. J. Geophys. Res. Biogeosci. 2007, 112, G04S53. [Google Scholar] [CrossRef]
  60. Meilutyte-Lukauskiene, D.; Kovalenkoviene, M. Change of Spring Flood Parameters in Lithuanian Rivers. Energetika 2007, 4, 26–33. [Google Scholar]
  61. Meriö, L.-J.; Ala-aho, P.; Linjama, J.; Hjort, J.; Kløve, B.; Marttila, H. Snow to Precipitation Ratio Controls Catchment Storage and Summer Flows in Boreal Headwater Catchments. Water Resour. Res. 2019, 55, 4096–4109. [Google Scholar] [CrossRef]
  62. Irannezhad, M.; Ahmadi, B.; Kløve, B.; Moradkhani, H. Atmospheric Circulation Patterns Explaining Climatological Drought Dynamics in the Boreal Environment of Finland, 1962–2011. Int. J. Climatol. 2017, 37, 801–817. [Google Scholar] [CrossRef]
  63. Tallaksen, L.M.; Stahl, K. Spatial and Temporal Patterns of Large-Scale Droughts in Europe: Model Dispersion and Performance. Geophys. Res. Lett. 2014, 41, 429–434. [Google Scholar] [CrossRef]
  64. Irannezhad, M.; Torabi Haghighi, A.; Chen, D.; Kløve, B. Variability in Dryness and Wetness in Central Finland and the Role of Teleconnection Patterns. Theor. Appl. Climatol. 2015, 122, 471–486. [Google Scholar] [CrossRef]
  65. Silander, J.; Järvinen, E.A. Vuosien 2002–2003 Poikkeuksellisen Kuivuuden Vaikutukset [Effects of Severe Drought 2002–2003]; Finnish Environmental Institute: Helsinki, Finland, 2004; Volume 731. [Google Scholar]
  66. Saarinen, T.S.; Kløve, B. Past and Future Seasonal Variation in PH and Metal Concentrations in Runoff from River Basins on Acid Sulphate Soils in Western Finland. J. Environ. Sci. Health Part A 2012, 47, 1614–1625. [Google Scholar] [CrossRef]
  67. Saarinen, T.; Vuori, K.-M.; Alasaarela, E.; Kløve, B. Long-Term Trends and Variation of Acidity, CODMn and Colour in Coastal Rivers of Western Finland in Relation to Climate and Hydrology. Sci. Total Environ. 2010, 408, 5019–5027. [Google Scholar] [CrossRef]
  68. Veijalainen, N.; Lotsari, E.; Alho, P.; Vehviläinen, B.; Käyhkö, J. National Scale Assessment of Climate Change Impacts on Flooding in Finland. J. Hydrol. 2010, 391, 333–350. [Google Scholar] [CrossRef]
  69. Serreze, M.C.; Walsh, J.E.; Chapin, F.S.; Osterkamp, T.; Dyurgerov, M.; Romanovsky, V.; Oechel, W.C.; Morison, J.; Zhang, T.; Barry, R.G. Observational Evidence of Recent Change in the Northern High-Latitude Environment. Clim. Chang. 2000, 46, 159–207. [Google Scholar] [CrossRef]
  70. Wang, D.; Wang, C.; Yang, X.; Lu, J. Winter Northern Hemisphere Surface Air Temperature Variability Associated with the Arctic Oscillation and North Atlantic Oscillation. Geophys. Res. Lett. 2005, 32, L16706. [Google Scholar] [CrossRef] [Green Version]
  71. Uvo, C.B.; Foster, K.; Olsson, J. The Spatio-Temporal Influence of Atmospheric Teleconnection Patterns on Hydrology in Sweden. J. Hydrol. Reg. Stud. 2021, 34, 100782. [Google Scholar] [CrossRef]
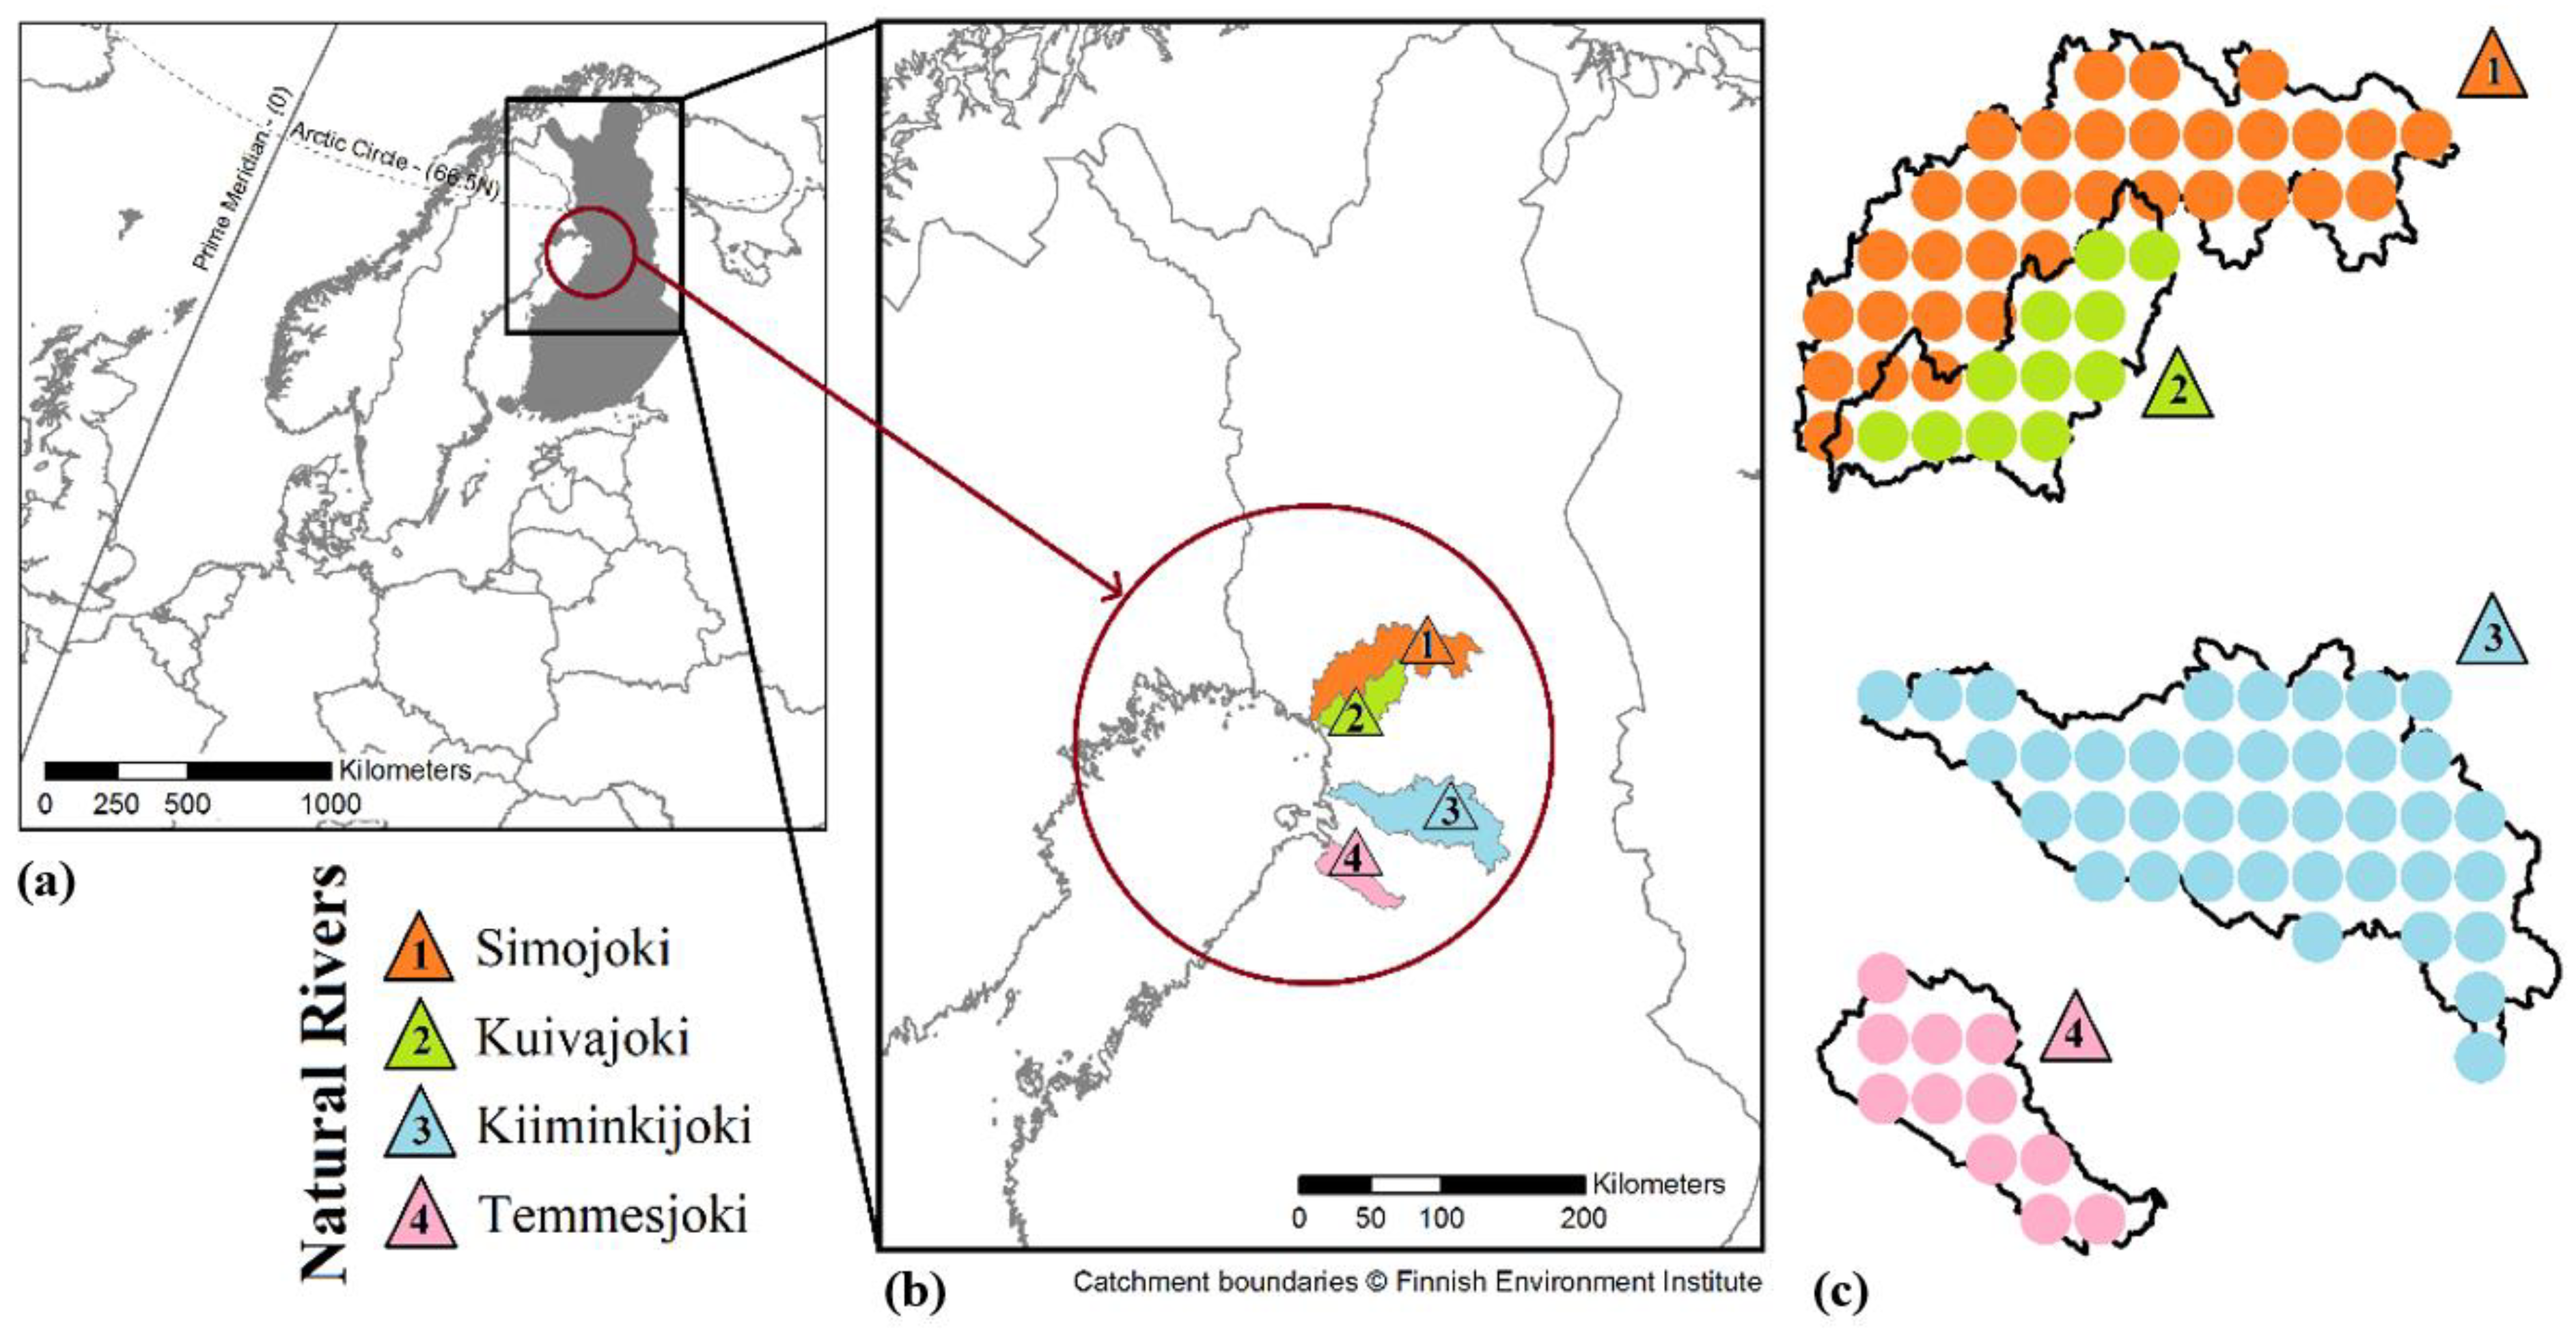
Figure 1. The locations of (a) northern Finland, (b) four natural rivers selected by this study, and (c) 10 × 10 km2 grid points with precipitation and surface air temperature (SAT) datasets throughout the basins of such natural rivers.
Water 14 01312 g001
Figure 2. Annual anomalies with significant trend line (p < 0.05) and the most influential springtime climate teleconnection for peak spring flood discharge magnitude (PSFDM) in the (a) Simojoki, (b) Kuivajoki, (c) Kiiminkijoki, and (d) Temmesjoki rivers across northern Finland during 1967–2011.
Water 14 01312 g002
Figure 3. Annual Anomalies with significant trend line (p < 0.05) and the most influential springtime climate teleconnection for peak spring flood discharge timing (PSFDT) in the (a) Simojoki, (b) Kuivajoki, (c) Kiiminkijoki, and (d) Temmesjoki rivers across northern Finland during 1967–2011.
Water 14 01312 g003
Figure 4. The Spearman’s rank correlations (rho) of springtime climate teleconnections with peak spring flood discharge magnitude (PSFDM) and timing (PSFDT) in all the Simojoki, Kuivajoki, Kiiminkijoki, and Temmesjoki rivers across northern Finland during 1967–2011. The underlined values show statistically significant (p < 0.05) correlations.
Water 14 01312 g004
Figure 5. Annual anomalies with significant trend line (p < 0.05) and the most influential springtime climate teleconnection for daily precipitation corresponding to the date of PSFD in the (a) Simojoki, (b) Kuivajoki, (c) Kiiminkijoki, and (d) Temmesjoki rivers across northern Finland during 1967–2011.
Water 14 01312 g005
Figure 6. Annual anomalies with significant trend line (p < 0.05) and the most influential springtime climate teleconnection for springtime Tmean in the (a) Simojoki, (b) Kuivajoki, (c) Kiiminkijoki, and (d) Temmesjoki rivers basins across northern Finland during 1967–2011.
Water 14 01312 g006
Figure 7. The Spearman’s rank correlations (rho) of springtime climate teleconnections with daily precipitation corresponding to the PSFD as well as with springtime Tmean in all the Simojoki, Kuivajoki, Kiiminkijoki, and Temmesjoki rivers across northern Finland during 1967–2011. The underlined values show statistically significant (p < 0.05) correlations.
Water 14 01312 g007
Figure 8. The Spearman’s rank correlations (rho) among peak spring flood discharge magnitude (PSFDM). PSFD timing (PSFDT), PSFDT’s corresponding daily precipitation (Daily P), and springtime Tmean in all the Simojoki, Kuivajoki, Kiiminkijoki, and Temmesjoki rivers across northern Finland during 1967–2011. The given rho values are statistically significant (p < 0.05).
Water 14 01312 g008
Table 1. Summary of climate teleconnections considered in this study.
No.IDClimate TeleconnectionSourceReference
1AOArctic OscillationCPC[47]
2EAEast AtlanticCPC[48]
3EA/WREast Atlantic/West RussiaCPC[48,49]
4NAONorth Atlantic OscillationCPC[48]
5POLPolar/Eurasia patternCPC[48]
6SCAScandinavia patternCPC[48,50]
7WPWest PacificCPC[51]
Publisher’s Note: MDPI stays neutral with regard to jurisdictional claims in published maps and institutional affiliations.