Article

Analysis of Temperature Effect on Saturated Hydraulic Conductivity of the Chinese Loess

School of Environmental Science and Engineering, Taiyuan University of Science and Technology, Taiyuan 030024, China
*
Author to whom correspondence should be addressed.
Water 2022, 14(9), 1327; https://doi.org/10.3390/w14091327
Submission received: 13 March 2022 / Revised: 14 April 2022 / Accepted: 19 April 2022 / Published: 19 April 2022
(This article belongs to the Special Issue Water and Soil Resources Management in Agricultural Areas)

Abstract

:
Saturated hydraulic conductivity (Ks) is a significant basic hydraulic parameter in the field of soil science. However, it is typically used as a constant, and that will lead to some inaccurate results in numerical simulations of water movement. In this study, a laboratory experiment was conducted to investigate the effect of temperature on Ks of Chinese loess. The results indicated that Ks had a special relationship with temperature for this soil: Ks increased in the range of temperatures (t) from 7 to 44 °C. A formula in Forest Standard of China LY/T 1218-1999 can well describe the distribution characteristics of the experimental data, but it may not apply if bulk density changes. The study improved the formula by analyzing another set of published experimental data. In the improved formula, the influence of bulk density and temperature on Ks is fully considered. The results show that the improved formula can be applied to the simulation of saturated water flow by accurately describing Ks variation with temperature and bulk density.

1. Introduction

Saturated hydraulic conductivity (Ks) has been widely used in the modeling of flow and transport-related phenomena in the soil [1]. Saturated hydraulic conductivity has a relationship between particle shape and packing density characteristics of soils [2], and it is strongly influenced by the fluid properties (viscosity, chemistry), soil mineral composition, the relative amount of soil fluid (saturation) present in the soil matrix, and temperature [3]. Temperature is known as a very important factor, which has effects on hydraulic conductivity [4,5]. Geothermal exploration in the volcanic area and heating pipeline burst in the city would lead to the intermittent movement of high-temperature water in the soil [6]. Surface water recharging the aquifer has an influence on groundwater flow pattern in the well field [7]. It is necessary to build a mathematical model and simulate for water in the soil to make a series of sensitivity analyses [8]. Whereas Ks is actually variable, it is typically used as a constant in numerical simulations of water movement. The assumption is not consistent with the actual. Therefore, the simulation results in some inaccurate results, especially for the simulation at various temperatures. Therefore, it is necessary to analyze the temperature influence on Ks deeply, and to establish the corresponding model.
At present, some research about temperature and water movement in soil has been reported. Temperature has effects on soil water movement and retention [9]. Hydraulic conductivity has been shown to increase within a temperature range from 20 to 80 °C [10], though the effect of temperature elevation on hydraulic conductivity is not large [11]. The relationship between temperature and Ks has been described by some formulas based on thermodynamics [12] and activation energy [13]. The effects of temperature on hydraulic conductivity can be predicted to some degree from changes in viscosity [14]. Moreover, models that describe the relationship between temperature and Ks have been established or applied. For example, the numerical solutions have been proposed for the drying of porous media. In the experiment, it is found that temperature has an effect on diffusivity of water content, but it is not extremely sensitive to temperature [15]. Saturated hydraulic conductivity can be estimated by using the Hagen–Poiseuille equation [16] and Darcy’s law [17]. Chen et al. suggested that pore size plays a key role in the process of changing hydraulic conductivity [18]. Most studies to date have focused on the theory of energy to describe the effect of temperature on Ks values.
The viscosity of water and porosity of soil are also factors on hydraulic conductivity, and they will change with temperature. Viscosity has been found to greatly impact intrinsic permeability values [19]. Soil permeability is known to increase with increased temperature, due to the attendant decrease in water viscosity [20,21]. It is obvious that the value of hydraulic conductivity also depends on soil density [22,23,24,25]. The soil density state can be described by the soil porosity and volumetric water content at saturation. However, many parameters, including viscosity and porosity, will change with temperature. The simple study of viscosity, porosity, and other single factors is not enough to reveal the specific process of Ks varying with temperature, due to the complexity of process changes caused by temperature.
Chinese loess is commonly distributed in the semi-arid Loess Plateau located in the northern and northwestern parts of China [26]. The underground flow of thermal fluid, such as cooling water leaked from thermal power plants or coking plants, is complicated at different temperatures. Exploring and describing the movement process of water in the soil are conducive to the movement simulation of soil water flow and the optimal management of water resources in a changing environment [27,28]. Therefore, it is necessary to study the relationship between Ks and temperature rigorously. In this study, we aimed to (1) analyze the dynamics of Ks and temperature and (2) improve a formula that describes Ks under different bulk density and temperatures.

2. Materials and Methods

2.1. Materials

Chinese loess samples were taken from an experimental field of Institute for Radiation Protection in Yuci, Shanxi province. Prior to the experiment, soils were air dried and passed through a 2 mm sieve. The soil bulk density (D) was 1.35 g/cm3, and the soil porosity was 0.4924 cm3/cm3. The grain-size distributions of the soil, as measured using the pipette method, are presented in Figure 1; d50 was about 0.075 mm. The samples have a loamy sand texture (78.23% sand, 20.81% silt and 0.96% clay) with low organic matter content (0.392%) [29].

2.2. Experimental Methods

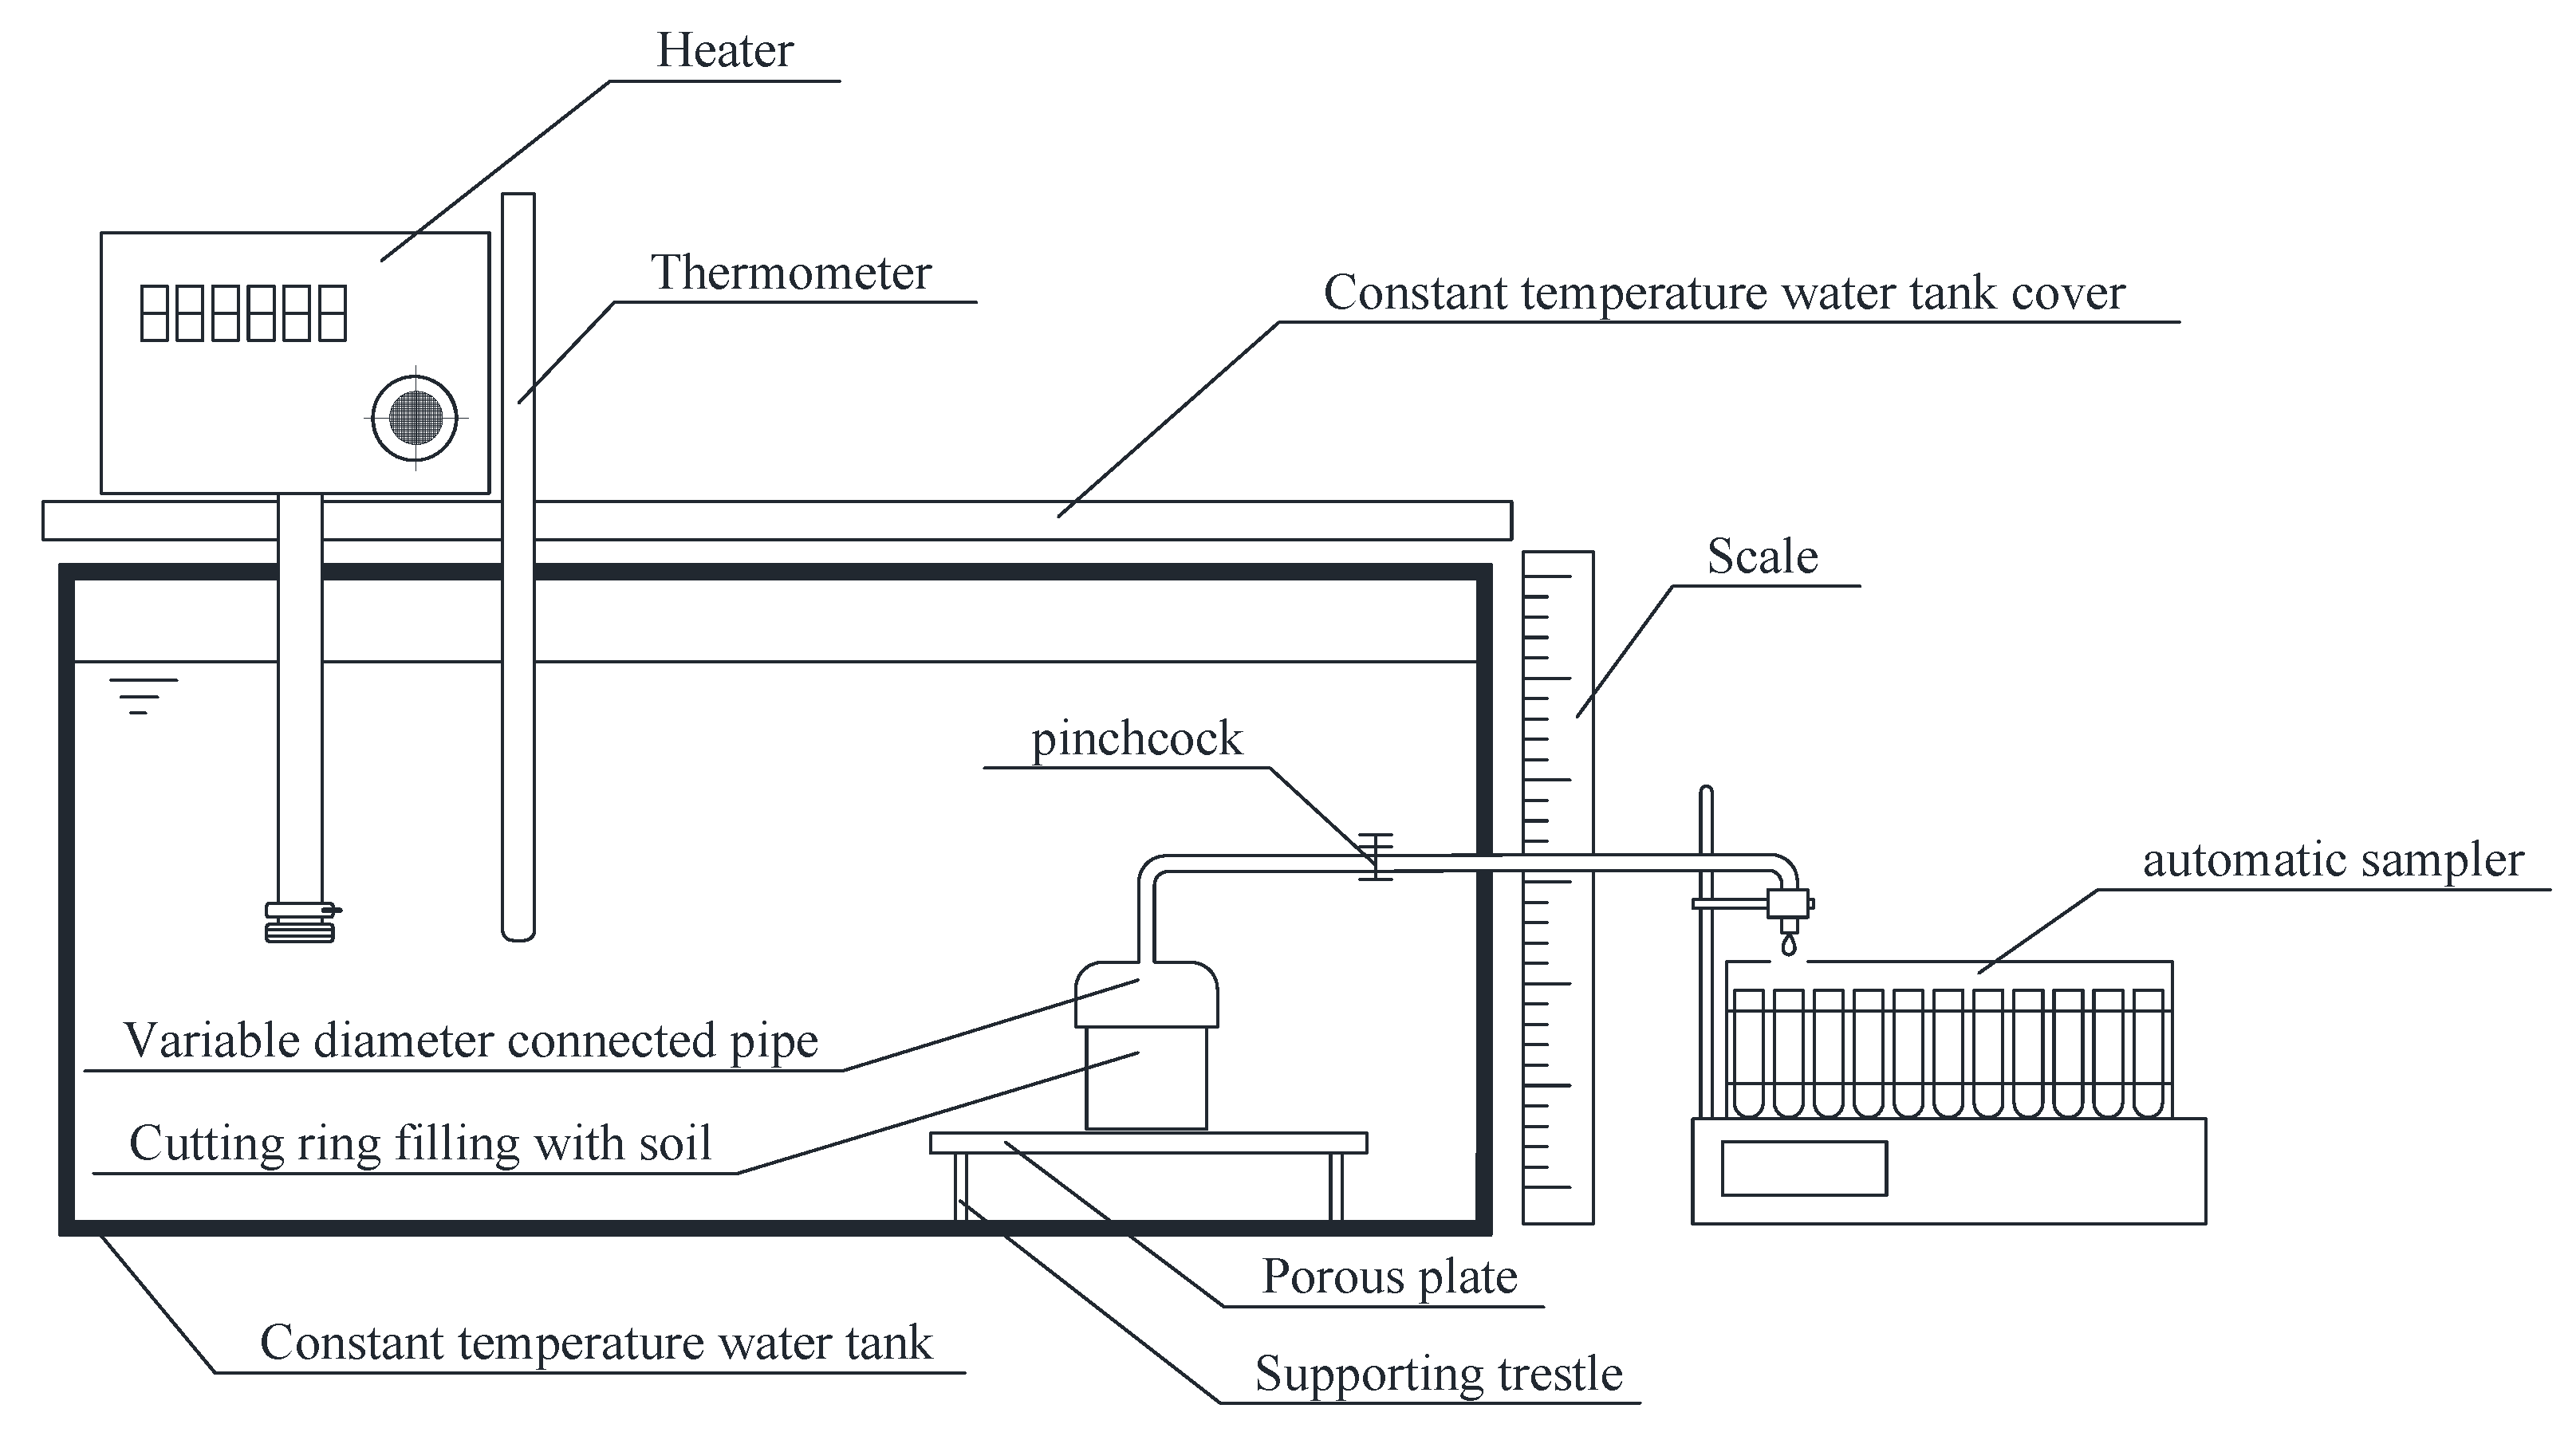
The popular device to measure Ks is the head well permeameter such as the Guelph Permeameter [30]. In the study, a new device was designed to measure Ks. Figure 2 shows a schematic diagram of the experimental apparatus used to measure Ks values at various temperatures. The experiments were conducted in a constant temperature tank with a dimension of 0.6 m (length) × 0.4 m (width) × 0.5 m (height). A cutting ring (5 cm ID × 5 cm L) filled with soil was placed in a porous plate to uniformly distribute the water flow above the supporting trestle. The cutting ring outlet was connected to the automatic sampler. Water temperature was monitored by a thermometer and controlled by a heater in a water tank. The heater was set at a predetermined water temperature and held temperature invariability for three hours or more. The tank surface was covered with a plastic sheet to minimize surface evaporation and loss of thermal energy. Water in the tank flowed through the constant temperature water tank, the cutting ring, and then into the automatic sampler. According to the water head difference reading from the meter, the water volume recorded by the automatic sampler, and the time difference, Ks values were calculated by Darcy’s law.
The experimental procedure was as follows:
Step 1: Filling the cutting ring with soil. Soil samples were hand-loaded into the cutting ring in approximately 1 cm segments each time, with a dry bulk density of 1.375 g/cm3. The bottom of the cutting ring was covered with a 200-mesh nylon wire screen. The soil was then completely saturated by placing the bottom of the soil bed into air-free water.
Step 2: Connecting the device. The top of the cutting ring was sealed with a variable diameter connecting pipe. The joints were coated with olefin to eliminate any solution leakage from the pipe during the experiment. The cutting ring was then connected to the other equipment, according to the schema presented in Figure 2. The pinchcock was then fastened, and the sample was then put into the constant temperature water tank slowly.
Step 3: Performing experiments. The experiments were conducted under steady-state flow conditions and at various temperatures. The pinchcock was loosened to allow water in the constant temperature water tank through the cutting ring with the soil sample, the variable diameter connected pipe, the overflow water tank, the overflow pipe, and into the automatic sampler. Once steady-state flow was established, that is, when the flux of water no longer changed, we recorded the flux at this time for this temperature, then calculated the Ks value according to Darcy’s law.

3. Results

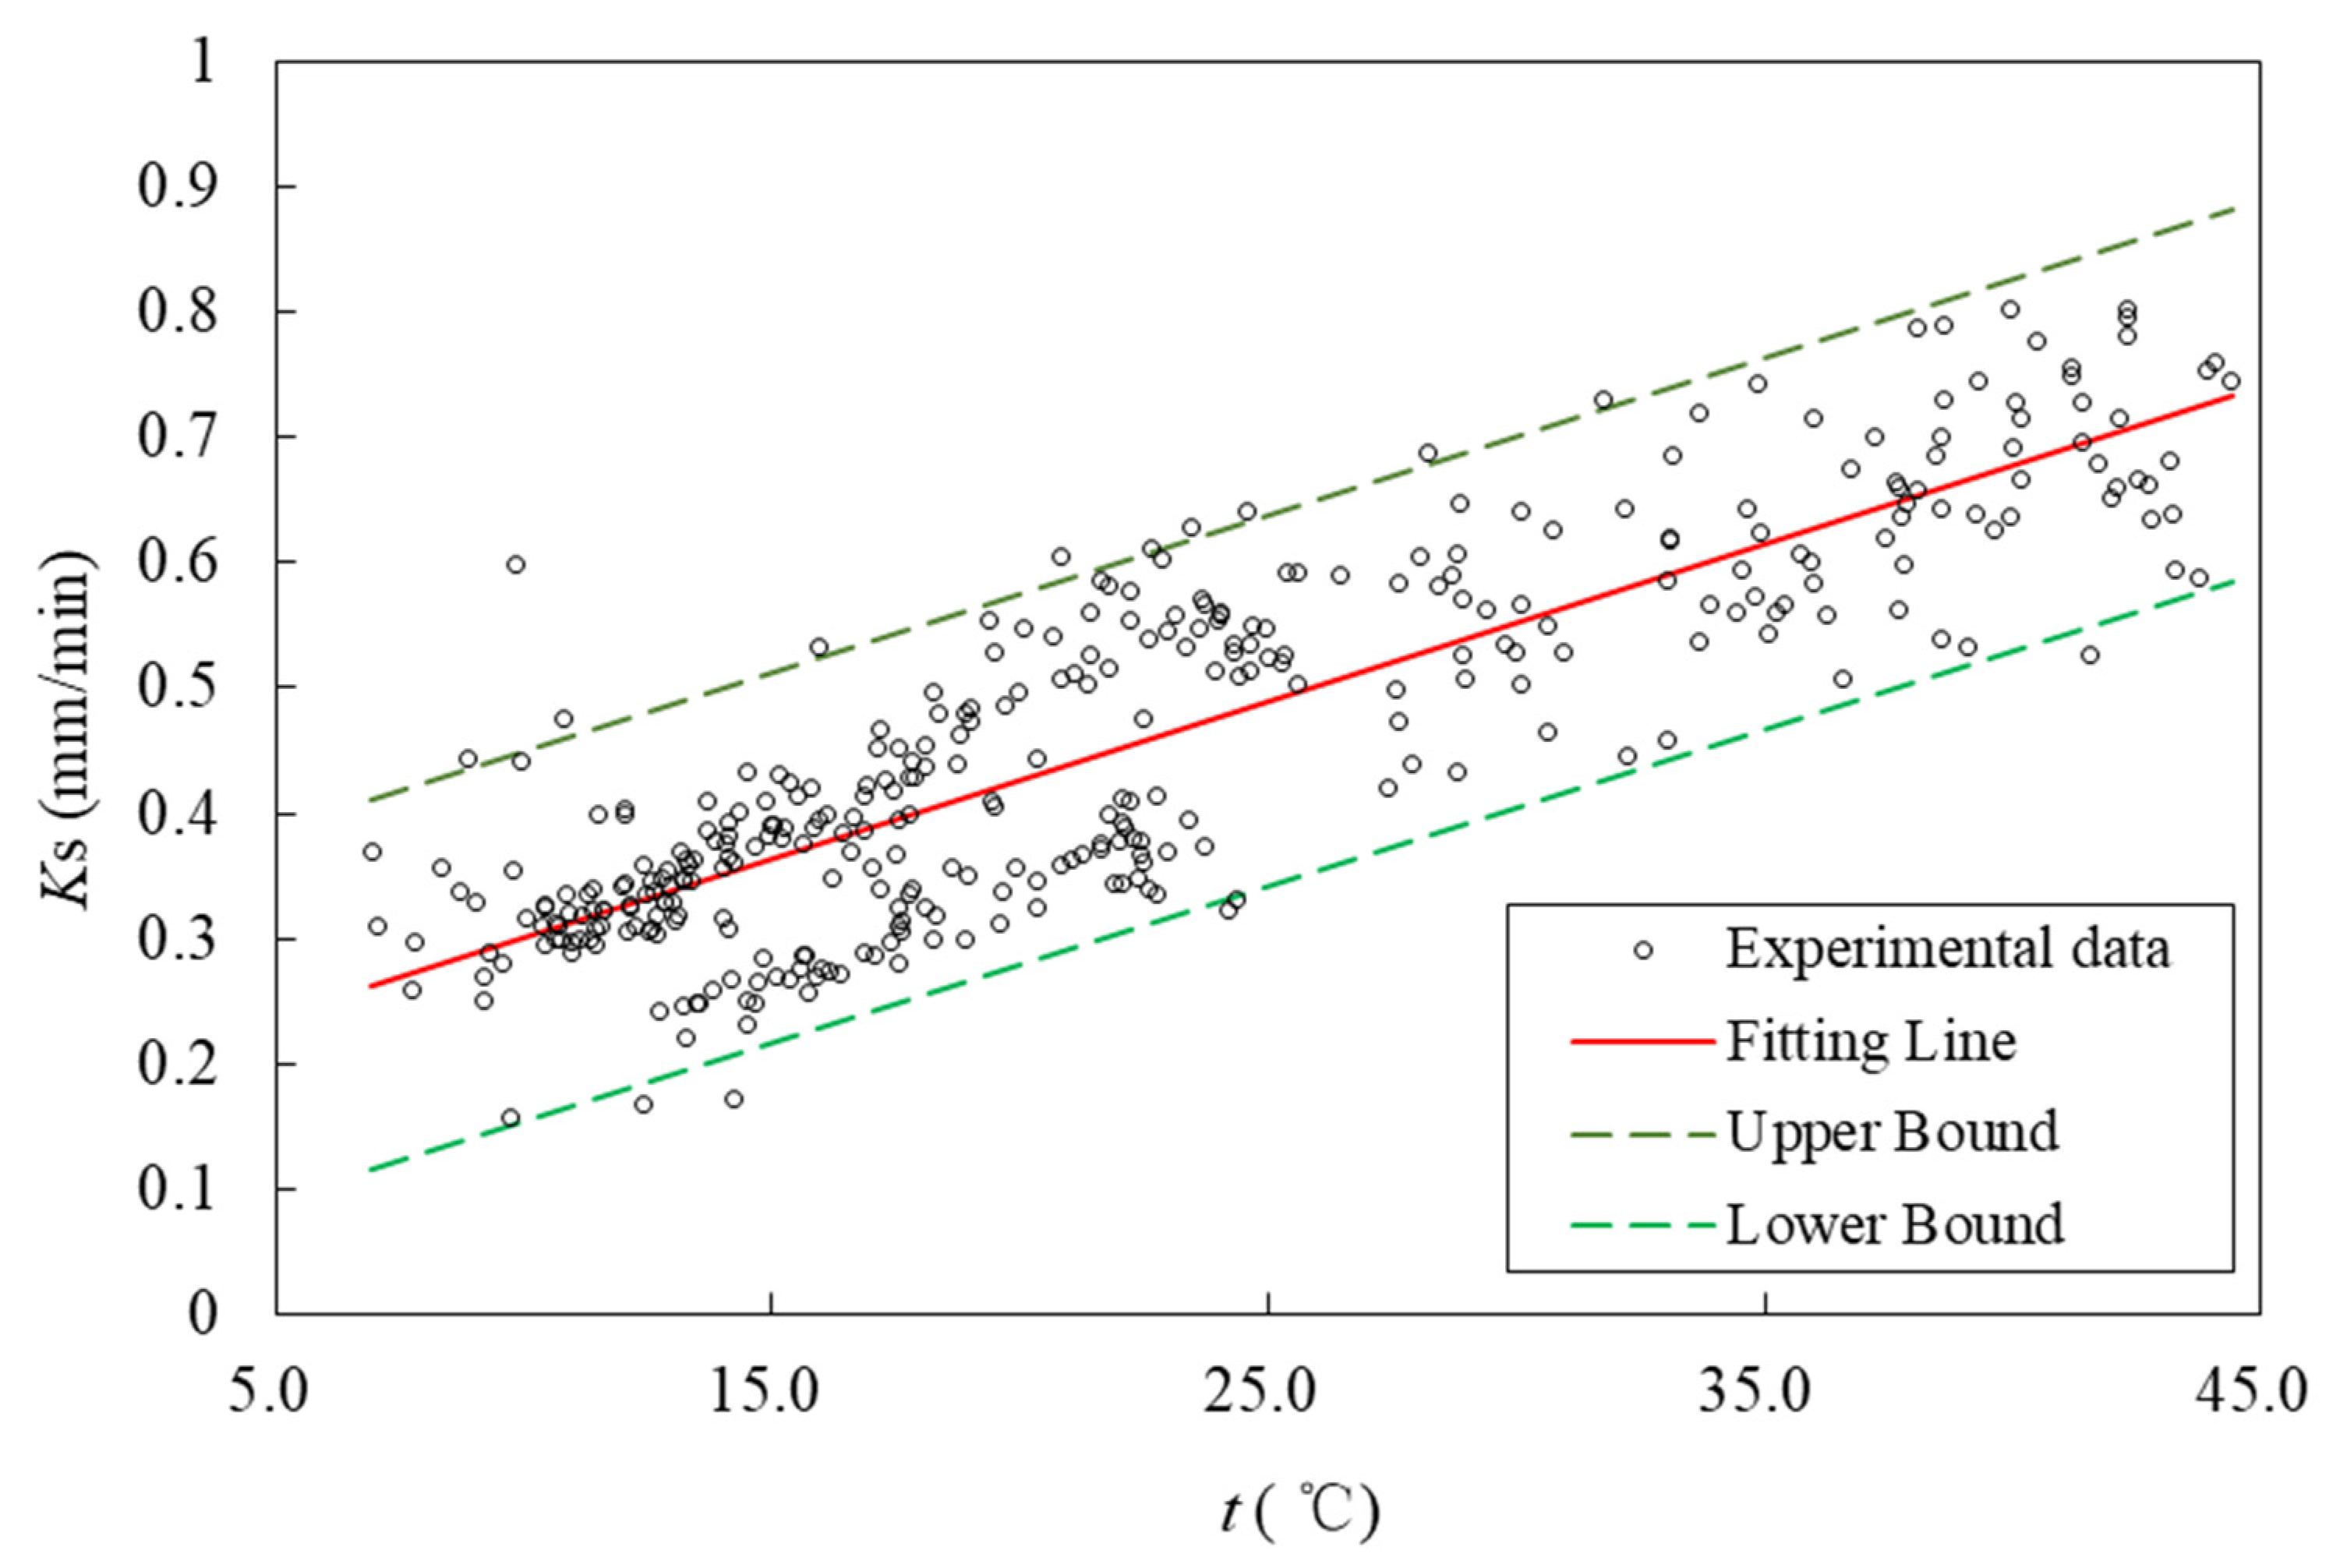
This experiment surveyed 17 same soil samples; every soil sample was measured at about 20 temperatures (ranging from 7 to 44 °C). It was assumed that there is no change in chemical properties and soil structure during the experiment. According to the outflow velocity of air-free water at different temperature, Ks values were calculated according to Darcy’s law. Thus, 351 experimental data points were obtained.
Figure 3 shows Ks values at different temperatures. It is obvious that there is a linear increasing relationship between temperature and Ks. Ks displayed an increasing tendency over the tested temperature range (7–44 °C), and most of the experimental data are within the 95% confidence interval line. The minimum and the maximum Ks values were 0.158 mm/min and 0.803 mm/min at 9.7 °C and 39.9 °C, respectively. Ks was about 0.300 mm/min at 10 °Cand was about 0.680 mm/min at 40 °C. A few individual points deviated from the majority of the values, e.g., the Ks of 0.598 mm/min at 9.8 °C.
The formula of fitting line is fitted as follows and R2 = 0.7385:
Kt = 0.0126 t + 0.1755
The parameters involved in the study are listed in Table 1.

4. Discussion

4.1. Comparison with Forest Standard of China

Chinese loess is important in local research on hydrology, geology, and agriculture. Thus, some guidelines about Chinese loess have been published, such as the Forest Standard of China LY/T 1218-1999 (Determination of forest soil percolation rate). This certification included information and guidelines about the relationship between K10 and Kt [31]. The formulation included in the certification (CNSE) is an empirical formula, and is described as follows:
Kt = K10 (0.7 + 0.03 t)
Fitting CNSE to the experimental data by the least square method, K10 = 0.337 mm/min was obtained, and R2 = 0.739. The fitting lines of CNSE are drawn in Figure 4.
It can be seen from Figure 4. that the CNSE fitting line is very close to the previous fitting line. The slopes of the two lines are 0.0101 and 0.0126 respectively, so the previous fitting line shows that Ks changes with temperature slightly larger than the CNSE fitting line. Within the experimental temperature range, the maximum difference of Ks is 0.04919 mm/min. The relative error is about 16.5% at low temperature and −6.71% at high temperature. Therefore, CNSE as an empirical formula has a satisfactory accuracy.
If K10 is taken as the reference value and the form of CNSE is adopted, Formula (2) can be changed to:
Kt = K10 (0.0583 + 0.4180 t)
where K10 = 0.3015 mm/min.

4.2. Comparison with Another Study Result

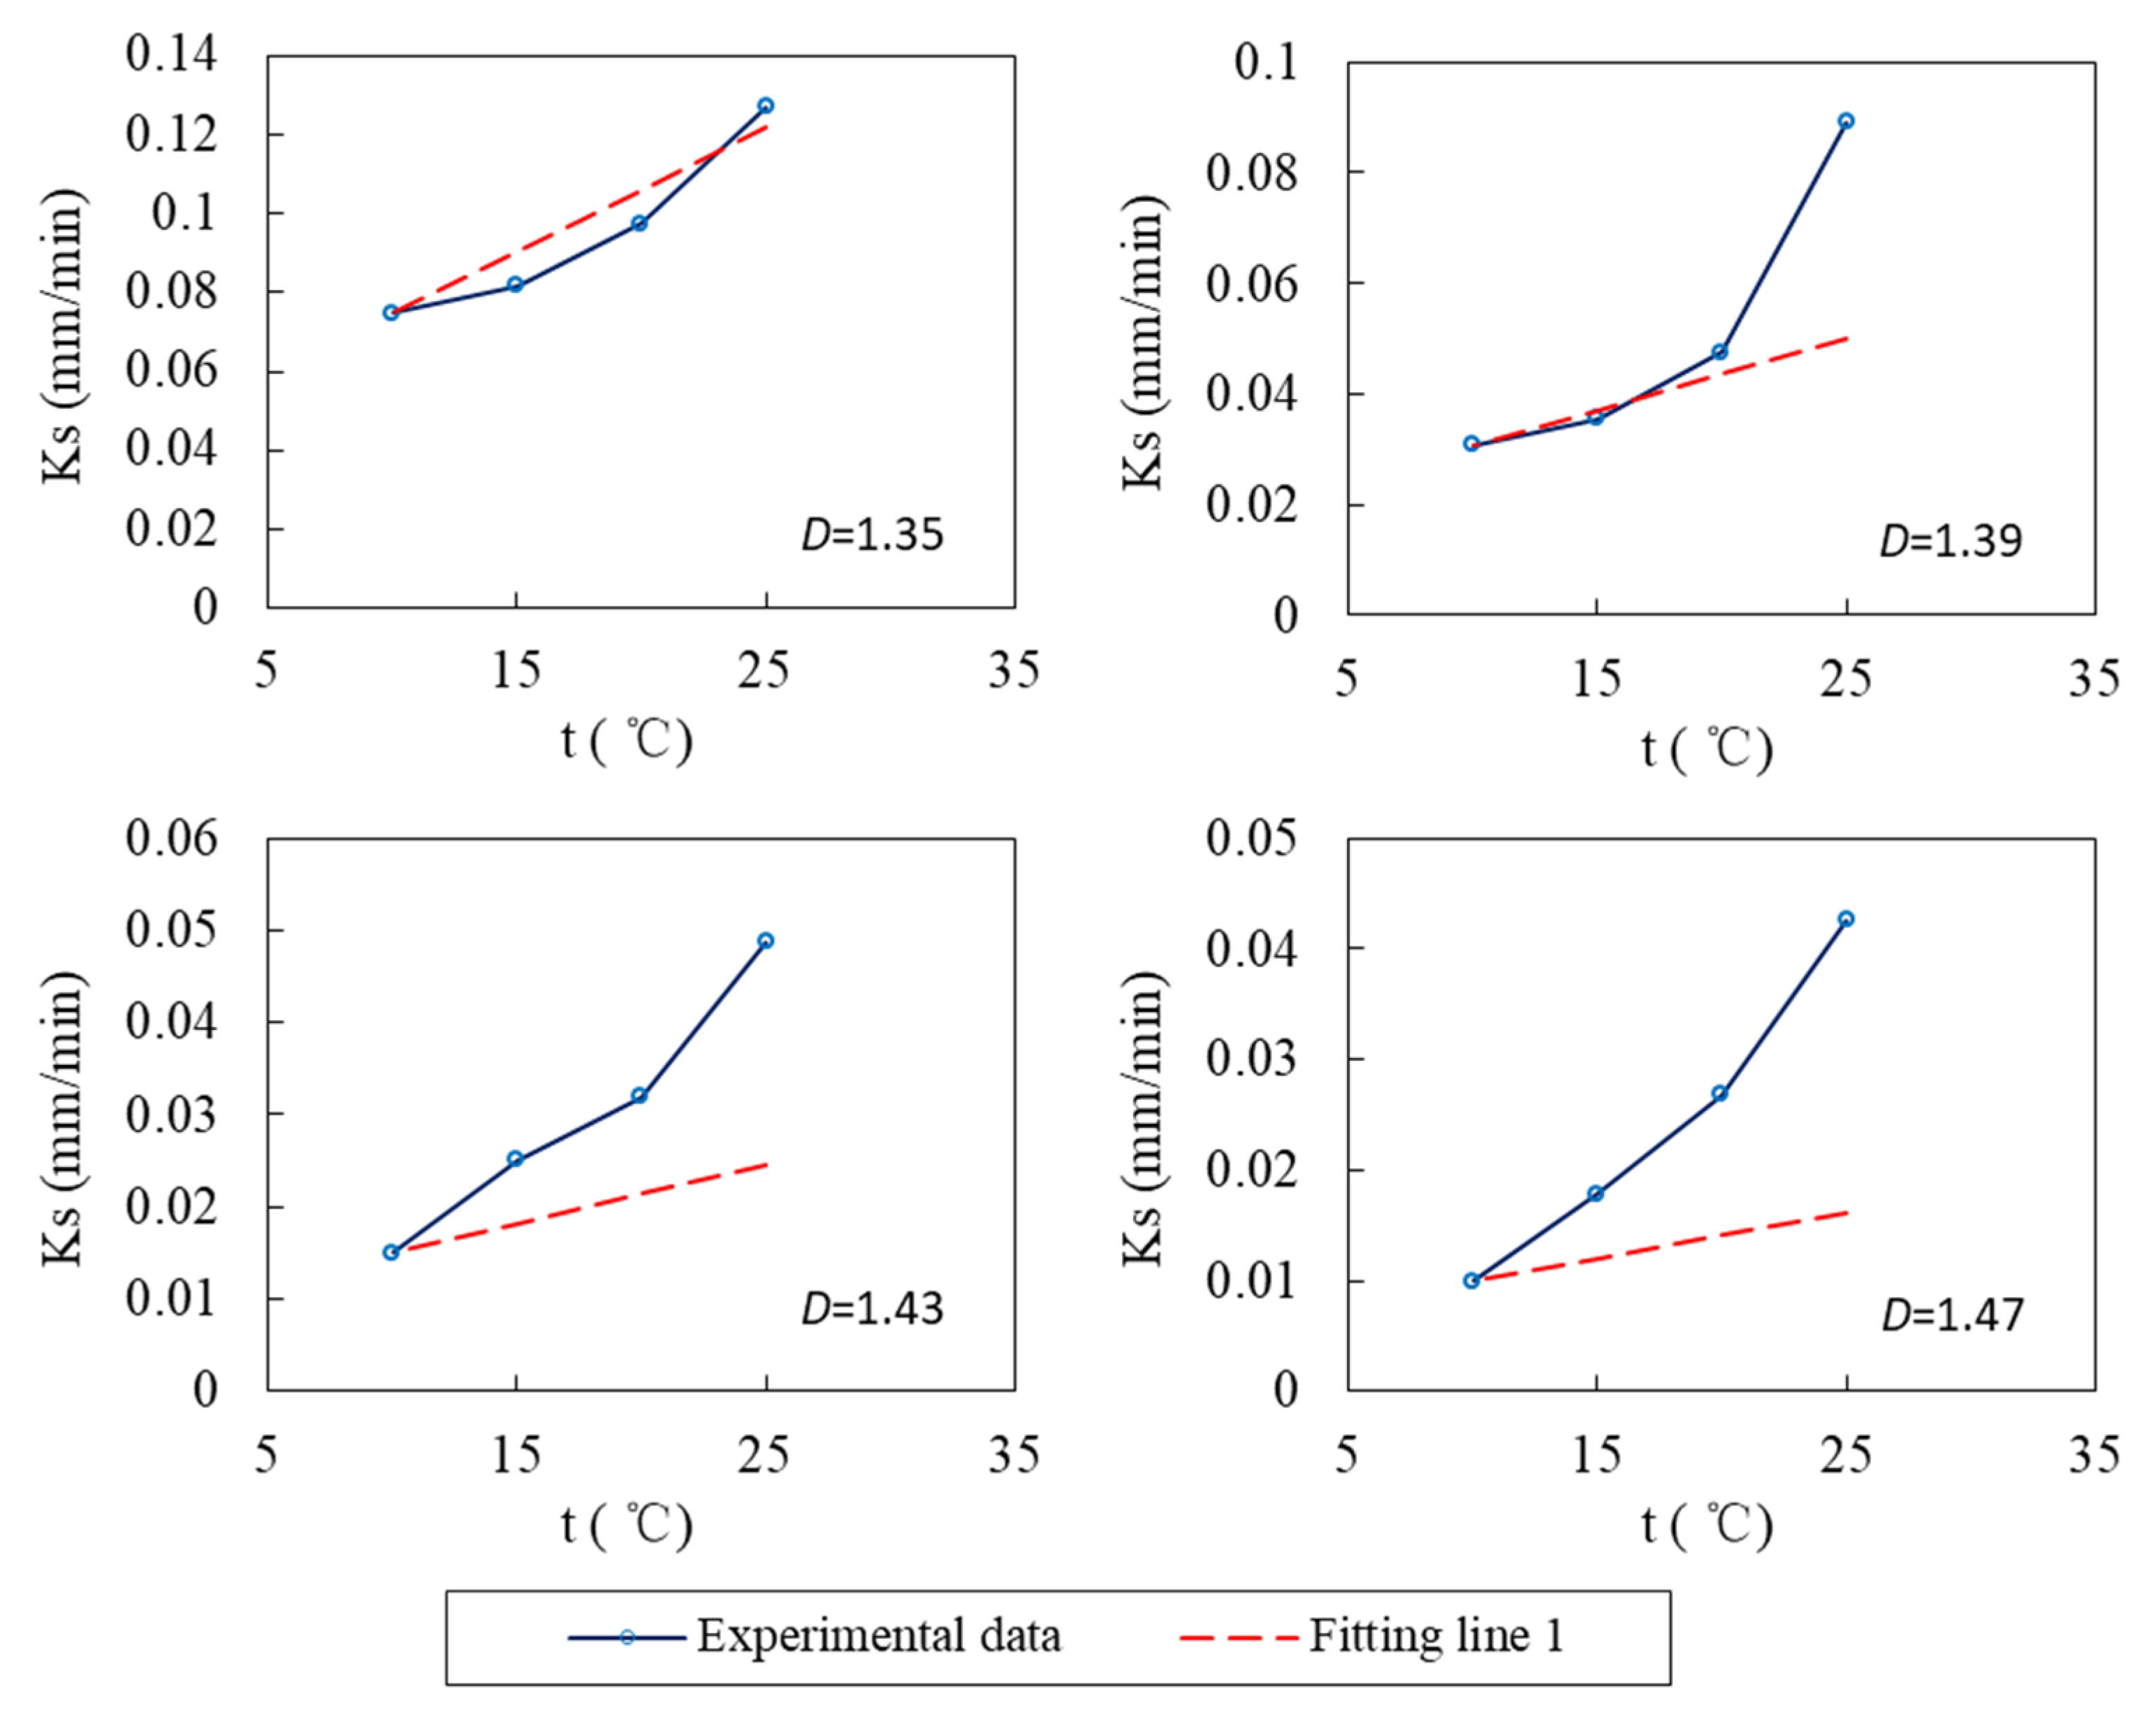
Many studies have shown that there is a positive correlation between temperature and Ks. For example, Ren et al. analyzed the effects of different temperature and soil saturated hydraulic conductivity [32]. The soil samples were also taken from Shanxi Province, China. They described the relationship between temperature and Ks at four different bulk densities D, as shown in Figure 5 The experimental results also show that Ks has an increased tendency with the increase of temperature. Figure 5 shows that Ks increases slowly at a temperature less than 20 °C while it increases rapidly at a temperature larger than 20 °C.
From Figure 5, it is obvious that Ks is affected by D, while changing with temperature. The fitting line 1 is basically close to the experimental data at D = 1.35. Ks rises with the increase of temperature, and increases significantly in excess of 20 °C. Ks is sensitive to D because they have the same trend. However, fitting lines deviate significantly from experimental data under other D (1.39, 1.43 and 1.47). The reason is that Ks passes through the point of K10 and has a slope of 0.4180 K10 according to CNSE. Therefore, the direction of the fitting lines has been fixed, and the fitting result must deviate from the actual data.
Parameters of fitting line 1 are listed in Table 2. From the data of K10 and D, it can also be seen that K10 decreases with the increase of D. In addition, root mean square error (RMSE) changes greatly. The minimum value of RMSE is 0.0095 at D = 1.35, and the maximum value of RMSE is 0.0226 at D = 1.39.
In addition, Ks shows the decrease tendency with the increase of D at the same temperature. The fitting line 1 (D = 1.35) obtained from Formula (2) is satisfactory, However, the fitting results are quite different from the experimental data at D = 1.39, 1.43, or 1.47. The different slope of the fitting line should be used under different D.

4.3. Formula Modification

Considering the influence of D, the model is modified. The formula is improved based on CNSE, and shown as:
Kt = K10 (0.0583 + k(Dt)
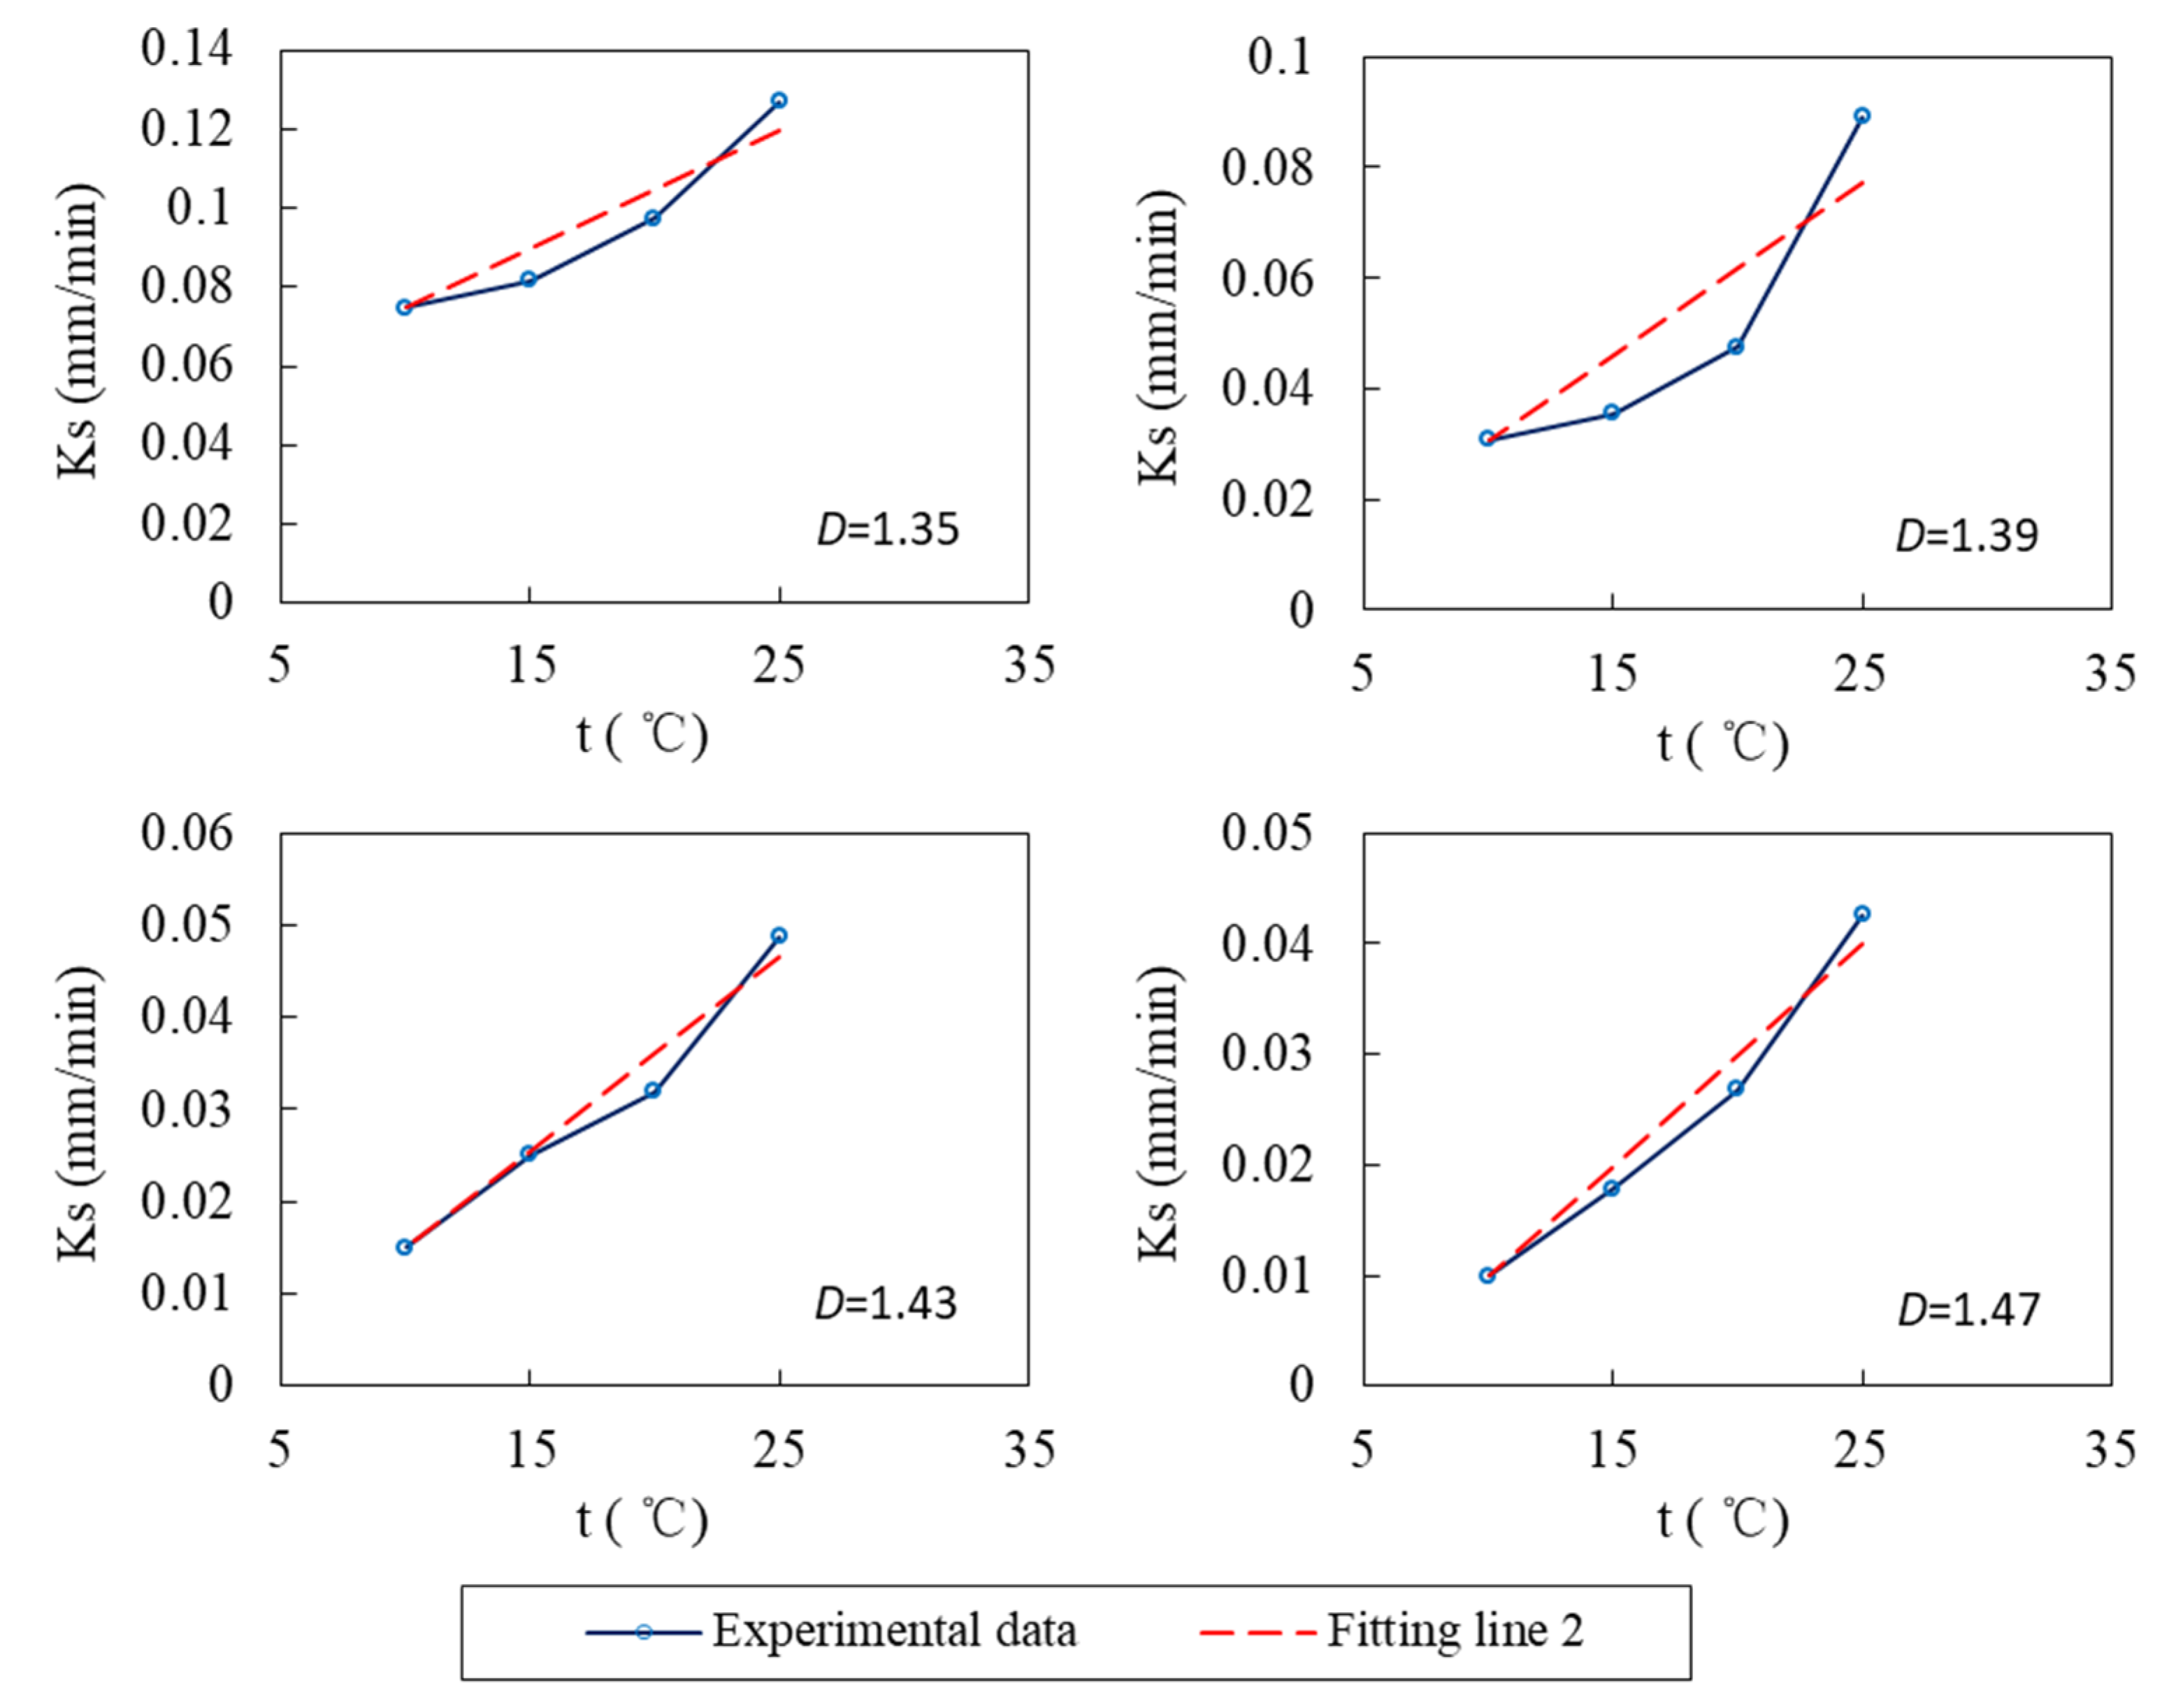
where k(D) is a function of D, which is used to determine the slope of a fitting line. To determine this function, fit the experimental data by Formula (4) and let the fitting line 2 pass through K10. The fitting line 2 is shown as Figure 6.
From Figure 6, it is obvious that fitting line 2 is in good agreement with the experimental data, and their parameters are listed in Table 3. Comparing Table 2 and Table 3, it can be seen that RMSE is significantly reduced. According to the fitting results of Formula (4), the maximum RMSE is only 0.0107, which is far less than the fitting results of Formula (3). Therefore, Formula (4) is more suitable for fitting this experimental data.
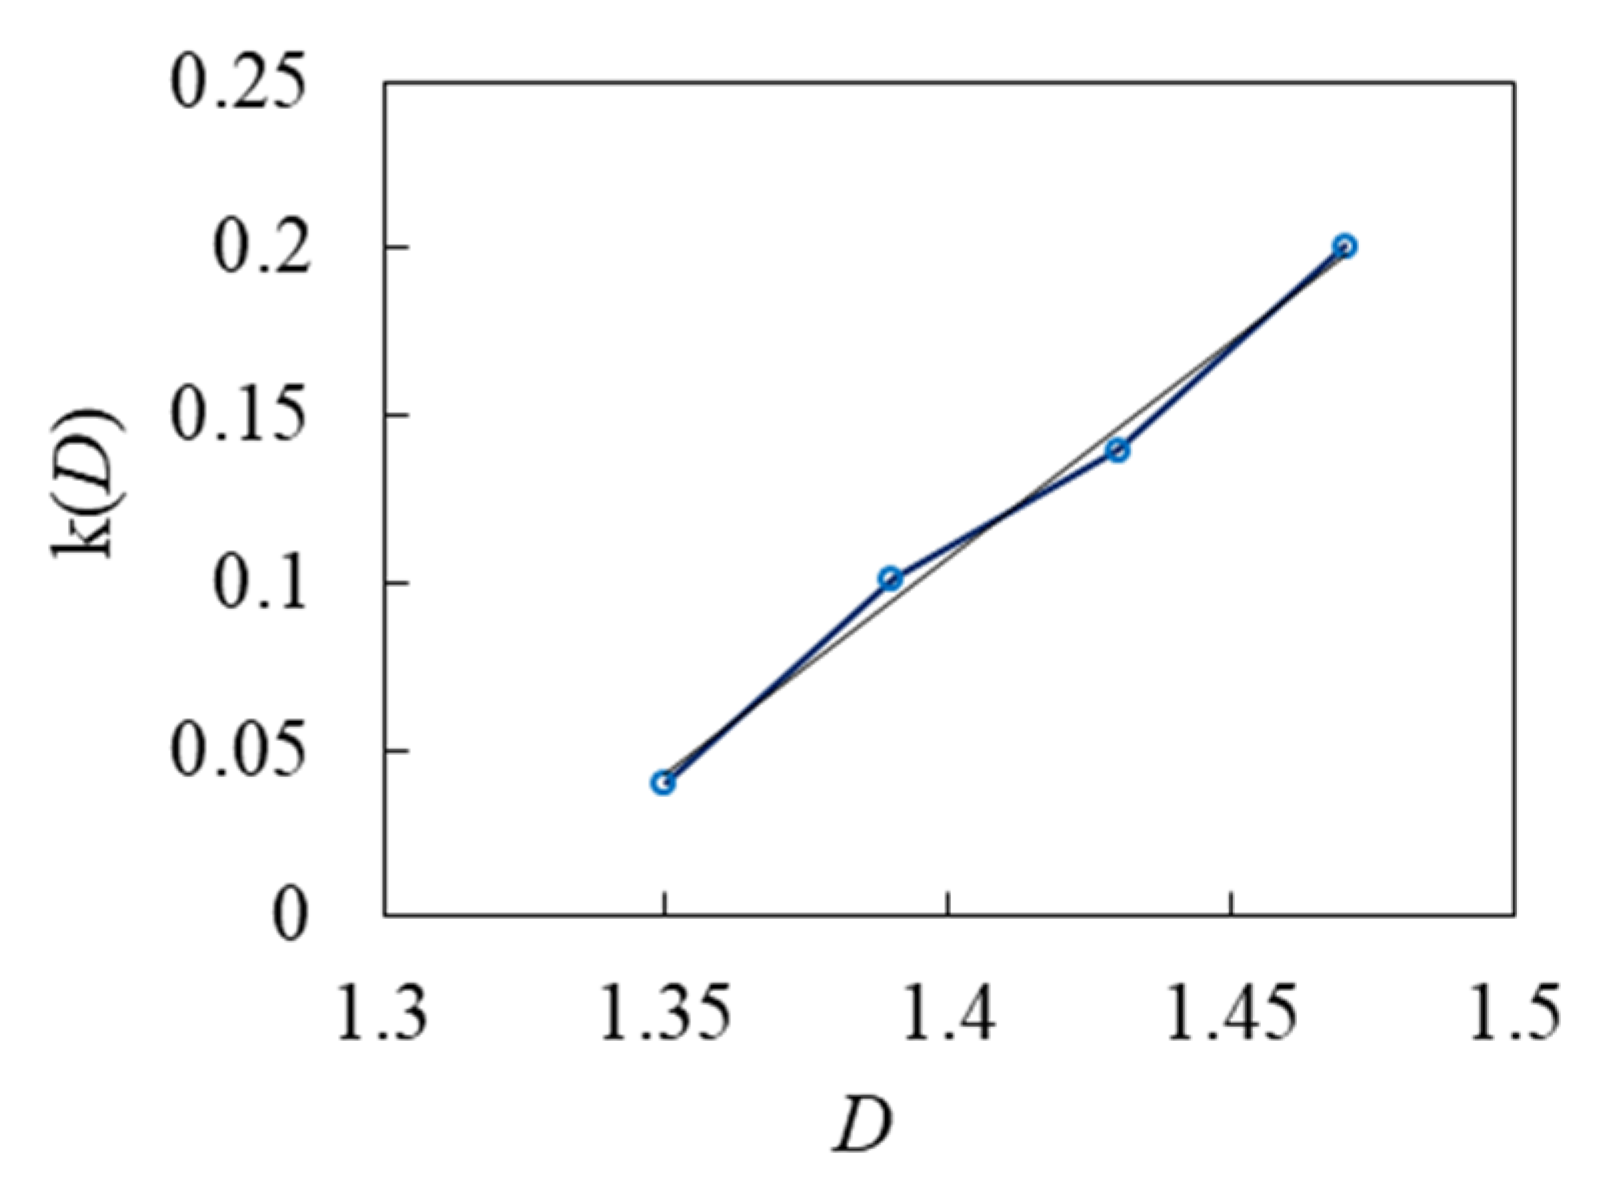
Table 3 also shows that k(D) increases with D. As shown in Figure 7, k(D) and D show an obvious linear relationship. The fitting formula is k(D) = 1.30D − 1.71, and R2 = 0.992.
Therefore, according to the fitting formula k(D) and Formula (4), a comprehensive formula is obtained:
Kt = K10 (0.0583 + 1.30 Dt − 1.71 t)
The improved Formula (5) can be applied to the simulation of saturated water flow under different D and temperatures.

5. Conclusions

Saturated hydraulic conductivity has a special relationship with temperature, but it is not a simple constant. For the loess soil evaluated in this study, Ks increased with temperature from 7 to 44 °C under the assumption that there is no change in chemical properties and soil structure during the experiment. Simulation data obtained by CNSE closely matched the experimental data, so they can all be considered suitable for describing the relationship between Ks and temperature. However, CNSE may be not convenient to apply, if bulk density changes. Ks decreases with the increase of bulk density. An improved formula (Formula (5)) based on CNSE is proposed to adapt to different bulk densities. The fitting results show that the improved formula is applicable to forecast Ks at different bulk densities and temperatures.

Author Contributions

Conceptualization, G.Y.; methodology, L.H.; validation, G.Y.; data curation, Y.X. and H.W.; writing—original draft preparation, G.Y.; writing—review and editing, L.H.; supervision, D.G.; project administration, L.H. and D.G.; funding acquisition, D.G. All authors have read and agreed to the published version of the manuscript.

Funding

This research was funded by the National Natural Science Foundation of China (41807130, U21A20524, 51709195) and the Fundamental Research Program of Shanxi Province (20210302123213).

Institutional Review Board Statement

Not applicable.

Informed Consent Statement

Informed consent was obtained from all subjects involved in the study.

Data Availability Statement

Not applicable.

Conflicts of Interest

The authors declare no conflict of interest.

References

  1. Mohanty, B.P.; Kanwar, R.S.; Everts, C.J. Comparison of saturated hydraulic conductivity measurement methods for a Glacial-Till soil. Soil Sci. Soc. Am. J. 1994, 58, 672–677. [Google Scholar] [CrossRef]
  2. Taiba, A.C.; Mahmoudi, Y.; Hazout, L.; Belkhatir, M.; Baille, W. Evaluation of hydraulic conductivity through particle shape and packing density characteristics of sand-silt mixtures. Mar. Georesour. Geotec. 2019, 37, 1175–1187. [Google Scholar] [CrossRef]
  3. Ye, W.; Wan, M.; Chen, B.; Chen, Y.; Cui, Y.; Wang, J. Effect of temperature on soil-water characteristics and hysteresis of compacted Gaomiaozi bentonite. J. Cent. South Univ. Technol. 2009, 16, 821–826. [Google Scholar] [CrossRef]
  4. Constantz, J.; Stonestrom, D.; Stewart, A.E.; Niswonger, R.; Smith, T.R. Analysis of streambed temperatures in ephemeral channels to determine streamflow frequency and duration. Water Resour. Res. 2001, 37, 317–328. [Google Scholar] [CrossRef]
  5. Jaynes, D.B. Temperature-variations effect on field-measured infiltration. Soil Sci. Soc. Am. J. 1990, 54, 305–312. [Google Scholar] [CrossRef]
  6. Cooper, C.A.; Thomas, J.M.; Lyles, B.F.; Reeves, D.M.; Pohll, G.M.; Parashar, R. A preliminary geochemical description of the geothermal reservoir at Astor Pass, Northern Pyramid Lake, Nevada. Geotherm. Resour. Counc. Trans. 2012, 36, 37–40. [Google Scholar]
  7. Ayenew, T.; Demlie, M.; Wohnlich, S. Application of numerical modeling for groundwater flow system analysis in the akaki catchment, central ethiopia. Math. Geosci. 2008, 40, 887–906. [Google Scholar] [CrossRef]
  8. Gedeon, M.; Mallants, D. Sensitivity analysis of a combined groundwater flow and solute transport model using Local-Grid refinement: A case study. Math. Geosci. 2012, 44, 881–899. [Google Scholar] [CrossRef]
  9. Zhang, F.; Zhang, Y.; Zhang, J. Temperature effect on soil water retention. Acta Pedol. Sin. 1997, 34, 160–169. [Google Scholar]
  10. Cho, W.J.; Lee, J.O.; Chun, K.S. The temperature effects on hydraulic conductivity of compacted bentonite. Appl. Clay Sci. 1999, 14, 47–58. [Google Scholar] [CrossRef]
  11. Cho, W.J.; Lee, J.O.; Kang, C.H. Influence of temperature elevation on the sealing performance of a potential buffer material for a high-level radioactive waste repository. Ann. Nucl. Energy 2000, 27, 1271–1284. [Google Scholar] [CrossRef]
  12. Fremond, M.; Nicolas, P. Macroscopic thermodynamics of porous media. Contin. Mech. Therm. 1990, 2, 119–139. [Google Scholar] [CrossRef]
  13. Zhang, F.C.; Zhang, R.D.; Kang, S.Z. Estimating temperature effects on water flow in variably saturated soils using activation energy. Soil Sci. Soc. Am. J. 2003, 67, 1327–1333. [Google Scholar] [CrossRef]
  14. Hopmans, J.W.; Dane, J.H. Temperature-Dependence of Soil-Water retention curves. Soil Sci. Soc. Am. J. 1986, 50, 562–567. [Google Scholar] [CrossRef]
  15. Gardner, W.R. Solutions of the flow equation for the drying of soils and other porous media. Soil Sci. Soc. Am. Proc. 1959, 23, 183–187. [Google Scholar] [CrossRef]
  16. Huang, Z.; Xu, H.; Bai, Y.; Yang, S. A Theoretical-empirical model to predict the saturated hydraulic conductivity of sand. Soil Sci. Soc. Am. J. 2019, 83, 64–77. [Google Scholar] [CrossRef]
  17. Ming, F.; Chen, L.; Li, D.; Wei, X. Estimation of hydraulic conductivity of saturated frozen soil from the soil freezing characteristic curve. Sci. Total Environ. 2020, 698, 134132. [Google Scholar] [CrossRef]
  18. Chen, L.; Li, D.; Ming, F.; Shi, X.; Chen, X. A fractal model of hydraulic conductivity for saturated frozen soil. Water 2019, 11, 369. [Google Scholar] [CrossRef] [Green Version]
  19. Delage, P.; Sultan, N.; Cui, Y.J. On the thermal consolidation of Boom clay. Can. Geotech. J. 2000, 37, 343–354. [Google Scholar] [CrossRef]
  20. Houston, S.L.; Lin, H.D. A thermal consolidation model for pelagic clays. Mar. Geotechnol. 1987, 7, 79–98. [Google Scholar] [CrossRef]
  21. Ikuo, T.; Pisit, K.; Ichiro, S.; Kanta, O. Volume change of clays induced by heating as observed in consolidation tests. Soils Found. 1993, 33, 170–183. [Google Scholar]
  22. Miller, C.J.; Yesiller, N.; Yaldo, K.; Merayyan, S. Impact of soil type and compaction conditions on soil water characteristic. J. Geotech. Geoenviron. 2002, 128, 733–742. [Google Scholar] [CrossRef]
  23. Vanapalli, S.K.; Fredlund, D.G.; Pufahl, D.E. The influence of soil structure and stress history on the soil-water characteristics of a compacted till. Geotechnique 1999, 49, 143–159. [Google Scholar] [CrossRef] [Green Version]
  24. Huo, L.; Qian, T.; Hao, J.; Liu, H.; Zhao, D. Effect of water content on strontium retardation factor and distribution coefficient in Chinese loess. J. Radiol. Prot. 2013, 33, 791. [Google Scholar] [CrossRef]
  25. Salager, S.; El Youssoufi, M.S.; Saix, C. Effect of temperature on water retention phenomena in deformable soils: Theoretical and experimental aspects. Eur. J. Soil Sci. 2010, 61, 97–107. [Google Scholar] [CrossRef]
  26. Huo, L.; Xie, W.; Qian, T.; Guan, X.; Zhao, D. Reductive immobilization of pertechnetate in soil and groundwater using synthetic pyrite nanoparticles. Chemosphere 2017, 174, 456–465. [Google Scholar] [CrossRef]
  27. Li, M.; Cao, X.; Liu, D.; Fu, Q.; Li, T.; Shang, R. Sustainable management of agricultural water and land resources under changing climate and socio-economic conditions: A multi-dimensional optimization approach. Agric. Water Manag. 2022, 259, 107235. [Google Scholar] [CrossRef]
  28. Yang, G.; Li, M.; Guo, P. Monte Carlo-based agricultural water management under uncertainty: A case study of Shijin irrigation district, China. J. Environ. Inf. 2022, 39, 152–164. [Google Scholar] [CrossRef]
  29. Huo, L.; Qian, T.; Hao, J.; Zhao, D. Sorption and retardation of strontium in saturated Chinese loess: Experimental results and model analysis. J. Environ. Radioact. 2013, 116, 19–27. [Google Scholar] [CrossRef]
  30. Cernicchiaro, G.; Barmak, R.; Teixeira, W.G. Digital interface device for field soil hydraulic conductivity measurement. J. Hydrol. 2019, 576, 58–64. [Google Scholar] [CrossRef]
  31. State Forestry Administration of China. Environmental Monitoring Method Standards-Soil Environment and Solid Waste, LY/T 1218-1999, 1st ed.; Chinese Standard Press: Beijing, China, 1999; p. 3.
  32. Ren, R.; Ma, J.; Sun, X.; Guo, X.; Zhang, K.; Fei, X. Experimental study on influence of system temperature and soil volume mass on saturated hydraulic conductivity under water-storage pit irrigation. Water Sav. Irrig. 2014, 3, 5–8. [Google Scholar]
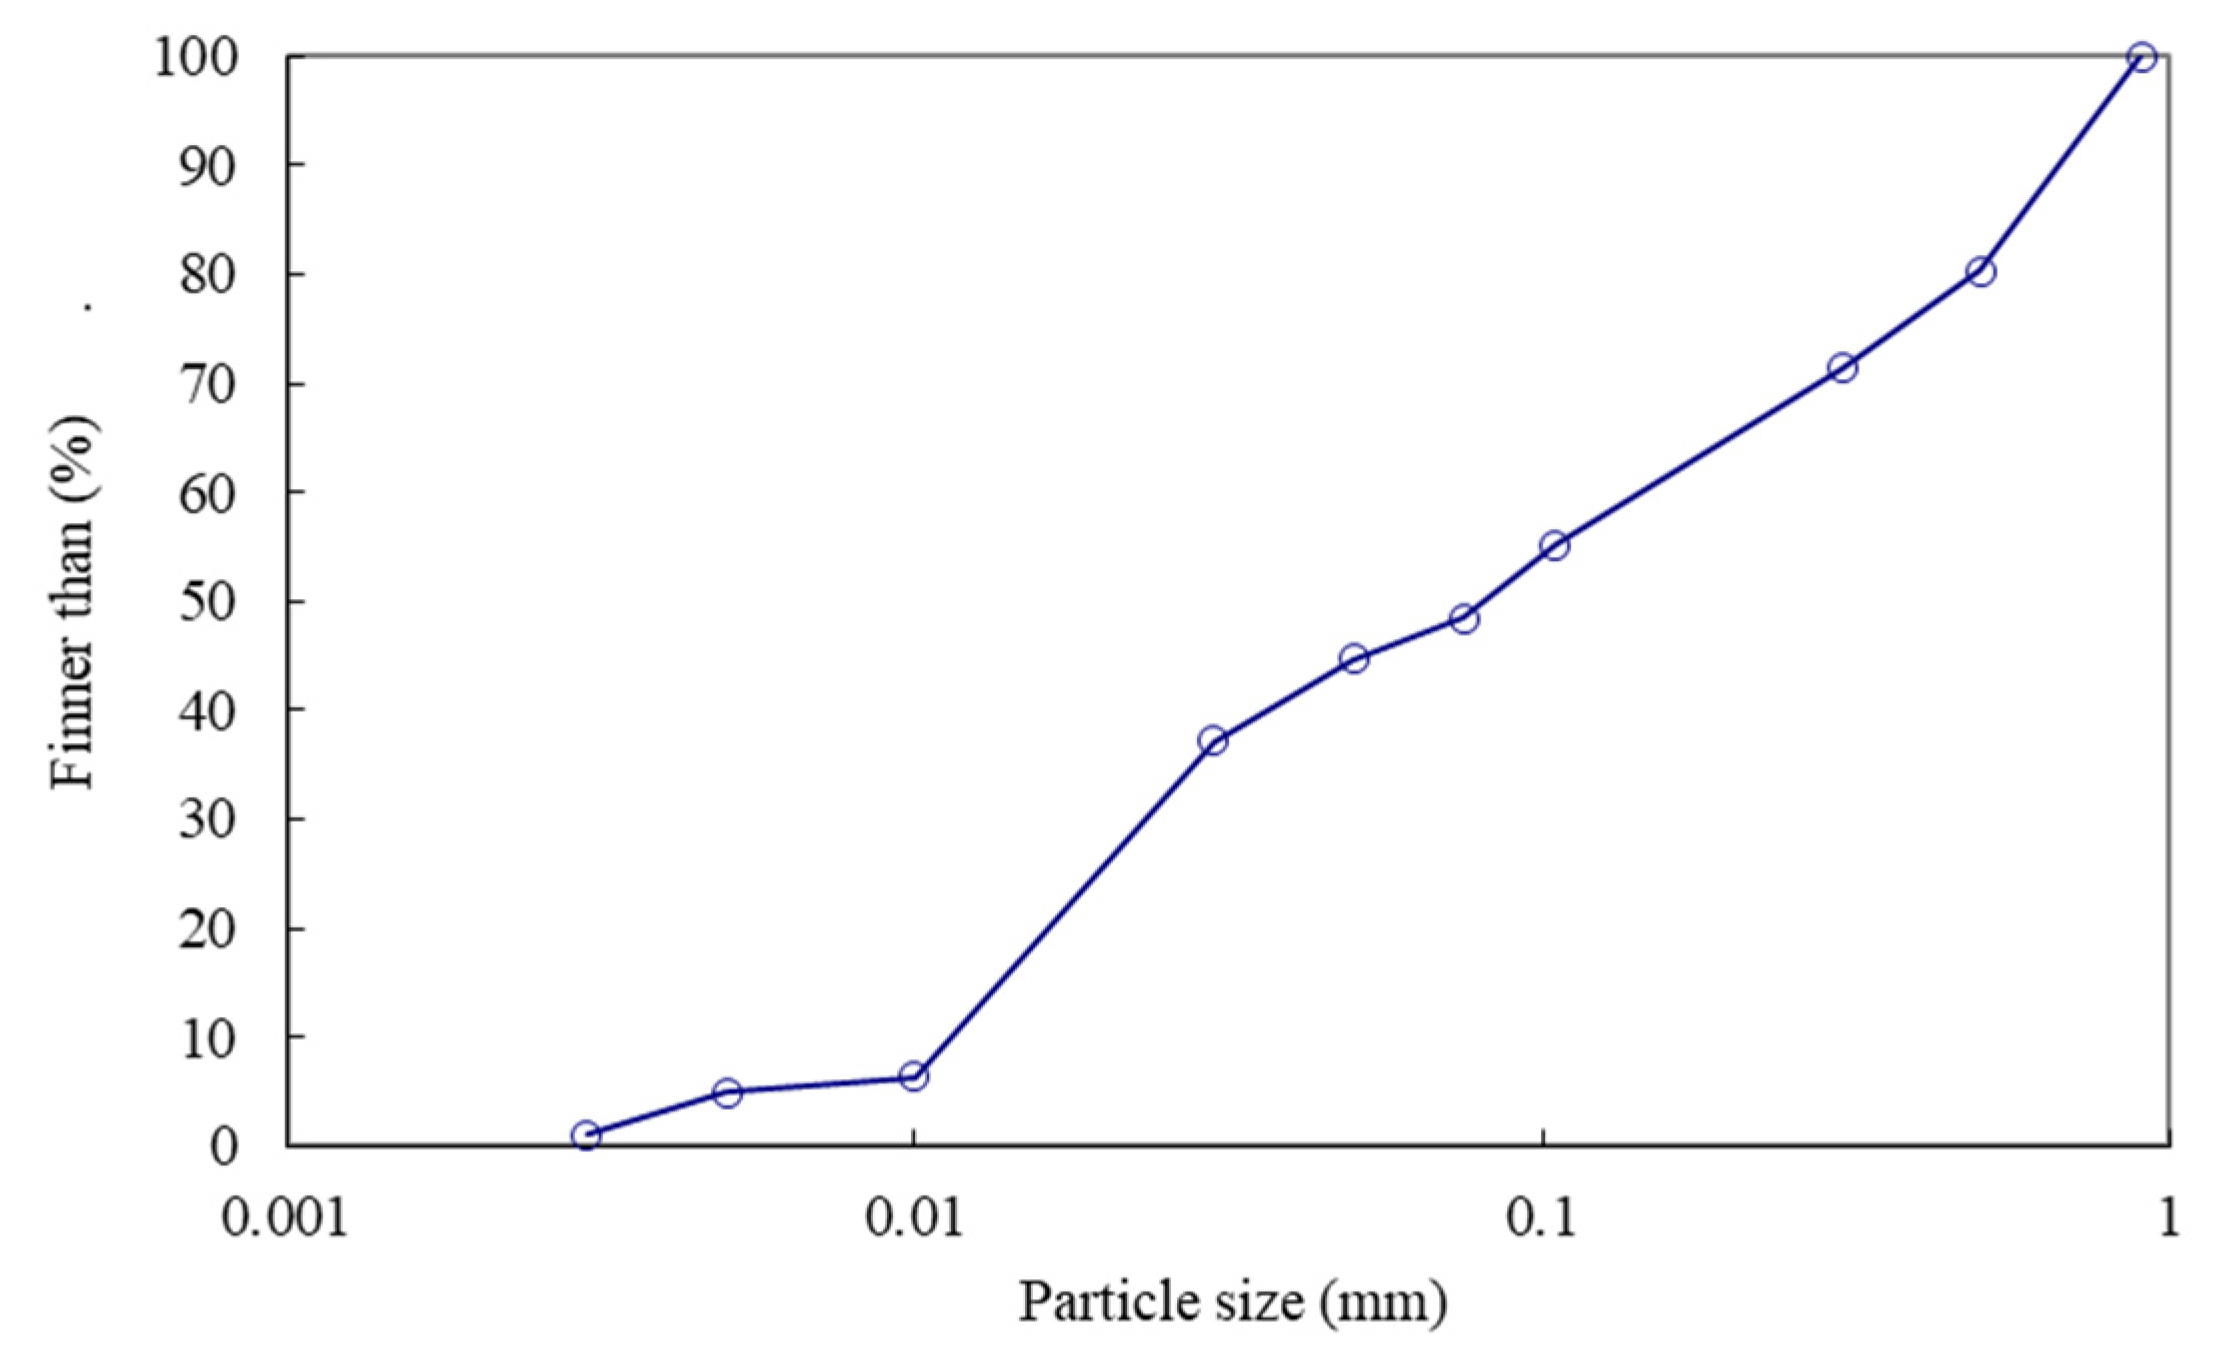
Figure 1. Particle size distribution of the experimental soil.
Water 14 01327 g001
Figure 2. A schematic diagram of experimental apparatus used to measure Ks at different temperatures.
Water 14 01327 g002
Figure 3. Experimental data and fitting curves. The dots represent experimental data, the abscissa refers to water temperature (°C), and the ordinate refers to Ks (m/s). The solid line represents the fitting line. The upper and lower dashed lines represent the 95% confidence interval.
Water 14 01327 g003
Figure 4. Experimental data and CNSE fitting line. The solid line represents the fitting line. The dashed line represents the CNSE fitting line.
Water 14 01327 g004
Figure 5. Experimental data and CNSE fitting line (fitting line 1) at different D.
Water 14 01327 g005
Figure 6. Experimental data and fitting line 2 at different D.
Water 14 01327 g006
Figure 7. Relationship between k(D) and D.
Water 14 01327 g007
Table 1. Parameters and their significance.
ParameterSignificanceUnit
KsSoil saturated hydraulic conductivitymm/min
KtSoil saturated hydraulic conductivity at t °Cmm/min
K10Soil saturated hydraulic conductivity at 10 °Cmm/min
tSoil water temperature°C
DBulk densityg/cm3
Table 2. Parameters of fitting line 1.
D (g/cm3)Fitting Line 1K10 (mm/min)RMSE
1.35Ks = 0.0435 + 0.0031 t0.07480.0095
1.39Ks = 0.0179 + 0.0013 t0.03070.0226
1.43Ks = 0.0088 + 0.0006 t0.01510.0153
1.47Ks = 0.0058 + 0.0004 t0.01000.0160
Table 3. Parameters of fitting line 2.
D (g/cm3)Fitting Line 2K10 (mm/min)k(D)RMSE
1.35Ks = 0.0448 + 0.0030 t0.07480.04010.0065
1.39Ks = −0.0003 + 0.0031 t0.03070.10100.0107
1.43Ks = −0.0059 + 0.0021 t0.01510.13930.0024
1.47Ks = −0.0100 + 0.0020 t0.01000.20080.0023
Publisher’s Note: MDPI stays neutral with regard to jurisdictional claims in published maps and institutional affiliations.