
Review of the Ecosystem Services of Temperate Wetlands and Their Valuation Tools


Abstract
:1. Introduction
1.1. Definitions and Objectives
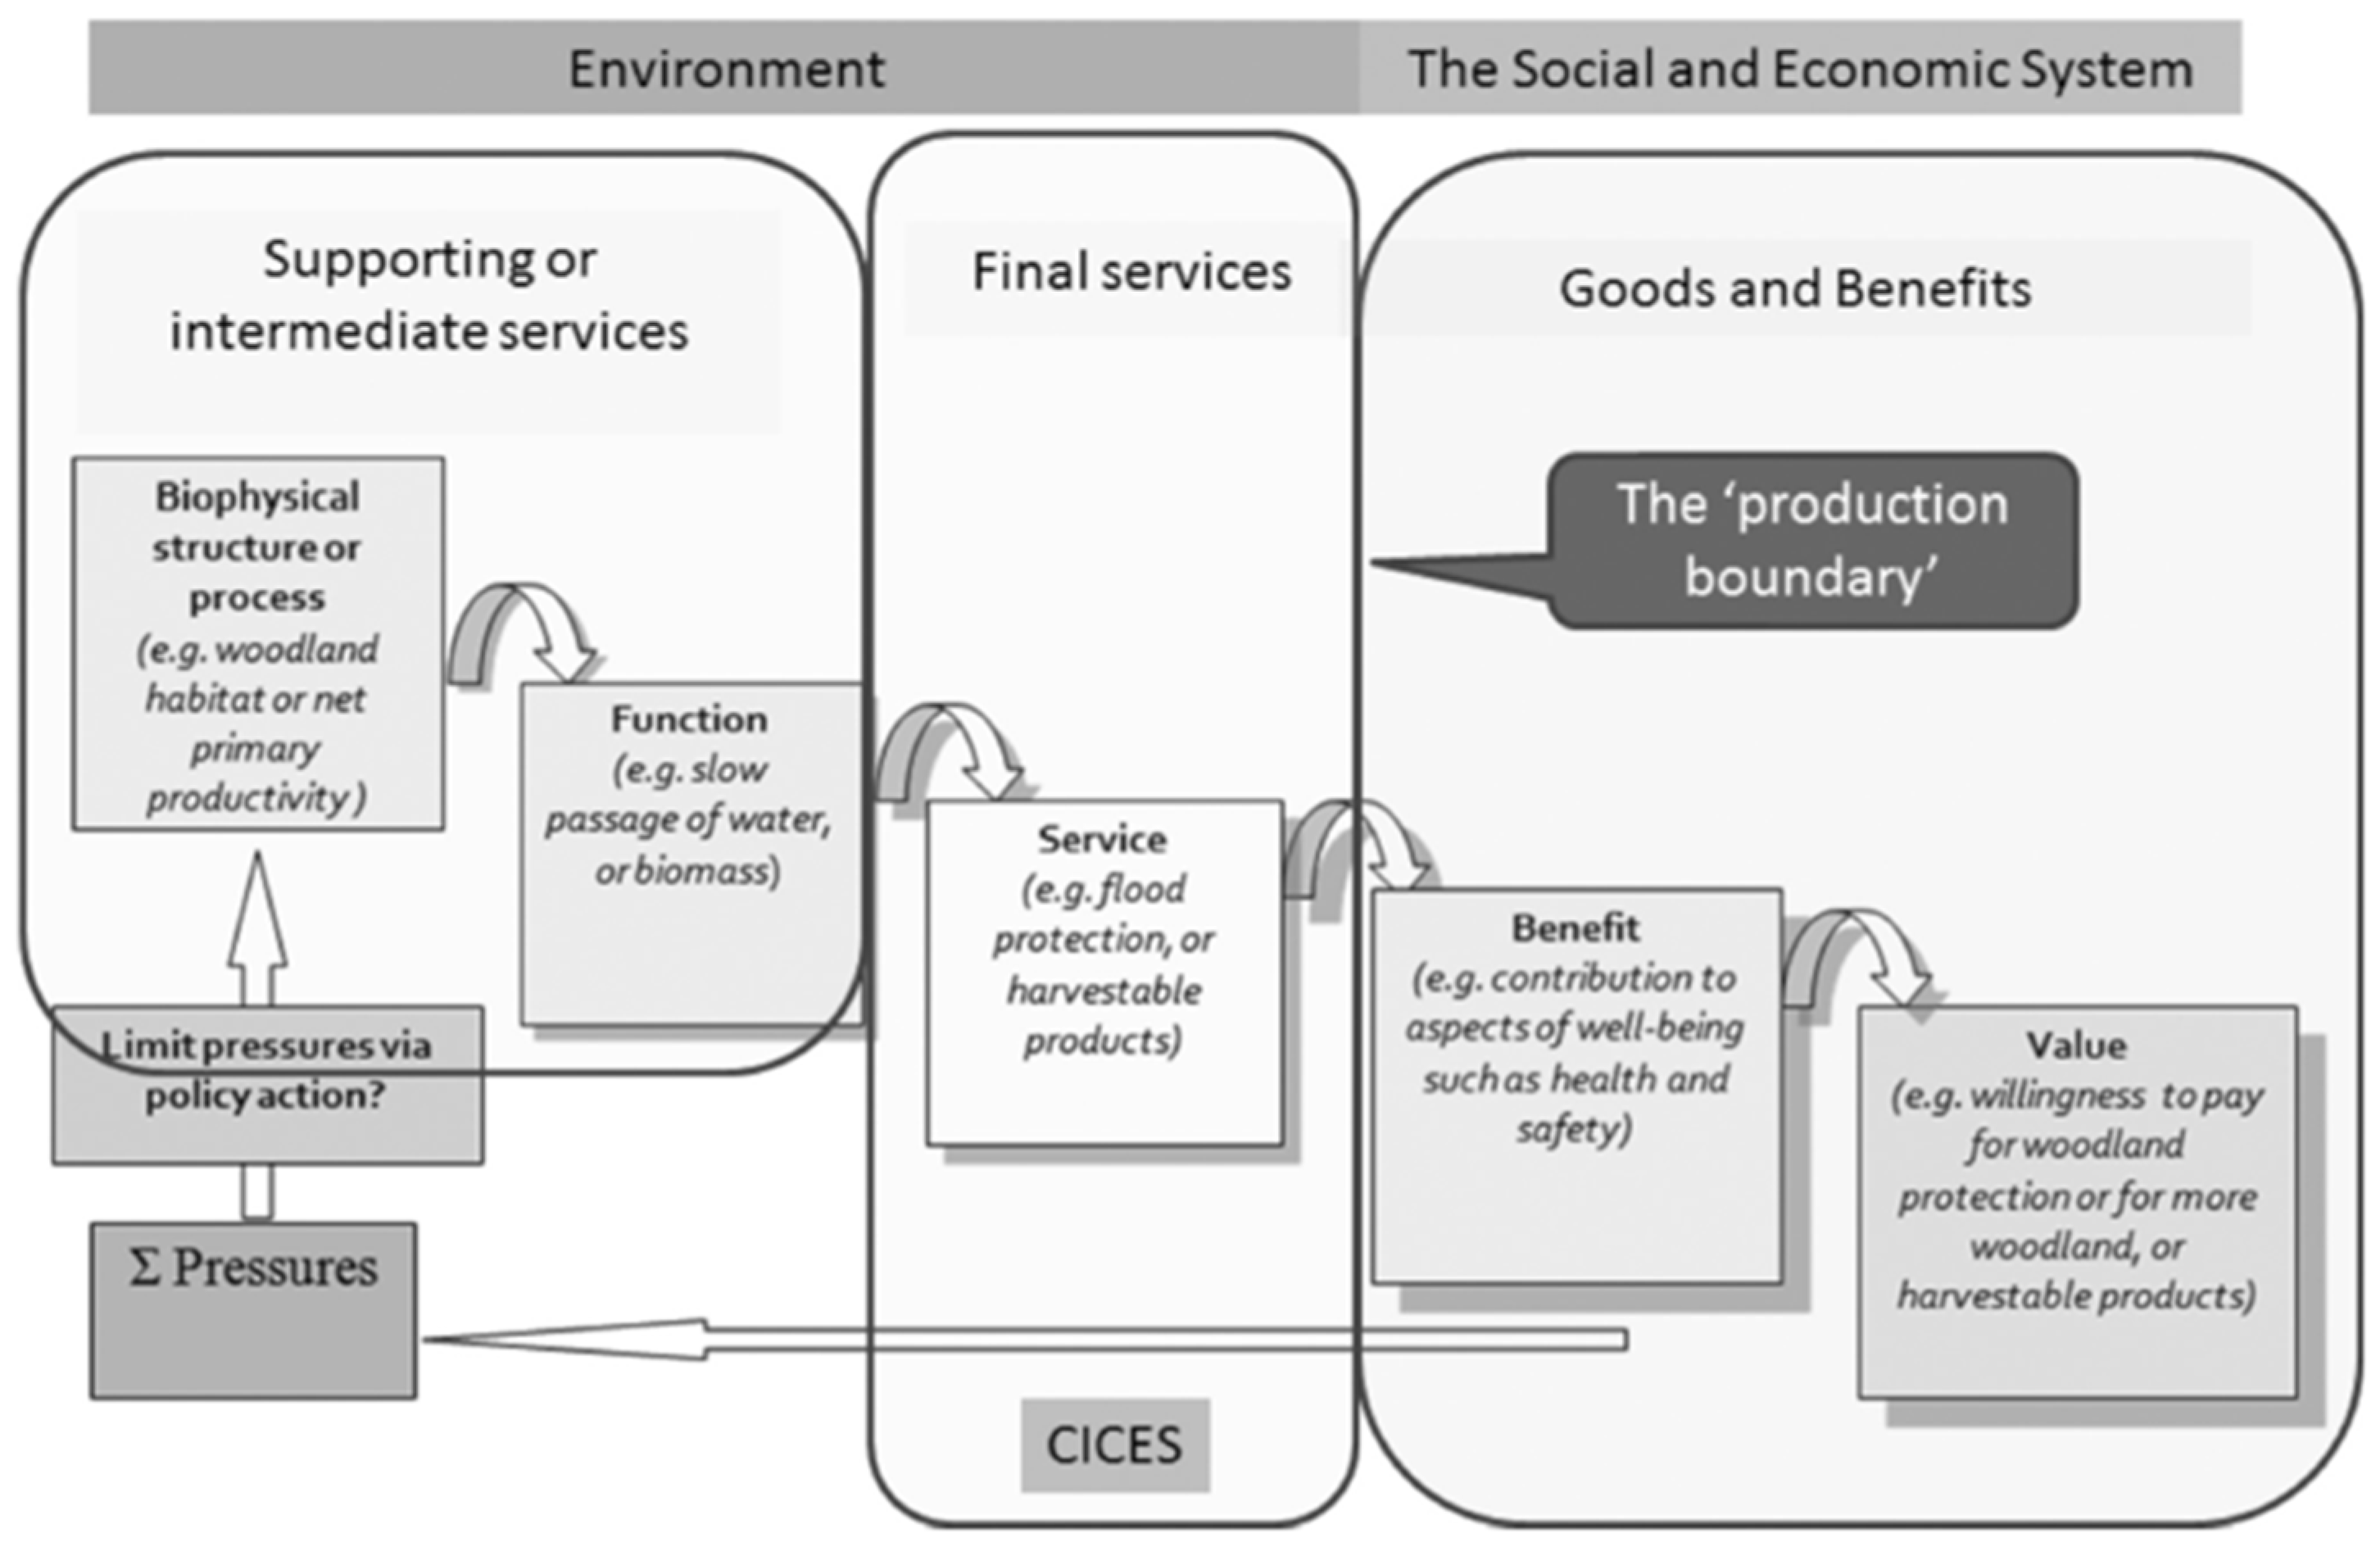
1.2. ES Definition
1.3. Quantification and Valuation of ES
- Social value: benefits are received by a group, not an individual. Examples are improved water quality and flood protection.
- Option value: the value for the conservation of a public asset or service even if it is not likely that it will be used and ensuring future availability.
- Existence value: the value deriving from the simple knowledge that the valued resource exists, even if it will never be used.
- Altruistic value: the value of ecosystems to others.
- Bequest value: the value associated with the satisfaction of preserving natural or cultural heritage for future generations.
1.3.1. Market Prices
1.3.2. Cost-Based Methods
1.3.3. Stated Preference Approaches (Contingent Valuation and Choice Modelling)
1.3.4. Revealed Preference Methods
1.3.5. Production Function
1.3.6. Value Transfer
1.3.7. Valuation Tools Used for the Different ES
2. Methods for the Analysis of the Literature on ES Quantification and Valuation
- Year of publication (see Figure 2)
- Author
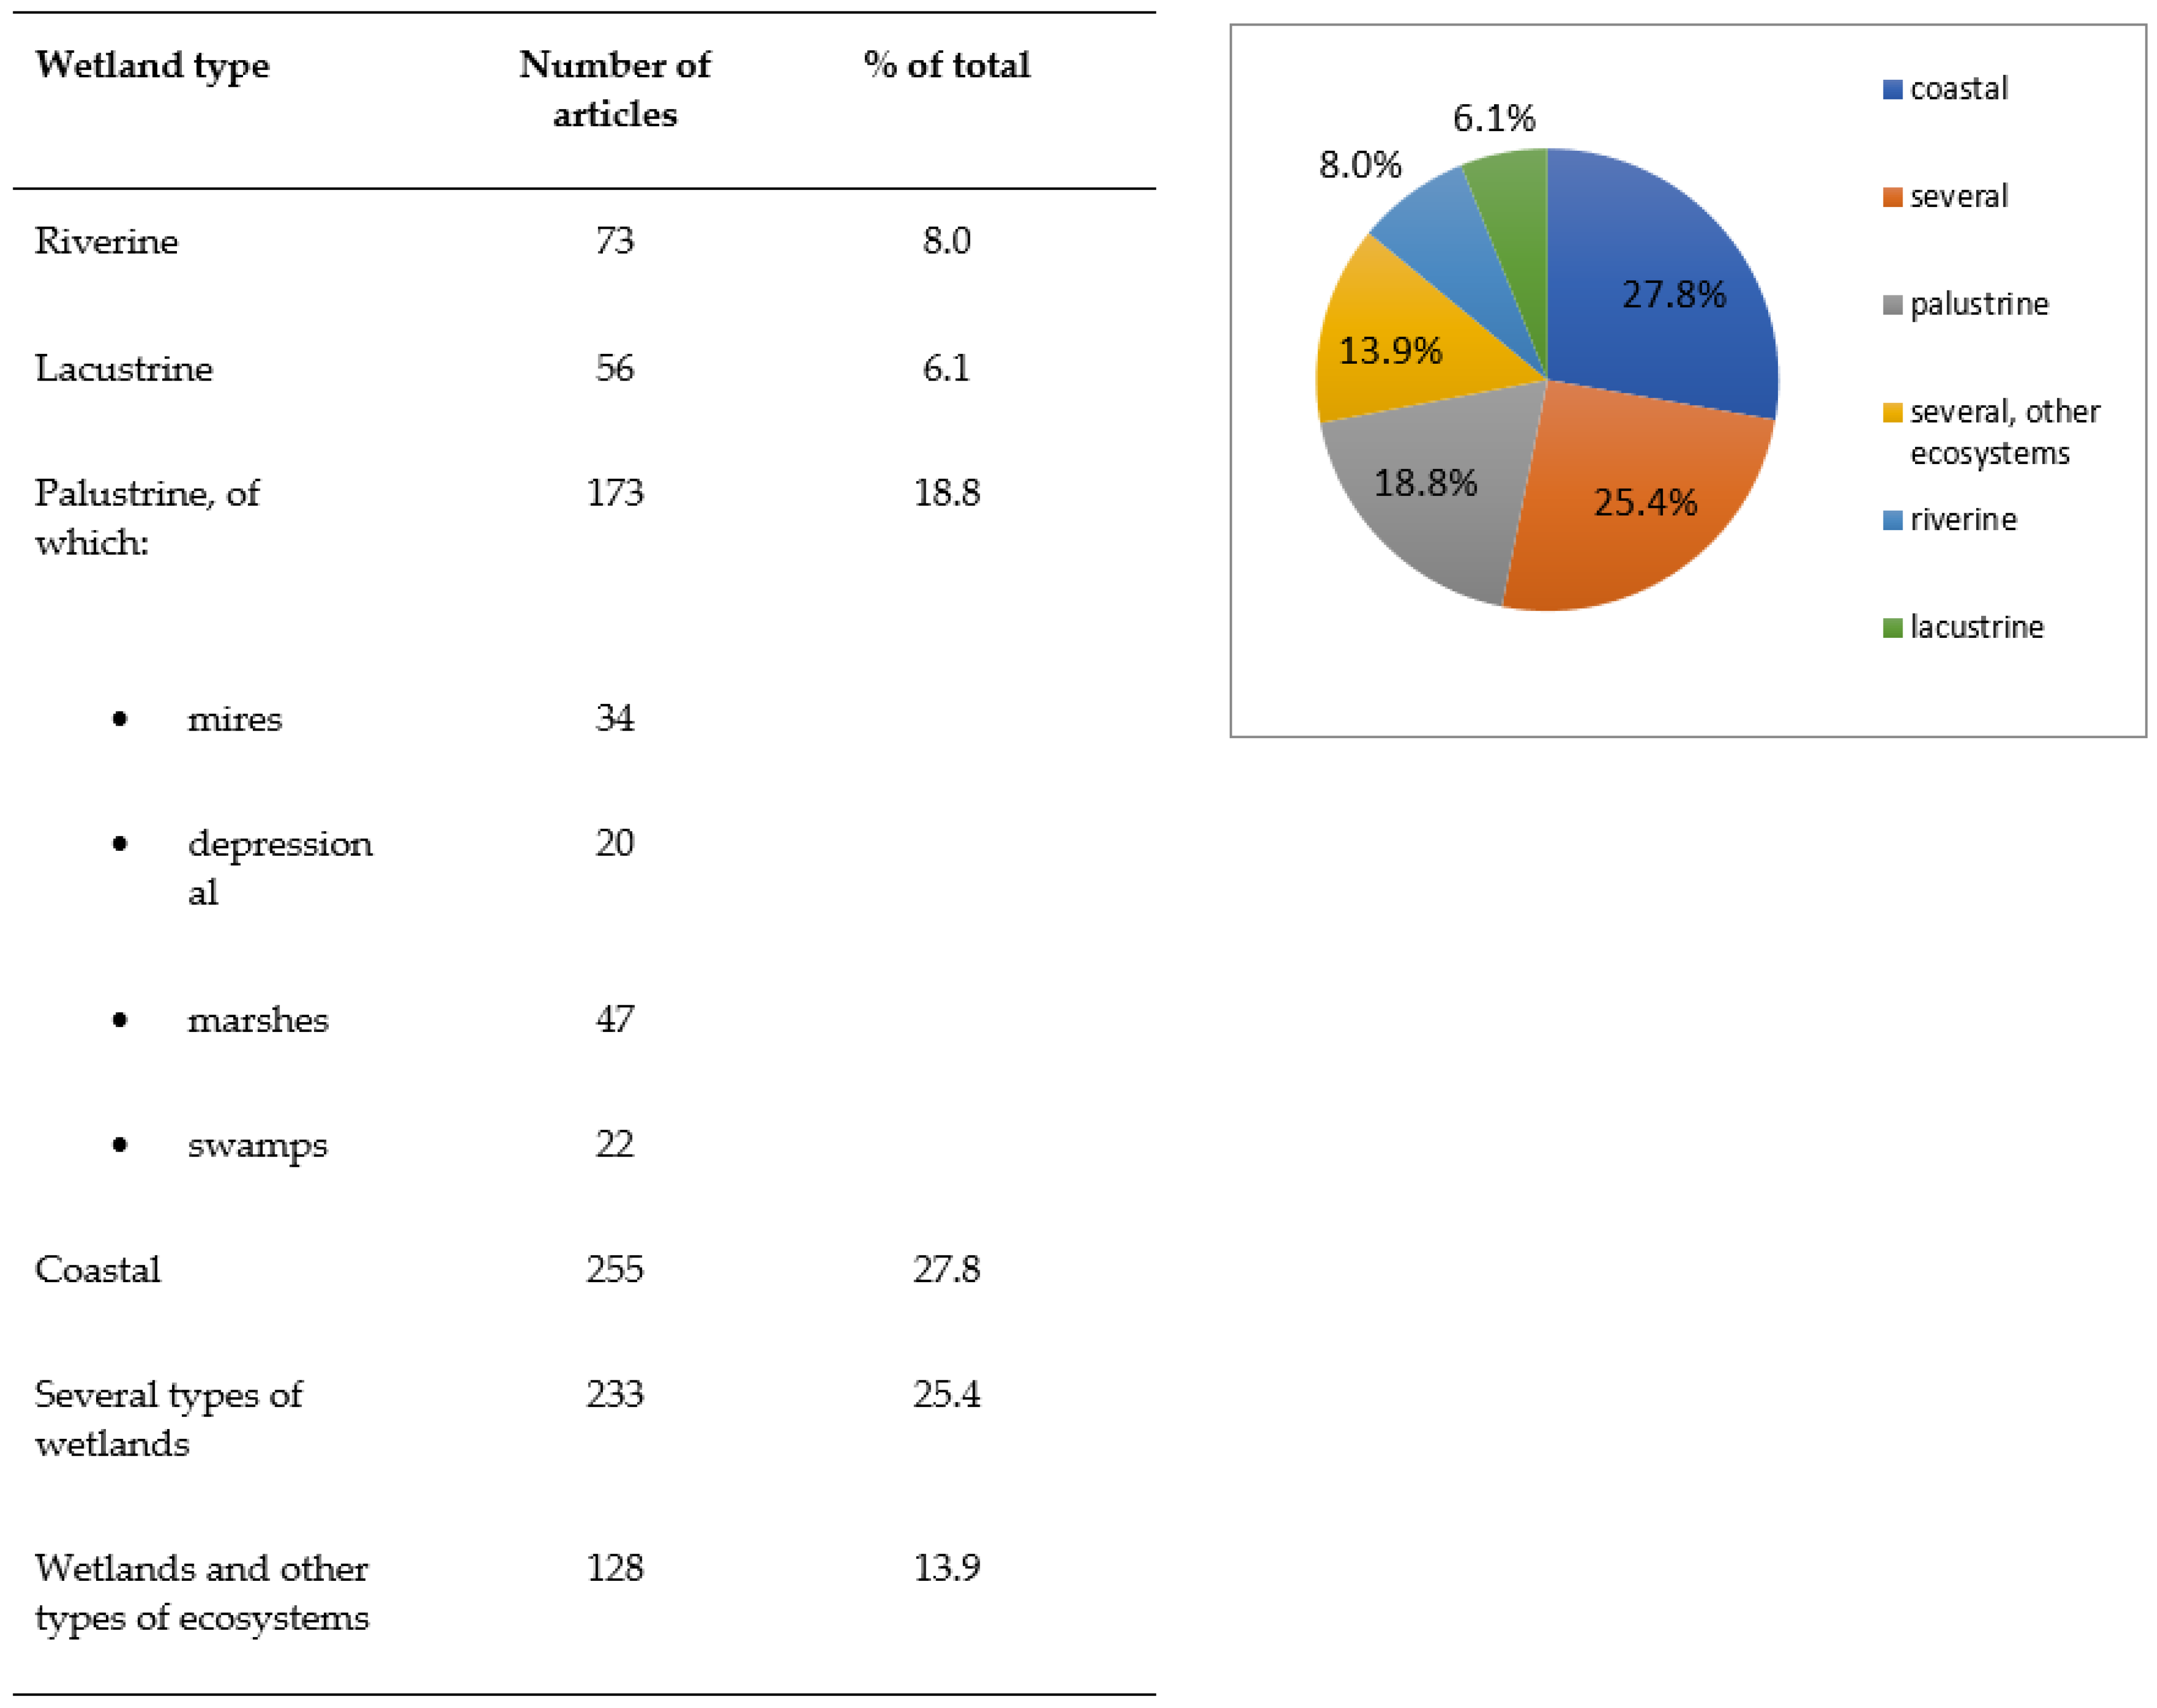
- Typology of wetland
- Country where the studied wetland was located (see Figure 4)
- Typology of studyThis included a simple quantification/valuation of one or more ES, review papers, evaluation of policies and restoration plans, ES interactions and trade-offs, land use and climate change effects, articles on valuation methodology, changes in ES over space and time, payment for ecosystem services (PES), ES value change over time, and scenario comparison (see Figure 5).
- Data usedThe data used in ES studies has been classified as “primary” where the biophysical or value information was gathered directly by researchers. When information was retrieved from old studies, or indirectly, literature data, land-use maps, remote sensing maps, and photographs were used (see Figure 6).
- ES analysedFollowing the CICES classification the various provisioning, regulating and cultural ES were identified. (see Figure 7).
- Valuation techniquesThese were either economic or ecological methods (see Figure 8).
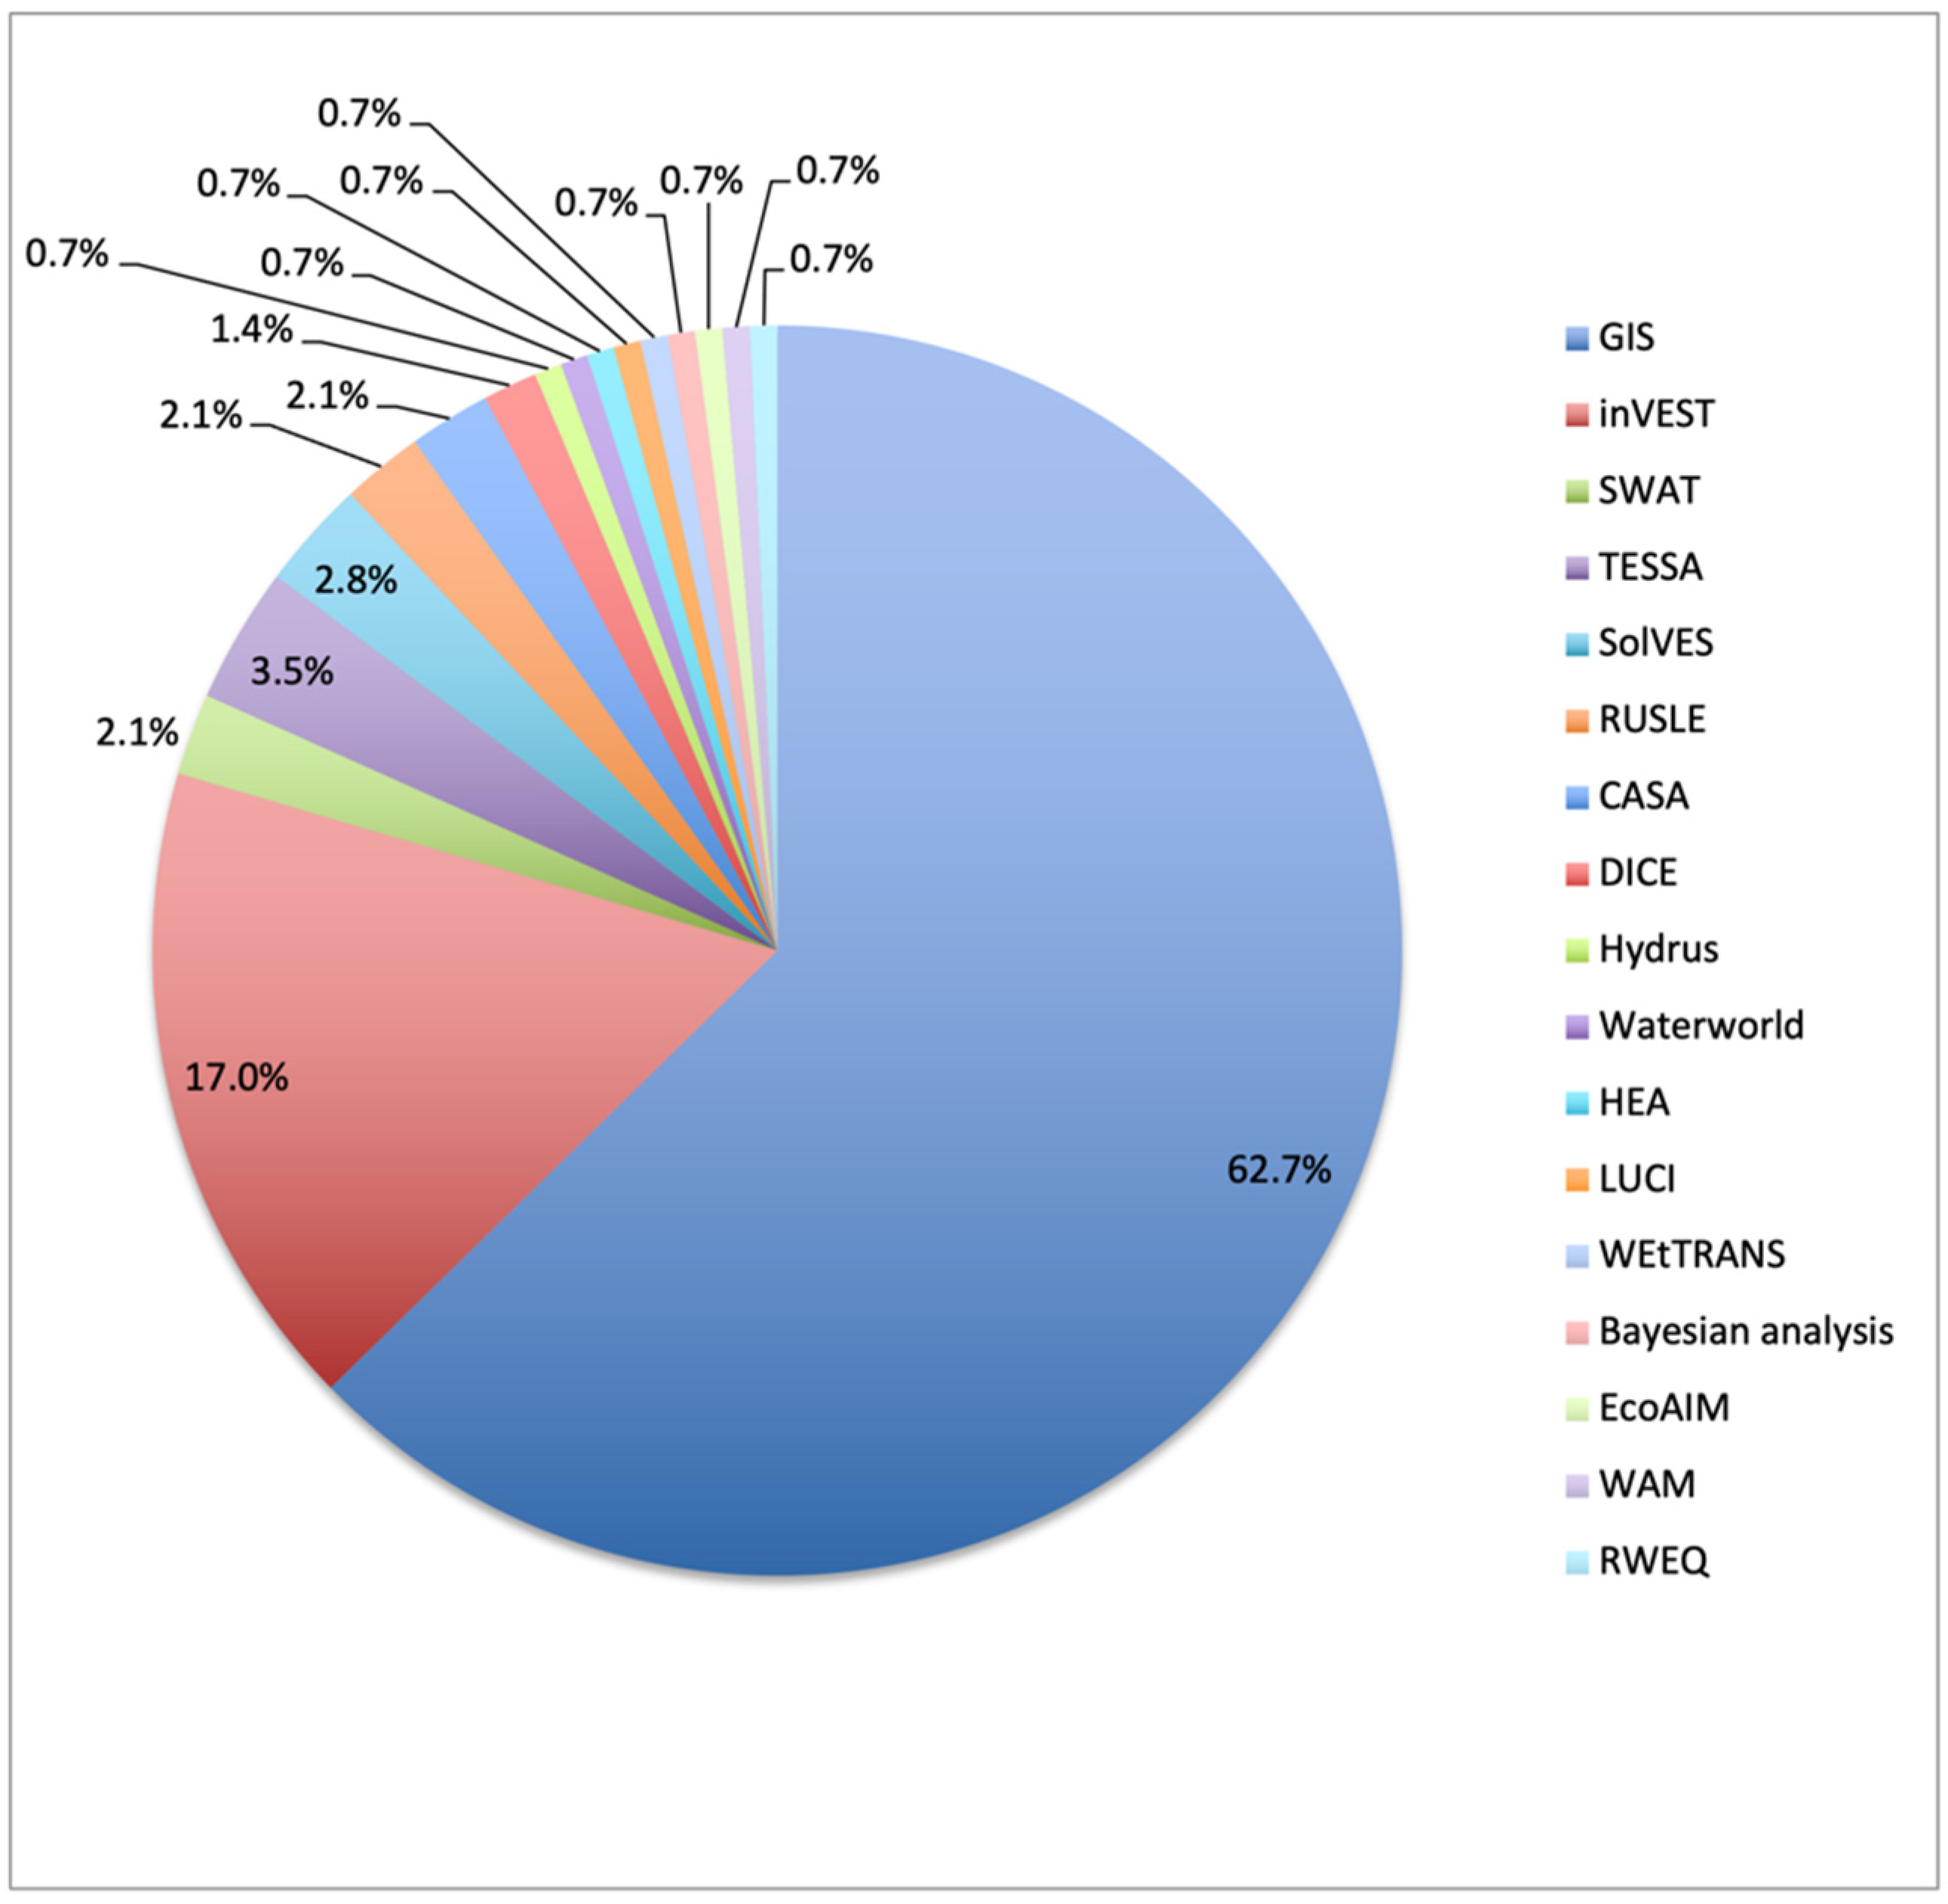
- Software tools used (see Figure 9).
3. Results
3.1. Quantitative Results
3.2. Summary of the Literature
3.3. ES of Intermittent Karst Wetlands
3.3.1. Description of Intermittent Karst Wetlands (Poljes and Turloughs)
3.3.2. Existing ES Studies on Intermittent Karst Wetlands
4. Discussion
4.1. Findings from This Study
4.2. ES Provided by Intermittent Karst Wetlands
4.3. Overall Perspectives on the Valuation of Wetland ES
5. Conclusions
Author Contributions
Funding
Institutional Review Board Statement
Informed Consent Statement
Data Availability Statement
Conflicts of Interest
Abbreviations
| ES | Ecosystem Services |
| PES | Payments for Ecosystem Services |
| MEA | Millennium Ecosystem Assessment |
| CICES | Common International Classification for Ecosystem Services |
| TEEB | The Economics of Ecosystems and Biodiversity |
| UKNEA | The UK National Ecosystem Assessment |
| MAES | Mapping of Ecosystems and their Services |
| TEV | Total Economic Value |
| HPM | Hedonic Pricing Method |
| CV | Contingent Valuation |
| DE | Defence Expenditures |
| MA | Market Analysis |
| PF | Production Function |
| RC | Replacement/Restoration Costs |
| TC | Travel Cost |
| WEI | Water Exploitation Index |
| GIS | Geographic Information Systems |
| GWDTE | Groundwater Dependent Terrestrial Ecosystems |
| WFD | Water Framework Directive |
| EU | European Union |
| SAC | Special Area of Conservation |
| WTP | Willingness To Pay |
| InVEST | Integrated Valuation of Ecosystem Services and Tradeoffs |
Appendix A

| Software Tool Acronym | Description | Applications |
|---|---|---|
| GIS | Geographic Information Systems | Mapping of ES. The most used are ArcGIS and QGIS |
| inVEST | Integrated Valuation of Ecosystem Services and Tradeoffs | Modular open source ecosystem service mapping and valuation models accessed through GIS [83] |
| SWAT | Soil and Water Assessment Tool | Small watershed to river basin-scale model used to simulate the quality and quantity of surface and ground water and predict the environmental impact of land use, land management practices, and climate change [91] |
| TESSA | Toolkit for Ecosystem Service Site-Based Assessment | PDF manual that provides accessible guidance and low-cost methods to evaluate the benefits people receive from nature at particular sites [92] |
| SolVES | Social Values for Ecosystem Services | ArcGIS toolbar for mapping social values for ES based on survey data or value transfer [93] |
| RUSLE | Revised Universal Soil Loss Equation | Erosion models used to estimate erosion from rainfall and overland flow [94] |
| CASA | Carnegie-Ames-Stanford Approach | Model based on the Light Use Efficiency (LUE) index |
| DICE | Climate sensitivity of disturbance regimes and implications for forest ecosystem management | Model of sensitivity of forests to climate change |
| Hydrus | Hydrus simulates the one-, two- or three--dimensional movement of water, heat and multiple solutes in variably saturated media [95] | |
| WAterworld | Tool that simulates the effects of policies on water and land [96] | |
| HEA | Habitat Equivalency Analysis | Calculates the habitat size necessary to provide similar ES to those lost because of a plan [97] |
| LUCI | Land Use Capability Indicator | Open source GIS toolbox to map areas providing services and potential gain or loss of services under management scenarios [98] |
| Wettrans | Flow path-oriented web-based decision tool [99] | |
| Bayesian analysis | Bayesian Networks can capture the relationship between tangible and intangible ES [100] | |
| EcoAim | Proprietary tool for mapping ES and stakeholder preferences. It was developed to quantify five ES—vista aesthetics, landscape aesthetics, recreational opportunities, habitat provisioning for biodiversity and nutrient sequestration [101] | |
| WAM | Wetland Assessment Model | Based on wetland value indicators and scoring criteria and based on expert knowledge |
| RWEQ | Revised Wind Erosion Equation | Used to estimate wind erosion [102] |
References
- Ramsar Convention. 1971. Available online: https://www.ramsar.org/document/the-convention-on-wetlands-text-as-originally-adopted-in-1971 (accessed on 20 September 2020).
- Ramsar Convention. Wetland inventory: A Ramsar framework for wetland inventory and ecological character description. In Ramsar Handbooks for the Wise Use of Wetlands, 4th ed.; Ramsar Convention Secretariat: Gland, Switzerland, 2010; Volume 15, Available online: www.ramsar.org (accessed on 3 September 2020).
- Cowardin, L.M.; Carter, V.; Golet, F.C.; Laroe, E.T. Classification of Wetlands and Deepwater Habitats of the United States; Fish and Wildlife Service, US Department of the Interior: Washington, DC, USA; Northern Prairie Wildlife Research Center: Jamestown, ND, USA, 1979. [Google Scholar]
- Davidson, N.C.; Finlayson, C.M. Extent, regional distribution and changes in area of different classes of wetland. Mar. Freshw. Res. 2018, 69, 1525–1533. [Google Scholar] [CrossRef] [Green Version]
- Plantlife. Available online: https://www.plantlife.org.uk/uk (accessed on 26 January 2022).
- Blankespoor, B.; Dasgupta, S.; Laplante, B. Sea-level rise and coastal wetlands. Ambio 2014, 43, 996–1005. [Google Scholar] [CrossRef] [PubMed] [Green Version]
- Daily, G.C. Nature’s Services: Societal Dependence on Natural Ecosystems; Yale University Press: London, UK, 1997. [Google Scholar]
- De Groot, R.; Brander, L.; Van Der Ploeg, S.; Costanza, R.; Bernard, F.; Braat, L.; Christie, M.; Crossman, N.; Ghermandi, A.; Hein, L.; et al. Global estimates of the value of ecosystems and their services in monetary units. Ecosyst. Serv. 2012, 1, 50–61. [Google Scholar] [CrossRef]
- Zedler, J.B.; Kercher, S. Wetland resources: Status, trends, ecosystem services, and restorability. Annu. Rev. Environ. Resour. 2005, 30, 39–74. [Google Scholar] [CrossRef] [Green Version]
- Gómez-Baggethun, E.; de Groot, R.; Lomas, P.L.; Montes, C. The history of ecosystem services in economic theory and practice: From early notions to markets and payment schemes. Ecol. Econ. 2010, 69, 1209–1218. [Google Scholar] [CrossRef]
- Costanza, R.; d’Arge, R.; de Groot, R.; Farber, S.; Grasso, M.; Hannon, B.; Limburg, K.; Naeem, S.; O’Neill, R.V.; Paruelo, J.; et al. The value of the world’s ecosystem services and natural capital. Nature 1997, 387, 253–360. [Google Scholar] [CrossRef]
- Millennium Ecosystem Assessment Board. Ecosystems and Human Well-Being: Wetlands and Water Synthesis; UNEP—UN Environment Programme: Geneva, Switzerland, 2005; Available online: https://wedocs.unep.org/20.500.11822/8735 (accessed on 26 January 2022).
- Mace, G.M.; Norris, K.; Fitter, A.H. Biodiversity and ecosystem services: A multi-layered relationship. Trends Ecol. Evol. 2012, 27, 19–26. [Google Scholar] [CrossRef]
- Potschin-Young, M.; Haines-Young, R.; Görg, C.; Heink, U.; Jax, K.; Schleyer, C. Understanding the role of conceptual frameworks: Reading the ecosystem service cascade. Ecosyst. Serv. 2018, 29, 428–440. [Google Scholar] [CrossRef]
- Schröter, M.; Van Der Zanden, E.H.; van Oudenhoven, A.; Remme, R.; Serna-Chavez, H.M.; De Groot, R.S.; Opdam, P. Ecosystem services as a contested concept: A synthesis of critique and counter-arguments. Conserv. Lett. 2014, 7, 514–523. [Google Scholar] [CrossRef] [Green Version]
- Dick, J.; Turkelboom, F.; Woods, H.; Iniesta-Arandia, I.; Primmer, E.; Saarela, S.-R.; Bezák, P.; Mederly, P.; Leone, M.; Verheyden, W.; et al. Stakeholders’ perspectives on the operationalisation of the ecosystem service concept: Results from 27 case studies. Ecosyst. Serv. 2018, 29, 552–565. [Google Scholar] [CrossRef] [Green Version]
- Russi, D.; ten Brink, P.; Farmer, A.; Badura, T.; Coates, D.; Förster, J.; Kumar, R.; Davidson, N. The Economics of Ecosystems and Biodiversity for Water and Wetlands; IEEP: London, UK; Brussels, Belgium; Ramsar Secretariat: Gland, Switzerland, 2013. [Google Scholar]
- Reynaud, A.; Lanzanova, D.; Liquete, C.; Grizzetti, B. Cook-Book for Water Ecosystem Service Assessment and Valuation; European Commission—Joint Research Centre: Luxembourg, 2015; Volume 136, p. 2015. [Google Scholar]
- UKNEA. UK National Ecosystem Assessment; DEFRA: Cambridge, UK, 2011. [Google Scholar]
- Van der Wal, R.; Bonn, A.; Monteith, D.; Reed, M.; Blackstock, K.; Hanley, N.; Armitage, H. Mountains, moorlands and heaths. In UK National Ecosystem Assessment: Technical Report; United Nations Environment Programme World Conservation Monitoring Centre: Cambridge, UK, 2011; pp. 105–159. ISBN 9789280731644. Available online: http://uknea.unep-wcmc.org/Resources/tabid/82/Default.aspx (accessed on 23 March 2020).
- Burkhard, B.; Santos-Martin, F.; Nedkov, S.; Maes, J. An operational framework for integrated mapping and assessment of ecosystems and their services (MAES). One Ecosyst. 2018, 3, e22831. [Google Scholar] [CrossRef] [Green Version]
- Costanza, R.; de Groot, R.; Sutton, P.; van der Ploeg, S.; Anderson, S.J.; Kubiszewski, I.; Farber, S.; Turner, R.K. Changes in the global value of ecosystem services. Glob. Environ. Chang. 2014, 26, 152–158. [Google Scholar] [CrossRef]
- Jax, K.; Barton, D.N.; Chan, K.M.; De Groot, R.; Doyle, U.; Eser, U.; Haines-Young, R. Ecosystem services and ethics. Ecol. Econ. 2013, 93, 260–268. [Google Scholar] [CrossRef]
- Potschin, M.; Haines-Young, R. Defining and measuring ecosystem services. In Routledge Handbook of Ecosystem Services; Potschin, M., Haines-Young, R., Fish, R., Turner, R.K., Eds.; Routledge: London, UK; New York, NY, USA, 2016; pp. 25–44. Available online: http://www.routledge.com/books/details/9781138025080/ (accessed on 4 August 2020).
- Bateman, I.J.; Mace, G.M.; Fezzi, C.; Atkinson, G.; Turner, R.K. Economic analysis for ecosystem service assessments. In Valuing Ecosystem Services; Edward Elgar Publishing: Cheltenham, UK, 2014. [Google Scholar]
- Georgiou, S.; Turner, R.K. Valuing Ecosystem Services: The Case of Multi-Functional Wetlands; Routledge: Oxfordshire, UK, 2012. [Google Scholar]
- Davis, R.K. The Value of Outdoor Recreation: An Economic study of Maine Woods. Ph. D Thesis, Harvard University, Cambridge, MA, USA, 1963. [Google Scholar]
- Thurstone, L.L. A law of comparative judgment. Psychol. Rev. 1994, 101, 266. [Google Scholar] [CrossRef]
- Zarembka, P. Transformation of Variables in Econometrics. In Palgrave Macmillan; The New Palgrave Dictionary of Economics, Palgrave Macmillan: London, UK, 1987. [Google Scholar] [CrossRef]
- Luce, R.D. Conditional Logit Analysis of Qualitative Choice Behavior; John Wiley & Sons: New York, NY, USA, 1959. [Google Scholar]
- Marley, A.A.J. Some probabilistic models of simple choice and ranking. J. Math. Psychol. 1968, 5, 311–332. [Google Scholar] [CrossRef] [Green Version]
- Vanslembrouck, I.; Van Huylenbroeck, G.; Van Meensel, J. Impact of agriculture on rural tourism: A hedonic pricing approach. J. Agric. Econ. 2005, 56, 17–30. [Google Scholar] [CrossRef]
- Brander, L.M.; Florax, R.J.; Vermaat, J.E. The empirics of wetland valuation: A comprehensive summary and a meta-analysis of the literature. Environ. Resour. Econ. 2006, 33, 223–250. [Google Scholar] [CrossRef] [Green Version]
- Brander, L. Guidance Manual on Value Transfer Methods for Ecosystem Services; UNEP: Nairobi, Kenya, 2013. [Google Scholar]
- Campbell, E.T. Revealed social preference for ecosystem services using the eco-price. Ecosyst. Serv. 2018, 30, 267–275. [Google Scholar] [CrossRef]
- Egoh, B.; Drakou, E.G.; Dunbar, M.B.; Maes, J.; Willemen, L. Indicators for Mapping Ecosystem Services: A Review; European Commission, Joint Research Centre (JRC): Petten, The Netherlands, 2012; p. 111. [Google Scholar]
- Grizzetti, B.; Lanzanova, D.; Liquete, C.; Reynaud, A.; Cardoso, A.C. Assessing water ecosystem services for water resource management. Environ. Sci. Policy 2016, 61, 194–203. [Google Scholar] [CrossRef]
- Burkhard, B.; Kandziora, M.; Hou, Y.; Müller, F. Ecosystem service potentials, flows and demands-concepts for spatial localisation, indication and quantification. Landsc. Online 2014, 34, 1–32. [Google Scholar] [CrossRef]
- Villamagna, A.M.; Mogollón, B.; Angermeier, P.L. A multi-indicator framework for mapping cultural ecosystem services: The case of freshwater recreational fishing. Ecol. Indic. 2014, 45, 255–265. [Google Scholar] [CrossRef]
- Ala-Hulkko, T.; Kotavaara, O.; Alahuhta, J.; Hjort, J. Mapping supply and demand of a provisioning ecosystem service across Europe. Ecol. Indic. 2019, 103, 520–529. [Google Scholar] [CrossRef]
- Baas, J.; Schotten, M.; Plume, A.; Côté, G.; Karimi, R. Scopus as a curated, high-quality bibliometric data source for academic research in quantitative science studies. Quant. Sci. Stud. 2020, 1, 377–386. [Google Scholar] [CrossRef]
- Balmford, A.; Bruner, A.; Cooper, P.; Costanza, R.; Farber, S.; Green, R.E.; Jenkins, M.; Jefferiss, P.; Jessamy, V.; Madden, J.; et al. Economic reasons for conserving wild nature. Science 2002, 297, 950–953. [Google Scholar] [CrossRef] [PubMed] [Green Version]
- Brouwer, R.; Langford, I.H.; Bateman, I.J.; Turner, R.K. A meta-analysis of wetland contingent valuation studies. Reg. Environ. Chang. 1999, 1, 47–57. [Google Scholar] [CrossRef]
- Woodward, R.T.; Wui, Y.S. The economic value of wetland services: A meta-analysis. Ecol. Econ. 2001, 37, 257–270. [Google Scholar] [CrossRef]
- Lara-Pulido, J.A.; Guevara-Sanginés, A.; Martelo, C.A. A meta-analysis of economic valuation of ecosystem services in Mexico. Ecosyst. Serv. 2018, 31, 126–141. [Google Scholar] [CrossRef]
- Ming, J.; Xian-Guo, L.; Lin-Shu, X.; Li-Juan, C.; Shouzheng, T. Flood mitigation benefit of wetland soil—A case study in Momoge National Nature Reserve in China. Ecol. Econ. 2007, 61, 217–223. [Google Scholar] [CrossRef]
- Vazquez-Gonzalez, C.; Moreno-Casasola, P.; Peláez, L.A.P.; Monroy, R.; Espejel, I. The value of coastal wetland flood prevention lost to urbanization on the coastal plain of the Gulf of Mexico: An analysis of flood damage by hurricane impacts. Int. J. Disaster Risk Reduct. 2019, 37, 101180. [Google Scholar] [CrossRef]
- Costanza, R.; Pérez-Maqueo, O.; Martinez, M.L.; Sutton, P.; Anderson, S.J.; Mulder, K. The value of coastal wetlands for hurricane protection. AMBIO A J. Hum. Environ. 2008, 37, 241–248. [Google Scholar] [CrossRef]
- Mehvar, S.; Filatova, T.; Dastgheib, A.; Steveninck, E.D.R.V.; Ranasinghe, R. Quantifying economic value of coastal ecosystem services: A review. J. Mar. Sci. Eng. 2018, 6, 5. [Google Scholar] [CrossRef] [Green Version]
- Okruszko, T.; Duel, H.; Acreman, M.; Grygoruk, M.; Flörke, M.; Schneider, C. Broad-scale ecosystem services of European wetlands—Overview of the current situation and future perspectives under different climate and water management scenarios. Hydrol. Sci. J. 2011, 56, 1501–1517. [Google Scholar] [CrossRef]
- Kuik, O.J. Scaling up Ecosystem Benefits—A Contribution to The Economics of Ecosystems and Biodiversity (TEEB) Study; EEA Report 4/2010; EEA: Copenhagen, Denmark, 2010. [Google Scholar]
- Ghermandi, A.; Ding, H.; Nunes, P.A. The social dimension of biodiversity policy in the European Union: Valuing the benefits to vulnerable communities. Environ. Sci. Policy 2013, 33, 196–208. [Google Scholar] [CrossRef]
- Borisova-Kidder, A. Meta-Analytical Estimates of Values of Environmental Services Enhanced by Government Agricultural Conservation Programs. Ph.D. Thesis, The Ohio State University, Columbus, OH, USA, 2006. [Google Scholar]
- Barbier, E.B. The value of coastal wetland ecosystem services. In Coastal Wetlands; Elsevier: Amsterdam, The Netherlands, 2019; pp. 947–964. [Google Scholar]
- Davidson, N.C.; Van Dam, A.A.; Finlayson, C.M.; McInnes, R.J. Worth of wetlands: Revised global monetary values of coastal and inland wetland ecosystem services. Mar. Freshw. Res. 2019, 70, 1189. [Google Scholar] [CrossRef]
- Zhou, J.; Wu, J.; Gong, Y. Valuing wetland ecosystem services based on benefit transfer: A meta-analysis of China wetland studies. J. Clean. Prod. 2020, 276, 122988. [Google Scholar] [CrossRef]
- Sannigrahi, S.; Bhatt, S.; Rahmat, S.; Paul, S.K.; Sen, S. Estimating global ecosystem service values and its response to land surface dynamics during 1995–2015. J. Environ. Manag. 2018, 223, 115–131. [Google Scholar] [CrossRef]
- Yim, J.; Kwon, B.-O.; Nam, J.; Hwang, J.H.; Choi, K.; Khim, J.S. Analysis of forty years long changes in coastal land use and land cover of the Yellow Sea: The gains or losses in ecosystem services. Environ. Pollut. 2018, 241, 74–84. [Google Scholar] [CrossRef]
- Prohic, E.; Peh, Z.; Miko, S. Geochemical characterization of a karst polje—An example from Sinjsko polje, Croatia. Environ. Geol. 1998, 33, 263–273. [Google Scholar] [CrossRef]
- Skeffington, M.S.; Scott, N.E. Do turloughs occur in Slovenia? Acta Carsologica 2008, 37, 2–3. [Google Scholar] [CrossRef] [Green Version]
- Dolinar, N.; Rudolf, M.; Šraj, N.; Gaberščik, A. Environmental changes affect ecosystem services of the intermittent Lake Cerknica. Ecol. Complex. 2010, 7, 403–409. [Google Scholar] [CrossRef]
- Gaberščik, A.; Urbanc-Berčič, O.; Kržič, N.; Kosi, G.; Brancelj, A. The intermittent Lake Cerknica: Various faces of the same ecosystem. Lakes Reserv. Res. Manag. 2003, 8, 159–168. [Google Scholar] [CrossRef]
- Naughton, O.; Johnston, P.; Gill, L. Groundwater flooding in Irish karst: The hydrological characterisation of ephemeral lakes (turloughs). J. Hydrol. 2012, 470, 82–97. [Google Scholar] [CrossRef]
- Gill, L.W.; Naughton, O.; Johnston, P.M. Modeling a network of turloughs in lowland karst. Water Resour. Res. 2013, 49, 3487–3503. [Google Scholar] [CrossRef]
- Bhatnagar, S.; Gill, L.; Regan, S.; Naughton, O.; Johnston, P.; Waldren, S.; Ghosh, B. Mapping vegetation communities inside wetlands using sentinel-2 imagery in ireland. Int. J. Appl. Earth Obs. Geoinf. 2020, 88, 102083. [Google Scholar] [CrossRef]
- Waldren, S. Turlough hydrology, ecology and conservation, National Parks & Wildlife Services, Department of Arts, Heritage and the Gaeltacht: Dublin, Ireland, Unpublished report. 2015.
- McCormack, T.; Naughton, O.; Johnston, P.M.; Gill, L.W. Quantifying the influence of surface water–groundwater interaction on nutrient flux in a lowland karst catchment. Hydrol. Earth Syst. Sci. 2016, 20, 2119–2133. [Google Scholar] [CrossRef] [Green Version]
- BirdLife International. Important Bird Areas Factsheet: Rahasane Turlough. 2020. Available online: http://www.birdlife.org (accessed on 4 September 2020).
- Mitsch, W.J.; Gosselink, J.G. Wetlands. John Wiley & Sons: New York, NY, USA, 2015. [Google Scholar]
- Morrissey, P.J.; McCormack, T.; Naughton, O.; Johnston, P.M.; Gill, L.W. Modelling groundwater flooding in a lowland karst catchment. J. Hydrol. 2019, 580, 124361. [Google Scholar] [CrossRef]
- Morrissey, P.; Nolan, P.; McCormack, T.; Johnston, P.; Naughton, O.; Bhatnagar, S.; Gill, L. Impacts of climate change on groundwater flooding and ecohydrology in lowland karst. Hydrol. Earth Syst. Sci. 2021, 25, 1923–1941. [Google Scholar] [CrossRef]
- Smith, J.; Smith, P.; Wattenbach, M.; Zaehle, S.; Hiederer, R.; Jones, R.J.; Montanarella, L.; Rounsevell, M.D.; Reginster, I.; Ewert, F. Projected changes in mineral soil carbon of European croplands and grasslands, 1990–2080. Glob. Chang. Biol. 2005, 11, 2141–2152. [Google Scholar] [CrossRef]
- Janssens, I.A.; Freibauer, A.; Ciais, P.; Smith, P.; Nabuurs, G.J.; Folberth, G.; Valentini, R. Europe’s terrestrial biosphere absorbs 7 to 12% of European anthropogenic CO2 emissions. Science 2003, 300, 1538–1542. [Google Scholar] [CrossRef] [Green Version]
- Conant, R.T.; Paustian, K.; Elliott, E.T. Grassland management and conversion into grassland: Effects on soil carbon. Ecol. Appl. 2011, 11, 343–355. [Google Scholar] [CrossRef]
- Open Seasons Orders (Birds). Available online: https://www.npws.ie/legislation/irish-law/open-seasons-order (accessed on 26 January 2022).
- Irish Ramsar Wetlands Committee. Irish Wetland Types—An Identification Guide and Field Survey Manual; EPA: Wexford, Ireland, 2018; ISBN 978-1-84095-740-2. [Google Scholar]
- The Turlough. Available online: http://www.dunnasi.ie/amenity-park/turlough (accessed on 20 September 2020).
- Coole Park Nature Reserve. Available online: https://www.coolepark.ie (accessed on 20 September 2020).
- Gugić, G. The Lonjsko polje nature park—Applied nature conservation reconciling ecosystem protection with the maintenance of organically grown cultural landscapes. Nat. Und Landsch. 2012, 87, 446–450. [Google Scholar]
- Petrović, M.D.; Pavić, D.; Marković, S.B.; Meszaros, M.; Jovičić, A. Comparison and estimation of the values in wetland areas: A study of Ramsar sites Obedska bara (Serbia) and Lonjsko polje (Croatia). Carpath. J. Earth Environ. 2016, 11, 367–380. [Google Scholar]
- Juvanec, B. Popovo polje, a different view. Acta Carsologica 2016, 3, 275–283. [Google Scholar]
- Blackwell, M.; Pilgrim, E.S. Ecosystem services delivered by small-scale wetlands. Hydrol. Sci. J. 2011, 56, 1467–1484. [Google Scholar] [CrossRef] [Green Version]
- InVEST, Natural Capital Project. Available online: https://naturalcapitalproject.stanford.edu/software/invest (accessed on 26 January 2021).
- Ghermandi, A.; Van den Bergh, J.C.; Brander, L.M.; de Groot, H.L.; Nunes, P. The values of natural and constructed wetlands: A meta-analysis. TI (Tinbergen Inst.) 2010, 3, 2–22. [Google Scholar]
- Barbier, E.B. Wetlands as natural assets. Hydrol. Sci. J. 2011, 56, 1360–1373. [Google Scholar] [CrossRef]
- Li, Z.; Zhang, F. Spatial and temporal ecosystem changes in the Ebinur wetland nature reserve from 1998 to 2014. Acta Ecol. Sin. 2017, 15, 4984–4997. [Google Scholar]
- Harrison, P.A.; Vandewalle, M.; Sykes, M.T.; Berry, P.M.; Bugter, R.; De Bello, F.; Feld, C.K.; Grandin, U.; Harrington, R.; Haslett, J.R.; et al. Identifying and prioritising services in European terrestrial and freshwater ecosystems. Biodivers. Conserv. 2010, 19, 2791–2821. [Google Scholar] [CrossRef] [Green Version]
- Vallecillo, S.; La Notte, A.; Ferrini, S.; Maes, J. How ecosystem services are changing: An accounting application at the EU level. Ecosyst. Serv. 2019, 40, 101044. [Google Scholar] [CrossRef]
- Costanza, R.; Daly, L.; Fioramonti, L.; Giovannini, E.; Kubiszewski, I.; Mortensen, L.F.; Pickett, K.E.; Ragnarsdottir, K.V.; De Vogli, R.; Wilkinson, R. Modelling and measuring sustainable wellbeing in connection with the UN Sustainable Development Goals. Ecol. Econ. 2016, 130, 350–355. [Google Scholar] [CrossRef]
- Costanza, R.; De Groot, R.; Braat, L.; Kubiszewski, I.; Fioramonti, L.; Sutton, P.; Grasso, M. Twenty years of ecosystem services: How far have we come and how far do we still need to go? Ecosyst. Serv. 2017, 28, 1–16. [Google Scholar] [CrossRef]
- SWAT, Soil and Water Assessment Tool. Available online: https://swat.tamu.edu (accessed on 26 January 2020).
- Toolkit for Ecosystem Service Site-Based Assessment (TESSA). Available online: http://tessa.tools (accessed on 26 January 2022).
- Social Values for Ecosystem Services (SolVES). Available online: https://www.usgs.gov/centers/geosciences-and-environmental-change-science-center/science/social-values-ecosystem (accessed on 26 January 2022).
- Revised Universal Soil Loss Equation (RUSLE). Available online: https://www.ars.usda.gov/southeast-area/oxford-ms/national-sedimentation-laboratory/watershed-physical-processes-research/docs/revised-universal-soil-loss-equation-rusle-welcome-to-rusle-1-and-rusle-2/ (accessed on 26 January 2022).
- Policy Support Tool, Hydrus. Available online: https://ipbes.net/policy-support/tools-instruments/hydrus (accessed on 26 January 2022).
- WaterWorld. Available online: http://www.policysupport.org/waterworld (accessed on 26 January 2022).
- Dunford, R.W.; Ginn, T.C.; Desvousges, W.H. The use of habitat equivalency analysis in natural resource damage assessments. Ecol. Econ. 2004, 48, 49–70. [Google Scholar] [CrossRef]
- Land Utilization Capability Indicator (LUCI). Available online: https://www.lucitools.org/ (accessed on 26 January 2022).
- Trepel, M.; Kluge, W. WETTRANS: A flow-path-oriented decision-support system for the assessment of water and nitrogen exchange in riparian peatlands. Hydrol. Process. 2004, 18, 357–371. [Google Scholar] [CrossRef]
- Höfer, S.; Ziemba, A.; El Serafy, G. A Bayesian approach to ecosystem service trade-off analysis utilizing expert knowledge. Environ. Syst. Decis. 2019, 40, 67–83. [Google Scholar] [CrossRef] [Green Version]
- Booth, P.; Law, S.; Ma, J.; Turnley, J.; Boyd, J. Implementation of EcoAIM (Trademark)—A Multi-Objective Decision Support Tool for Ecosystem Services at Department of Defense Installations; Exponent Inc.: Alexandria, VA, USA, 2014. [Google Scholar]
- Fryrear, D.; Saleh, A.; Bilbro, J.D.; Schomberg, H.; Stout, J.E.; Zobeck, T.M. Revised Wind Erosion Equation (RWEQ); Wind Erosion and Water Conservation Research Unit, USDA-ARS, Southern Plains Area Cropping Systems Research Laboratory: Lubbock, TX, USA, 1998. [Google Scholar]


| ES | Valuation Methods |
|---|---|
| Provisioning | |
| Water for residential use, livestock watering, and food manufacture processing | MA; PF; RC; CV; DE, HPM |
| Water for landscape, turf, and agricultural irrigation | MA; PF; RC; DE; CV |
| Food, reeds, grass/hay or timber harvesting, pharmaceuticals, and other products used in industry | MA; PF; CV |
| Regulating | |
| Habitat preservation | MA; PF; RC; CV; TC; DE, HPM |
| Climate regulation | MA; PF; RC; CV; DE; HPM |
| Waste removal | MA; PF; RC; CV; DE; HPM |
| Nutrient and toxicant retention | MA; PF; RC; CV; DE; HPM |
| Saltwater intrusion | MA; PF; RC; DE; CV |
| Erosion prevention, flood and storm protection, and shoreline stabilisation | MA; PF; RC; DE; CV; HPM |
| Cultural | |
| Recreational fishing, boating, hunting, trapping, and plant gathering | MA, PF, RC, CV, TC, DE, HPM |
| On and off-site observation for leisure, education, and scientific activities | MA; PF; RC; DE; CV; TC |
| Cultural, historic and aesthetic value provision | CV |
| ES | Indicators |
|---|---|
| Fisheries and aquaculture | Fish production or fish catch; status of fish populations; aquaculture production; wild vegetation used in gastronomy, cosmetic or pharmaceutical uses; number of fishermen |
| Water for drinking purposes | Water consumption for drinking; water abstracted; surface water availability; water exploitation index (WEI); nitrate-vulnerable zones |
| Water purification | Indicators of surface water quality (nitrate, phosphates, coliforms…); indicators of groundwater quality; nutrient loads; nutrient concentration; nutrient retention; trophic status; ecological status; area occupied by riparian forests; potential mineralisation or decomposition; number and efficiency of treatment plants; wastewater treated |
| Erosion prevention | Sediment retention; groundwater evolution |
| Flood prevention | Flood risk maps; water holding capacity of soils; conservation of river and lakes banks; groundwater level evolution; flood plains area (and record of annual floods); area of wetlands located in flood risk zones; conservation status of riparian wetlands |
| Maintaining habitats | Biodiversity value (species diversity or abundance, endemics or red-listed species…); ecological status; hydromorphological status |
| Recreation | Number of visitors to natural places; number of visitors to attractions; National Parks and Natura 2000 sites; number of bird-watching sites; number of bathing areas and beaches; fish and waterfowl abundance; quality of fresh waters for fishing; number of waterfowl hunters and anglers; number of fishing licenses and fishing reserves; tourism revenue |
| Intellectual and aesthetic appreciation | Sites monitored by scientists; number of scientific projects, articles, studies; classified sites (e.g., World Heritage…); Number of visitors; National Parks and Natura 2000 sites; cultural sites and number of annual cultural events; contrasting landscapes; proximity to urban areas of scenic rivers or lakes. |
| Inland Wetlands | |
|---|---|
| Provisioning Services | 1659 |
| Regulating Services | 17,364 |
| Habitat Services | 2455 |
| Cultural Services | 4203 |
| Total Economic Value | 25,682 |
Publisher’s Note: MDPI stays neutral with regard to jurisdictional claims in published maps and institutional affiliations. |
© 2022 by the authors. Licensee MDPI, Basel, Switzerland. This article is an open access article distributed under the terms and conditions of the Creative Commons Attribution (CC BY) license (https://creativecommons.org/licenses/by/4.0/).
Share and Cite
Delle Grazie, F.M.; Gill, L.W. Review of the Ecosystem Services of Temperate Wetlands and Their Valuation Tools. Water 2022, 14, 1345. https://doi.org/10.3390/w14091345
Delle Grazie FM, Gill LW. Review of the Ecosystem Services of Temperate Wetlands and Their Valuation Tools. Water. 2022; 14(9):1345. https://doi.org/10.3390/w14091345
Chicago/Turabian StyleDelle Grazie, Fabio M., and Laurence W. Gill. 2022. "Review of the Ecosystem Services of Temperate Wetlands and Their Valuation Tools" Water 14, no. 9: 1345. https://doi.org/10.3390/w14091345