Abstract
Affected by excessive fertilizer application and livestock breeding, the problem of nitrate pollution in the groundwater in the Mihe alluvial–diluvial fan area is becoming increasingly prominent, which poses a great threat to human production and life. Given this, the risk of nitrate pollution in the shallow groundwater of the Mihe alluvial–diluvial fan is evaluated by introducing a data envelopment analysis (DEA) method. Using this model, 28 groundwater sampling points are selected as the decision-making unit (DMU); the nitrogen and pesticide application rate, livestock and poultry stock, groundwater burial depth, aquifer water abundance, and vegetable planting area are taken as the model input; and the nitrate content is taken as the model output to quantitatively calculate the pollution risk index to form a spatial distribution map of pollution risk. The calculation using the model shows that the average pollution risk index of the study area is 0.382, the spatial variation is 1.12, the pollution risk index gradually decreases from south to north, and agricultural planting and livestock and poultry breeding are the main pollution sources. The calculation of nitrate pollution risk using this model not only enriches the nitrate pollution evaluation model but also provides a basis for further implementing the action of reducing fertilizer use by increasing its efficiency and strengthening the prevention of agricultural diffused pollution.
1. Introduction
Groundwater is the main type of water source available for human life and production; however, due to economic development, most of the groundwater in the world has been polluted to varying degrees, and the most common and difficult to tackle reason for groundwater pollution is agricultural non-point source pollution [1,2]. Compared with point source pollution, which has concentrated sewage points and relatively clear sewage channels, non-point source pollution has become the focus of environmental pollution control due to its randomness of distribution, the complexity of its components, and the difficulty of its repair [3]. The non-point source pollution of groundwater mainly results from the excessive application of chemical fertilizer, especially nitrogenous fertilizer, which leads to a low nitrogen utilization rate. Only about 30–40% of nitrogen fertilizer is effectively utilized and about 12.5–45% of nitrogen is lost from the soil to groundwater aquifers [4]. In addition to the excessive application of nitrogen-containing fertilizers, livestock farming is also a cause of nitrate pollution of groundwater [5]. As a result, the nitrate content in shallow groundwater often exceeds the limits of the Groundwater Quality Standards (GB/T 14868-2017), forming vulnerable and potentially vulnerable areas of nitrate, i.e., areas with a high risk of nitrate pollution (some of the chemical component content limits are shown in Table 1). These account for 56% of China’s total arable land area [6]. In addition, studies have shown that the average nitrate nitrogen content in the groundwater of seven provinces and cities around the Bohai Sea in China can reach as high as 11.6 mg/L and that about 34.1% of groundwater exceeds the water reference standard set by the WHO [7]. However, the deterioration of groundwater status occurs not only in China; it is a global problem, which has thus become the focal point of environmental research [8,9,10].

Table 1.
Some of the chemical component content limits in the Groundwater Quality Standards.
The problem of nitrate pollution in shallow groundwater has been studied extensively and evaluation models have been developed for different factors [11]. For example, Shaffer et al. developed the NLEAP model to judge the potential of nitrate nitrogen leaching in farmland and the potential impact of nitrate nitrogen leaching on aquifers [12]. Ramos et al. used the LEACHM model developed by Wagenet and Hutson to predict the mineral nitrogen and water content of winter wheat soils and concluded that changes in soil mineral nitrogen are mainly affected by fertilizer addition, mineralization, and denitrification [13]. Hansen et al. developed a dynamic simulation model of the soil–plant system, stratifying the soil profile according to the soil’s physicochemical properties and simulating soil nitrogen dynamics and biological yield of winter wheat at two sites with different levels of nitrogen application [14]. Hanson et al. developed the RZWQM model in which the interaction of stubble cover, hydrothermal processes, crop growth, and chemical fate was incorporated into the agricultural simulation, and the model also addressed chemical transport and chemical and nutrient transformation in the soil [15]. Domestic studies on this issue started late, and it was not until the end of the 20th century that scholars gradually started paying attention to nitrogen migration. For example, Cao studied the characteristics of nitrogen migration in farmland under weather changes using the Hydrus-1D model [16]. Zhang studied soil nitrogen migration and transformation in paddy fields under flooding conditions [17]. At the same time, with the popularization of various technologies and the expansion of the range of assessment, comprehensive assessment methods that combine new technologies with traditional methods have been widely applied. AnilShrestha used the frequency ratio of geological detectors to optimize the DRASTIC model. The risk of nitrate pollution in groundwater in the Central Valley of the United States has been evaluated [18]. Hanen Jarray combined the DRASTIC model with ArcGIS to evaluate the groundwater vulnerability of mio-Plio quaternary aquifers in southern Tunisia and verified the distribution of nitrate concentration, reaching the conclusion that the assessment method was completely reliable [19].
Shouguang City, where the middle and lower reaches of the Mihe alluvial–diluvial fan is located, is the largest vegetable planting facility in China. According to the statistical yearbook data on Shouguang City, between 2015 and 2019 the average annual nitrogen application rate was 259,000 tons, and the application intensity reached 510.6 kg/hm2, far exceeding the recognized safety limit of 225 kg/hm2 in developed countries [20]. Excessive chemical fertilizer application means that the nitrogen is not absorbed by plants and is washed into the groundwater by rain. Therefore, taking the middle and lower reaches of the Mihe alluvial fan as the study area, to solve the problem of the nitrate non-point source pollution of groundwater caused by the excessive application of nitrogen fertilizer, it is necessary to use the classical C2R model of the DEA model developed by A. Charnes in 1978 to carry out a risk assessment of nitrate pollution in shallow groundwater. This research provides a basis for the further implementation of chemical fertilizer reduction and efficiency action in protected vegetable cultivation and the prevention and control of agricultural non-point source pollution.
2. Materials and Methods
2.1. Overview of Study Area
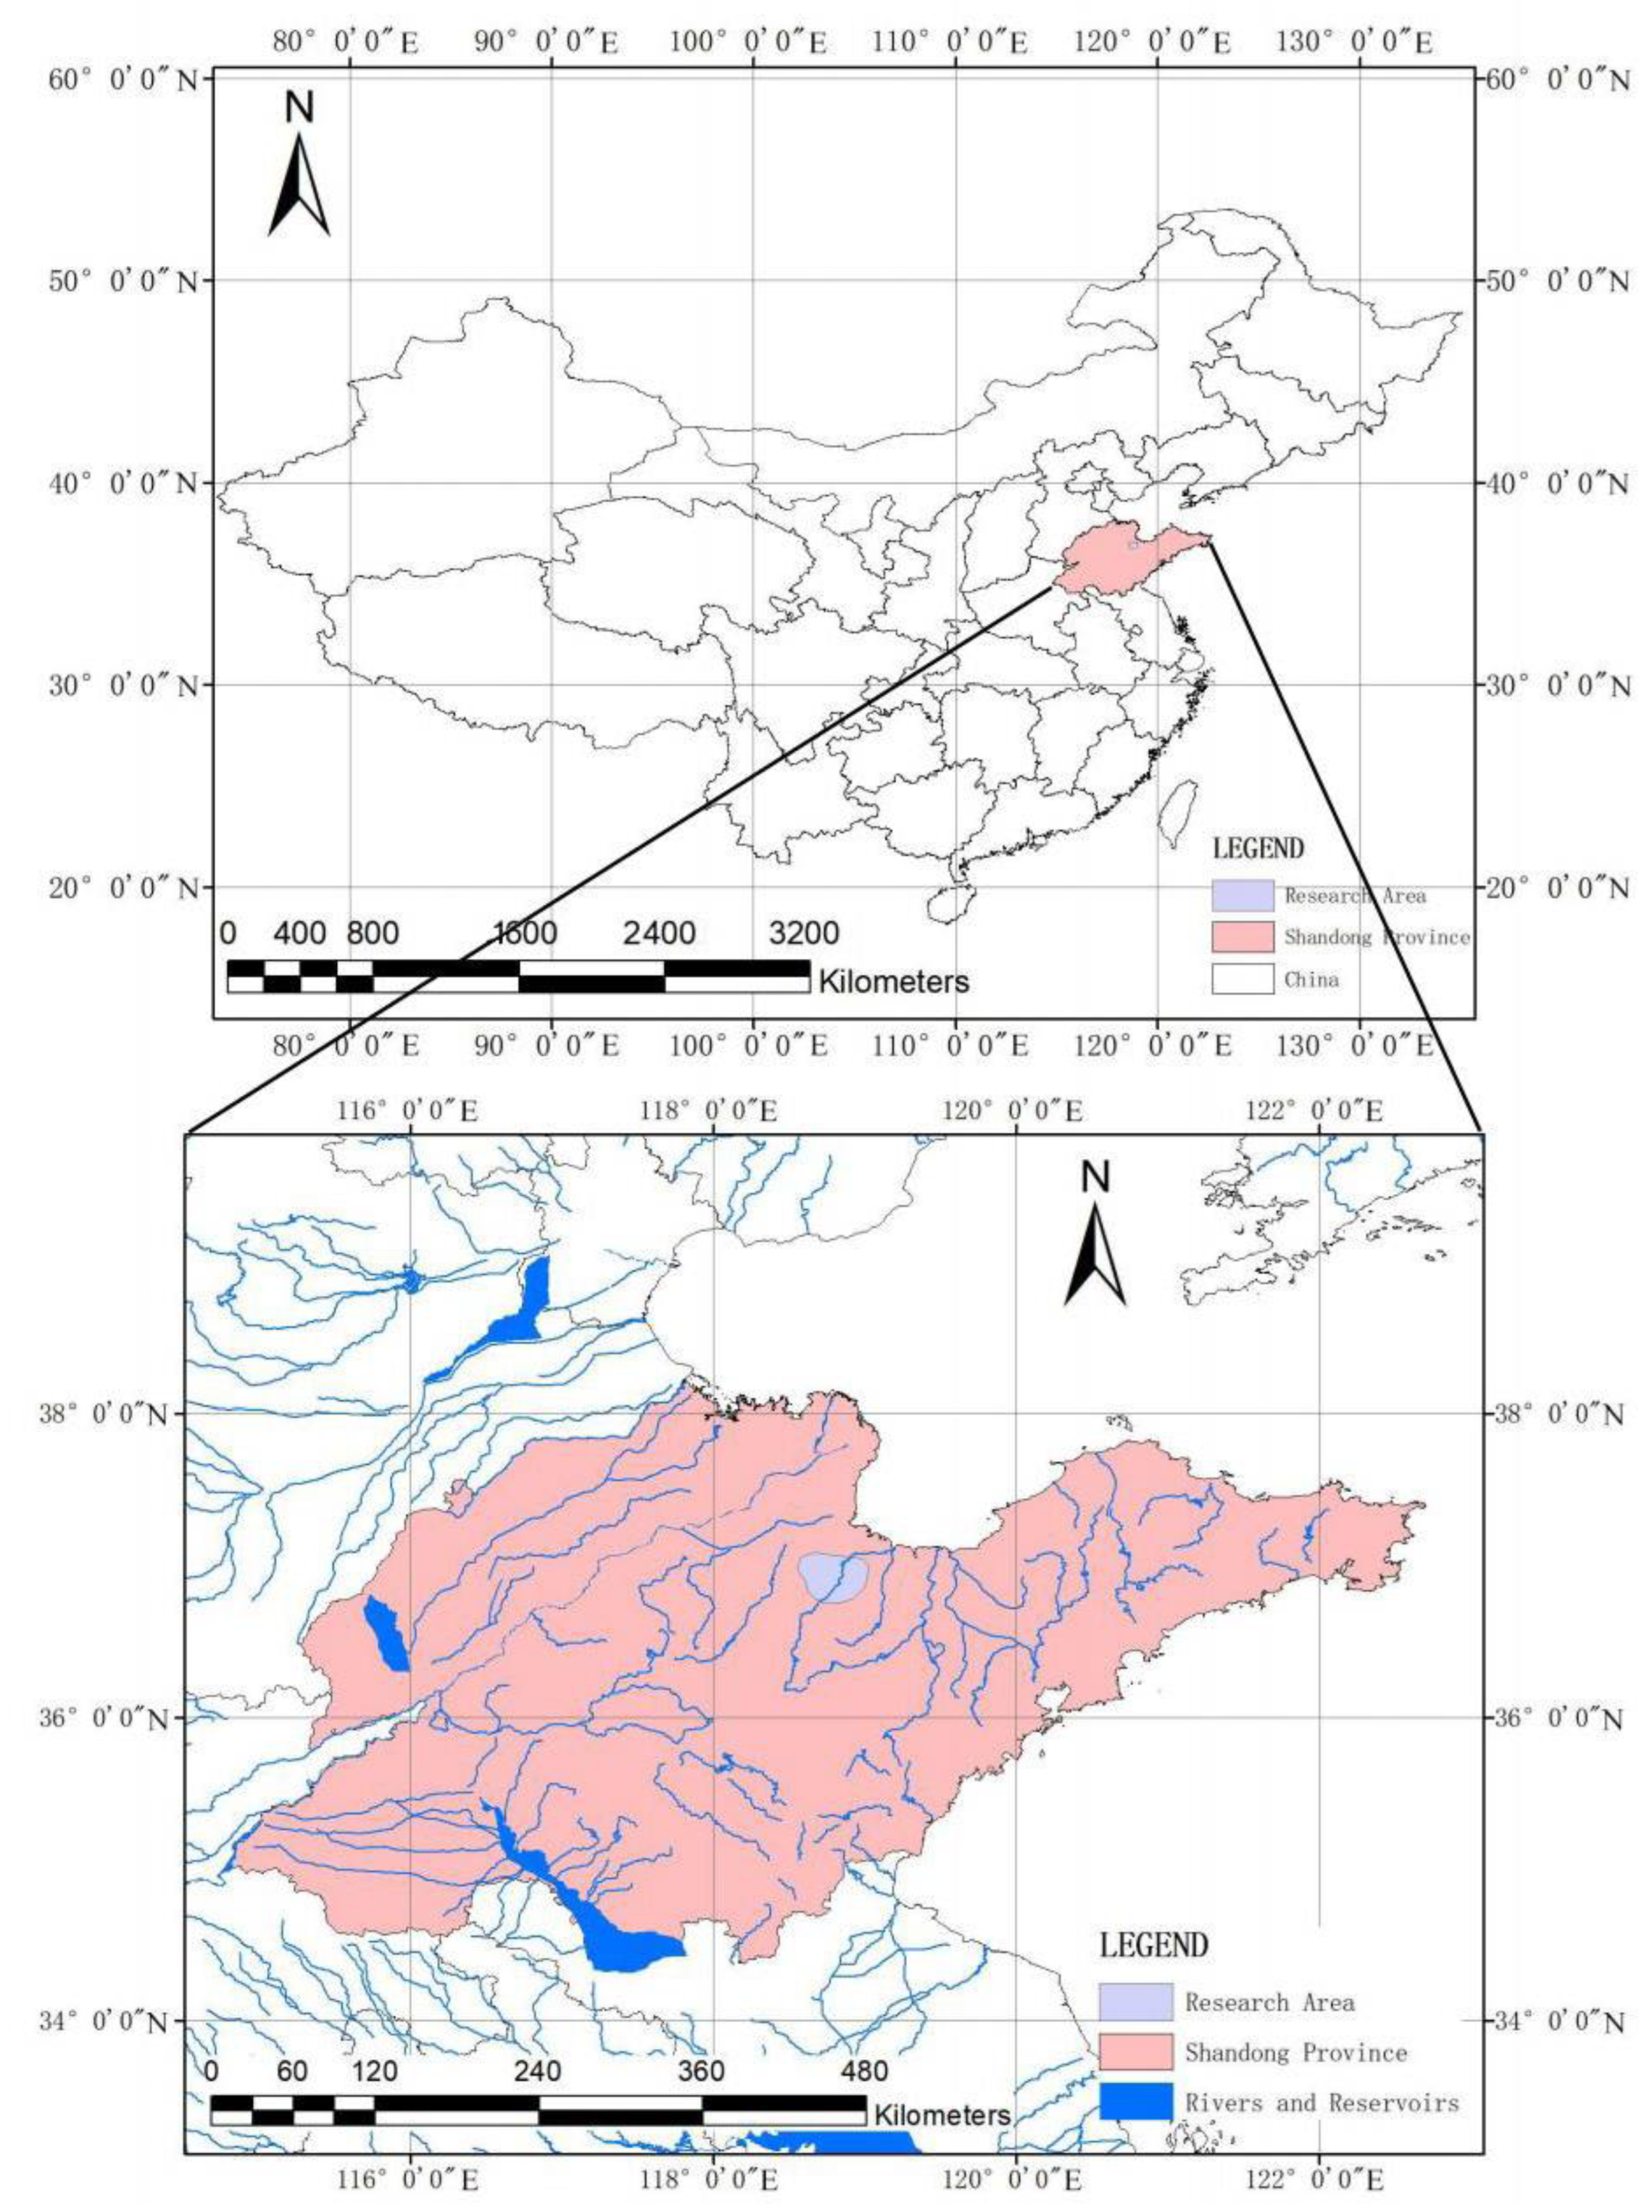
The study area is located in the middle and lower reaches of the Mihe alluvial–diluvial fan in the south of Shouguang City, Shandong Province (Figure 1). From 1959 to 2019, The average annual rainfall was 581.7 mm, and the amount of exploitable water resources was 280.86 million m/a. Shouguang City is located in the middle latitude, bordering the Bohai Sea to the north, and has a continental climate in the warm temperate monsoon zone with an average annual relative humidity of 66%. South–southeast is the dominant wind direction, and the annual average wind speed is 3.2 m/s, which is affected by the alternation of cold and warm air currents. It is dry and rainy in the spring and autumn and hot and rainy in the summer. Precipitation, air temperature, humidity, wind speed, and other factors mean that the evaporation in Shouguang is much larger than the rainfall, and the annual average evaporation reaches 1834 mm [21]. In 2019, the average buried depth of the underground level was 21.35 m, and the underground water exploitation was 117 million m³. The geotectonic unit of the study area is located in the northern part of the Changle sag of the North China plate, close to the western side of the Yishu fault zone, and is the transitional combination zone between the northeastern margin of the Luxi block and the North China depression. The types of groundwater in the area are mainly shallow and medium deep loose rock pore water, carbonate rock with clastic rock karst fissure water, and extrusive rock pore fissure water. The soil types are cinnamon soil, tidal soil, Shajiang black soil, and saline soil, of which tidal soil accounts for 63% of the available land area.

Figure 1.
Location map of the study area.
Groundwater is a very important source of domestic water in the Mihe alluvial–diluvial fan area. According to the statistics of the Water Resources Bulletin in Weifang for 2016–2019, 71.72% of the farmland irrigation water, 38.55% of the industrial water, urban public water, and domestic water for residents, and 30.54% of the ecological water outside the river in Shouguang City, located in the middle and lower reaches of Mihe River, come from groundwater. Groundwater accounts for 68.9% of total water consumption. Therefore, it is necessary to evaluate the nitrate pollution risk of shallow groundwater in this area.
2.2. Pollution Path
The N cycle is a complex system covering the gaseous, aqueous, and solid phases [22]. Nitrogen is excreted by animals in the form of ammonia, urea, or other nitrogen compounds, which can be converted into nitrogen, nitrite, or nitrate under aerobic conditions. These nitrogen compounds can be intercepted and accumulated for several years in the crusting soil or vadose zone.
In the natural nitrogen fixation process, excluding industrial influence, the nitrogen generated after the molecular bonds are destroyed by bacteria combines with hydrogen ions to form NH4+, which can be absorbed by plants [23]. Nitrifying bacteria decompose NH4+ into nitrite under aerobic conditions, and nitrite is also further transformed into nitrate under aerobic conditions. As H+ is produced in the process of decomposition into nitrite, the pH value in the solution is reduced, and the nitrate ion has high stability under this condition and can exist in the aquifer for a long time. The denitrification process refers to a process by which the intermediate products NO2, NO, and N2O are finally converted into N2. This process removes nitrogen from the water environment in the form of nitrogen products. It is a natural repair process, but the conditions are harsh [24,25]. After the natural repair process, only a small proportion of the nitrate is denitrified. In addition, the application of excessive nitrogen fertilizers and pesticides and the discharge of livestock and poultry nitrogen form nitrate accumulation in shallow groundwater, causing nitrate pollution of shallow groundwater.
2.3. Sample Acquisition
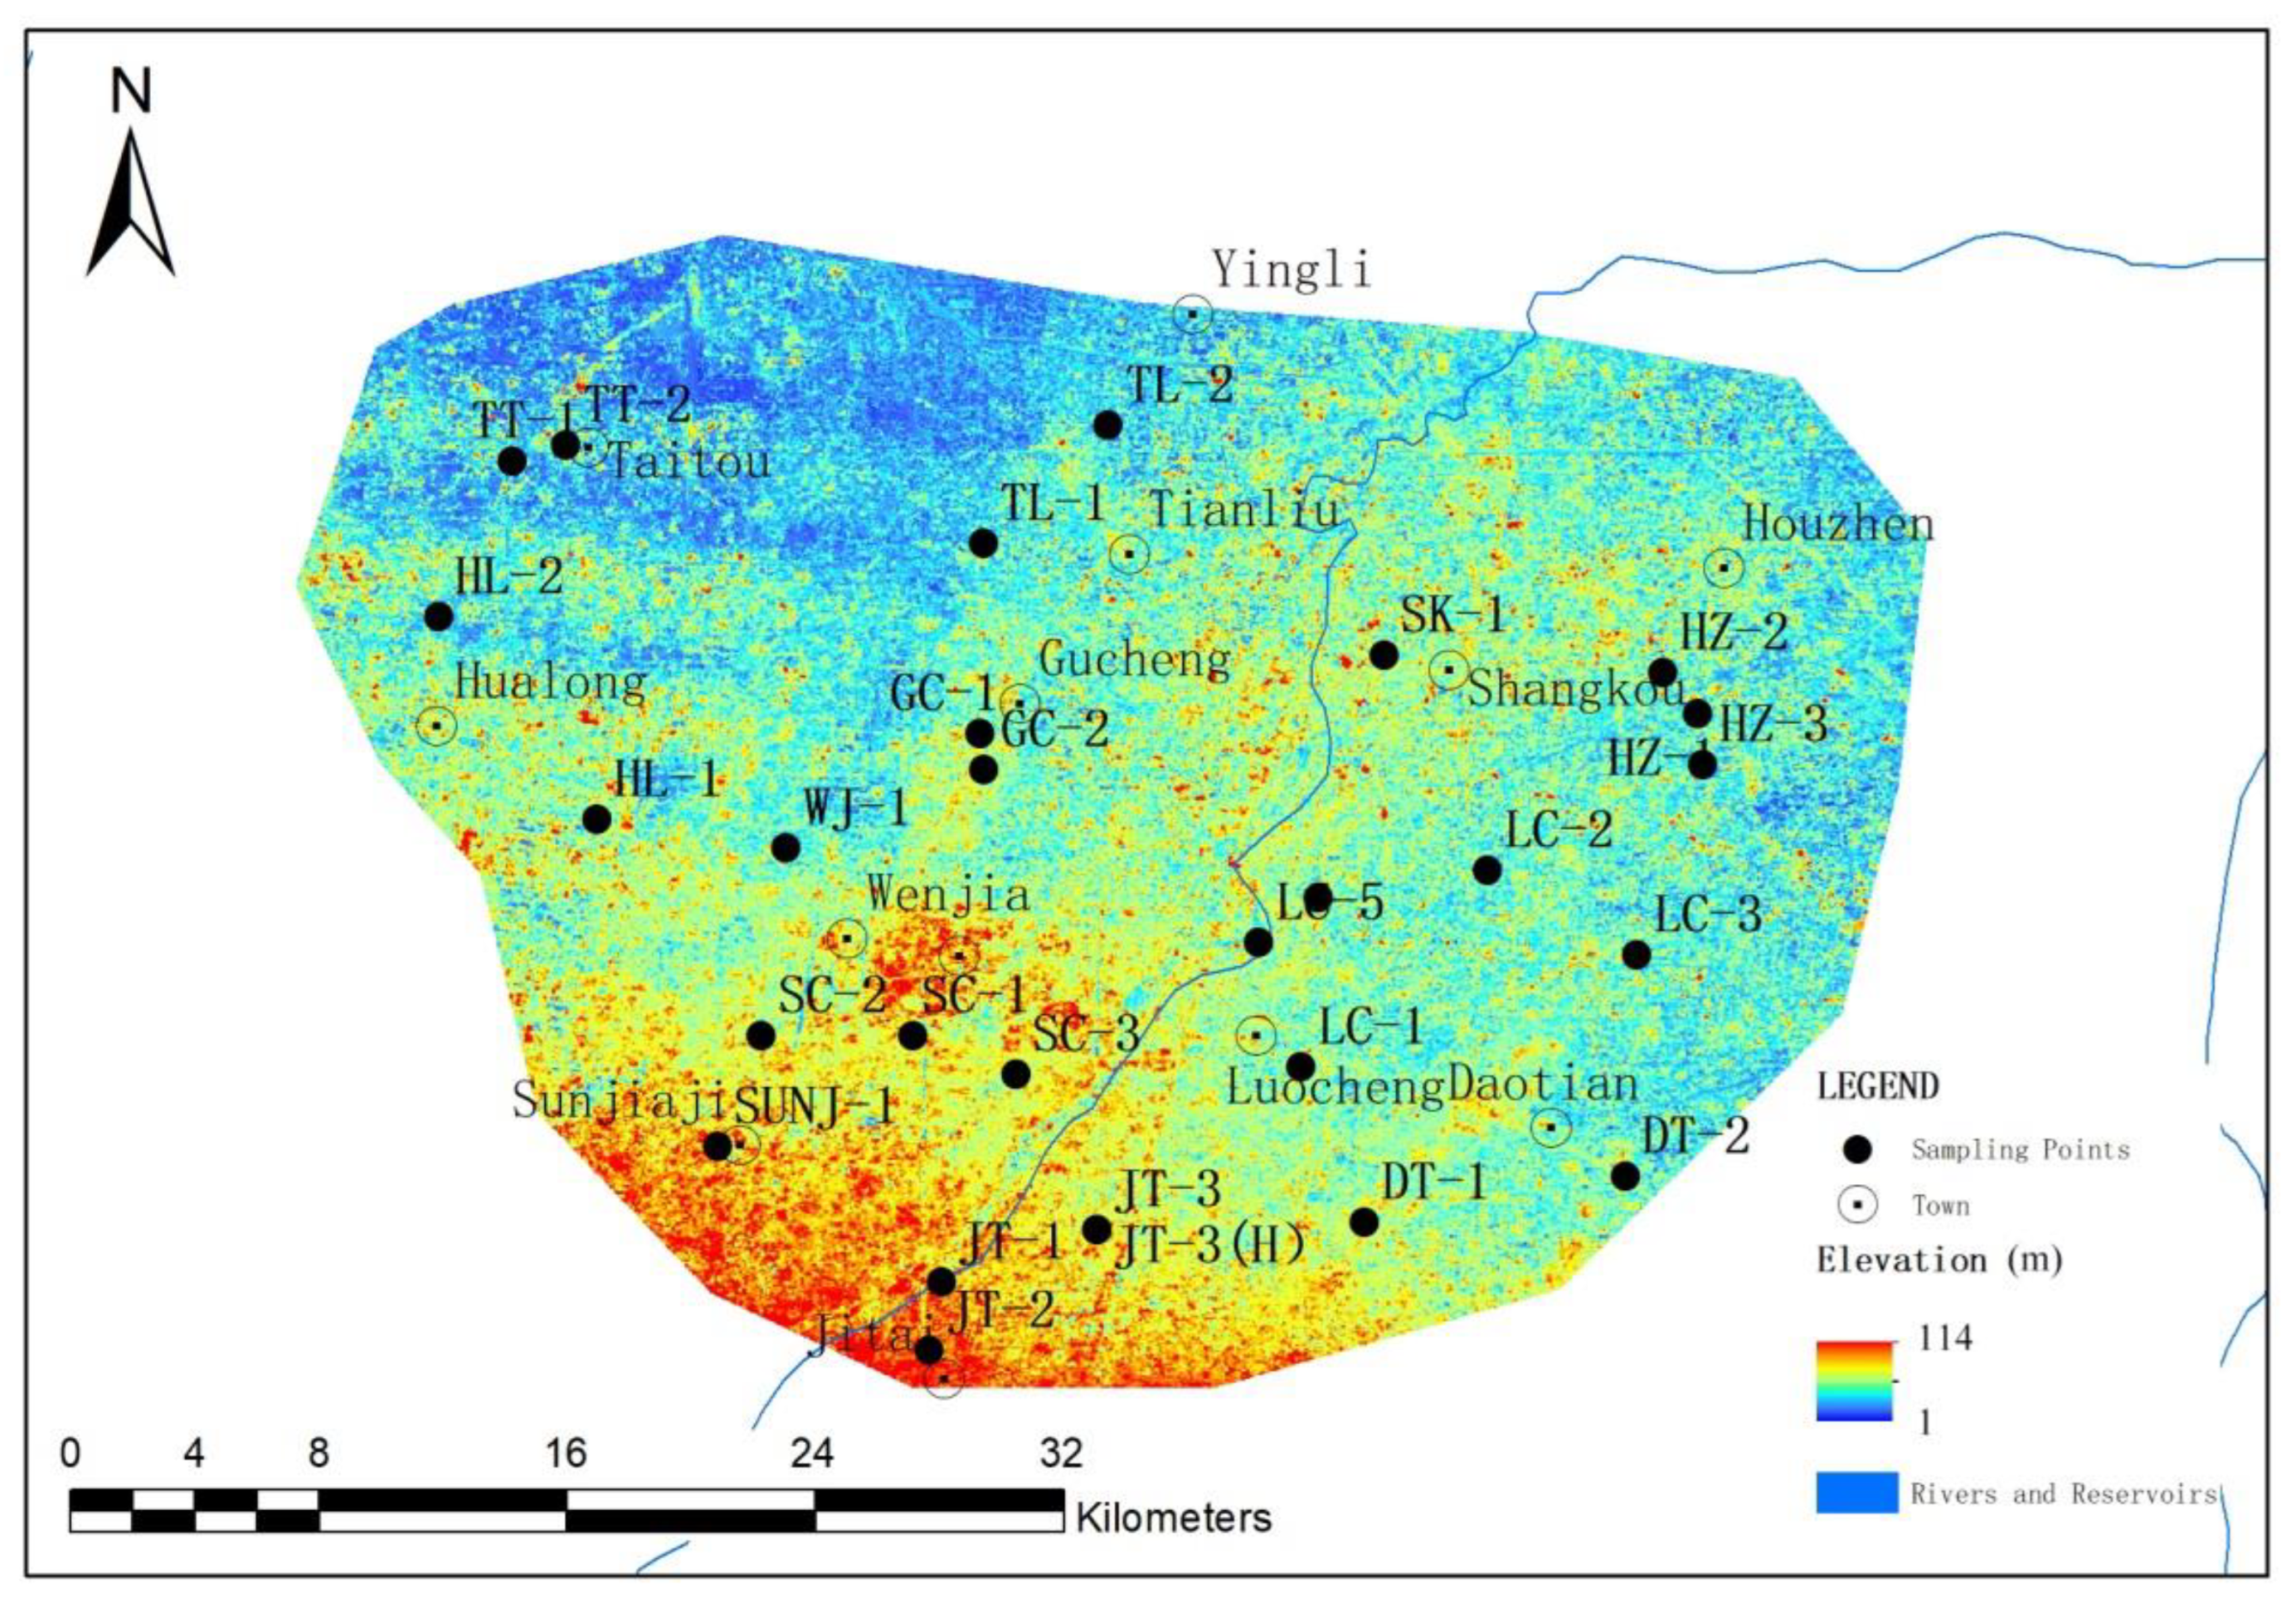
After fully considering the factors such as administrative division, river flow direction, and vegetable planting structure, following the idea of taking vegetable planting areas as the main and other types of crops as auxiliary, on 1 June 2021, 28 groundwater sampling sites with a depth of 8~40 m were selected in 12 towns (sub-districts), such as Shengcheng Street, Jitai Town, and Daotian Town, where protected vegetable cultivation was concentrated (see Figure 2). A diving sampler was used to take 5 L water samples, which were then stored in a polyethylene sampling bottle, sealed, and kept away from light. Water quality testing was carried out in the Key Laboratory of Water Resources and Water Environment of Shandong Province on June 4. The test indexes include Ca2+, Mg2+, Na+, K+, CO32−, HCO3−, SO42−, Cl−, TDS, NH3−, NH2−, pH, NH4+, Fe3+, As, Cu2+, Hg, Zn2+, and hardness.
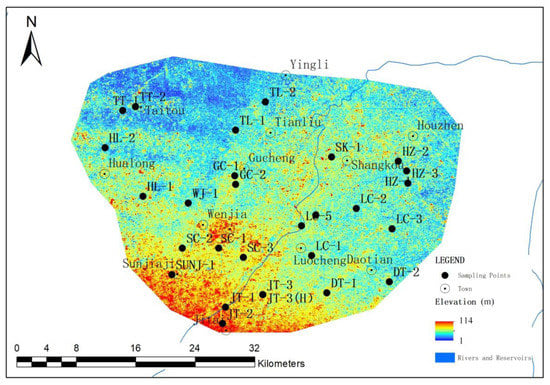
Figure 2.
Distribution map of sampling points.
2.4. Methods
The DEA model is an efficiency evaluation model first proposed by A. Charnes in 1978 based on the concept of single-input single-output engineering efficiency in mathematical statistics that solves the problem of multi-input multi-output efficiency [26]. After continuous improvement, C2R, BC2, FG, ST, C2WH, C2WY, and other models have been developed, which represent new interdisciplinary research methods that integrate operations research, management science, and mathematical economics.
Suppose there are n decision units (DMUj) (= 1, 2, …, n) and there are s input factors (X) and m output factors (Y) in any decision making unit, which are expressed as (= 1, 2, …, s), = 1, 2, …, m), and ( = 1, 2, …, s), while (= 1, 2, …, m) represents the weights of the input and output factors and θ represents the vulnerability index of a decision unit. The vulnerability index of the j-th DMU is calculated as:
where j represents the efficiency index of the j DMU, is the weight of the I input factor, is the weight of the p output factor, and j = 1, 2, …, ; i = 1, 2, …, s; p = 1, 2, …, m.
Generally speaking, the vulnerability index is presented as a number whose value is no less than 0 and no more than 1. When correspond to the constraints, the pollution risk equation can be expressed as:
where j = 1, 2, …, n; i = 1, 2, …, s; p = 1, 2, …, m.
In this model, the closer the value of the pollution risk index () is to 1, the greater the ratio of pollutant output to input; that is, the higher the pollution risk index, the more vulnerable the groundwater is to nitrate pollution, and the worse its self-recovery ability after pollution.
2.5. Variable Analysis
The influencing factors of nitrate pollution in shallow groundwater can be divided into natural factors and human factors. The natural factors mainly include rainfall, soil type, buried depth of groundwater, characteristics of aeration zone, thickness of sand layer, water yield of aquifer, etc. Human factors include the application amount of pesticide and chemical fertilizer, vegetable planting area, irrigation water consumption, crop type, quantity of livestock and poultry, etc. Along with the hydrogeology and soil types of the Mihe alluvial–diluvial fan, the application amount of agricultural nitrogen and pesticides, the stock of livestock and poultry, the buried depth of groundwater, the water yield of aquifer, the planting area of vegetables, and the content of nitrate ions in groundwater are used as the input and output variables of the model. The amount of agricultural nitrogen fertilizer and pesticide application, livestock and poultry stock, and vegetable planting area were taken from the 2020 statistical yearbook of Weifang, and the data on groundwater depth are from the Water Resources Bulletin. The water abundance of the aquifer comes from the comprehensive investigation results of hydrogeology, engineering geology, and environmental geology in the 1:100,000 regional Blue Economic Zone of the peninsula. At the same time, it is divided into four grades and categorized according to the water inflow of different single wells, including 4500–1000 m³/d (assigned 3), 3100–500 m³/d (assigned 2), and less than 100 m³/d (assigned 1). The contents of nitrate ions and other hydrochemical analysis ions were obtained from field sampling and detection.
Because the nitrate ion content of groundwater can be regarded as the part that is not absorbed and utilized by crops after excessive application of nitrogen-containing chemical fertilizers and pesticides and the part of nitrate that is not intercepted by the aeration zone enters the phreatic zone with the scouring of rainwater, the application amount of nitrogen-containing fertilizer (X1), groundwater buried depth (X2), vegetable planting area (X3), pesticide use amount (X4), the aquifer water yield (X5), and the number of livestock and poultry (X6) are used as the input variables of the model and the nitrate content of the shallow groundwater (Y1) is used as the output variable of the model.
2.6. Calculation
In this study, each decision-making unit (DMU) has six input variables and one output variable, and the risk index equation of groundwater diving zone by type (2) with 28 DMUs can be expressed as:
where represents the nitrate content in the groundwater diving zone of the j-th decision unit in the research area; , X5j, and X6j represent nitrogenous fertilizer application, groundwater depth, vegetable planting area, pesticide application, water yield property, and livestock and poultry quantity (pig equivalent) in the j-th decision unit, respectively. j represents the sequence of units.
For Equation (3), the relaxation variable is introduced, and Equation (3) can be expressed as:
where represents the nitrate content in the groundwater diving zone of the j-th decision unit in the research area; , X5j, and X6j represent nitrogenous fertilizer application, groundwater depth, vegetable planting area, pesticide application, water yield property, and livestock and poultry quantity (pig equivalent) in the j-th decision unit, respectively. j represents the sequence of units.
3. Results
3.1. Water Quality Characteristics
The analysis of water quality characteristics is based on the groundwater quality standard (GB/T 14848-2017) issued by the China National Standardization Administration Committee in 2017. According to the content of chemical components in groundwater (except pH), the groundwater quality is divided into five grades of class (I–V), and the limit value of each chemical component is specified. Among them, class I–II water indicates that the groundwater has few chemical components and is suitable for various purposes; class III water indicates that the chemical component content of the groundwater is medium, which makes it suitable for domestic drinking water sources and industrial and agricultural water; class IV indicates that the content of the chemical components is high, which makes it suitable for agriculture and industrial use and for domestic drinking water only after proper treatment; and class V water indicates that the chemical composition of the groundwater is high and should not be used as a source of drinking water. At the same time, the hygienic standard for drinking water (GB5749-2022) stipulates the limit value of domestic water quality, which is equal to the class III water limit in the groundwater quality standard (GB/T 14848-2017). Therefore, the class III water limit in the groundwater quality standard can be used as the basis for whether there is pollution in the groundwater in the study area.
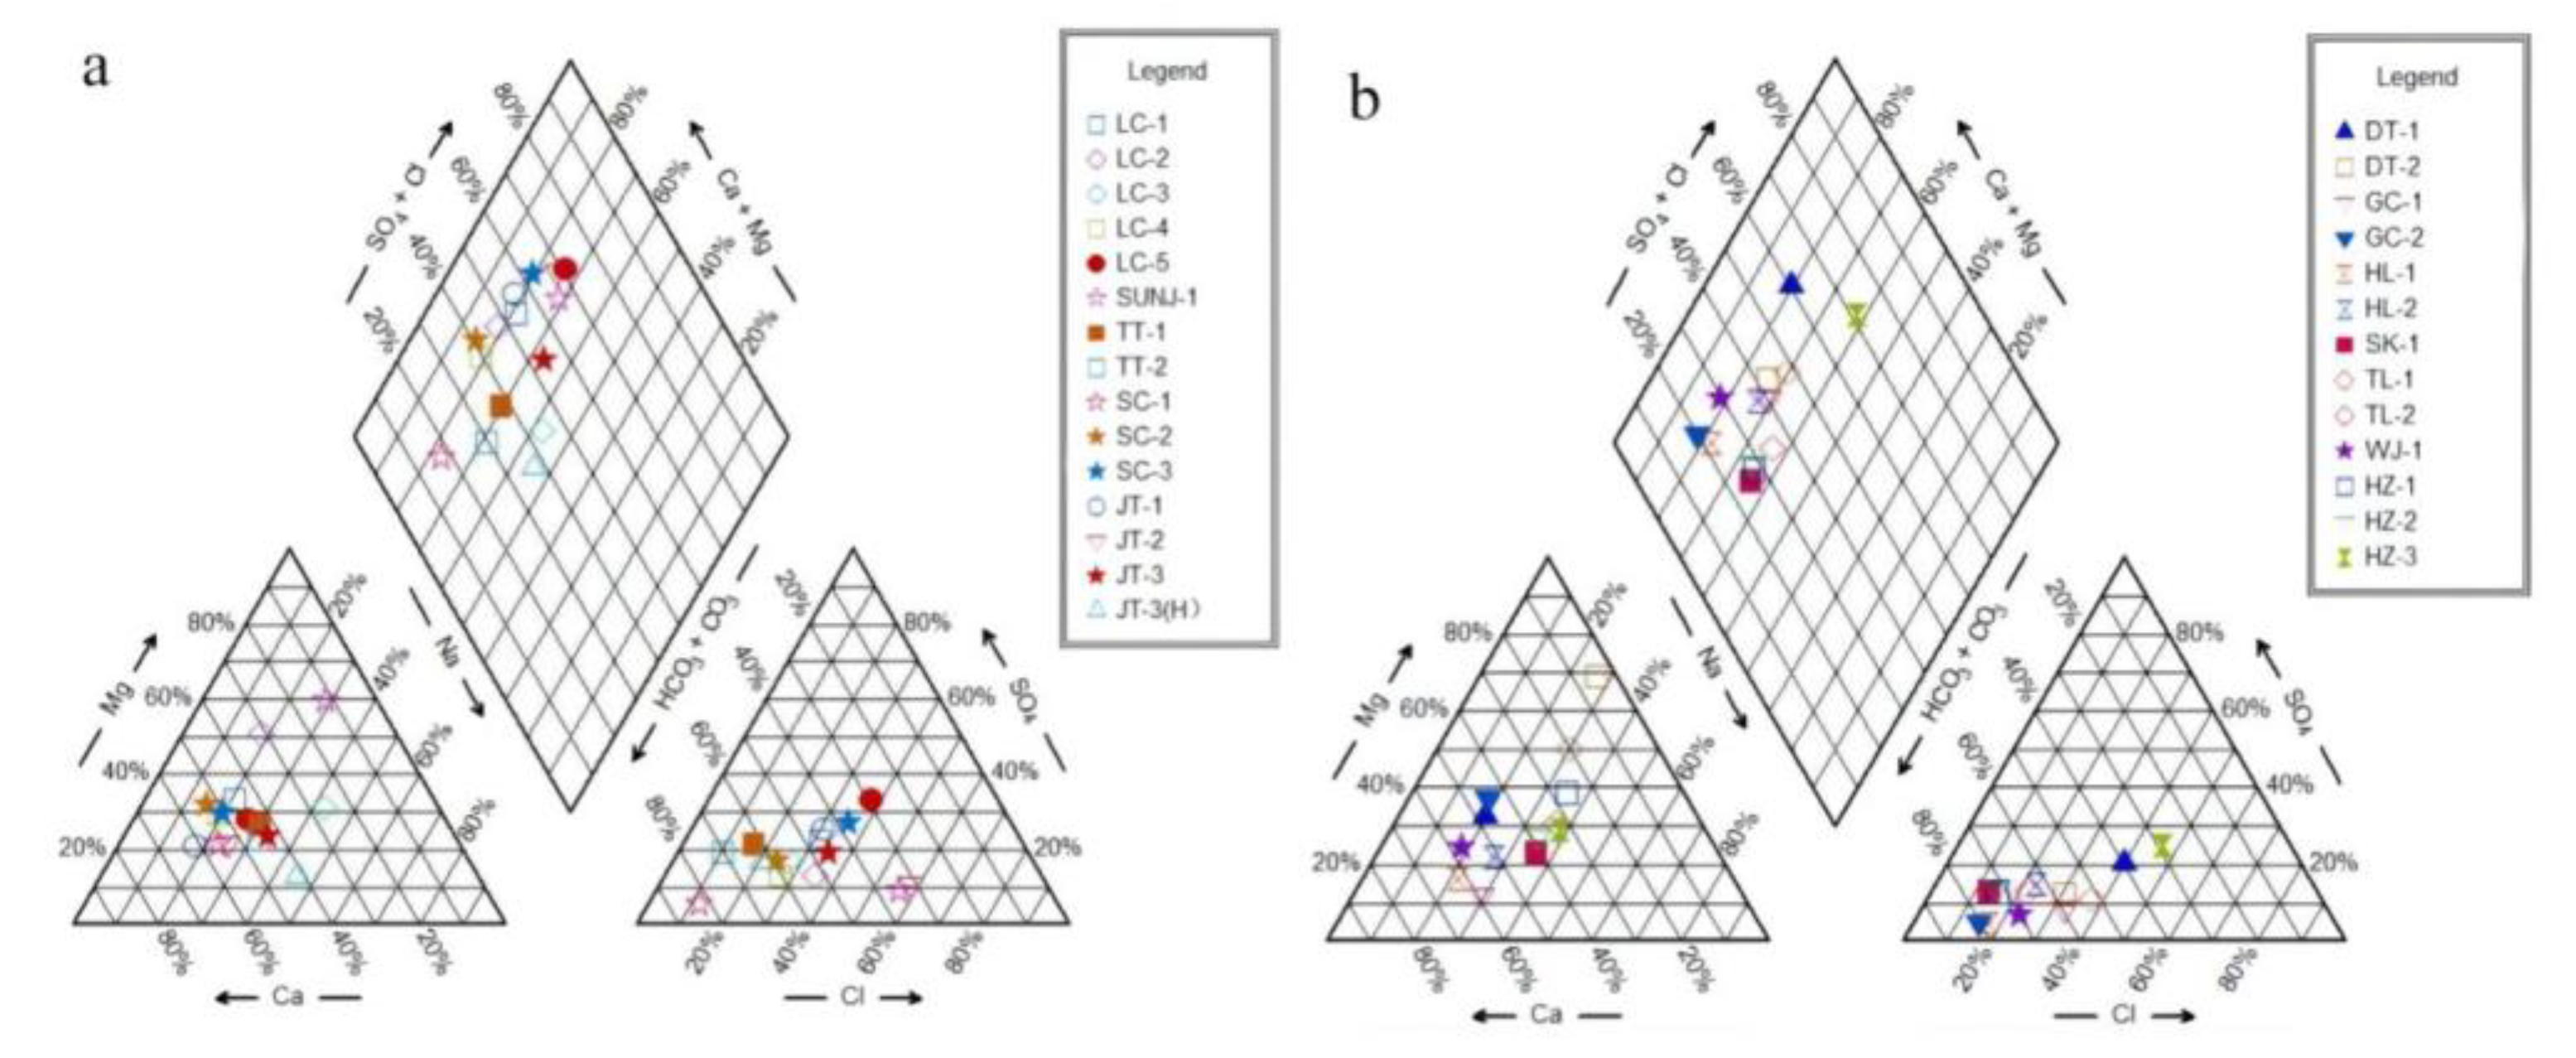
The water quality of 28 groundwater samples was tested. According to the ion concentration in the test results, the chemical characteristics of the groundwater samples were analyzed using the hydrochemical analysis software AqQA to form a piper diagram (see Figure 3). The main cations in the sample are Ca2+, Mg2+, and Na+ and the main anions are HCO3− and Cl−. The pH value is between 7 and 8. It is weakly alkaline water. The main hydrochemical type is HCO3-Ca, accounting for 60.7% of the total water samples. This is because the groundwater in the study area mainly occurs in limestone and the calcareous and argillaceous dolomite of the Cambrian Zhushadong formation in the Shouguang uplift. The lithology in the southwest of the study area is mainly basalt, sandstone, and porous basalt. The other hydrochemical types are HCO3-Mg, HCO3-Na, Cl-Ca, Cl-Mg, and Cl-Na. According to the quality standard for groundwater (GB/T 148484-2017), the proportion of class IV water samples in the total sample volume is 43%, and the nitrate concentration has great spatial heterogeneity, with a coefficient of variation of 0.997. The specific distribution characteristics are that the nitrate content in the fan edge area of the alluvial proluvial fan is low and that in the upstream of the alluvial proluvial fan is high. The routine chemical indexes and of other sampling points meet the standards of class III water and above; that is, they meet the hygienic quality standards of people’s daily drinking water.
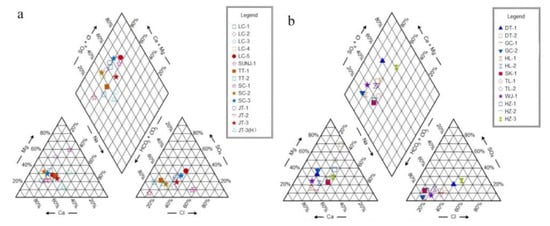
Figure 3.
Piper diagram of groundwater in the Mihe alluvial–diluvial fan. (a) The water sample of the southern sampling point of the study area, (b) is the water sample of the northern sampling point.)
3.2. Traceability Analysis of Nitrate Pollution in Groundwater
Through the calculation and analysis of nitrogen emissions from nitrate pollution in the Mihe alluvial–diluvial fan, of the total nitrogen emissions the contribution of protected vegetable cultivation was 43%, and that of livestock and poultry farming was 17%. The contribution rate of agricultural cultivation to ammonia nitrogen emissions in this area was as high as 82% (see Table 2). It can be seen in terms of both ammonia nitrogen and total nitrogen emissions that agricultural cultivation and livestock and poultry breeding are the main sources of nitrogen pollution. As it is difficult to form surface runoff in farmland and protected vegetable planting areas after rainfall, the discharged nitrogen enters the ground through leaching, intercepts through the vadose zone, and the rest enters the shallow groundwater and then nitrifies, resulting in the nitrate pollution of groundwater.
Table 2.
Contribution rate of nitrogen source pollution of Mihe alluvial–diluvial fan in 2019.
3.3. Nitrate Pollution Risk
The optimal weight of the input variables of each DMU was obtained by solving Equation (4), and then the vulnerability index of each DMU was calculated using Equation (1). The calculated results are shown in Table 3.
Table 3.
Calculation of nitrate pollution risk index of shallow groundwater in the Mihe alluvial–diluvial fan.
Using the calculation results of the nitrate pollution risk index at each sampling point, the Kriging interpolation method was used to draw the distribution map of the nitrate pollution risk in the shallow groundwater of the Mihe alluvial–diluvial fan. The average pollution risk index of each decision-making unit was 0.382 and the spatial variation coefficient was 1.12. In the area with concentrated vegetable planting in the south of the alluvial–proluvial fan, the groundwater has poor resistance to nitrate pollution and high pollution risk. The pollution risk level gradually decreases from south to north. Hualong Town, Gucheng street, and Shangkou town have become transition zones. The pollution risk in the north of this transition zone is low and the risk in the south is high (as shown in Figure 4a).
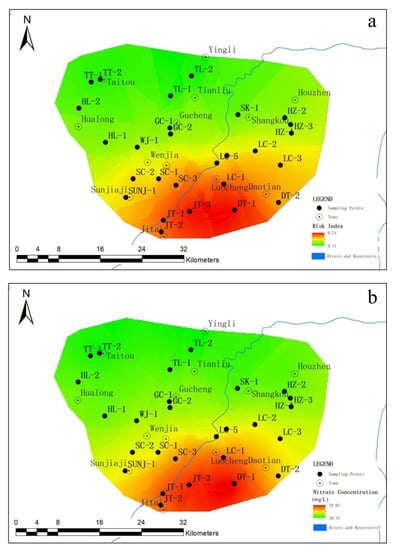
Figure 4.
Nitrate pollution risk index distribution and nitrate content distribution. (a) is the distribution map of nitrate pollution risk index in the study area, (b) is the distribution map of nitrate in shallow groundwater.)
3.4. Reliability Analysis
After calculating the vulnerability index, Equation (5) was used to calculate the Spearman correlation coefficient and calculate the nitrate content in the shallow groundwater at the same time. The vulnerability index of the Pearson correlation coefficient is extremely significant, verifying the vulnerability index and the relevance of the nitrate pollution in the shallow groundwater and the rationality of the groundwater vulnerability results.
N—Total number of sampling points;
—The ranking difference between groundwater vulnerability and nitrate pollution degree of groundwater at sampling site .
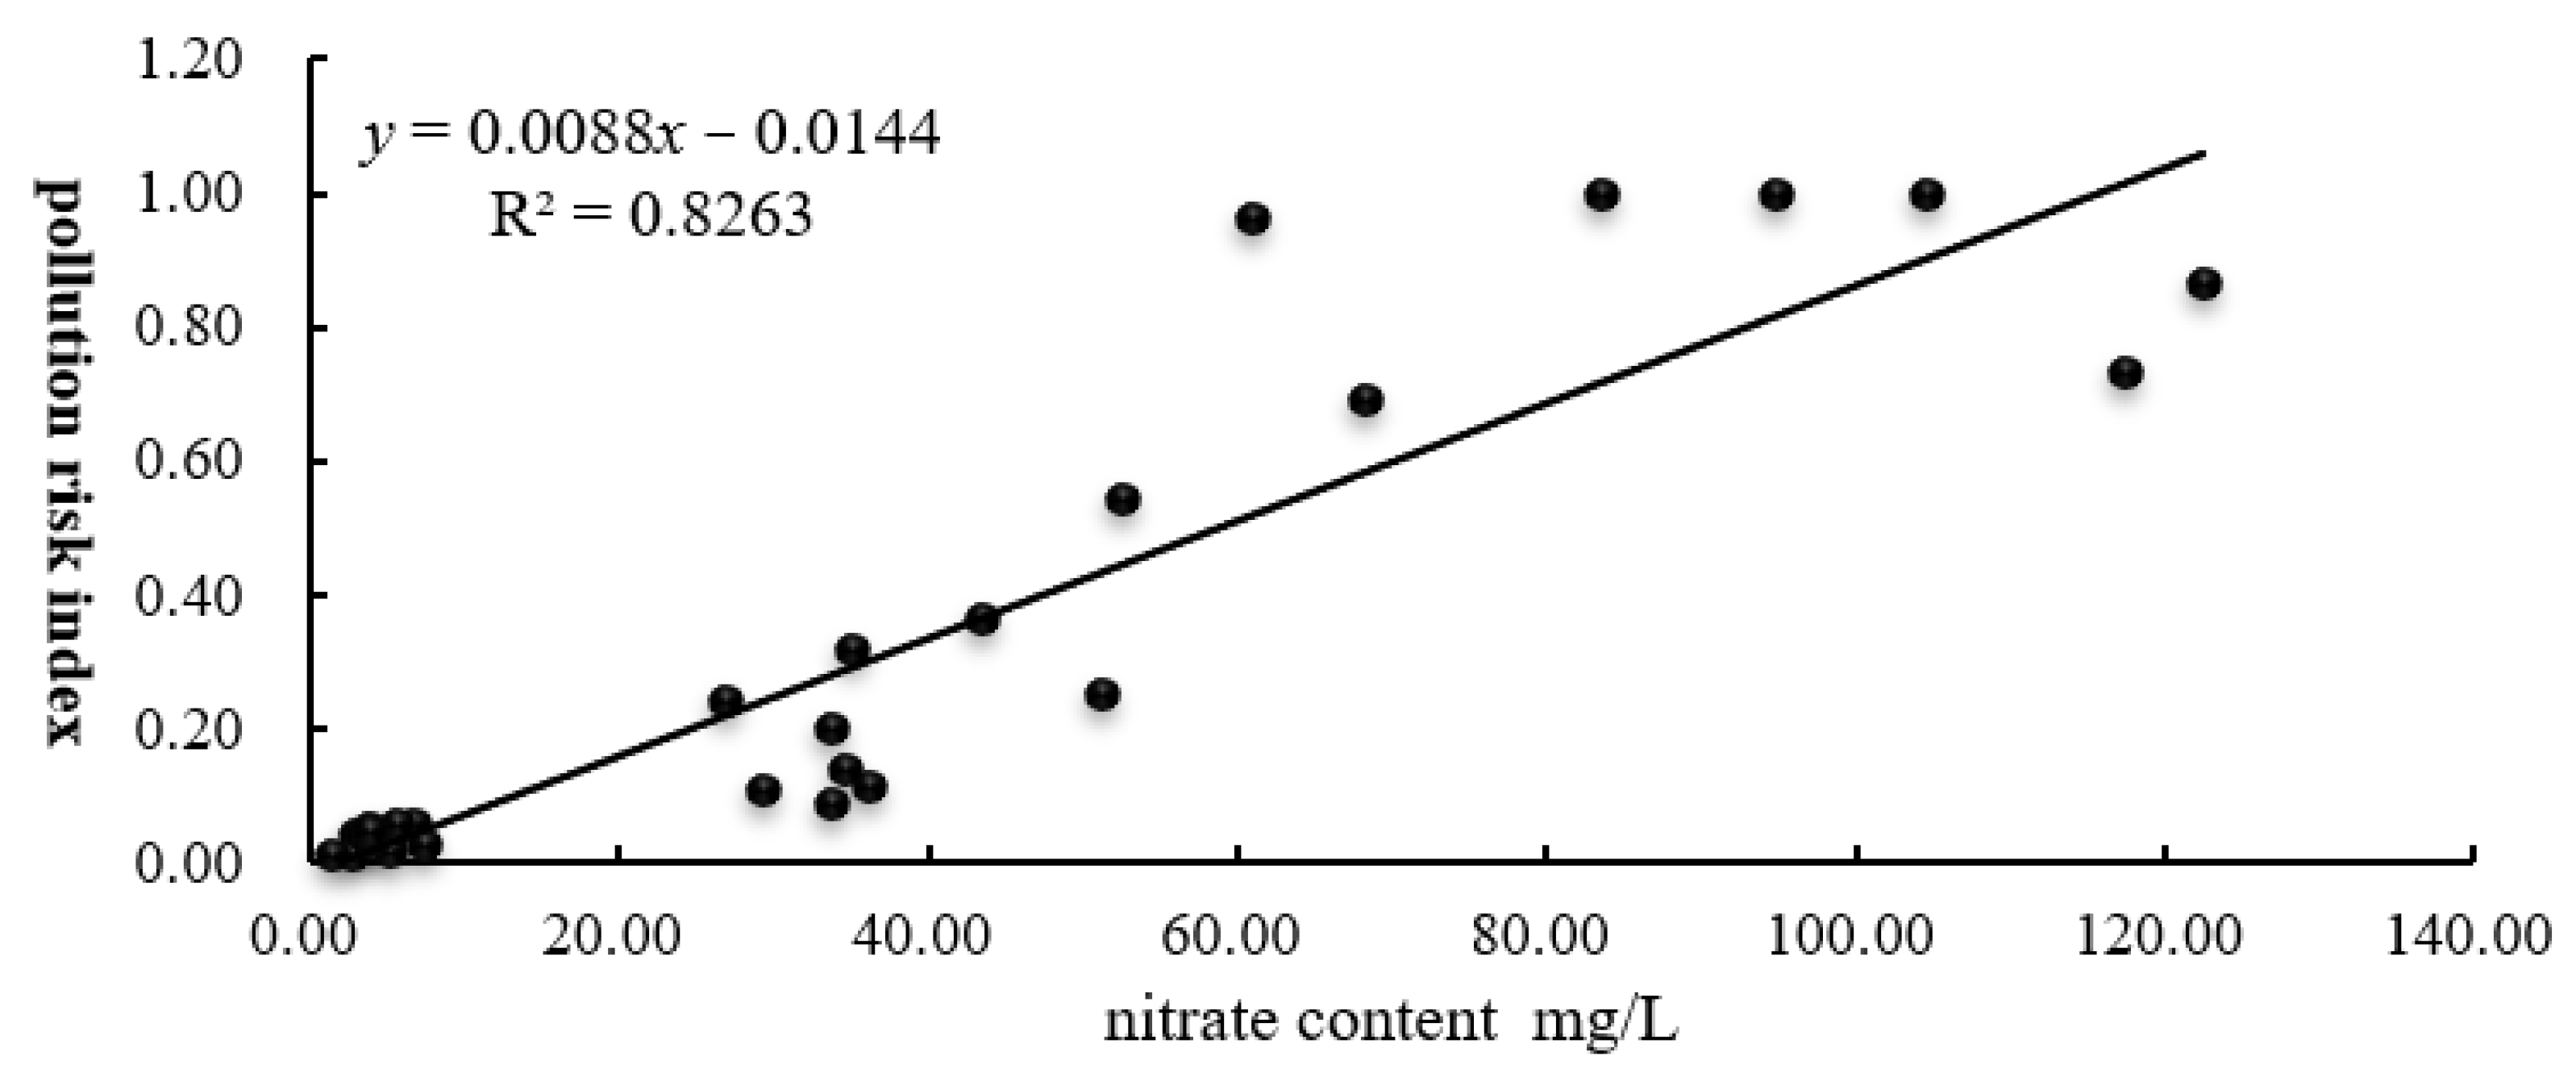
The results of the calculation show that the correlation coefficient was 0.935 and the Pearson correlation coefficient of the nitrate content vulnerability index was 0.909, showing a significant correlation at the level of 0.01 (as shown in Figure 5). The results show that the groundwater vulnerability index evaluated by this model is in agreement with the nitrate pollution degree in the groundwater and that the two are strongly correlated. The evaluation results are reliable and effective.
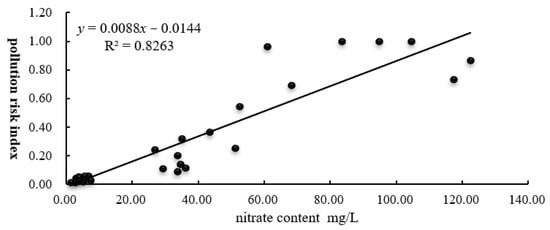
Figure 5.
Correlation diagram between nitrate content and pollution risk index.
4. Discussion
In this study, a DEA model was used to evaluate the nitrate pollution risk of shallow groundwater in the vegetable planting area of the Mihe alluvial–diluvial fan, and the results showed that the pollution risk was generally low. It can be seen from Figure 4b that the distribution of nitrate content is highly consistent with the distribution of the pollution risk index, indicating that the DEA model is reliable for evaluating groundwater nitrate pollution. Due to excessive fertilizer application, nitrogen that has not been absorbed by plants is washed into the groundwater by rain. When combined with nitrogen discharge caused by livestock and poultry breeding, the NO3− limit in the shallow groundwater in this area reaches 60% of IV and V water and nitrate content in sampling wells, with burial depth greater than 80 m less than 5 mg/L. This indicates that the nitrate pollution of groundwater in this area is mainly pollution of shallow groundwater. However, the sampling time was during the rainy season, and the sampling was a single sampling, lacking a long series of data. The lack of data means that we failed to analyze the water pollution caused by different crop types and other areas caused by groundwater flow. This is the next problem to be solved in the study area.
According to the research of other scholars, the impact of economic system reform and changes in the international economic situation, as well as changes in the environmental protection policies surrounding agricultural production and the agricultural product market, are the main reason for the change in pollution load [27]. For example, from 1999 to 2006, under the free market mechanism, the commercial properties of agricultural products were displayed, which stimulated the production of agricultural products and increased pollution load [28]. Affected by the financial crisis in 2007, livestock and poultry production sharply reduced, and the pollution load also decreased [29]. From 2007 to 2015, due to the economic recovery and a series of favorable agricultural policies, the pollution load began to grow slowly. In 2015–2019, with the improvement and implementation of environmental protection policies, the pollution load decreased year by year. However, due to the gradual conversion of cultivated land into construction land or the abandonment of land, more fertilizers and pesticides need to be invested to ensure crop yield, which leads to the application amount of pesticides and fertilizers being less affected by the economic situation [30,31]. This shows that the input of potential pollution sources of production factors is affected by agricultural policies to a certain extent.
From the perspective of pollution sources, the main factors causing nitrate non-point source pollution are the excessive application of chemical fertilizers and pesticides and the discharge of livestock and poultry manure. The increase in urbanization reduces the area of cultivated land and weakens agricultural production activities. However, in order to increase food production, the input intensity of production factors of cultivated land will increase. Therefore, the increase in urbanization rate not only reduces the load of non-point source pollution but also increases the input intensity of cultivated land [32]. At present, the utilization rate of chemical fertilizers and pesticides in China is low. From 1978 to 2017, the annual application rate of chemical fertilizers in China increased from 8.84 million tons to 58.59 million tons, and the annual application rate of pesticides increased from 7300 tons to 1.66 million tons. However, the utilization rate of chemical fertilizers and pesticides is less than 1/3, and the treatment rate of livestock and poultry manure is less than 1/2 [28]. A large amount of investment in agriculture and chemical fertilizer has caused agricultural non-point source pollution. As the largest intensive vegetable planting center in China, the pollution problem faced by the study area is more serious. Therefore, when solving the problem of agricultural non-point source pollution, we should mainly seek to improve the utilization rate of the agricultural production factors [33], while secondarily reducing retail livestock and poultry breeding, in order to gradually improve the fecal sewage treatment system of the large-scale livestock and poultry breeding industry.
5. Conclusions
- (1)
- The overall pollution index of the study area is low, but the spatial variability is high, and the difference of spatial distribution is obvious, which is reflected in the higher pollution risk in the area with higher vegetable planting density and the lower pollution risk in the area with lower vegetable planting density in the north.
- (2)
- The groundwater quality in most of the middle and lower reaches of Mihe alluvial fan meets the class III water standard of groundwater quality, but the nitrate content in some areas in the south is more than 20 mg/L, which exceeds the class III water limit.
- (3)
- Agricultural production and livestock breeding are the main sources of nitrogen emissions, and the nitrogen discharged into groundwater by leaching, nitrification, and other chemical reactions results in nitrate contents in the groundwater beyond the set limits.
Author Contributions
Conceptualization, H.C. and F.L.; methodology, F.L., H.C., A.Z., X.Z. and Q.Z.; software, Q.Z. and T.S.; validation, F.L., H.C., X.Z., T.S. and Q.Z.; formal analysis, Q.Z.; investigation, Q.Z.; resources, Q.Z.; data curation, Q.Z.; writing—original draft preparation, Q.Z.; writing—review and editing, Q.Z., F.L., A.Z., X.Z., H.C. and T.S.; project administration, F.L.; funding acquisition, F.L. and H.C. All authors have read and agreed to the published version of the manuscript.
Funding
This research was financially supported by the National Key Research and Development Program of China (2021YFC3200504), the Key Hydraulic Engineering Research and Experiment Project for River Basin Water Conservancy Management and Service Center of Shandong Province (XQHFHZL-KY202004), the Ministry of Water Resources’ Special Funds for Scientific Research on Public Welfare (201401003), the International Science and Technology Cooperation Program of China (2012DFG22140), and the sub-project of the National Science and Technology Major Project on Water Pollution Control and Treatment (2012ZX07404-003).
Acknowledgments
The authors acknowledge the valuable comments made by the reviewers, which led to significant improvements in the paper.
Conflicts of Interest
The authors declare no conflict of interest.
References
- Thorburn, P.J.; Biggs, J.S.; Weier, K.L.; Keating, B.A. Nitrate in Groundwaters of Intensive Agricultural Areas in Coastal Northeastern Australia. Agric. Ecosyst. Environ. 2003, 94, 49–58. [Google Scholar] [CrossRef]
- Rosenstock, T.S.; Liptzin, D.; Dzurella, K.; Fryjoff-Hung, A.; Hollander, A.; Jensen, V.; King, A.; Kourakos, G.; McNally, A.; Pettygrove, G.S.; et al. Agriculture’s Contribution to Nitrate Contamination of Californian Groundwater (1945–2005). J. Environ. Qual. 2014, 43, 895–907. [Google Scholar] [CrossRef] [Green Version]
- Wang, Y.G.; Wang, H.Y.; Zheng, Y.L.; Sun, X.Y. Advances in Research Methods and Control Technologies of Agricultural Non-Point Source Pollution: A Review. Chin. J. Agric. Resour. Reg. Plan. 2021, 42, 25–33. [Google Scholar]
- Ju, X.-T.; Xing, G.-X.; Chen, X.-P.; Zhang, S.-L.; Zhang, L.-J.; Liu, X.-J.; Cui, Z.-L.; Yin, B.; Christie, P.; Zhu, Z.-L.; et al. Reducing Environmental Risk by Improving N Management in Intensive Chinese Agricultural Systems. Proc. Natl. Acad. Sci. USA 2009, 106, 3041–3046. [Google Scholar] [CrossRef] [PubMed] [Green Version]
- Infascelli, R.; Pelorosso, R.; Boccia, L. Spatial Assessment of Animal Manure Spreading and Groundwater Nitrate Pollution. Geospat Health 2009, 4, 27–38. [Google Scholar] [CrossRef] [PubMed] [Green Version]
- Ma, L.; Lu, J.; Zhao, J. Nitrate Vulnerable Zones and strategies of non-point pollution mitigation in China. J. Agro-Environ. Sci. 2018, 37, 2387–2391. [Google Scholar]
- Zhao, T.K. Nitrate Pattern and Control of Groundwater in Pan-Rim Bohai Sea Area; Science Press: Beijing, China, 2014. [Google Scholar]
- Machiwal, D. Identifying Sources of Groundwater Contamination in a Hard-Rock Aquifer System Using Multivariate Statistical Analyses and GIS-Based Geostatistical Modeling Techniques. J. Hydrol. 2015, 4, 80–110. [Google Scholar] [CrossRef] [Green Version]
- Mester, T.; Szabó, G.; Balla, D. Assessment of Shallow Groundwater Purification Processes after the Construction of a Municipal Sewerage Network. Water 2021, 13, 1946. [Google Scholar] [CrossRef]
- Wendland, F.; Bergmann, S.; Eisele, M.; Gömann, H.; Herrmann, F.; Kreins, P.; Kunkel, R. Model-Based Analysis of Nitrate Concentration in the Leachate—The North Rhine-Westfalia Case Study, Germany. Water 2020, 12, 550. [Google Scholar] [CrossRef] [Green Version]
- Hu, K.L.; Li, B.G.; Huang, Y.F. Stochastic simulation and risk assessment of nitrate leaching at field scale. Acta Pedol. Sin. 2005, 42, 909–915. [Google Scholar]
- Shaffer, M.J.; Halvorson, A.D.; Pierce, F.J. Nitrate Leaching and Economic Analysis Package (NLEAP): Model Description and Application. In Managing Nitrogen for Groundwater Quality and Farm Profitability; Follett, R.F., Keeney, D.R., Cruse, R.M., Eds.; Soil Science Society of America: Madison, WI, USA, 2015; pp. 285–322. ISBN 978-0-89118-877-3. [Google Scholar]
- Ramos, C. Nitrate Leaching and Soil Moisture Prediction with the LEACHM Model. Fertil. Res. 1991, 27, 171–180. [Google Scholar] [CrossRef]
- Hansen, S.; Jensen, H.E.; Nielsen, N.E. Simulation of Nitrogen Dynamics and Biomass Production in Winter Wheat Using the Danish Simulation Model DAISY. Fertil. Res. 1991, 27, 245–259. [Google Scholar] [CrossRef]
- Hanson, J.D.; Ahuja, L.R.; Shaffer, M.D.; Rojas, K.W.; DeCoursey, D.G.; Farahani, H.; Johnson, K. RZWQM: Simulating the Effects of Management on Water Quality and Crop Production. Agric. Syst. 1998, 57, 161–195. [Google Scholar] [CrossRef]
- Cao, Q.H.; Gong, Y.S. Simulation and analysis of water balance and nitrogen leaching using Hydrus-1D under winter wheat crop. Plant Nutr. Fertil. Sci. 2003, 9, 139–145. [Google Scholar]
- Liu, P.B.; Ding, Y.Y.; Zhang, Y.F. The study of 1-dimension saturated-unsaturated mathematical model of nirigen transport and transformation for the field conditions. J. Shenyang Norm. Univ. 2000, 37, 490–497. [Google Scholar]
- Shrestha, A.; Luo, W. Assessment of Groundwater Nitrate Pollution Potential in Central Valley Aquifer Using Geodetector-Based Frequency Ratio (GFR) and Optimized-DRASTIC Methods. IJGI 2018, 7, 211. [Google Scholar] [CrossRef] [Green Version]
- Jarray, H.; Zammouri, M.; Ouessar, M.; Zerrim, A.; Yahyaoui, H. GIS Based DRASTIC Model for Groundwater Vulnerability Assessment: Case Study of the Shallow Mio-Plio-Quaternary Aquifer (Southeastern Tunisia). Water Resour. 2017, 44, 595–603. [Google Scholar] [CrossRef]
- Lu, Y.Y.; Li, P.P. Effects of applocation of nitrogen fertilizer on pollutions. J. Shenyang Norm. Univ. 2014, 32, 1–5. [Google Scholar]
- Gao, X.Q.; Gao, J.Y.; Zhang, N. Variation Characteristics of Precipitation, Rain Days and Rainfall Intensity in Shouguang During Recent 56 Years. Chin. Agric. Sci. Bull. 2016, 32, 106–112. [Google Scholar]
- Mosier, A.; Syers, J.K.; Freney, J.R. Agriculture and the Nitrogen Cycle: Assessing the Impacts of Fertilizer Use on Food Production and the Environment; Island Press: Washington, DC, USA, 2004; Volume 65. [Google Scholar]
- Cameron, K.C.; Di, H.J.; Moir, J.L. Nitrogen Losses from the Soil/Plant System: A Review: Nitrogen Losses. Ann. Appl. Biol. 2013, 162, 145–173. [Google Scholar] [CrossRef]
- Rivett, M.O.; Buss, S.R.; Morgan, P.; Smith, J.W.N.; Bemment, C.D. Nitrate Attenuation in Groundwater: A Review of Biogeochemical Controlling Processes. Water Res. 2008, 42, 4215–4232. [Google Scholar] [CrossRef] [PubMed]
- Tucker, T.C.; Westerman, R.L. Gaseous Losses of Nitrogen from Desert Region Soils. Arid. Soil Res. Rehabil. 1989, 3, 267–280. [Google Scholar] [CrossRef]
- Yang, G.L.; Liu, W.B.; Zheng, H.J. Review of date envelopment analysis. J. Syst. Eng. 2013, 28, 840–860. [Google Scholar]
- Fan, L.; Yuan, Y.; Ying, Z.; Lam, S.K.; Liu, L.; Zhang, X.; Liu, H.; Gu, B. Decreasing Farm Number Benefits the Mitigation of Agricultural Non-Point Source Pollution in China. Environ. Sci. Pollut. Res. 2019, 26, 464–472. [Google Scholar] [CrossRef]
- Zou, L.; Liu, Y.; Wang, Y.; Hu, X. Assessment and Analysis of Agricultural Non-Point Source Pollution Loads in China: 1978–2017. J. Environ. Manag. 2020, 263, 110400. [Google Scholar] [CrossRef]
- Zhang, T.; Ni, J.; Xie, D. Assessment of the Relationship between Rural Non-Point Source Pollution and Economic Development in the Three Gorges Reservoir Area. Environ. Sci. Pollut. Res. 2016, 23, 8125–8132. [Google Scholar] [CrossRef]
- Yang, R.; Zhang, J.; Xu, Q.; Luo, X. Urban-Rural Spatial Transformation Process and Influences from the Perspective of Land Use: A Case Study of the Pearl River Delta Region. Habitat Int. 2020, 104, 102234. [Google Scholar] [CrossRef]
- Yang, C.; Liu, H.; Li, Q.; Cui, A.; Xia, R.; Shi, T.; Zhang, J.; Gao, W.; Zhou, X.; Wu, G. Rapid Urbanization Induced Extensive Forest Loss to Urban Land in the Guangdong-Hong Kong-Macao Greater Bay Area, China. Chin. Geogr. Sci. 2021, 31, 93–108. [Google Scholar] [CrossRef]
- Lu, H.; Xie, H. Impact of Changes in Labor Resources and Transfers of Land Use Rights on Agricultural Non-Point Source Pollution in Jiangsu Province, China. J. Environ. Manag. 2018, 207, 134–140. [Google Scholar] [CrossRef]
- Zhang, Y.; Yu, Q. Identification of Current Research Intensity and Influence Factors of Agricultural Nitrogen Loss from Cropping Systems. J. Clean. Prod. 2020, 276, 123308. [Google Scholar] [CrossRef]

Publisher’s Note: MDPI stays neutral with regard to jurisdictional claims in published maps and institutional affiliations. |
© 2022 by the authors. Licensee MDPI, Basel, Switzerland. This article is an open access article distributed under the terms and conditions of the Creative Commons Attribution (CC BY) license (https://creativecommons.org/licenses/by/4.0/).