Article

Generation of Tequila Vinasses, Characterization, Current Disposal Practices and Study Cases of Disposal Methods

by
Florentina Zurita
1,*,
Allan Tejeda
1,
Arturo Montoya
1,
Isaías Carrillo
1,
Belkis Sulbarán-Rangel
2 and
Alejandra Carreón-Álvarez
3
1
Research Center in Environmental Quality, Centro Universitario de la Cienega, University of Guadalajara, Ocotlan 47820, Jalisco, Mexico
2
Department of Water and Energy, Centro Universitario de Tonala, University of Guadalajara, Tonala 45425, Jalisco, Mexico
3
Department of Natural and Exact Sciences, Centro Universitario de los Valles, University of Guadalajara, Carretera Guadalajara-Ameca km 45.5, Ameca 46600, Jalisco, Mexico
*
Author to whom correspondence should be addressed.
Water 2022, 14(9), 1395; https://doi.org/10.3390/w14091395
Submission received: 4 April 2022 / Revised: 23 April 2022 / Accepted: 24 April 2022 / Published: 26 April 2022
(This article belongs to the Special Issue Water ​Management and ​Environmental Protection)

Abstract

:
Tequila vinasse is a liquid waste generated during the production of tequila, an emblematic alcoholic beverage in Mexico. The objective of this study was to carry out an investigation on the tequila factories located in the state of Jalisco in order to know the location of the factories in the state, the characterization of the vinasses including factories of different sizes, the current treatment methods, and disposal practices as well as the impacts of common practices of vinasse disposal. Part of the information was collected by applying a questionnaire to the tequila factories previously contacted (and physically located). For the vinasse characterization, 24 tequila factories provided a composite sample of vinasse. To assess the impact of common vinasse disposal practices, a stream running through tequila factories, soil that has been used for vinasse discharge for 14 years, and a well located near the soil were evaluated. In two main regions (Valle and Altos Sur), 110 tequila factories distributed in 10 municipalities, were identified. Vinasse disposal and treatment problems are mainly related to micro-factories that do not treat their vinasse at all. The most common method of disposal is discharging on soils. Only in the Valle region is disposal in surface waters a common practice, as well as discharges into sewage systems. The monitored stream is totally degraded with low pH, high concentrations of organic matter, suspended solids, etc. Soil fertility has not been affected due to a method of vinasse discharge-soil rest. The texture of the soils (high content of clay and silt) has been decisive in protecting groundwater from the infiltration of vinasse. The results obtained in this study could help the authorities to develop adequate strategies for the management of vinasses (treatment and disposal), mainly in micro and small tequila factories.

1. Introduction

Tequila is a Mexican alcoholic beverage produced from the blue variety of the agave species Agave tequilana Weber The tequila production process involves the extraction of sugars from the cooked agave, the fermentation of the sugars, and the distillation of the fermented juice. The tequila Designation of Origin establishes that the blue variety of Agave tequilana Weber can only be produced in a specific geographical region that includes all the territory of the State of Jalisco and some municipalities of other states (Michoacán, Nayarit, Tamaulipas, and Guanajuato). Currently, 91% of tequila factories are located in Jalisco [1], but there is no available information regarding the factory distribution in the state which is divided into 12 regions, i.e., Norte, Altos Norte, Altos Sur, Ciénega, Sureste, Sur, Sierra de Amula, Costa Sur, Costa Norte, Sierra Occidental, and Valles y Centro. The production of this emblematic alcoholic beverage is one of the most important economic activities in Mexico. In 2019, 245.8 million liters of tequila were for export from the 351.7 million liters of tequila produced [2]. In the process of tequila production, there is a generation of a residual liquid (vinasse), which is produced mainly during the distillation process of the fermented agave juice, but also during the cooking of agave and the extraction of sugars. In general, it is considered that around 10–15 L of vinasse are generated per liter of tequila produced [3] depending on the production practices of each factory.
The Mexican Tequila Regulatory Council (CRT by its acronym in Spanish) determines the size of a tequila factory based on the volume of tequila produced per year. In this way, the factories are classified into micro (from 1 to 300 m3/year), small (from 300 to 1000 m3/year), medium (1000 to 3000 m3/year), and large (more than 3000 m3/year) factories [4]. Based on an estimate by [4], around 72 and 75% of tequila factories are micro in size and only between 10.3 and 12% are large. However, the actual total number of tequila factories is unknown, mainly because not all factories are registered in CRT, especially some of the micro and small size. Additionally, it is common for some tequila factories to stop operating without notifying CRT.
On the other hand, according to [5] based on the analysis of other authors, vinasse without treatment is commonly disposed of by direct irrigation in the field or direct discharge into aquatic bodies; while the technologies used for the vinasse treatment include activated sludge and anaerobic digestion with methane recovery. However, the extent of these practices was not analyzed by the authors nor was the influence of the size of the tequila factories on these practices. Vinasse treatment and disposal practices are likely to be determined by the size of the factory and knowing this information is relevant to developing strategies for managing them. Vinasse is considered among the most difficult industrial effluents (similar to other distillery effluents) to treat due to its physicochemical characteristics such as high concentrations of organic matter measured as chemical oxygen demand (COD) and biochemical oxygen demand (BOD5), high concentrations of total suspended solids (TSS) and total dissolved solids (TDS), acidic pH values, high conductivity values, high concentrations of fats and oils, Ca2+, Mg2+ and K. The high COD and BOD5 values are due to the presence of different organic compounds, such as polysaccharides, reduced sugars, lignin, proteins, melanoidin, waxes, etc. [6]. For the treatment of vinasse to be adequate and comply with Mexican regulations, a combination of different processes in many stages is required, which makes it costly in general.
Despite the relevance of tequila production to Mexico, there is limited information on the generation of vinasse that includes its characterization, treatment, and current disposal practices in factories of different sizes, nor are there studies that evaluate the impact of common disposal practices. A recent study by [5] evaluates the characterization of vinasses from grab samples which are not adequate due to the impact of the different stages of the production process on the concentration of contaminants, that are not necessarily carried out simultaneously. Additionally, the authors used official information (for some analysis) that might be erroneous mainly because it is frequently out of date. Therefore, the aim of this study supported by the National Water Commission (CONAGUA) of Mexico was (1) to carry out an investigation of the tequila factories located in the state of Jalisco (since it is the state that concentrates the largest number of factories) to identify their location in the state, the characterization of vinasses including factories of the four sizes and the current disposal practices, as well as (2) to evaluate some sites where vinasses are currently discharged. The information obtained from the study could be useful to the authorities to generate solutions for the current environmental problems in this industrial sector in the state of Jalisco (one of the richest in the country).

2. Materials and Methods

2.1. Collecting Information on Tequila Factories

To identify the tequila factories (name, addresses, contact details) located in the 12 regions of the state of Jalisco, an exhaustive search was carried out. This was done through different means such as internet pages, databases of the Tequila Regulatory Council (CRT), Secretariat of the Environment and Territorial Development (SEMADET), National Chamber of the tequila industry (CNIT), State Water and Sanitation Commission of Jalisco (CEAS) and different offices of the municipalities where the tequila companies are located.
Subsequently, contact was established by telephone and by email with each identified tequila factory. In some cases, physical visits were necessary. The contact with the factories was done to ask them to answer a confidential questionnaire developed through Google Forms. The questionnaire was elaborated to gather information regarding general information about the factories in order to know its size, the volume of produced tequila and vinasses, its current method of final disposal of the vinasse, etc., and above all, the willingness to provide us with a composite sample of vinasse for characterization.
Once we had the addresses of the tequila companies, we proceeded to field visits to verify their existence and geolocate them with a Garmi Oregon 650 model GPS. With this information, geographic maps were generated with QGIS software.

2.2. Vinasse Characterizations

A total of 42 companies responded to the questionnaire; 38 responded that they would provide vinasse for characterization, but finally, only 24 did. Of those who responded, based on tequila production, 3 were large, 6 were medium, 1 was small and 15 were micro. Therefore, tequila factories of all 4 sizes were represented in the study. The characterization of the vinasses was carried out from 24-h composite samples provided by the tequila factories (4 samples taken every 8 hours). The following parameters commonly used to characterize vinasses were measured: COD, BOD5, Organic nitrogen (org-N), ammonia (NH4+-N), nitrate (NO3-N), total phosphorus (TP), TSS, VSS, TDS, settleable solids (SetS), pH, conductivity, fats, and oils (FO), total phenols (TPh). Additionally, some minerals that might be found in vinasses were also quantified Ca2+, Mg2+, K, Na, Fe, Cu, Zn, and Ni. The analysis was performed in a certified laboratory by the Water National Commission and the Mexican Accreditation Entity according to Mexican Standards which are based on the Standard Methods for the analysis of water and wastewater [7].

2.3. Analysis of Current Disposal Practices for Treated and Untreated Vinasses

The information provided by the 42 companies that responded to the questionnaire was analyzed in order to classify the tequila companies by size, calculate the amount of vinasse generated by the size of the tequila factory and detect the common treatments and disposal methods. In addition, an estimate of the total volume of vinasse was made for the state of Jalisco and for the methods of treatment and disposal for the entire state of Jalisco. The information was organized in tables and graphs.

2.4. Case Studies to Assess the Impact of Current Vinasse Disposal Practices

The information gathered by the procedure described in Section 2.2 and Section 2.3, complemented with field visits in the three main tequila production regions, allowed us to select three case studies to evaluate the impact of the current vinasse disposal practices. As a result, the following three cases studies were selected:
(a)
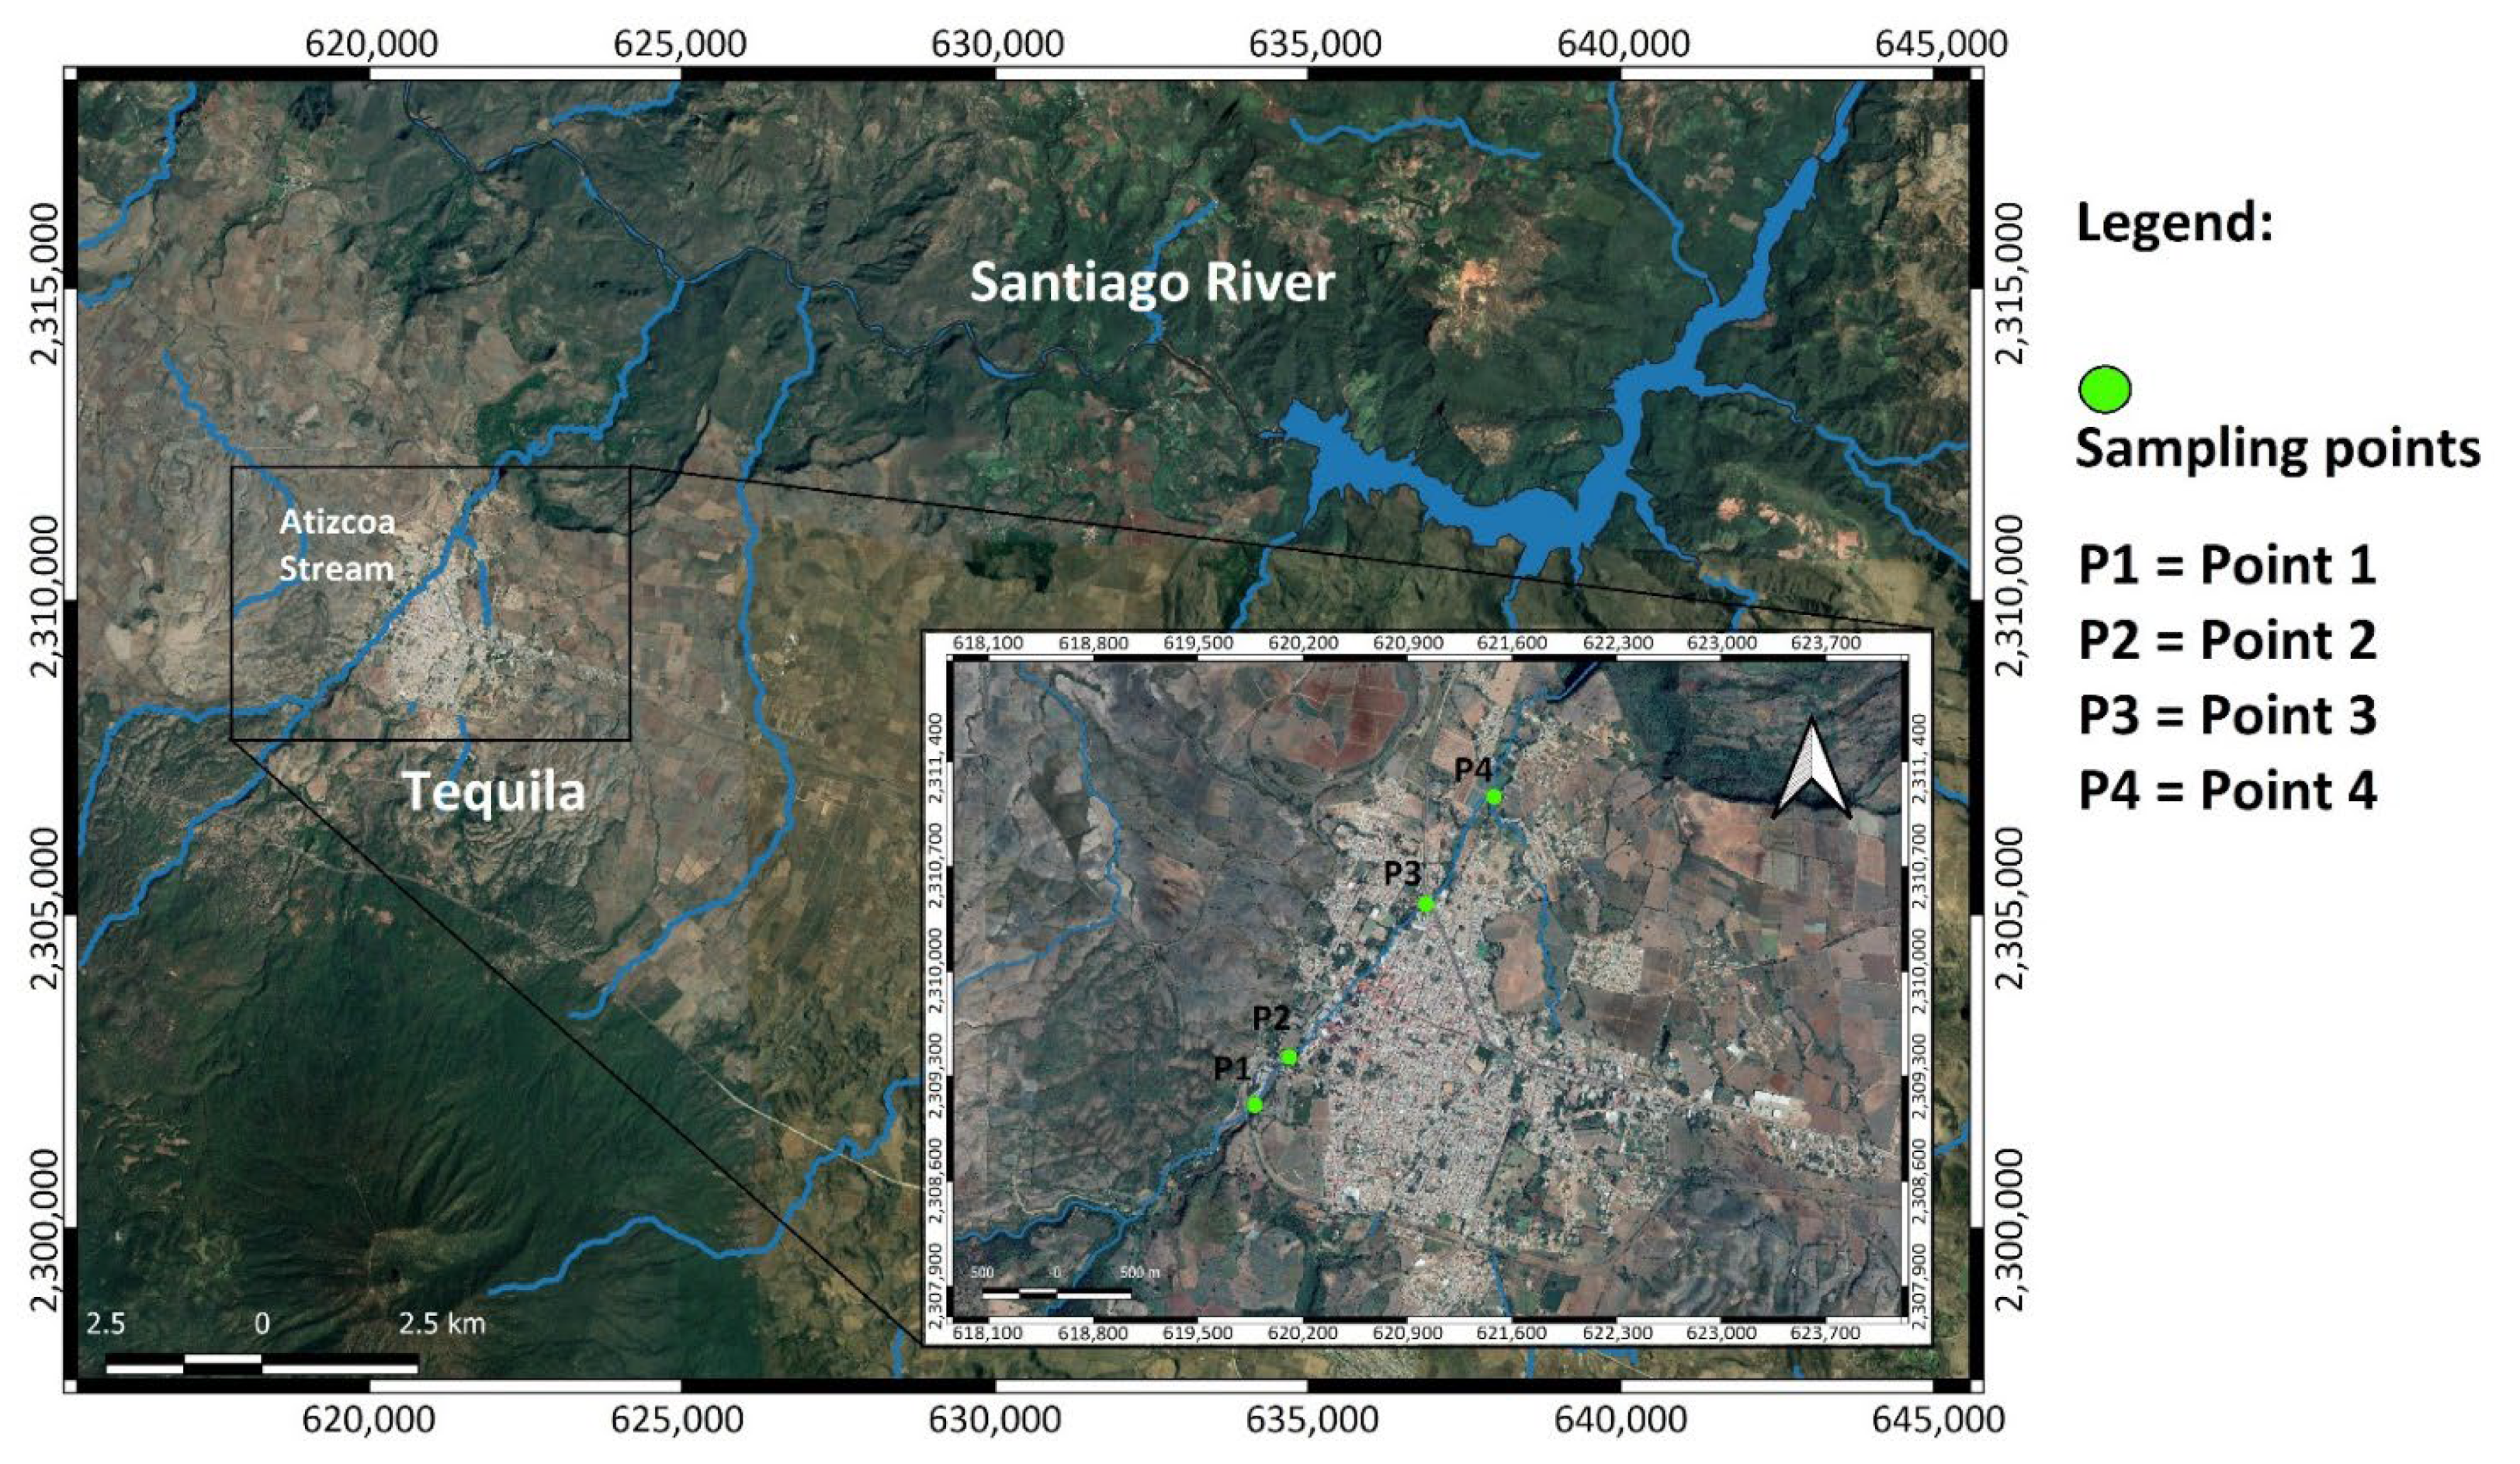
Monitoring of surface water in Tequila, Jalisco;
(b)
Characterization of a soil irrigated with vinasse for 14 years;
(c)
Monitoring of groundwater in a well located near soils used for vinasse disposal
For the first case, the Atizcoa stream was selected. This stream is located in Tequila, Jalisco and it is the main surface water body in the locality (Figure 1). It runs about 16.5 km from its source in the Tequila volcano to its inflow into the Santiago River. The flow rate along the stream was estimated by the well-known velocity/area method which consisted of measuring the average velocity of flow and the cross-sectional area of the stream (Flow rate (Q) = A (cross-sectional area) × V (water velocity at the surface)). The monitored section was around 5 km and covered the portion of the stream that runs in the middle of tequila factories (Figure 1). Three sampling campaigns were carried out every 15 days, between 2 February and 1 March 2021, in the dry season at 4 different points (P1, P2, P3, P4). The samples were kept at 4 °C until their processing in the Environmental Quality Laboratory of the University of Guadalajara campus (Centro Universitario de la Ciénega), within 24 h after sampling. Conductivity, pH, temperature, and dissolved oxygen analyzes were measured in situ, with an HQ40d meter and heavy-duty Intellical probes. The other parameters were performed in accordance with the official Mexican standards based on the Standard Methods for Analysis of water and wastewater [7].
Regarding the second case, the soil irrigated with vinasse is located in the municipality of Atotonilco, Jalisco, in the Ciénega region and is within a tequila industry classified as micro-size. This soil has been used for vinasse disposal for the last 14 years. The vinasse is discharged continuously only for 3 or 4 months each year, with a total dose of 1200 m3/ha during these months. The vinasse that is discharged into the soil is only cooled in a retention pond and its pH is adjusted to a neutral value. In this soil grows wild grass that is used mainly as food for cattle that were observed grazing. The total extension of the soil area was 2065 m2 with a trapezoidal shape and it was determined with a Garmin GPS model etrex10. A total of 36 sampling points distributed in an “N” or zigzag shape were determined (Figure 2). For each sampling point, a 25 to 30 cm excavation was made [8,9] and approximately 1 kg of soil was taken. The different samples were mixed to form a composite sample. The physicochemical characterization of the soils was carried out in the Research Center in Environmental Quality of the Centro Universitario de la Ciénega of the University of Guadalajara. Soil samples were immediately processed for analysis requiring fresh soil. The rest of the samples were stored at 4 °C to later be used in the determination of several physicochemical parameters according to different references in the literature. Total nitrogen and all the different forms that compose it was determined according to what was reported in [10,11,12]; total and available phosphorous, according to the analytical methods in [8,13,14]. On the other hand, refs. [15,16] were used to determine texture, as well as, fats and oils, respectively. The rest of the parameters were determined based on the procedures described in [9,17,18,19,20,21,22,23,24,25,26,27,28,29].
For the last case, the monitoring of groundwater, a well located in the municipality of Atotonilco, Jalisco in the Ciénega region was selected (Figure 2). The well has a depth of 120 m and is located 100–150 m from the soil that is irrigated with vinasses. Three sampling weekly campaigns were carried out in the dry season between 24 May–7 June 2021. Approximately 1 liter of the sample was taken at each point and the samples were kept at 4 °C until their analysis within the next 24 h.
The characterization of the samples was carried out both in situ and in the Research Center on Environmental Quality of the Centro Universitario de la Ciénega of the University of Guadalajara. Regarding the in situ parameters, electrical conductivity, pH, and temperature were measured with a HACH model HQ40d portable meter with INTELLICAL probes. On the other hand, the laboratory techniques used for the analysis of the water samples include parameters such as nitrate, nitrite, total Fe, Mn, Cl, F, hardness, alkalinity, N-NH4+, turbidity, SO42−, color, reactive phosphorus, total phenols, fats and oils, Ca2+, copper, K+, Mg2+, Na+, nickel, and zinc, were carried out according to standard methods [7]. It is important to clarify that the measured parameters were selected based on those pollutants that might be present in the tequila vinasse and that may infiltrate from the discharges into soils.

3. Results and Discussion

3.1. Distribution of Tequila Factories in the State of Jalisco

In total, 110 tequila factories, whose existence and operation was verified in the field, were identified. This number differs from the 131 tequila companies in the state of Jalisco, reported by the CRT in January 2021 [1] and also, in comparison to the 158 tequila factories reported by [5] with the information of [30]. These differences between the official information and the results from our field study are mainly due to the fact that many companies registered in CRT are only bottling companies, not distilleries. Additionally, many factories operate for a time and then cease to exist; this was a repeated situation during the pandemia. On the other hand, many micro-size tequila factories are not registered in CRT.
Tequila factories are located mainly in three regions: Valles (45 factories), Altos Sur (31 factories), Ciénega (20 factories), and to a lesser extent in the Centro region (9 factories); while in the Laguna region there are 3 factories and in the Sureste and Costa Sur regions there is only 1 factory (Figure 3, Table 1). Furthermore, in these regions, the factories are concentrated in some municipalities. In the Valles Region, the municipalities of Tequila, Amatitán, and El Arenal stand out. In the Ciénega region, the main municipality is Atotonilco El Alto, and in the Altos Sur region, the municipality that has a concentration of tequila factories is Arandas (Table 1). Other municipalities such as Guadalajara, Tlaquepaque, and Tlajomulco de Zúñiga in the Centro region have two tequila factories each. This information differs from that reported by [5] because the authors only focused on the large tequila factories, which according to them, produce 80% of the tequila in the State of Jalisco. However, as will be seen later, the problem of managing vinasses is mainly a problem for tequila factories of other sizes rather than for large ones.

3.2. Distribution of Tequila Factories in the State of Jalisco

The average values of the measured parameters are shown in Table 2. Additionally, in Table 3, the results are shown by the size of the tequila factory. As can be seen, no clear differences are observed when comparing the characteristics of the vinasse generated, depending on the size of the factory. However, it seems that the concentration of COD, TSS, VSS, TDS, conductivity, and org-N tend to be lower in the vinasse of micro tequila factories. This could be related to a dilution effect due to less efficient water management in these companies, for example, during the incorporation of hot water for agave grinding. Nor were clear differences found when the company does not produce 100% agave tequila.
It is important to emphasize that the ranges of values found for the different parameters differ from that reported by [3], which has been taken as a reference in the literature and was obtained from the characterization of only four tequila factories. The results are also different from those recently reported by [5] who obtained higher values in grab samples for seven parameters. Some of the most important parameters, total COD and BOD5, and TSS are reported between 60,000–100,000 mg/L, 35,000–60,000, and 2000–8000 mg/L respectively by [3] and we found a much lower range (Table 2). Furthermore, [5] who did not measure COD; reported an extremely high average concentration of BOD5 which is 119,011.77 mg/L. In comparison to these authors, the results we obtained by including a greater number of effluents from companies of different sizes and using composite samples, allow us to assume that they are closer to reality and reflect the high variability in the characteristics of tequila vinasse. This is due to multiple factors that range from the characteristics of the agave used (origin, age, etc.), the incorporation of other sugars, the processing and practices in the use of water during cooking and juice extraction, among others. One of the main differences between tequila plants is found in the method of extracting sugars from the agave. Most large and medium-sized companies carry out extraction by diffusion, which consists of tearing the agave to the smallest size possible and the subsequent extraction of sugars with hot water against the current. In contrast, in general, most tequila companies first cook the agave in autoclaves and the extraction of sugars is carried out in mills.

3.3. Current Disposal Practices and Treatments of Tequila Vinasse

As previously mentioned, a total of 42 tequila factories of the four sizes responded to the questionnaire (4 anonymously): micro-size (29) 69%, small (3) 7.1%, medium (6) 14.3%, and large (4) (9.5%). This distribution in size is very similar to the numbers reported by [4]: micro, 72–75%; small, 6.5–9.6%, medium 6.8–7.7%, and large, 10.3–12%, respectively. Due to the fact that all sizes of tequila factories were represented in the collected information, an estimate of the total volume of vinasses generated in the state of Jalisco was made. The estimate was made considering that the total number of tequila factories we found is 2.6 times the number of factories that participated in the study (110/42). Therefore, being conservative we considered that the total volume of tequila vinasse generated in Jalisco is between 2–3 times the volume calculated from the field study (Table 4).
The estimated maximum value is close to the 2,645,655.69 m3/year of vinasses produced in the state of Jalisco which was estimated from official information by [5].
On the other hand, the common treatments given to vinasses are presented in Table 5. It was found that 28.6% of the companies recognized that they do not provide any treatment to the vinasses, while 52.4% only cool and adjust the pH to a value around 7, and only 27.3% of companies give a complete treatment to vinasses (4 large and 2 medium sizes).
Regarding the volume of vinasse disposed of by the different methods, Table 6 shows the information collected in the survey, and Table 7 shows the estimate for the state of Jalisco.
As can be seen, according to the applied questionnaire, the largest amount of vinasse generated receives a complete treatment (Table 6). This is due to the fact that large and some medium-sized companies are the ones that have complete treatment systems. Even so, there is an enormous amount of vinasse that does not receive any treatment (32,911 m3/year) or that is only cooled and neutralized (184,560 m3/year).
Table 7. Estimate of the vinasses disposed of annually in the state of Jalisco.
Disposal in Surface Waters (m3/año)Disposal in Soils (m3/año)Use of Vinasse for Irrigation m3/año)Treated by an External Company (m3/año)Disposal into Municipal Sewer Systems (m3/año)
No treatment32–485000–75006000–900027,395-
Incomplete treatment400–600180,100–270,150180,319–270,7488000–12,000300–450
Full treatment594,400–981,600,14,000–21,000404,044–606,067--

3.4. Evaluation of the Impact of Vinasse Disposal in Atizcoa Stream

The flow rate in the Atizcoa stream was around 23 L/s and 96 L/s in P1 and P2, respectively, suggesting an increase in the volume of water due to wastewater discharges, mainly vinasses. Table 8 shows the average values of the parameters measured in situ during the sampling campaigns. A clear reduction in DO concentrations from P1 to P4 is observed, reaching anoxic-anaerobic conditions in P3 and P4. Usually, a reduction in DO concentrations in surface waters is due to the discharges of high concentrations of biodegradable organic matter. Two parameters that confirm that vinasses are responsible for these conditions in the Atizcoa stream are pH and temperature. The values of pH changed from 6.9 (P1) to 4.7 (P4) and such reduction could only be from the inflow of acidic effluents as vinasses. When the inflows are from municipal wastewater, the changes in pH are not of that magnitude as reported by Toure, et al. [31] who found variations of pH between 6.30 and 6.54 in the Comatex stream in Mali which receives discharges of municipal wastewater. Additionally, Thai-Hoang, et al. [32] found that in the Saigon River in Vietnam, the pH values varied from 6.46 to 6.75 during the rainy season and from 6.13 to 7.06 during the dry season. Moreover, the increase in temperature in P2 is due to the direct disposal of a tequila factory located nearby the stream; the vinasses are generated at around 90 °C [33]. With respect to the conductivity, the increase registered from P1 to P4 is unusual too. In a river sampling point with municipal wastewater discharges, a value of 647.27 µS/cm was found [31].
In addition, the discharge of tequila vinasses in the Atizcoa stream was also evident in the concentrations found for COD, BOD5, TSS, fats and oils, TP, and TKN (Figure 4) in the three sampling campaigns. In general, an increase in pollutant concentrations was observed as the stream run from sampling point 1 (almost zero contaminant concentration) to number 4. For example, COD and BOD5 concentrations reached values of more than 5000 mg/L and 3000 mg/L, respectively at sampling P4, after the stream passed through the numerous tequila factories. TSS concentrations at the last sampling point reached concentrations between 1000 and almost 2500 mg/L. The values observed for these parameters are many times higher than the limit value from which surface water is considered highly polluted in Mexico according to the Water National Commission (Table 9) [34]. The values are also very superior to those in a river in Veracruz, Mexico which receives mainly municipal wastewater (COD, 318 mg/L; TSS, 696 mg/L, etc.) [35]. Fats and oils reached a maximum value of almost 60 mg/L and the concentration of this pollutant in tequila vinasses vary between 10–100 mg/L [3].
Regarding nutrients, TP and TKN reached maximum concentrations of almost 60 mg/L and 100 mg/L, respectively. It is well-known that nitrogen and mainly phosphorus are responsible for eutrophication in aquatic bodies. As aforementioned, this stream is a tributary of Santiago River which is one of the most contaminated rivers in the country [36,37], and in some parts, the river is fully covered by Eichornia crassipes [38].
Figure 4. Concentrations of COD, BOD5, TSS, TKN, fats and oils, and phosphorus found in the Atizcoa stream during the three sampling campaigns.
Water 14 01395 g004

3.5. Evaluation of a Soil Irrigated with Vinasse for 14 Years

The textural classification of the soil that was evaluated is clay due to its high clay content, that is, 45.13% (Table 10). Soil texture is the relative percentage of sand, silt, and clay particles in the inorganic fraction of the soil. Clay particles are the smallest, measuring less than 0.002 mm, while silt particles range from 0.002 to 0.05 mm and sand particles from 0.05 to 2.0 mm [39]. Soil texture influences soil biophysical properties because it is associated with soil porosity, which regulates water holding capacity and water movement, as well as gaseous diffusion, which together determine soil health [40].
As a result of the high content of clay and silt, this soil has very low permeability and high water holding capacity [39]. In general, the higher the clay content, the lower the hydraulic conductivity [41]. Hydraulic conductivity determines the relative ease of water flow through soils. This implies that the risk of vinasse infiltration in nearby groundwater is low.
On the other hand, the pH value in this soil was found to be moderately alkaline due to the use of calcium hydroxide (hydrated lime) for the neutralization of the vinasse before its disposal; this practice was also manifested in the very high concentrations of Ca2+ in the soil. In addition, concentrations of Ca2+, K+, and Mg2+ were much higher than the concentration of Na+ which minimize the risk of soil sodification [42]. In addition, the estimated soil organic content (SOC) was 0.097 kg/m2 and it is similar to the minimum value of 0.1 kg of C/m2 in the 0.30 cm topsoil reported by [43] in a review of degraded and non-degraded grasslands worldwide. Probably, this low accumulation of SOC is due to the short time of vinasse discharge per year in this soil.
Table 10. Physicochemical characteristics of the evaluated soil.
ParameterValue
Textural classificationClay
Sand (%)23.51 ± 3.12
Clay (%)45.13 ± 5.42
Silt (%)31.36 ± 5.47
pH7.90 ± 0.20
Electrical conductivity (µs/cm)425.08 ± 52.34
Moisture (%)19.81 ± 0.13
Water retention capacity (%)64.94 ± 1.98
Cation exchange capacity (meq/100 g)46.80 ± 2.26
Density (g/cm3)1.29 ± 0.014
Organic carbon (%)9.38 ± 0.626
Chloride (ppm Cl)93.33 ± 7.64
Total phosphorus (ppm P)44.66 ± 11.01
Phosphorus available to plants (ppm P)14.89 ± 1.95
Total Nitrogen (ppm)2688.06 ± 195.08
Total Kjeldahl Nitrogen: N-org. y NH3 (ppm)2674.56 ± 200.90
Nitrate (NO3 ppm)18.50 ± 5.89
Potassium (ppm K)690.50 ± 12.02
Ca2+ (ppm Ca)6247.50 ± 212.84
Magnesium (ppm Mg)1593.00 ± 135.76
Sulfur (SO4 ppm)28.00 ± 0.00
Boron (B ppm)1.20 ± 0.141
Copper (Cu ppm)5.60 ± 0.424
Iron (Fe ppm)100.00 ± 11.31
Manganese (Mn ppm)304.00 ± 21.21
Zinc (Zn ppm)2.95 ± 0.495
Sodium (Na ppm)120.50 ± 6.36
Fats and oils (g/kg soil)21.71 ± 3.55
Regarding the available nutrients, low concentrations of nitrate were found although the organic nitrogen values found were very high. Probably, the vinasse addition to the soil has changed the microbial population and altered or reduced the biochemical cycles by which organic nitrogen is transformed into available nitrogen for plants (NH4+ and NO3) [44]. Soil health is highly dependent on the activity of aerobic microbial populations that not only decompose organic matter [42] but also transform nitrogen compounds into oxidized forms usable by plants; the discharges of vinasse might create anaerobic microsites when flooding the pores [44].
However, in general, after 14 years of being used for tequila vinasse disposal, the impact on soil fertility is null. This means that this vinasse disposal-soil rest method appears to be suitable to produce crops during the soil rest period, rather than direct fertigation. This, although the dose of vinasse applied to the soil is 4 times the maximum doses of 300 m3/ha used to irrigate sugar cane plantations with alcohol vinasses without a negative effect on growth [44,45,46].

3.6. Physicochemical Characterization of Groundwater near to Soils Used for Vinasse Disposal

A major concern when stillage is disposed of on soil or used for fertigation is groundwater contamination [44]. However, in this case, in general, the results obtained from the characterization of the water from the well located near the soil that is irrigated with neutralized vinasse (Table 11) showed that the quality of the groundwater has not been affected. The physicochemical characteristics of the water comply with the provisions of the modification of NOM-127-SSA1-1994 [47], which establishes the maximum permissible limits of the different components of water to make it suitable for human consumption in Mexico. This is probably related to the type of soil in the area where the well is located, as well as the way in which the vinasse is being applied (only three or four months per year). As mentioned above, high content of clay (45%) and silt (31%) allows the soil high retention of water and nutrients [48] and reduces permeability, which in turn limits the rate of infiltration [41,49] of vinasse and its possible impact on groundwater. The texture and chemical composition of the soil, as well as the dose of vinasse deposited in the soils, largely determine the rate of infiltration and the impact on nearby groundwater [50].

4. Conclusions

By performing this study, we identified two regions as the main producers of tequila and vinasse (Valle and Altos Sur region) and 10 municipalities with the highest number of factories. In addition, we found a very high range of variation in the concentrations of contaminants in the vinasses, e.g., COD varied between 7565–73,690 mg/L; BOD5 from 3718 to 35,516 mg/L, TSS from 190–24,800, Org-N between 24–574 mg/L, and Ca2+ from 123 to 1287 mg/L. On the other hand, we corroborated that the main environmental problems are related to micro-size factories which do not treat their vinasses at all. Additionally, the most common method of disposal is the discharge on soils along with fertigation. Apparently, only in the Valle region, the disposal into surface water is a common practice as well as discharges into sewage systems. The degradation of the monitored stream (that runs in the middle of tequila factories) was evident not only by the physicochemical characterization, with the worst conditions in P4 (pH, 4.7; OD, 0.4 mg/L; COD, more than 5000 mg/L and BOD5, more than 3000 mg/L), but also visually through the odors and the brown color of the water. Furthermore, the method of vinasse disposal-soil rest has not affected soil fertility (after 14 years), but it must be thoroughly evaluated to generate general guidelines that include the optimal application doses and rest periods. In this regard, the texture of soils (high content of clay and silt) is decisive in protecting groundwater from vinasse infiltration. Finally, the results obtained in this study could help the authorities to develop adequate strategies for the management of vinasses (treatment and disposal), mainly in micro and small tequila factories, as well as to focus future research on the improvement and correction of disposal practices, in order to prevent environmental pollution.

Author Contributions

Conceptualization, F.Z. and A.T.; methodology, F.Z., A.T., B.S.-R. and A.C.-Á.; software, A.M., I.C. and B.S.-R.; validation, F.Z. and B.S.-R.; formal analysis, A.C.-Á., A.M. and I.C.; investigation, A.T., A.C.-Á., I.C. and A.M.; resources, F.Z.; writing—original draft preparation, F.Z.; writing—review and editing, F.Z. and A.T.; visualization, B.S.-R., A.M. and I.C.; supervision, F.Z. project administration, F.Z.; funding acquisition, F.Z. All authors have read and agreed to the published version of the manuscript.

Funding

This research was funded by the National Water Commission and National Council of Science and Technology of Mexico through the “FONDO SECTORIAL DE INVESTIGACIÓN Y DESARROLLO SOBRE EL AGUA” to the project “TECNOLOGÍAS SUSTENTABLES PARA TRATAMIENTO DE VINAZAS Y SU REUSO EN ACTIVIDADES PRODUCTIVAS”; grant number A3-S-66470.

Institutional Review Board Statement

Not applicable.

Informed Consent Statement

Not applicable.

Data Availability Statement

Not applicable.

Acknowledgments

Graduate scholarship for Isaías Carrillo was provided by National Council for Science and Technology of México.

Conflicts of Interest

The authors declare no conflict of interest. The funders had no role in the design of the study; in the collection, analyses, or interpretation of data; in the writing of the manuscript, or in the decision to publish the results.

References

  1. CRT. Producción Total de Tequila y Tequila 100% en 2021. Available online: https://www.crt.org.mx/EstadisticasCRTweb/ (accessed on 1 March 2021).
  2. INEGI; CAJ. Coleccion de Estudios Regionales y Sectoriales. Conociendo la Industria del Tequila y el Mezcal; Instituto Nacional de Estadistica y Geografía: Mexico City, Mexico, 2019; Volume 1. [Google Scholar]
  3. Lopez-Lopez, A.; Davila-Vazquez, G.; León-Becerril, E.; Villegas, E.; Gallardo-Valdez, J. Tequila Vinasses: Generation and full scale treatment processes. Rev. Environ. Sci. Bio/Technol. 2010, 9, 109–116. [Google Scholar] [CrossRef]
  4. CRT. Manual del Tecnico Tequilero; Consejo Regulador del Tequila: Guadalajara, Mexico, 2019; Volume 1. [Google Scholar]
  5. Díaz-Vázquez, D.; Carrillo-Nieves, D.; Orozco-Nunnelly, D.A.; Senés-Guerrero, C.; Gradilla-Hernández, M.S. An Integrated Approach for the Assessment of Environmental Sustainability in Agro-Industrial Waste Management Practices: The Case of the Tequila Industry. Front. Environ. Sci. 2021, 9, 682093. [Google Scholar] [CrossRef]
  6. Kharayat, Y. Distillery wastewater: Bioremediation approaches. J. Integr. Environ. Sci. 2012, 9, 69–91. [Google Scholar] [CrossRef]
  7. APHA; AWWA; WEF. Standard Methods for the Examination of Water and Wastewater, 21st ed.; American Public Health Association: Washington, DC, USA, 2005. [Google Scholar]
  8. DOF. Especificaciones de Fertilidad, Salinidad y Clasificación de Suelos. Estudios, Muestreo y Analisis; NOM-021-RECNAT-2000. Diario Oficial de la Federación: Mexico City, Mexico, 2000.
  9. Margesin, R.; Schinner, F. Manual for Soil Analysis-Monitoring and Assessing Soil Bioremediation; Springer Science & Business Media: Berlin/Heidelberg, Germany, 2005; Volume 5. [Google Scholar]
  10. Bremner, J.M. Nitrogen-Total. In Methods of Soil Analysis; American Society of Agronomy, Inc.: Madison, WI, USA; Soil Science Society of America, Inc.: Madison, WI, USA, 1996; pp. 1085–1121. [Google Scholar]
  11. DOF. NMX-AA-026-SCFI-2010. Analisis de Agua- Medición de Nitrógeno Total Kjeldahl en Aguas Naturales, Residuales y Residuales Tratadas—Metodo de Prueba; Diario Oficial de la Federacion: Mexico City, Mexico, 2010.
  12. Miller, R.; Sonon, L. Nitrate-Nitrogen. In Soil Test Methods From the Southeastern United States; Southern Cooperative Series Bulletin No.419; Southern Extension and Research Activity Information Exchange Group-6 (SERA-IEG-6): Fayetteville, AR, USA, 2014; Volume 1. [Google Scholar]
  13. Andersen, J.M. An ignition method for determination of total phosphorus in lake sediments. Water Res. 1976, 10, 329–331. [Google Scholar] [CrossRef]
  14. Murphy, J.; Riley, J.P. A modified single solution method for the determination of phosphate in natural waters. Anal. Chim. Acta 1962, 27, 31–36. [Google Scholar] [CrossRef]
  15. Huluka, G.; Miller, R. Particle Size Determination by Hidrometer Method. In Soil Test Methods From the Southeastern United States; Southern Cooperative Series Bulletin No.419; Southern Extension and Research Activity Information Exchange Group-6 (SERA-IEG-6): Fayetteville, AR, USA, 2014; Volume 1. [Google Scholar]
  16. DOF. NMX-AA-134-SFCI-2006. Norma Oficial Mexicana para Suelos-Hidrocarburos Fraccion Pesada por Extraccion y Gravimetria-Mtodo Prueba; Diario Oficial de la Federación: Mexico City, Mexico, 2006.
  17. Baker, D.E.; Amacher, M.C. Nickel, Copper, Zinc, and Cadmium. In Methods of Soil Analysis; American Society of Agronomy, Inc.: Madison, WI, USA; Soil Science Society of America, Inc.: Madison, WI, USA, 1983; pp. 323–336. [Google Scholar]
  18. Bingham, F.T. Boron. In Methods of Soil Analysis; American Society of Agronomy, Inc.: Madison, WI, USA; Soil Science Society of America, Inc.: Madison, WI, USA, 1983; pp. 431–447. [Google Scholar]
  19. Blake, G.R.; Hartge, K.H. Bulk Density. In Methods of Soil Analysis; American Society of Agronomy, Inc.: Madison, WI, USA; Soil Science Society of America, Inc.: Madison, WI, USA, 1986; pp. 363–375. [Google Scholar]
  20. Gambrell, R.P.; Patrick, W.H., Jr. Manganese. In Methods of Soil Analysis; American Society of Agronomy, Inc.: Madison, WI, USA; Soil Science Society of America, Inc.: Madison, WI, USA, 1983; pp. 313–322. [Google Scholar]
  21. Gardner, W.H. Water Content. In Methods of Soil Analysis; American Society of Agronomy, Inc.: Madison, WI, USA; Soil Science Society of America, Inc.: Madison, WI, USA, 1986; pp. 493–544. [Google Scholar]
  22. Klute, A. Water Retention: Laboratory Methods. In Methods of Soil Analysis; American Society of Agronomy, Inc.: Madison, WI, USA; Soil Science Society of America, Inc.: Madison, WI, USA, 1986; pp. 635–662. [Google Scholar]
  23. Knudsen, D.; Peterson, G.A.; Pratt, P.F. Lithium, Sodium, and Potassium. In Methods of Soil Analysis; American Society of Agronomy, Inc.: Madison, WI, USA; Soil Science Society of America, Inc.: Madison, WI, USA, 1983; pp. 225–246. [Google Scholar]
  24. Lanyon, L.E.; Heald, W.R. Magnesium, Calcium, Strontium, and Barium. In Methods of Soil Analysis; American Society of Agronomy, Inc.: Madison, WI, USA; Soil Science Society of America, Inc.: Madison, WI, USA, 1983; pp. 247–262. [Google Scholar]
  25. Nelson, D.W.; Sommers, L.E. Total Carbon, Organic Carbon, and Organic Matter. In Methods of Soil Analysis; American Society of Agronomy, Inc.: Madison, WI, USA; Soil Science Society of America, Inc.: Madison, WI, USA, 1983; pp. 539–579. [Google Scholar]
  26. Olson, R.V.; Ellis, R., Jr. Iron. In Methods of Soil Analysis; American Society of Agronomy, Inc.: Madison, WI, USA; Soil Science Society of America, Inc.: Madison, WI, USA, 1983; pp. 301–312. [Google Scholar]
  27. Rhoades, J.D. Cation Exchange Capacity. In Methods of Soil Analysis; American Society of Agronomy, Inc.: Madison, WI, USA; Soil Science Society of America, Inc.: Madison, WI, USA, 1983; pp. 149–157. [Google Scholar]
  28. Rhoades, J.D. Soluble Salts. In Methods of Soil Analysis; American Society of Agronomy, Inc.: Madison, WI, USA; Soil Science Society of America, Inc.: Madison, WI, USA, 1983; pp. 167–179. [Google Scholar]
  29. Tabatabai, M.A. Sulfur. In Methods of Soil Analysis; American Society of Agronomy, Inc.: Madison, WI, USA; Soil Science Society of America, Inc.: Madison, WI, USA, 1983; pp. 501–538. [Google Scholar]
  30. SEMADET. Listado de Cedulas de Operación Anual. 2019. Available online: https://semadet.jalisco.gob.mx/medio-ambiente/calidad-del-aire/listados-delas (accessed on 16 March 2021).
  31. Toure, A.; Wenbiao, D.; Keita, Z.; Dembele, A. Investigation of the water quality of daily used surface-sources for drinking and irrigation by the population of Segou in the center of Mali. J. Water Health 2018, 17, 338–349. [Google Scholar] [CrossRef] [PubMed]
  32. Thai-Hoang, L.; Thong, T.; Loc, H.T.; Van, P.T.T.; Thuy, P.T.P.; Thuoc, T.L. Influences of anthropogenic activities on water quality in the Saigon River, Ho Chi Minh City. J. Water Health 2022, 20, 491–504. [Google Scholar] [CrossRef] [PubMed]
  33. Lopez-Lopez, A.; Contreras-Ramos, S. Tratamiento de Efluentes y Aprovechamiento de Residuos; CIATEJ: Guadalajara, Mexico, 2015; pp. 343–378. [Google Scholar]
  34. CONAGUA. Estadisticas del Agua en México; Comision Nacional del Agua: Mexico City, Mexico, 2018. [Google Scholar]
  35. Sandoval, L.; Marín-Muñíz, J.L.; Adame-García, J.; Fernández-Lambert, G.; Zurita, F. Effect of Spathiphyllum blandum on the removal of ibuprofen and conventional pollutants from polluted river water, in fully saturated constructed wetlands at mesocosm level. J. Water Health 2020, 18, 224–228. [Google Scholar] [CrossRef] [PubMed]
  36. Casillas-García, L.F.; de Anda, J.; Yebra-Montes, C.; Shear, H.; Díaz-Vázquez, D.; Gradilla-Hernández, M.S. Development of a specific water quality index for the protection of aquatic life of a highly polluted urban river. Ecol. Indic. 2021, 129, 107899. [Google Scholar] [CrossRef]
  37. Rizo-Decelis, L.D.; Pardo-Igúzquiza, E.; Andreo, B. Spatial prediction of water quality variables along a main river channel, in presence of pollution hotspots. Sci. Total Environ. 2017, 605–606, 276–290. [Google Scholar] [CrossRef] [PubMed]
  38. Hansen, A.M.; González-Márquez, L.C. Scenarios of metal concentrations in the Arcediano Dam (State of Jalisco, Mexico). J. Environ. Sci. Health Part A 2010, 45, 99–106. [Google Scholar] [CrossRef] [PubMed]
  39. Mobilian, C.; Craft, C.B. Wetland Soils: Physical and Chemical Properties and Biogeochemical Processes. In Reference Module in Earth Systems and Environmental Sciences; Elsevier: Amsterdam, The Netherlands, 2021. [Google Scholar]
  40. Upadhyay, S.; Raghubanshi, A.S. Chapter 16—Determinants of soil carbon dynamics in urban ecosystems. In Urban Ecology; Verma, P., Singh, P., Singh, R., Raghubanshi, A.S., Eds.; Elsevier: Amsterdam, The Netherlands, 2020. [Google Scholar]
  41. Lozano-Trejo, S.; Olazo-Aquino, J.; Pérez-León, M.I.; Castañeda-Hidalgo, E.; Díaz-Zorrilla, G.O.; Santiago-Martínez, G.M. Infiltración y escurrimiento de agua en suelos de una cuenca en el sur de México. Terra Latinoam. 2020, 38, 57–66. [Google Scholar] [CrossRef] [Green Version]
  42. Fuess, L.T.; Altoé, M.E.; Felipe, M.C.; Garcia, M.L. Pros and cons of fertirrigation with in natura sugarcane vinasse: Do improvements in soil fertility offset environmental and bioenergy losses? J. Clean. Prod. 2021, 319, 128684. [Google Scholar] [CrossRef]
  43. Dlamini, P.; Chivenge, P.; Chaplot, V. Overgrazing decreases soil organic carbon stocks the most under dry climates and low soil pH: A meta-analysis shows. Agric. Ecosyst. Environ. 2016, 221, 258–269. [Google Scholar] [CrossRef]
  44. Moran-Salazar, R.G.; Sanchez-Lizarraga, A.L.; Rodriguez-Campos, J.; Davila-Vazquez, G.; Marino-Marmolejo, E.N.; Dendooven, L.; Contreras-Ramos, S.M. Utilization of vinasses as soil amendment: Consequences and perspectives. SpringerPlus 2016, 5, 1007. [Google Scholar] [CrossRef] [PubMed] [Green Version]
  45. Christofoletti, C.A.; Escher, J.P.; Correia, J.E.; Marinho, J.F.U.; Fontanetti, C.S. Sugarcane vinasse: Environmental implications of its use. Waste Manag. 2013, 33, 2752–2761. [Google Scholar] [CrossRef] [PubMed]
  46. Maradiaga-Rodriguez, W.D.; Pêgo-Evangelista, A.W.; Alves Júnior, J.; Costa, R.B.-d. Effects of vinasse and lithothanmium application on the initial growth of sugar cane (Saccharum sp. cv. RB 86-7515) irrigated and not irrigated. Acta Agron. 2018, 67, 252–257. [Google Scholar] [CrossRef] [Green Version]
  47. DOF. NOM-127-SSA1-1994. Salud Ambiental, Agua Para Uso y Consumo Humano-Limites Permisibles de Calidad y Tratamientos a que debe Someterse el Agua Para su Potabilización; Diario Oficial de la Federación: Mexico City, Mexico, 1994. [Google Scholar]
  48. Peinado-Guevara, H.J.; Green-Ruìz, C.R.; Delgado-Rodríguez, O.; Herrera-Barrientos, J.; Belmonte Jiménez, S.; Ladrón de Guevara Torres, M.d.l.Á.; Shevnin, V. Estimación de la conductividad hidráulica y contenido de finos a partir de leyes experimentales que relacionan parámetros hidráulicos y eléctricos. Ra Ximhai 2010, 6, 469–478. [Google Scholar] [CrossRef]
  49. Osuna Ceja, E.S.; Padilla Ramirez, J.S. Estimación de la sorbilidad e infiltración usando datos de simulación de lluvia para tres tipos de suelos de la zona semiárida de México. Terra Latinoam. 1998, 16, 293–302. [Google Scholar]
  50. Ortegón, G.P.; Arboleda, F.M.; Candela, L.; Tamoh, K.; Valdes-Abellan, J. Vinasse application to sugar cane fields. Effect on the unsaturated zone and groundwater at Valle del Cauca (Colombia). Sci. Total Environ. 2016, 539, 410–419. [Google Scholar] [CrossRef] [PubMed] [Green Version]
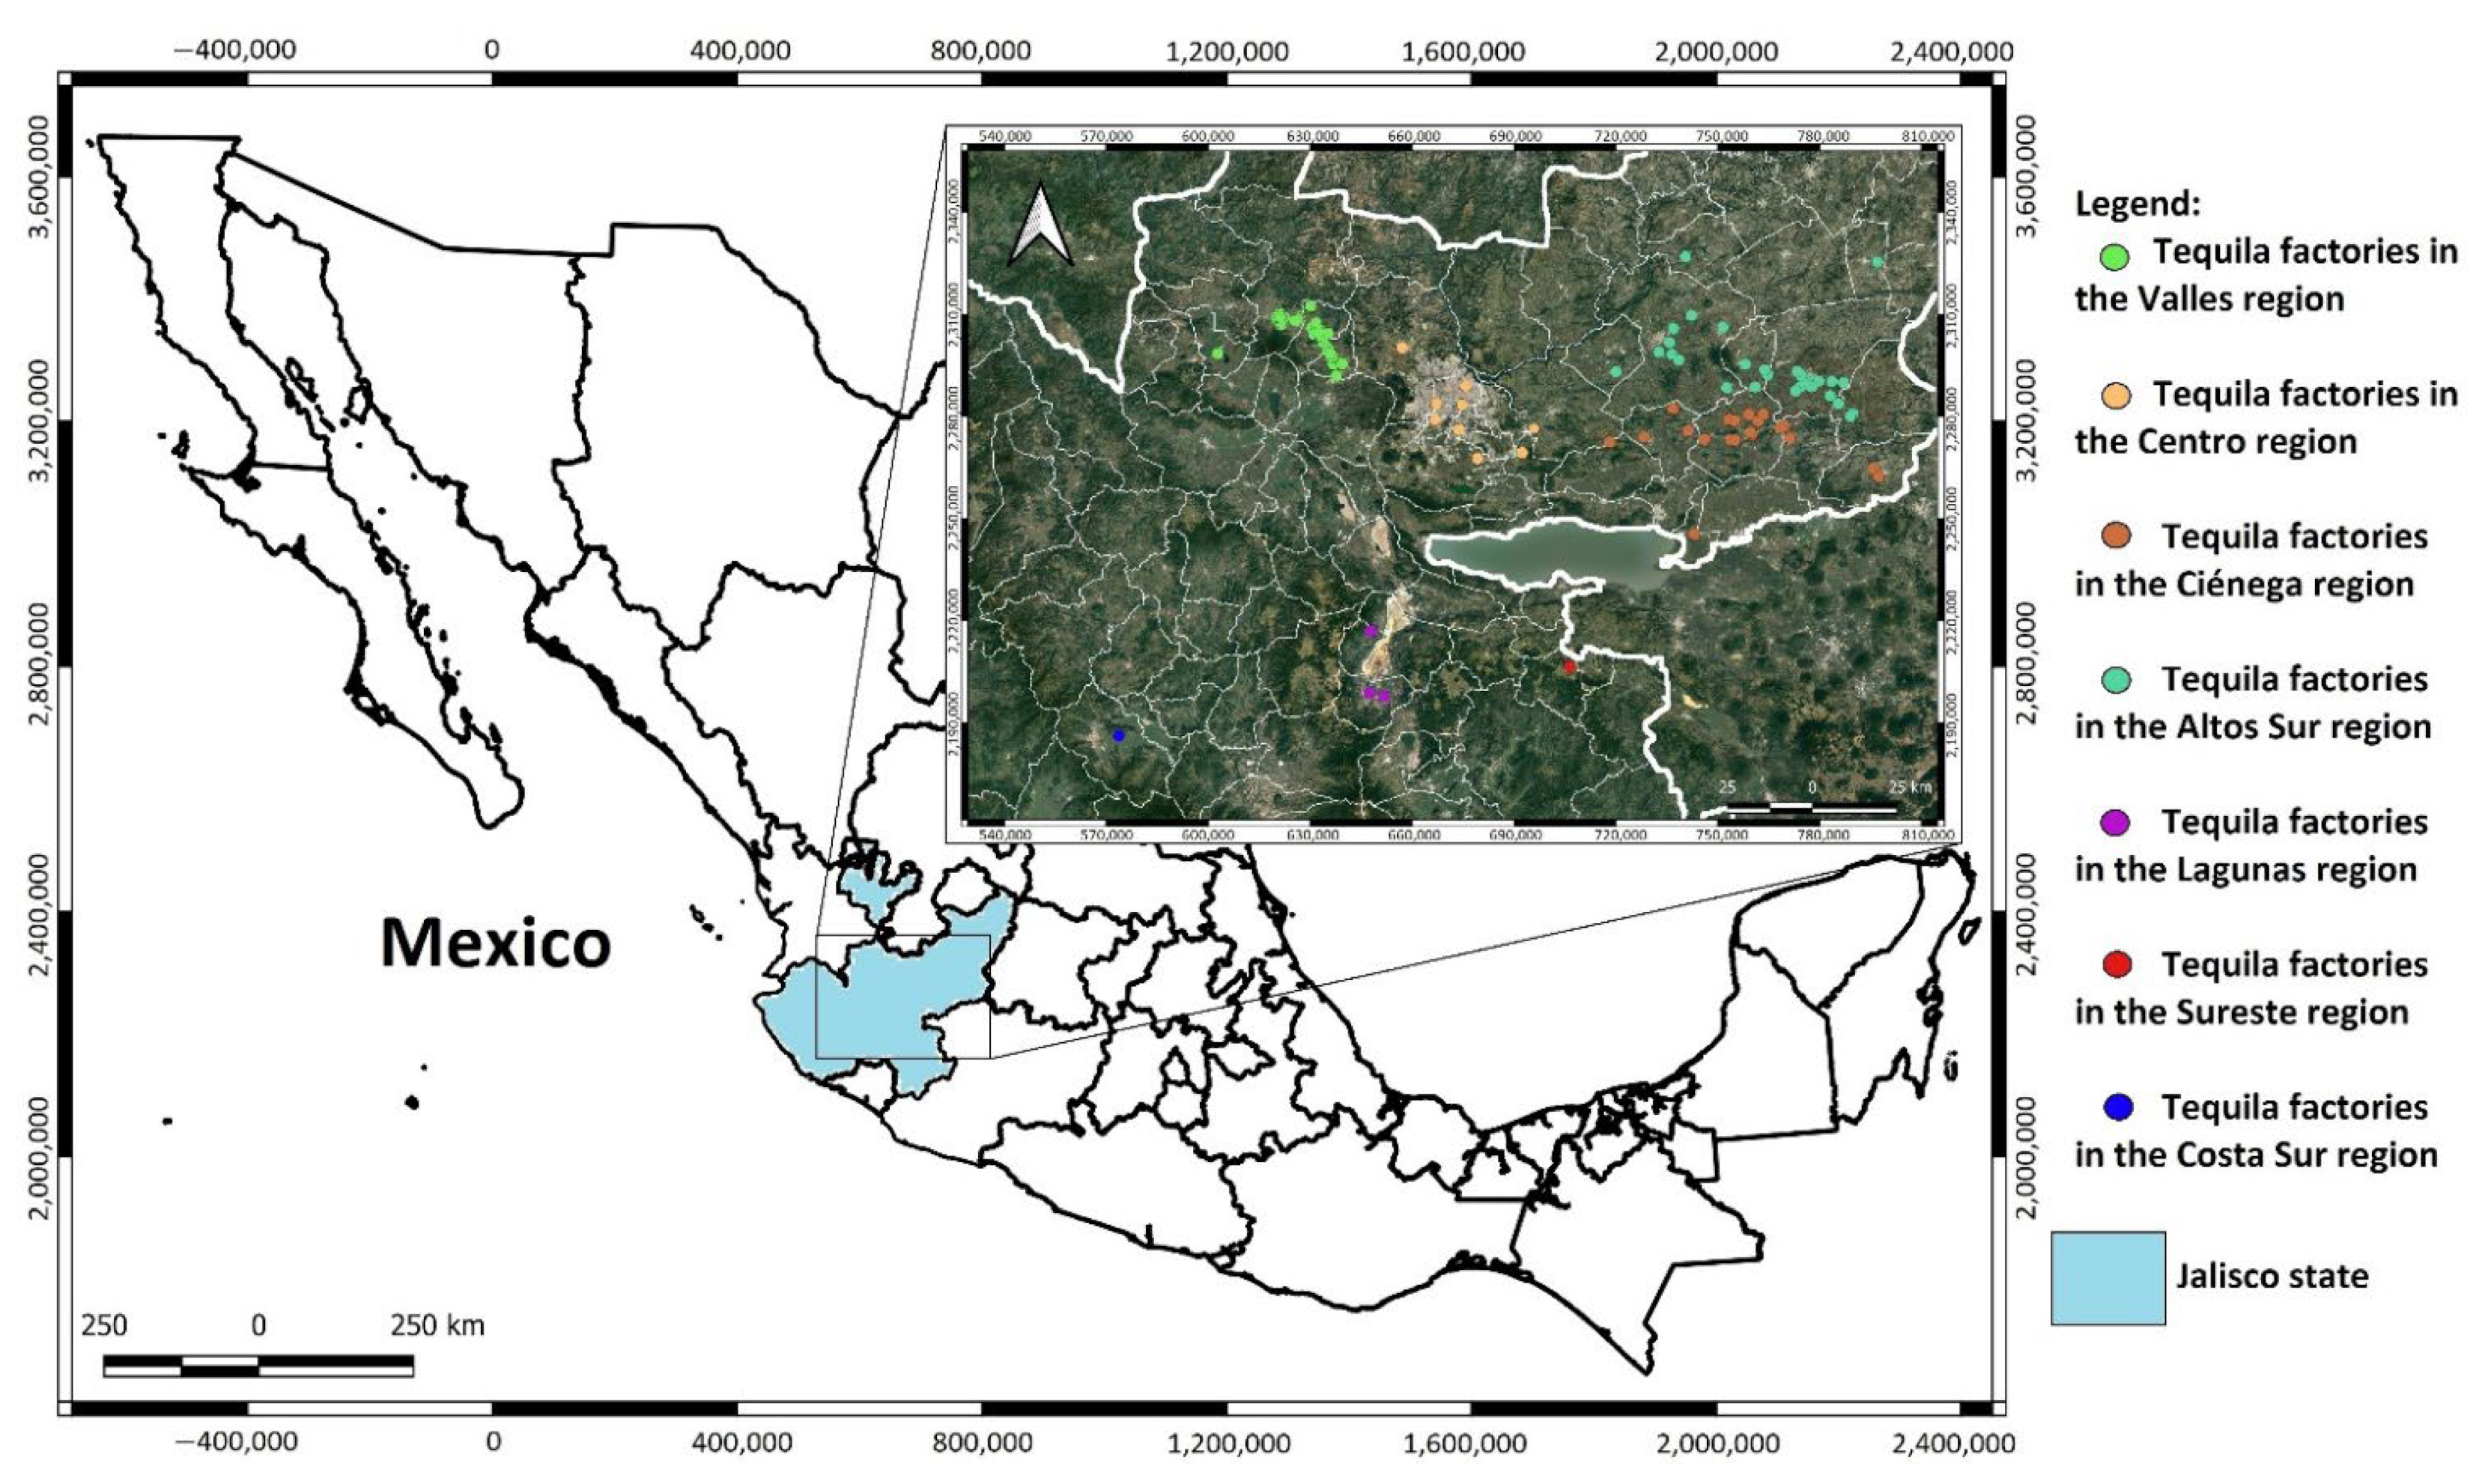
Figure 1. Sampling points along the Atizcoa stream.
Water 14 01395 g001
Figure 2. Location of the soil monitored in the Ciénega Region.
Water 14 01395 g002
Figure 3. Tequila factories located throughout the state of Jalisco (a total of 110 facilities).
Water 14 01395 g003
Table 1. Municipalities with the largest numbers of tequila companies.
MunicipalityRegionTequila Factories
TequilaValles22
ArandasAltos Sur15
AmatitánValles13
Atotonilco el AltoCiénega12
El ArenalValles9
TepatitlánAltos Sur7
Jesús MaríaAltos Sur3
TototlánCiénega3
Table 2. Characterization of Tequila vinasse (Average ± Standard Dev. n = 24) and values of the characterization performed by López-López et al. (2010).
ParameterThis StudyLopez-Lopez et al. 2010ParameterThis StudyLopez-Lopez et al. 2010
Total BOD5
(mg/L)
23,254 ± 7924
(3718–35,516)
35,000–60,000Ammonia(<0.40–15.8)15–40
Total COD
(mg/L)
45,381 ± 17,369
(7565–73,690)
60,000–100,000Nitrite<0.00199---
TSS (mg/L)7127 ± 7294
(190–24,800)
2000–8000Nitrate<0.100---
VSS (mg/L)6418 ± 6451
(185–23,000)
1990–7500Ca2+516.4 ± 292.1
(123–1287)
200–1100
SetS (ml/L)235.6 ± 306.1
(0.1–900)
10–900Cu1.22 ± 2.5
(<0.05–12.5)
<3.0
TP (mg/L)<0.332–228Fe18.5 ± 15.8
(0.24–61.5)
<45
Fats and Oils (mg/L)119 ± 109
(6–423)
10–100Mg2+168 ± 92
(10.4–382.0)
100–300
Total Phenols<0.0103---K297.5 ± 212.5
(3.68–961.8)
150–650
TDS (mg/L)19816 ± 8550
(2055–33,970)
23,000–42,000Na45.1 ± 37.7
(9.2–161.9)
---
Conductivity3044 ± 1007
(523–5385)
---Ni<.0.1–0.54<0.02
pH3.6 ± 0.2
(3.4–3.9)
3.4–4.5Zn1.03 ± 0.76
(<0.1–3.0)
<1.0
Org-N254 ± 127
(24–574)
5.0–10
Table 3. Characterization of Tequila vinasse by factory size (3 L, 6 M, 15 Micro).
ParameterAverage Value
LargeMediumMicro
Total BOD5
(mg/L)
19,58721,08424,856
Total COD
(mg/L)
47,7764915143,394
TSS (mg/L)947282426211
VSS (mg/L)867575245524
TDS (mg/L)22,62422,53618,168
Conductivity332131582943
pH3.53.73.6
Fats and Oils (mg/L)13087130
Org-N262335219
Table 4. Tequila vinasses generated in Jalisco state (collected and estimated data).
SizeMicro SmallMediumLargeTotal
Data collected in a survey (m3/year)27,278
(3.8%)
13,250
(1.8%)
127,164
(17.6%)
556,000
(76.8%)
723,692
Estimate for Jalisco State(m3/year)55,000–82,50126,053–39,079254,740–382,1091,111,591–1,667,386 1,447,384–2,171,076
Table 5. Treatments given to vinasses in tequila factories.
Type of TreatmentNumber of Tequila FactoriesSize of Tequila Factories
Retention lagoon and pH adjustment20Micro (16), Small (1) Medium(2) Large(1)
Sedimentation pond2Medium (2)
Full biological treatment6Micro (3), Medium (2) Large (1)
Full physicochemical treatment (coagulation-floculation)2Large (2)
No treatment12Micro (8), Small (2) Medium (2)
Table 6. Disposal methods according to the information collected in the field study.
Disposal in Surface Waters (m3/year)Disposal in Soils (m3/year)Use of Vinasse for Irrigation (m3/year)Treated by an External Company (m3/year)Disposal into Municipal Sewer Systems (m3/year)Total (m3/year)
No treatment162500300027,395-32,911
Incomplete treatment20090,05090,1594000150184,559
Full treatment297,2007000202,022--506,222
Table 8. Parameter measured in situ along the four sampling points. Mean ± Standard deviation.
ParameterPoint 1Point 2Point 3Point 4
Temperature24 ± 1.835.8 ± 1.627.1 ± 1.026.0 ± 1.7
pH6.9 ± 0.55.4 ± 1.05.7 ± 1.14.7 ± 0.4
DO6.3 ± 0.23.2 ± 0.30.5 ± 0.30.4 ± 0.0
Conductivity82.1 ± 0.9155.7 ± 56.2712.0 ± 145.91384.7 ± 63.5
Table 9. Indicator of surface water quality in Mexico.
ParameterExcellent QualityGood QualityAcceptable QualityPollutedHighly Polluted
BOD5 (mg/L)≤ 3>3
≤6
>6
≤30
>30
≤120
>120
COD (mg/L)≤10 mg/L>10
≤20
>20
≤40
>40
≤200
>200
TSS (mg/L)≤25 mg/L>25
≤75
>75
≤150
>150
≤400
>400
Fecal Colifoms
(MPN/100 mL)
≤100>100
≤200
>200
≤1000
>1000
≤10,000
>10,000
Table 11. Physicochemical characteristics of the evaluated well in comparison with what is established in the modification of NOM-127-SSA1-1994.
ParameterValue on This StudyMexican Standards
Nitrate (mg/L)9.366 ± 2.48410
Nitrite (mg/L)0.058 ± 0.0411
Total Fe (mg/L)0.026 ± 0.01150.30
Mn (mg/L)0.9 ± 0.10.15
Cl (mg/L)17.0 ± 4.334250
F (mg/L)0.306 ± 0.41.5
Hardness (mg/L CaCO3)376.66 ± 2.88500
Alkalinity (mg/L CaCO3)327.10 ± 16.07N.R.
N-NH4+ (mg/L)0.0 ± 0.00.5
Turbidity (NTU)0.296 ± 0.5135 NTU
Sulfate SO42−(mg/L)60.6 ± 1.154400
pH8.083 ± 0.1556.5–8.5
Conductivity (μs/cm)722.67 ± 214.13N.R.
Color (Units of Pt-Co)3.0 ± 2.020
Reactive phosphorus (mg/L)0.054 ± 0.0188N.R.
Total Phenols (mg/L)<0.0101 0.3
Fats and oils (mg/L)<5.00 N.R.
Ca2+ (mg/L)82.40 ± 5.234N.R.
Copper (mg/L)<0.020 2
K+ (mg/L)3.298 ± 0.240N.R.
Mg+2 (mg/L)41.60 ± 2.515N.R.
Na+ (mg/L)18.50 ± 2.656200
Nickel (mg/L)<0.020 N.R.
Zinc (mg/L)<0.020 5
Note: N.R. (Not Reported).
Publisher’s Note: MDPI stays neutral with regard to jurisdictional claims in published maps and institutional affiliations.

