Article

Water Quality Evaluation and Variation Trend Analysis of Rivers Upstream of the Dahuofang Reservoir in China

College of Water Resources, Shenyang Agricultural University, Shenyang 110866, China
*
Author to whom correspondence should be addressed.
Water 2022, 14(9), 1398; https://doi.org/10.3390/w14091398
Submission received: 7 March 2022 / Revised: 22 April 2022 / Accepted: 24 April 2022 / Published: 27 April 2022
(This article belongs to the Section Water Quality and Contamination)

Abstract

:
The Dahuofang Reservoir is one of the most important water sources in Liaoning Province, China, so it is critical to identify the status and evolution characteristics of its water quality. Six monitoring indicators were selected to analyze water quality differences and variation trends of each indicator in three inlet sections of the reservoir during different hydrological periods from 2003 to 2021, and an improved comprehensive pollution index method was proposed to study the pollution variation trends. The results showed three findings. (1) The water quality of the three rivers is better in high water periods than that in low water periods. (2) In terms of the spatial state of the water environment, water quality of the Hun River is the worst, the Suzi River is poor, and the She River is better. The worst indicator of the three rivers, TN (total nitrogen), has exceeded the standard for many years (Grade IV–Inferior Grade V). TP (total phosphorus) in the Hun River, which has deteriorated severely since 2013 and is positively correlated with rainfall; it is mainly influenced by pollution from agricultural activities. (3) The P value obtained by the improved method is lower than that of original method, which is mainly because TN is relatively stable, and the exceeding standard of TP is not as serious as TN. The improved method takes into account the interactions and fluctuations of indicators, so that it can reflect the pollution situation more scientifically. These results are helpful to evaluate the pollution status of surface water. It is suggested that water be transferred appropriately to improve water quality and take necessary management measures to reduce TN and TP in the Hun River.

1. Introduction

Water is an important resource for human survival and development [1,2]. The “13th Five-Year Plan” has greatly improved China’s poor water environment, with 83.4% of grade I~III surface water improving in 2020; however, this still falls short of the 85% target of the “14th Five-Year Plan”. Therefore, it is still necessary to strengthen the protection of water quality in China. Water quality evaluation and variation trend analysis are helpful to propose targeted management measures [3,4,5]. As a water supply reservoir for the seven cities of Fushun, Shenyang, Liaoyang, Anshan, Yingkou, Panjin, and Dalian, in Liaoning Province, China, the quality of water in Dahuofang is crucial to the health of residents [6,7,8,9]. There is a correlation between the water quality of the reservoir and that of the rivers entering the reservoir [10,11]. Therefore, analyzing variation trends in the upstream rivers of the reservoir and scientifically evaluating their pollution are crucial to improving water quality.
At present, water quality analysis of rivers and reservoirs is usually carried out with the single factor evaluation method, the comprehensive pollution index method, the principal component analysis method, the grey relational analysis method, or the neural network method [12,13,14,15,16,17]. However, the complex and cumbersome operations and calculation processes limit the practical application of principal component analysis, the grey relational analysis method, and the neural network method [18,19]. The single factor evaluation method is convenient and simple, but its focuses are too prone to bias. The comprehensive pollution index method has been widely used [20,21,22]. Ning et al. 2020 [23], based on the water quality monitoring data of two sections, used this method to conclude that the water quality was moderately polluted in their study area, which provided a scientific basis for the development and utilization of water resources in the Yangtze River. Li et al. 2021 [24] used this method to analyze water quality change trends of the Wenyu River in Beijing, China, showing that the water quality fluctuates greatly, and that the river is seriously polluted. This method is not only widely used in water quality assessment, but also in air quality and ecological environment assessments [25,26,27,28]. However, each indicator has the same degree of influence on pollution, which is not the case in reality. Jiang et al. 2013 [29] evaluated shallow groundwater using the averaged comprehensive pollution index method, which means that the pollution index obtained by the simple superposition method, the weighted superposition method, the arithmetic mean method, the geometric average method, and the weighted average method, is divided by the corresponding pollution index. This method avoids the disadvantages of different results for the same water sample, but highlights the influence of heavily polluted indicators on the results. Du et al. 2022 [30] used an improved comprehensive pollution index method based on the entropy weight method to evaluate Baiyun Lake in Shandong Province. This method addresses the disadvantages of the original method, using equal weight for each index, and reflects the pollution levels of different lake areas in different sampling periods in detail, which is beneficial to providing more targeted environmental management advice. These improved methods can avoid some problems, but are computationally complex and labor-intensive. For an evaluation method used by environmental protection departments, simplicity and understandability should be guaranteed; thus, it is necessary to explore scientific yet simple methods of using weighting indicators to better reflect the pollution of water bodies. In recent years, researchers have focused on the evolution of water quality in the Dahuofang Reservoir, and revealed the main indicators of water quality exceedance in the upper reaches, which provides a basis for protecting the water sources of the Dahuofang Reservoir [21,22,31,32,33,34,35]. However, there is a lack of research into the variation trends of long-series water quality data.
To effectively reveal the evolution characteristics of water environment pollution, this study (1) proposed a comprehensive pollution index method based on the weight of the coefficient of variation to classify the weights; (2) evaluated the water quality differences between the wet season and dry season over 19 years, and the change trends of the water quality classification indicators; and (3) used the original method and the improved method to evaluate the water pollution status of the three sections.

2. Materials and Methods

2.1. Study Area and Data Sets

The Dahuofang Reservoir (E: 124°04′ to 124°21′, N: 41°50′ to 41°56′) is located in the middle and upper reaches of the Hun River in Liaoning Province, China, with a maximum storage capacity of 2.197 × 10⁹ m3. It is a large-scale water conservancy project integrating flood control, water supply, irrigation, power generation, and fish farming, providing water to 23 million residents. The water in the reservoir mainly comes from the Hun River (52.7%), Suzi River (37.1%), and She River (10.2%) (Figure 1). At the beginning of the study in 2003, the water quality of the Dahuofang Reservoir exceeded the standard in one out of 12 months of the year, while the upper Hun River was Grade IV, and the Suzi River was Grade III in 2003 (She River was not counted). The population of Qingyuan County in the Hun River basin is 345,000, including 234,000 involved in agriculture, with an arable land area of 39,400 hectares and 17,400 t/d of domestic sewage. There are 11 industrial enterprises, including Qingyuan Limestone Mine, Fushun Hongtushan Mining Co., Ltd., Fushun Foundry Co., Ltd., and a paper mill, with industrial effluent reaching 13,200 t/d. Xinbin County in the Suzi River basin has a population of 308,000, of which the agricultural population is 239,000. There are factories, such as the Xinbin County Paper Mill, Yongling Paper Mill, and a food factory. The She River basin has a population of 38,381 and an arable area of 4776.5 hm2. There are two iron ore mines, but their effluent is recycled in a closed circuit.
The water quality data of three inlet sections (the Beizamu section of the Hun River, the Gulou section of the Suzi River, and the Taigou section of the She River), from 23 April 2003 to 30 December 2021, were obtained from the Dahuofang Reservoir Administration and the Fushun Sub-Center of the Liaoning Water Environment Monitoring Center. From 2003 to 2009, the Dahuofang Reservoir Administration evenly set six sampling points on the sections, collected six bottles of 2000 mL three times a month, and sent them to the laboratory to detect indicators, such as biochemical oxygen demand (BOD5), total phosphorus (TP), total nitrogen (TN), and so on. Since 2009, unmanned monitoring stations have been set up in the sections, equipped with automatic samplers, online monitoring, and other equipment, which can automatically sample and transmit data to the Fushun Sub-Center of the Liaoning Water Environment Monitoring Center every four hours (6 times a day) through a public network VPN. In order to ensure the stability of the data and avoid fluctuations in water quality caused by inter-annual variations in rainfall, which may affect the trend analysis of the data, six monitoring indicators during the low (May) and high (September) water periods were selected for this study. Analytical indicators included dissolved oxygen (DO) and biochemical oxygen demand (BOD5), which are important indicators of the self-purification capacity of water bodies [36,37]; the permanganate index (CODMn), which is a common indicator of the pollution of organic and inorganic oxidizable substances in water bodies [38,39]; total phosphorus (TP), which is the main indicator for controlling eutrophication in water bodies [40,41]; total nitrogen (TN), which is an indicator of the degree of nutrient pollution in water bodies [42]; and ammonia nitrogen (NH3-H), which is an indicator of the level of inorganic nutrients in the water body [43,44].

2.2. Methods

2.2.1. Water Quality Evaluation Standards

The surface water quality classification standards of China (GB3838-2002), shown in Table 1, were used in this paper to evaluate the classification of each index in different hydrological periods of the three inlet sections shown in Figure 1 [45].

2.2.2. Comprehensive Pollution Index Method

The comprehensive pollution index method took the ratio of the actual monitoring concentration of the index to the evaluation standard as the pollution index (Pi), and then weighted it to obtain the comprehensive pollution index (P). As a source of drinking water, the water quality of Dahuofang Reservoir should be maintained above grade II. Therefore, this paper used grade II in Table 1 as the evaluation standard, and adopted the comprehensive pollution level of its upstream sections. The larger the P value, the more serious the pollution, while the smaller the P value, the better the water quality. The DO was the opposite. The specific pollution evaluation criteria are shown in Table 2 [18,46].
The equation to calculate P is presented as follows:
P i = C i S i
P = 1 n i n P i   , i = 1 ,   2 ,   3 ,   ,   n  
where P is the comprehensive pollution index, P i is the pollution index of water quality factor i, C i is the measured concentration of water quality factor i, S i is the standard limit of water quality factor i in the “classification standards of China” (GB 3838-2002), and n is the total number of indexes.

2.2.3. Improved Method

Exceeding multiples and concentration fluctuations are the main factors that affect water quality. In the comprehensive pollution index method, P i considers the index exceeding multiples, but each indicator is weighted equally, which ignores the importance of differences between pollutants.
This paper redistributed the weights of each index according to the dimensionless coefficient of variation, which meets the unit requirements. In addition, this is a physical quantity that measures the dispersion of data, and indicators with greater variability have a greater impact on water quality assessment; thus, weighting based on the coefficient of variation can be considered a more scientific reflection of the state of water pollution.
The calculation formula is as follows:
C v i = σ X ¯
W i = C v i i = 1 n C v i
P = W i P i ,   i = 1 ,   2 ,   3 ,   ,   n
where C v i is the coefficient of variation of water quality factor i, σ is the standard deviation of water quality factor i, X is the mean value of water quality factor i, W i is the weight of water quality factor i, and the other letters have the same meanings as defined previously.

2.2.4. Statistical Test Methods

In order to test whether the variances of water quality indicators were equal, the normal distribution test and the homogeneity of variance test were carried out. In this paper, the number of samples was less than 2000; thus, Shapiro–Wilk was used for the distribution test. At present, there are mainly Cochran, Hartley, Bartellet, and Levene tests for homogeneity of variance in statistics [47]; among them, only the Levene test could be used for both normally distributed populations, non-normally distributed populations, or unknown populations [48], and there were two indicators with skewed distributions; thus, the Levene test was used in this paper. The steps of the Levene test are as follows:
(i)
Test the hypothesis.
H 0 : σ 1 = σ 2 = = σ k , that is, the variance of each group is equal; H 1 : σ i σ j , that is, the variances are not equal.
(ii)
Convert the original data to the new variable values.
Z i j = | Y i j Y ˜ i · |
where Y i j is the original data, and Y ˜ i · is the median of the i-th sample in the original data.
(iii)
Calculate the test statistic value W.
W = ( N k ) i = 1 k N i ( Z i · Z · · ) 2 ( k 1 ) i = 1 k j = 1 N i ( Z i j Z i · ) 2
where   k is the number of sample groups, N i   is the content of the i-th sample, N is the sum of the contents of each sample, and Z · · is the total mean of all the data.
(iv)
Calculate P.
P = 1 F ( W | v 1 , v 2 ) = 0 W Γ ( v 1 + v 2 2 ) Γ ( v 1 2 ) Γ ( v 2 2 ) ( v 1 v 2 ) v 1 2 t v 1 2 2 ( 1 + v 1 v 2 t ) v 1 + v 2 2 d t
where the degrees of freedom v 1 and v 2 are k 1 and N k , respectively.
(v)
Principle of judgment.
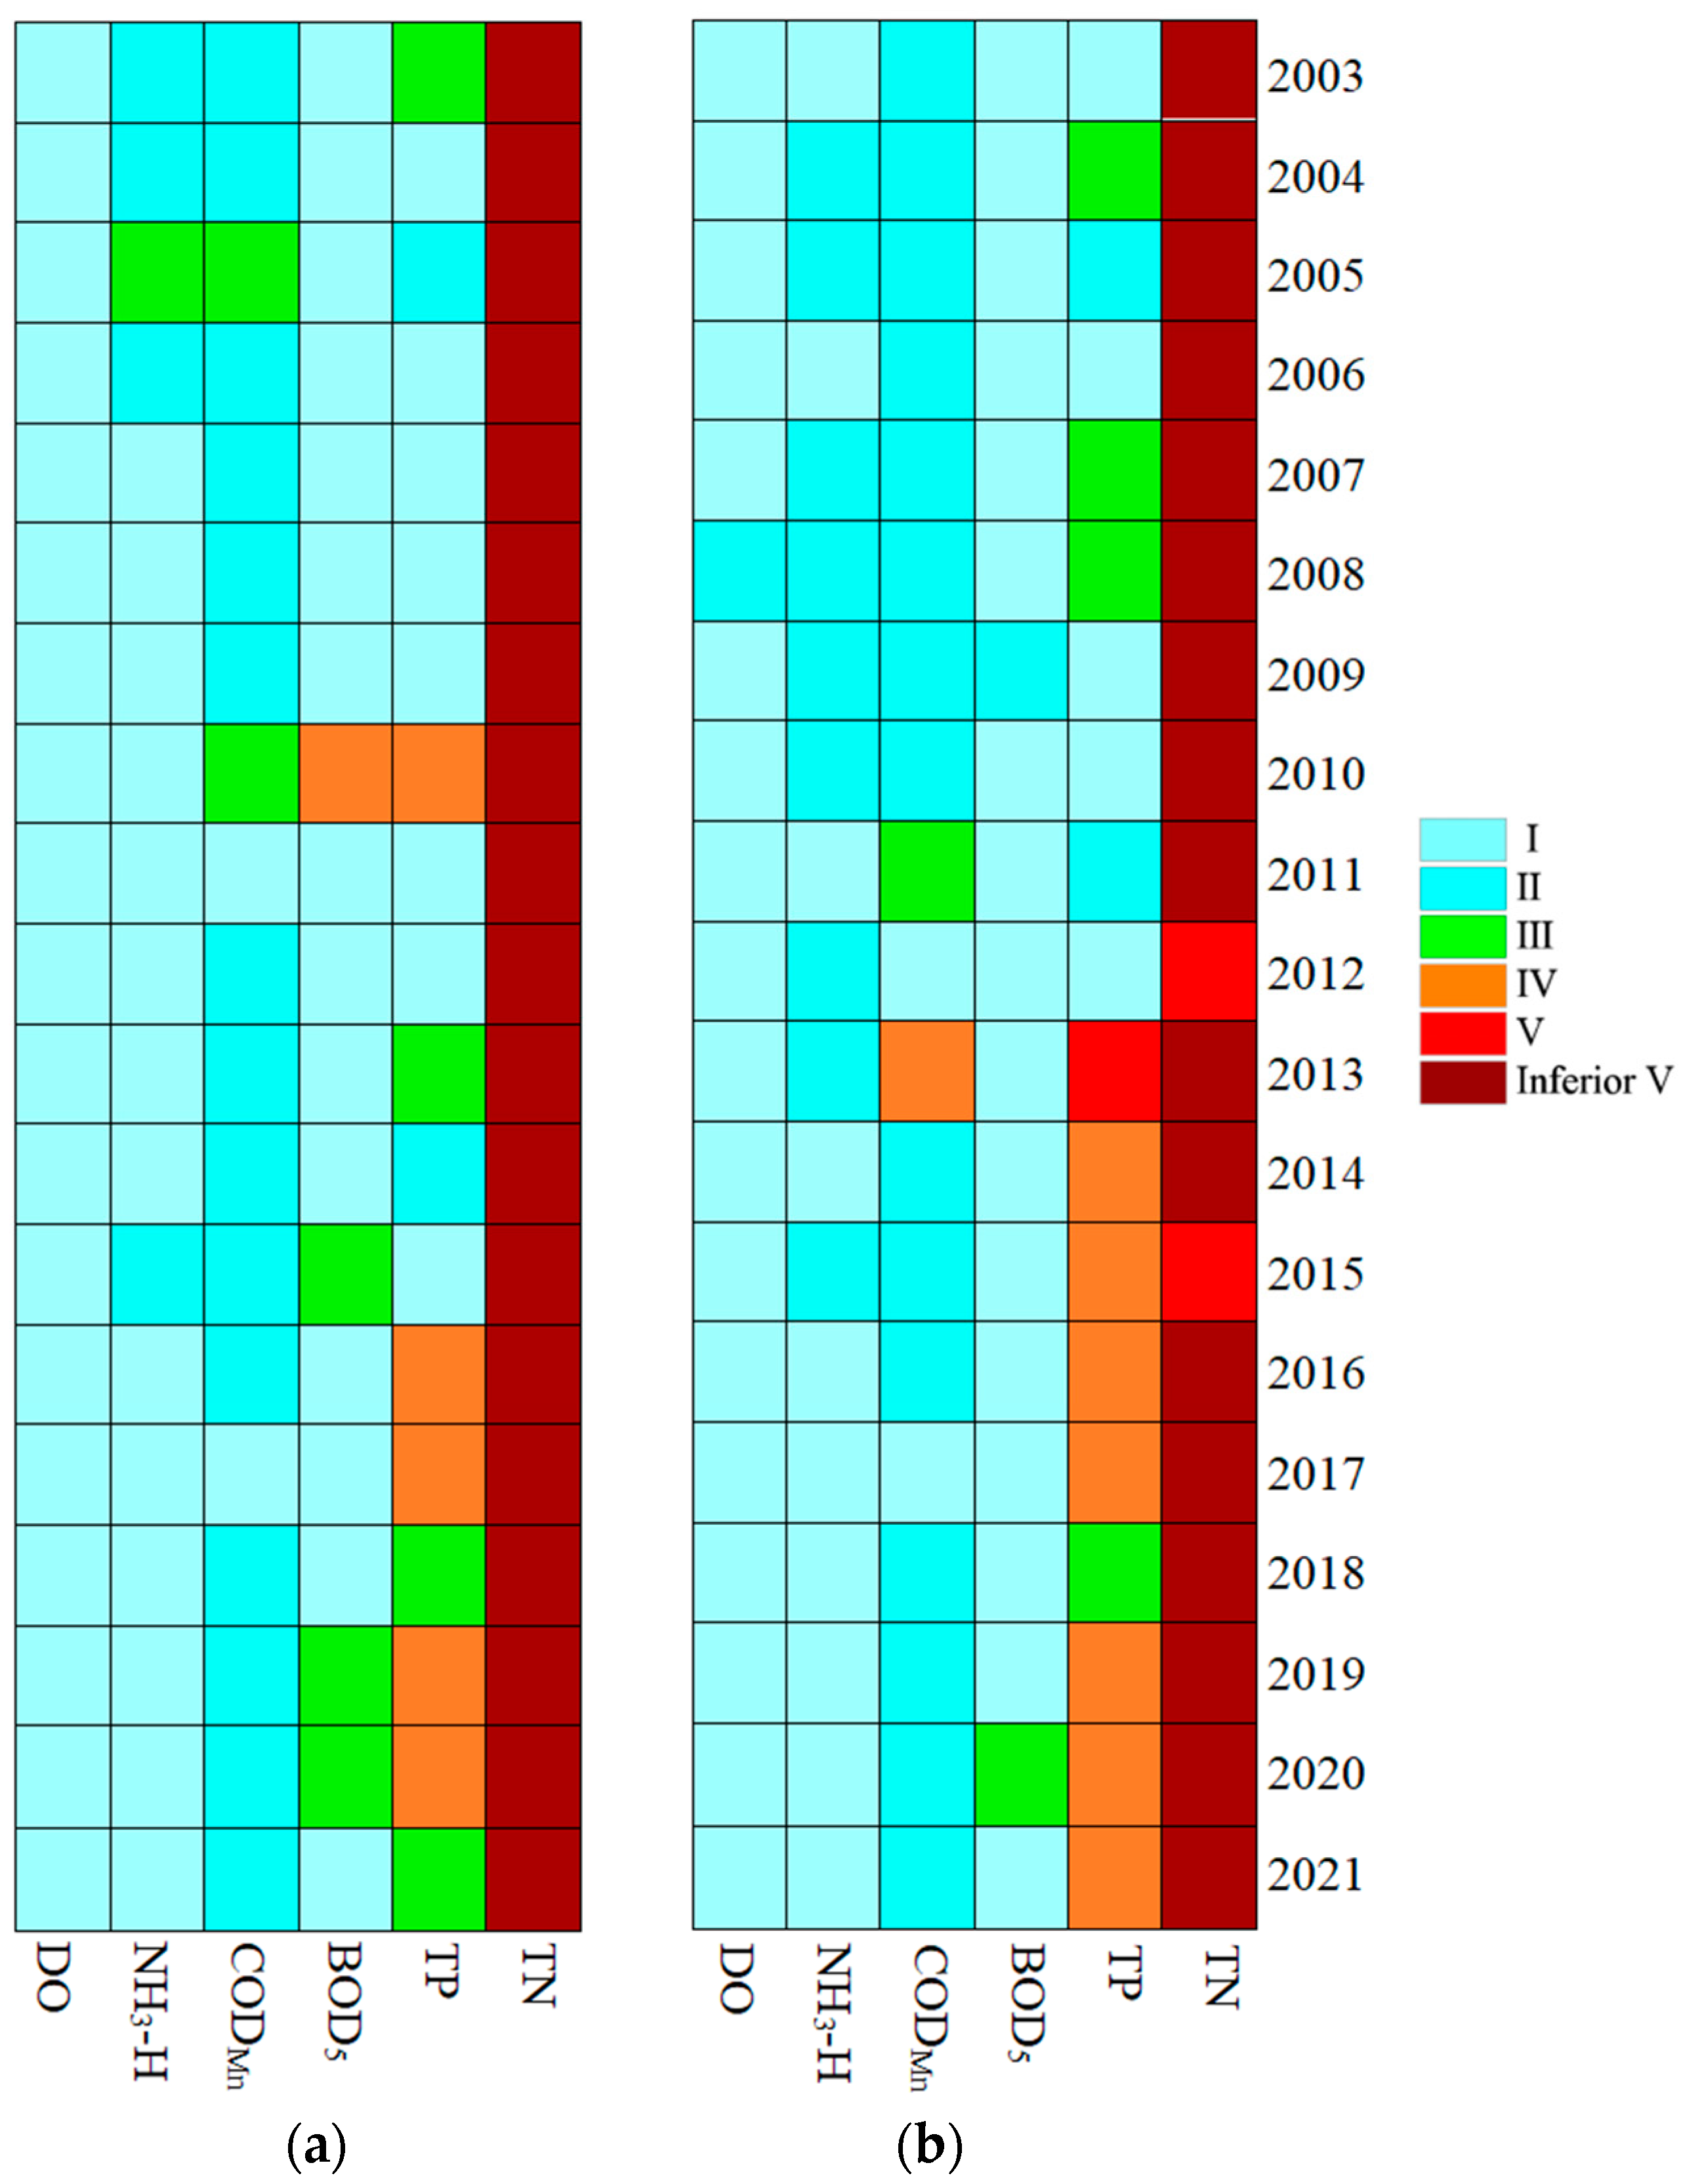
The Levene test statistic obeys the F distribution with degrees of freedom v 1 and v 2 . When W ( F α , k 1 , N k ) , then P α , reject H 0 and accept H 1 ; it can be considered that the variance of each sample is uneven; when W < F ( α , k 1 , N k ) , then P > α , H 0 is not rejected, and the variance can be considered to be homogenous.

3. Results

3.1. Statistical Analysis of Water Quality in Different Hydrological Periods

According to the test results of Shapiro–Wilk in Figure 2, based on the yearly mean values of the six indicators in dry and wet periods, the fitting curves of BOD5 (sig = 0.065 > 0.05), CODMn (sig = 0.055 > 0.05), TN (sig = 0.2 > 0.05), and DO (sig = 0.2 > 0.05) were completely symmetrical, which fitted the normal distribution. However, frequency peaks of NH3-H and TP were all shifted to the left, showing a positively skewed distribution. Therefore, the Levene test, which had weaker requirements for normality than others, was used to determine whether the variances were homogeneous. The results showed that the significance was less than 0.05, thus the nonparametric test (Mann–Whitney test) was used to test the correlation.
The results of the Mann–Whitney test and the data differences between the six monitoring indicators, of the three river sections during the low and high water periods, are shown in Table 3, Table 4 and Table 5. Accordingly, the P values of the DO in Beizamu, the DO in Gulou, and the TN in Taigou section were less than 0.05, which had statistical significance in different hydrological periods. The following was a statistical description of the raw data for each indicator.
The maximum value, minimum value, mean value, and standard deviation of DO in the Beizamu section during the high water period (September) were significantly larger compared to the low water period (May); the mean values of TP and TN were larger than those in the low water period, with the mean value of TN in the high water period found to be 18 times larger than that in the low water period, while BOD5 and CODMn showed the opposite, and NH3-H was less different (Table 3). The water level in the Beizamu section during the high water period is usually about 1.5 m higher than that during the low water period. The high water level and turbulence of the river are conducive to atmospheric oxygen dissolving in the water, which may increase the DO content, improve the self-purification ability of the water body, and reduce BOD5 and CODMn. The area of arable land in Qingyuan County upstream of the Beizamu section is 39,400 hectares, with an annual fertilizer application of about 18,000 t. Rainfall runoff during the abundant water period may wash excess waste into the river, resulting in increased TN and TP concentrations. This statistic showed that the DO value increases during the high water period, which can improve the self-purification ability of the water body to a certain extent, but the increases in TN and TP during the abundant water period are also significant, which may lead to the deterioration of the water body if measures to address this are not taken in the future.
The maximum value, minimum value, and standard deviation of DO in the Gulou section during the high water period were significantly increased compared to the low water period, the mean values of BOD5, CODMn, and TN were reduced compared to the dry water period, and the differences in the remaining two indicators were slight (Table 4). The upstream confluence flow of the Gulou section is much smaller than that of the Beizamu, and the pollution caused by arable land is limited. The flow velocity does not increase significantly during the high water period, thus the oxygen in the water flow has less opportunity to contact the water. Additionally, the rainfall is diluted, making the mean DO value slightly smaller during the low water period. Table 5 shows that the maximum value, mean value, and standard deviation of DO and TN during the high water period were slightly smaller than those during the low water period, while the differences in the mean values of the other four indicators were not significant. The cultivated area of Taigou is the smallest of the three sections at only 4776.5 hm2, and the flow rate is less than one third of that of the Gulou section, which may make the variation of each indicator insignificant.

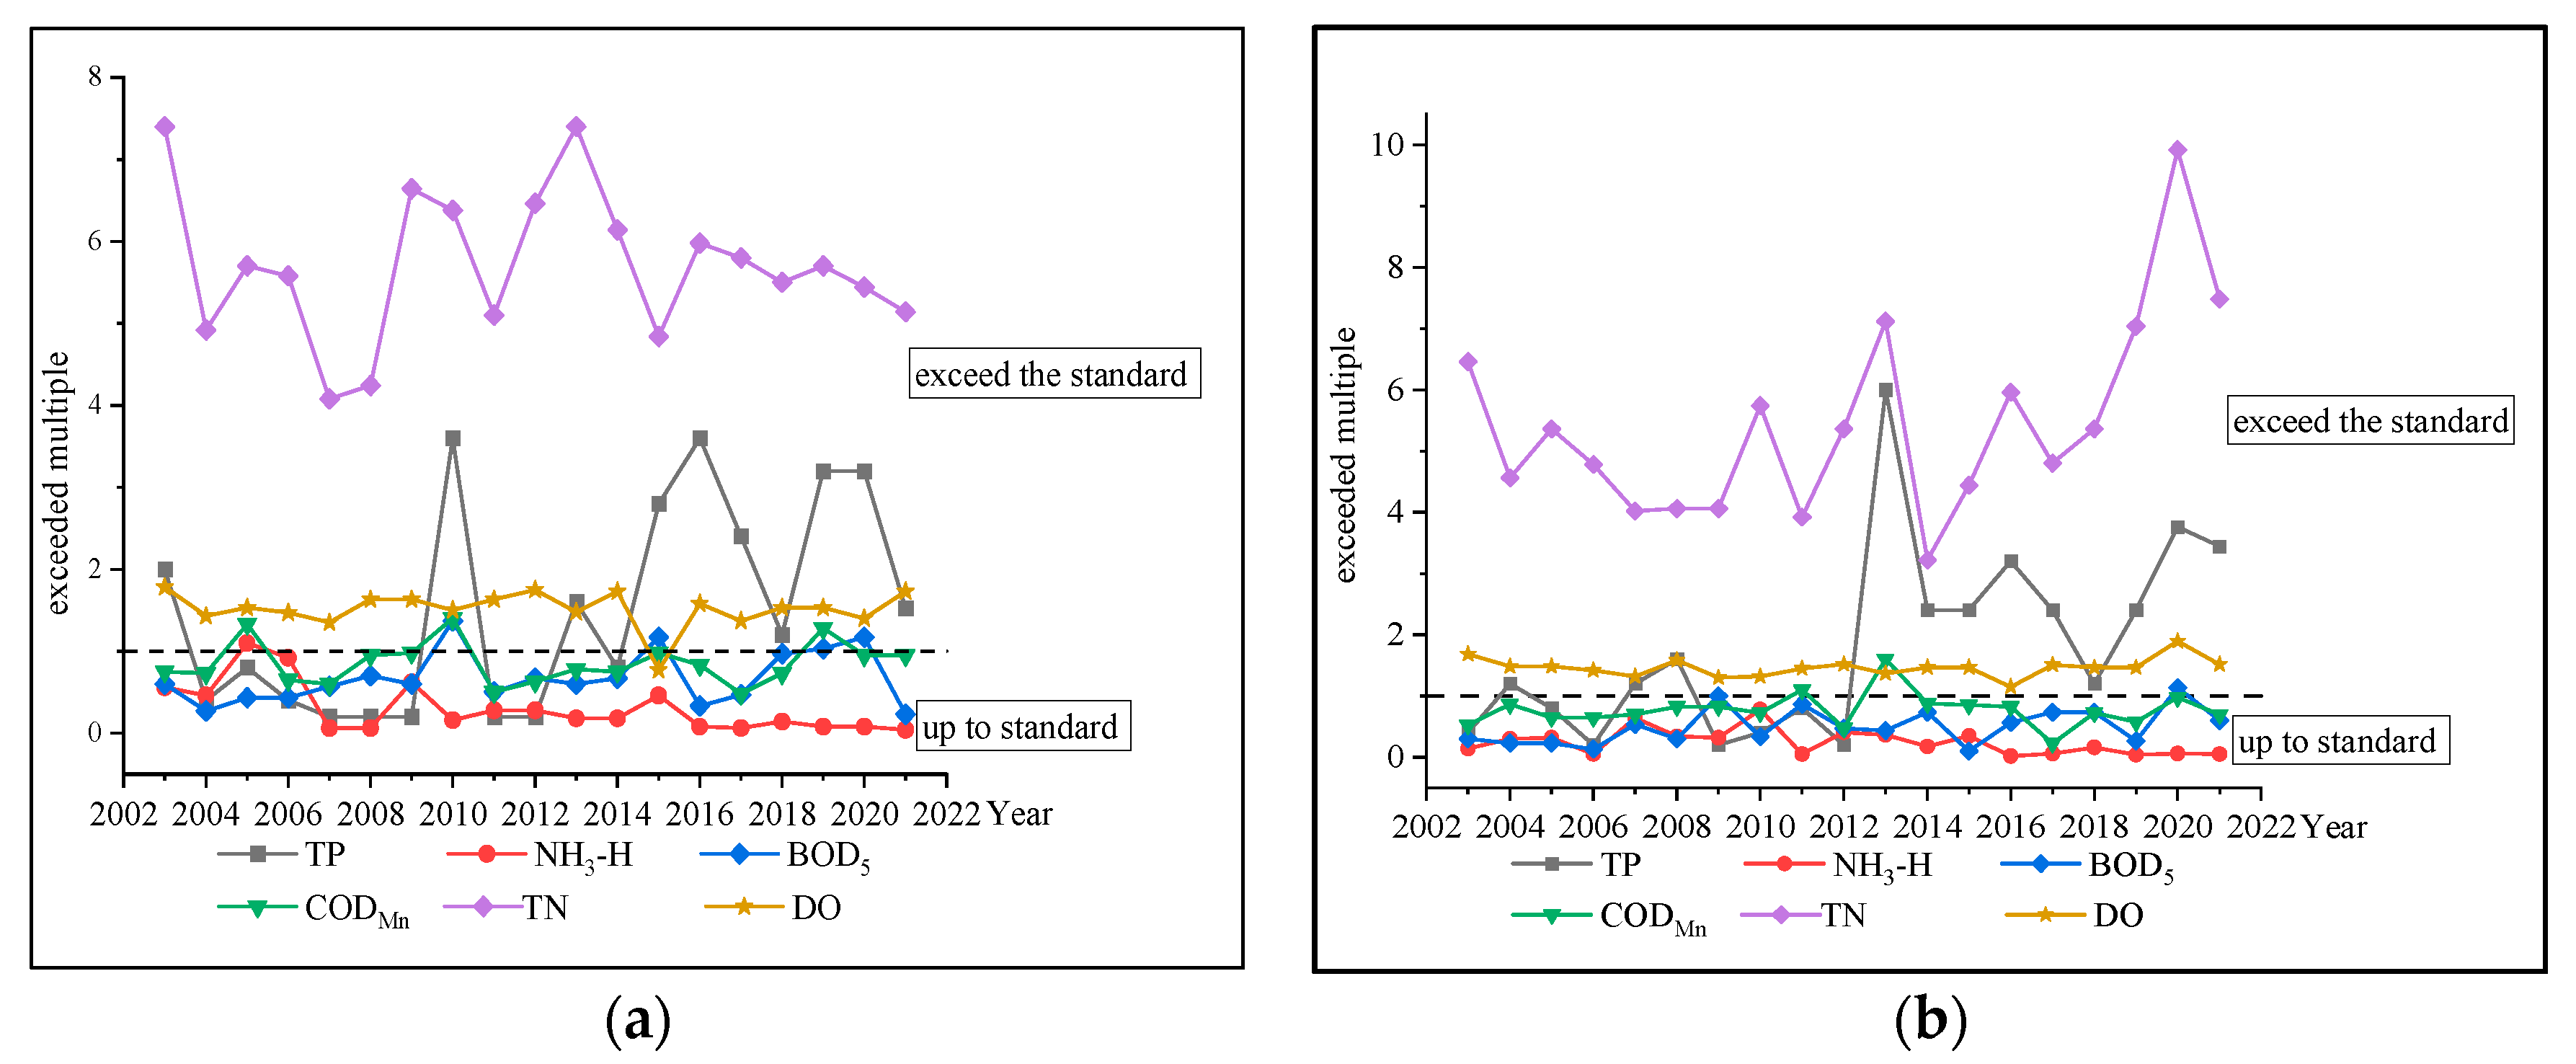
3.2. Trends in the Various Water Quality Indicator Categories

According to the “Surface Water Quality classification standards of China” (GB3838-2002), the classification results of each index of the three sections of Beizamu, Taigou, and Gulou from 2003 to 2021 in the low and high water period are shown in Figure 2, Figure 3, and Figure 4, respectively.
The interannual variation of DO, NH3-H, and CODMn during the dry period (May) in the Beizamu section, shown in Figure 3a, demonstrated no significant change, and basically met the water quality requirements of Grade II. The worst indicator was TN, which has been evaluated as Inferior Grade V for many years. The second worst indicator, TP, showed an overall deteriorating trend. It was relatively stable overall from 2003–2009, had poorer water quality (Grade IV) in 2010, improved from 2011 to 2014, and deteriorated from Grade III to IV in 2015. The highest concentration of BOD5 in 2010 was 4.1 mg/L, which was Grade IV, and the concentration fluctuated three times, which occurred from 2003 to 2010, 2011 to 2015, and 2016 to 2020. From Figure 3b, DO, NH3-H, and BOD5 did not vary significantly during the high water period and all met the standard, while CODMn met the standard except for Category 3 in 2020. TN was the worst indicator, sitting at Grade V to Inferior Grade V. TP has deteriorated and exceeded the standard since 2013, and has been Grade III in recent years.
There was a clear trend of interannual variation in TP, and the extent of its exceedance can be divided into two stages. The pre-study period, from 2003 to 2012, was basically satisfactory, and the post-study stage, from 2013 to 2021, exceeded the standard. The maximum exceedance multiple for TP was 7.12 mg/L in 2013, which may have been caused by heavy rainfall in that year. Multi-year exceedance multiples and exceedance rates were as follows: high water period (1.54 times, 53%) > low water period (1.8 times, 64%) (Figure 4). Figure 5 shows the relationship between rainfall and TP exceedance. It can be seen that TP exceedance was serious in the years when rainfall was high, which may have been caused by large-scale rainfall; in turn, this may have enhanced phosphorus substance accumulation in the soil due to factory discharge, agricultural fertilization, and farming to enter the river, all of which led to TP exceedance. In addition, the exceedance of the TP standard was more serious during the low water period than during the high water period, which showed that the TP pollution in the Hun River is heavily influenced by surface pollution.
During the low water period, it can be seen from Figure 6a that TN of the Gulou section was the worst; it was Grade V to Inferior Grade V for many years. TP showed a trend of first getting worse and then becoming better, and all indicators reached the standard after 2018. BOD5 maintained Grade I water quality except for a classification of Grade IV in 2010. The changes of NH3-H, CODMn, and DO were not significant, and all indicators reached the standard. According to Figure 6b, in the high water period TP was slightly substandard at the beginning of the study in 2004, 2005, and 2007, and became worse by the end of the study in 2013, with only 2018 meeting the standard between 2016 and 2021. CODMn met the standard except for when it was Grade IV in 2020. NH3-H, BOD5, and DO all reached the standard over the years, without significant changes.
During the low water period, it can be seen from Figure 7a that TN was most severe in the Taigou section, which was Grade V to Inferior Grade V. TP showed a trend of exceedance in 2016, and in the last two years. NH3-H and CODMn basically met the standard for many years, and the interannual variation characteristics were not significant. BOD5 was the best indicator, maintaining Grade I for many years. From Figure 7b, DO, NH3-H, CODMn, and BOD5 showed no significant trends and were largely compliant during the high water period. TN deteriorated from Grade V at the beginning of the study to Grade V to Inferior Grade V by its end. TP had the same repeated fluctuations as during the low water period, and could be divided into three stages overall: poor and exceeding the standard from 2003 to 2008, better and maintained as Grade I from 2009 to 2015, deteriorating since 2016, and becoming Grade V and Inferior Grade V in 2020 and 2021, respectively.

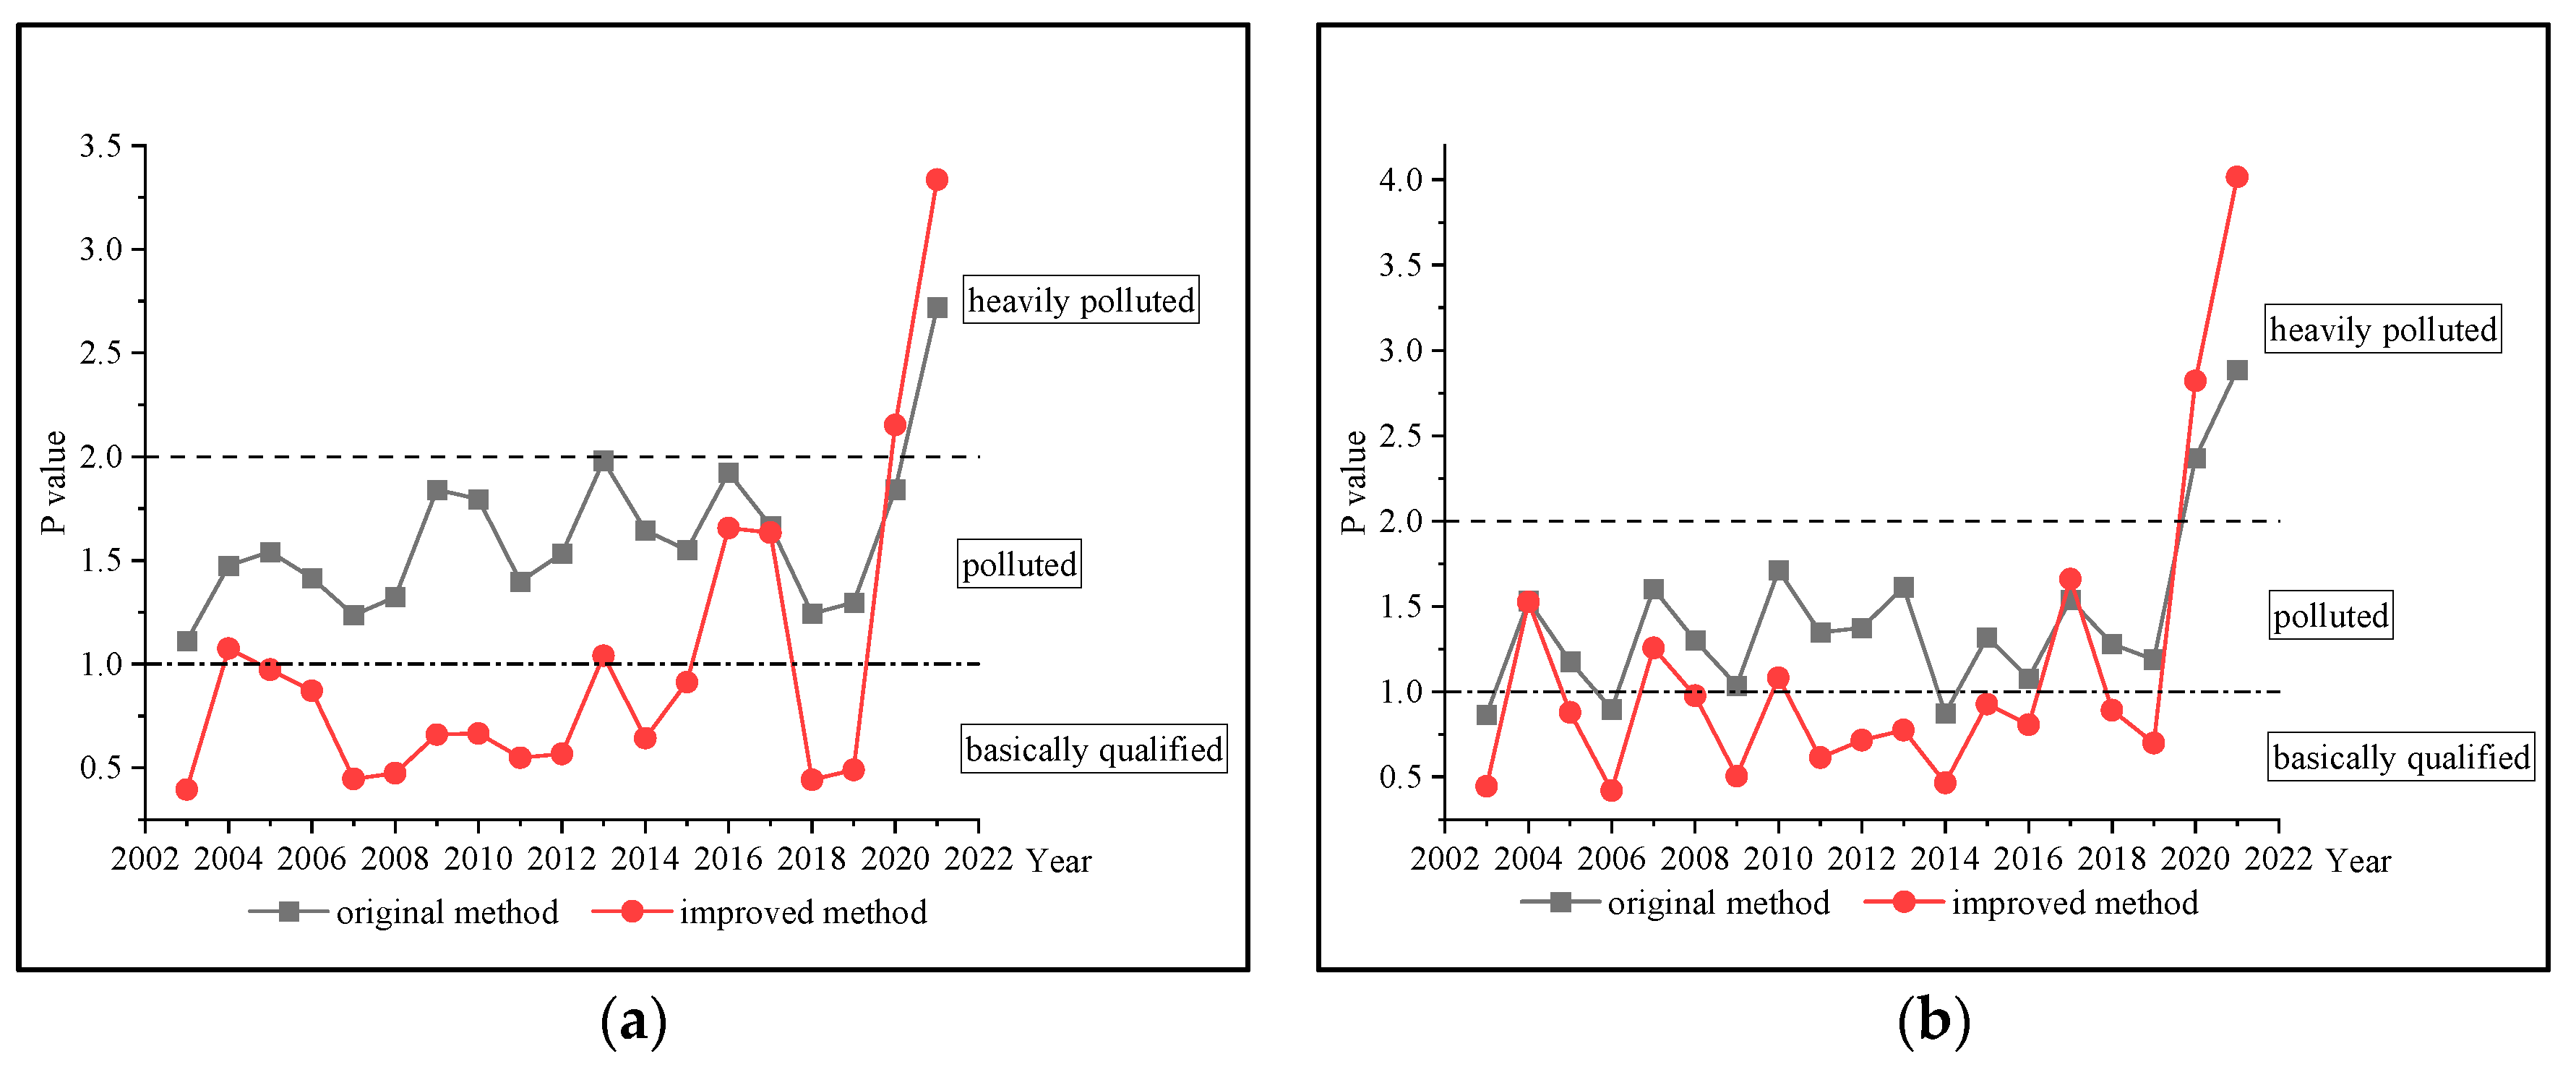
3.3. Analysis of Comprehensive Pollution Index Results

The results of P for the three river sections under the original and improved analysis methods are shown in Figure 8, Figure 9 and Figure 10. The original weights and improved weights of the three sections are shown in Table 6. The mean p-values for the three sections from 2003 to 2021 under the two methods are shown in Table 7.
It can be seen from Figure 8a that the P value of the Beizamu section in the low water period was “multi-peak”, and the water quality fluctuates greatly; this can be divided into three stages. The first stage was from 2003 to 2009, and the water quality was basically qualified; the second stage was from 2010 to 2017 when the P value was mostly greater than 1 and the water quality was affected by serious pollution; and the third stage was from 2018 to 2021 when the water quality was basically qualified except for minor pollution in 2020. The original method showed that 68% of the sections of Beizamu were polluted and 32% were heavily polluted during the low water period. However, the improved method showed that 42% were basically qualified and 58% were polluted. According to Figure 8b, the P value in the high water period showed a “double peak”, which was larger in 2013 and 2020, of 1.242 > 1 and 1.458 > 1, respectively, all of which were polluted. The original method showed that 84% of the sections were polluted and 16% were heavily polluted; the improved method showed that 84% of the sections were basically qualified while 16% were polluted.
From Figure 9a, the original method showed 84% of the river sections were polluted and 16% heavily polluted during the low water period in the Gulou section, while the improved method showed 63% were basically qualified, 32% polluted, and 5% heavily polluted. Figure 9b shows that the P value of the Gulou section fluctuated upwards during the high water period, with a maximum of 2.041 > 2 in 2020, which was heavily polluted, and that the pollution status could be divided into two stages. The water quality in 2003 to 2012 was in the basic qualified state, except for 2007 when it was lightly polluted, and in 2013 to 2021 when it was basically qualified and heavily polluted. The original method showed that the Gulou section was 95% polluted and 5% heavily polluted during the high water period, while the improved method showed 53% basically qualified, 42% polluted, and 5% heavily polluted.
As can be seen from Figure 10a, the water quality of the Taigou section during the low water period of the study was more stable in the early stage, and more volatile in the later stage, with the maximum integrated pollution index occurring in 2021 at 3.336 > 2, indicating that it was heavily polluted. Water quality pollution could be divided into two phases, with better water quality from 2003 to 2015, mostly in the basically qualified and lightly polluted states, and from 2016 to 2021 when water quality became worse, and was mainly polluted to heavily polluted. The original method showed that 95% of the Taigou section was polluted and 5% was heavily polluted during the low water period, while the improved method showed 73% basically qualified, 16% polluted, and 11% heavily polluted. According to Figure 10b, the P value fluctuated greatly during the high water period, and the maximum value of 4.017 > 2 occurred in 2021, when it was heavily polluted. The original method showed 16% basically qualified, 73% polluted, and 11% heavily polluted during the high water period in the Taigou section, while the improved method showed 67% basically qualified, 21% polluted, and 11% heavily polluted.
From Table 6, it can be seen that the fluctuations of the indicators for the three sections are as follows: NH3-H > TP > BOD5 > CODMn > TN > DO. The minimum weights of NH3-H and TP in the improved method were 0.278 and greater than 0.167, respectively; BOD5 was similar to the original method, and the weights of CODMn, TN, and DO were lower than those of the original method. The original method results in Table 7 showed that the multi-year average comprehensive pollution index of the three sections was between 0.902 and 1.759, indicating polluted and basically qualified, respectively. However, in the improved method, the Gulou and Taigou in the wet season were 0.91 and 0.92, respectively, which were less than 1 and basically qualified.

4. Discussion and Conclusions

4.1. Discussion

The average P values of the three sections during the high water period under both methods were less than those in the low water period. For instance, the average P value of the improved method in the high water period (1.08) was less than that in the low water period (1.119) in the Beizamu section (Table 7). The water quality in the high water level season was better than that in the low water level season, which may be due to the dilution effect of large flow during the high water level season. This finding is consistent with the study of Honghu Lake (2021) by Chen et al. [49], the seasonal variation characteristics analysis of water quality in Huntai Basin explored (2021) by Li Yao et al. [50], and a study on the water quality of the Segamat River in Malaysia (2018) by Faridah et al. [51]. However, it is not very consistent with the conclusions of Choi et al. [52] on the water quality evaluation of the Jinwi River watershed in South Korea in 2021. This may be because the upper Jinwei River is an urban area with relatively high organic matter and nutrient load compared with the Dahuofang Reservoir. Therefore, the large flow during the wet season will increase pollutant loads and worsen the water quality. To sum up, increasing the flow volume of the upstream river can improve the inflow water quality to a certain extent. Therefore, strengthening the hydrological connectivity of the river, in addition to appropriate water diversion and transfer, are important measures to improve the water quality of the river.
In the comprehensive pollution index method, the exceeding multiple of each pollutant is reflected by the pollution index Pi, and the weight of each water quality factor is the same; The Levene test showed that the fluctuations of each index were different, and the improved comprehensive pollution index method determines the corresponding weight according to the variation coefficient of each water quality factor. The greater the coefficient of variation, the greater the weight. For the most serious pollution index TN and the second serious index TP, the weight changed significantly (see Table 6) before and after improvement of the analysis method. TN index exceeds the standard greatly, but the fluctuation is small; thus, the calculated weight (0.16) is less than the original weight (0.167). The TP index is just the opposite, with small exceedance but large fluctuation; thus, the calculated weight (0.43) is greater than the original weight (0.167), making the final calculated P value lower than the original method. In addition, the P value trend calculated by the improved method is consistent with the original method, and can reflect that the water quality in the wet season is better than that in the dry season. To sum up, it is more scientific and reasonable to determine the weight based on the coefficient of variation.
Compared with the original method, the improved method can reflect the pollution level of rivers in different periods in detail. For example, the comprehensive pollution index of the Gulou section in the low water period (1.002, polluted) is greater than that in the high water period (0.930, basically qualified), which shows that measures such as water diversion and transfer can improve water quality. Compared with the principal component analysis method, grey correlation analysis method, neural network method and other methods, the improved method has a simpler calculation process and stronger operability. Therefore, the improved method can more specifically analyze the local water quality, help to provide more targeted environmental management policies and suggestions, and play a positive role in the restoration of the water environment.
The calculation results of the comprehensive pollution index method show that the pollution index in the wet season is ranked from large to small: Beizamu (1.708) > Gulou (1.483) > Taigou (1.421), and the pollution index in the dry season is Beizamu (1.759) > Gulou (1.540) > Taigou (1.507). The improved method shows that the pollution index during the high water period is Beimagi (1.08) > Gulou (0.93) > Taigou (0.902), while during the low water period the index is Beizamu (1.119) > Gulou (1.002) > Taigou (0.999). The three rivers are ranked from high to low in pollution degree: Hun River > Suzi River > She River, which may be closely related to the natural conditions and industrial structure of the basin. This finding is similar to the water quality evolution trend of the Dahuofang Reservoir analyzed by Yang Jinwei et al. [32] in 2016, and the water quality evolution results of inflow rivers analyzed by Wang Qiong et al. [53] in 2019. Hun River Basin has a population of 345,000, while Suzi River Basin and She River Basin have populations of 308,000 and 38,381 respectively. Therefore, Hun River Basin has the largest domestic sewage discharge. The cultivated land area of Suzi River is 51,000 hectares, while that of Hun River and She River are 39,400 hectares and 4777 hectares, respectively. Therefore, the pollution of Suzi River may come from chemical fertilizers and pesticides to a great extent. There are some industrial enterprises in the upper reaches of Hun River that may cause point source pollution, such as Fushun Hongtoushan Mining Co., Ltd., Fushun Longye Chemical Nanzamu Co., Ltd., etc., which are involved in metal smelting and chemical discharge. Although a series of environmental remediation measures have been taken, and enterprises are required to discharge wastewater after reaching the standard, the water quality is still not optimistic. There are paper mills and food factories in the Suzi River Basin, but their scale is far smaller than that of the mining plants in the Hun River Basin; therefore, the pollution of the Hun River is the most serious. She River Basin has the smallest population, the smallest cultivated land area, and no polluting enterprises; thus, the water quality is the best, with basically closed-circuit circulation and no sewage outflow.
TN concentration (Grade IV to Inferior Grade V) in Hun River is mainly influenced by point source pollution, and TP concentration (1.055–1.800 times higher than the standard) is mainly affected by agricultural non-point source pollution, which is positively correlated with rainfall. This is similar to the research results of Pang et al. [54] in 2015 and Beizamu et al. [55] in 2018 on the relationship between agricultural land and rivers.

4.2. Conclusions

This paper proposed, for the first time, a comprehensive pollution index method based on the coefficient of variation, to analyze the variation characteristics and pollution state of water quality in the upper reaches of the Dahuofang Reservoir. Our study resulted in four findings. (1) The improved method based on the coefficient of variation is reasonable. The improved method comprehensively considers the influence of pollution index fluctuations and the interactions between evaluation indexes, so that the weight coefficient can more scientifically reflect the degree of influence of each index on water quality. (2) The water quality of the three sections in the upper reaches of the Dahuofang Reservoir during the high water period is better than that in the low water period; thus, water quality supervision during the low water period should be strengthened in the future. (3) The pollution level was as follows: Hun River > Suzi River > She River. Strengthening the treatment of domestic sewage and industrial sewage from mines in the Hun River, and controlling the application of chemical fertilizers on arable land in the Suzi River basin would be useful. (4) TP has deteriorated since 2013 in the Hun River and continues to exceed the standard from Grade III to Grade IV. This is mainly a result of fertilization and pesticide application in farmland; thus, the use of chemical fertilizers and pesticide should be limited in the future else the water quality of the Hun River will become worse.
This study can provide reference and guidance for water quality management of the Hun River Basin, and has broad application prospects. However, the research also has some shortcomings. Future research could include the following two aspects: (1) adding more indicators to better reflect pollution status, especially heavy metal indicators such as iron and copper; and (2) formulating a variety of management measures, and estimating the treatment effect of each measure, with particular attention to TN and TP.

Author Contributions

Conceptualization, B.Y. and Z.G.; methodology, D.L.; software, D.L.; validation, B.Y., Q.C. and J.C.; formal analysis, D.L.; investigation, B.Y.; resources, B.Y.; data curation, Z.G.; writing—original draft preparation, D.L.; writing—review and editing, D.L.; visualization, Z.G.; supervision, B.Y.; project administration, B.Y.; funding acquisition, B.Y. All authors have read and agreed to the published version of the manuscript.

Funding

This research was funded by [Liaoning Provincial Department of Education Scientific Research] grant number [LJKZ0696].

Data Availability Statement

The authors would like to express their sincere thanks for the data support provided by the Dahuofang Reservoir Administration and the Fushun Sub-Center of the Liaoning Water Environment Monitoring Center.

Acknowledgments

We gratefully acknowledge the Dahuofang Reservoir Administration and the Liaoning Provincial Water Environment Monitoring Center Fushun Branch for the water quality monitoring sections data of the Hun, Suzi, and She Rivers, and the Liaoning Provincial Department of Education for their financial support.

Conflicts of Interest

The authors declare no conflict of interest.

References

  1. Ward, A.F.; Salman, D.; Amer, A.S. Managing food-ecosystem synergies to sustain water resource systems. Sci. Total Environ. 2021, 796, 148945. [Google Scholar] [CrossRef] [PubMed]
  2. Thapa, S.; Zhang, F.; Zhang, H.; Zeng, C.; Wang, L.; Xu, Y.C.; Thapa, A.; Nepal, S. Assessing the snow cover dynamics and its relationship with different hydro-climatic characteristics in Upper Ganges river basin and its sub-basins. Sci. Total Environ. 2021, 793, 148648. [Google Scholar] [CrossRef] [PubMed]
  3. Han, W.; Dang, J.; Zhao, Y. An overview of research on water quality target management technology in river basins. Environ. Sustain. Dev. 2020, 45, 133–137. [Google Scholar]
  4. Liu, Q.; Tian, Y.; Liu, Y. Characteristics of two types of comprehensive water quality assessment methods and their roles in river water environment management. Acta Ecol. Sin. 2019, 39, 7538–7546. [Google Scholar]
  5. Xia, F.; Hu, S.; Gong, Z. A comparative study on the application of different water quality evaluation methods: A case study of rivers entering the Danjiangkou Reservoir. Yangtze River 2017, 48, 11–15. [Google Scholar]
  6. Du, Y.; Chen, Q.; Wang, Z. Comprehensive evaluation on the safety of drinking water sources in typical lakes in Jiangsu Province. Water Resour. Prot. 2020, 36, 71–78. [Google Scholar]
  7. Geng, X.; Ge, Y.; Wang, A. Research on the Comprehensive Benefit Evaluation of Ecological Compensation in Water Sources: Taking Yunmeng Lake in Shandong Province as an Example. Issues Agric. Econ. 2017, 38, 93–101. [Google Scholar]
  8. Chen, L.; Zhang, L.; Huang, D. Current status of water quality in Dahuofang Reservoir and its inflow tributaries and structural characteristics of aquatic biological communities. Environ. Pollut. Control 2021, 43, 834–838. [Google Scholar]
  9. Zhao, B. Water environment safety assessment of the drinking water source of Dahuofang Reservoir. Tech. Supervis. Water Res. 2020, 5, 151–154. [Google Scholar]
  10. Cao, C.; Liang, M.; He, G. Correlation between the fluorescence characteristics of dissolved organic matter in urbanized rivers and water quality: A case study of Lujiang River in Beilun District, Ningbo City. Environ. Sci. Beijing China 2018, 39, 1560–1567. [Google Scholar]
  11. Na, N. Research on the future runoff forecast of Dahuofang Reservoir. Tech. Supervis. Water Res. 2019, 1, 110–114. [Google Scholar]
  12. Marsha, P.; Hsun, L.C.; Mat, S.I. Long-Term River Water Quality Trends and Pollution Source Apportionment in Taiwan. Water 2018, 10, 1394. [Google Scholar]
  13. Nguyen, T.G.; Phan, K.A.; Huynh, T.H.N. Spatiotemporal Analysis of Surface Water Quality in Dong Thap Province, Vietnam Using Water Quality Index and Statistical Approaches. Water 2021, 13, 336. [Google Scholar]
  14. Peng, F.; Zhang, Y.; Li, Q. Multi-indicator evaluation and evolution characteristics analysis of water quality at the entry section of Guanting Reservoir. Environ. Monit. China 2020, 36, 65–74. [Google Scholar]
  15. Wang, X.; Shao, J.; Wang, J. Evaluation and trend of water quality of the Yangtze River inflow and outflow in the Three Gorges Reservoir area. Acta Sci. Circumstantiae 2017, 37, 554–565. [Google Scholar]
  16. Zhe, M.; Zhang, X.; Sun, R. Water quality evaluation and main pollution factors in the Yamdrok Yongco Basin of Tibet. Sci. Limnol. Sin. 2016, 28, 287–294. [Google Scholar]
  17. Guodong, Y.; Bin, X.; Honglin, S. Evaluation of Aquaculture Water Quality Based on Improved Fuzzy Comprehensive Evaluation Method. Water 2021, 13, 1019. [Google Scholar]
  18. Li, H.; Hou, L.; Xu, P. Application of different water quality index methods in water quality evaluation of Xiajiang Reservoir. Yangtze River 2020, 51, 32–36. [Google Scholar]
  19. Wang, W.; Gao, P.; Li, J. Water quality evaluation and trend analysis of typical inflow tributaries of Danjiangkou Reservoir. Water Resour. Prot. 2016, 32, 127–130. [Google Scholar]
  20. An, G.; Lin, L.; Zou, S. Discussion on the ranking of urban river water environment quality based on comprehensive index method. Environ. Monit. China. 2016, 32, 50–57. [Google Scholar]
  21. Sun, T.; Zhang, M.; Li, M. Water quality evaluation based on correspondence analysis method and comprehensive pollution index method. Environ. Sci. Technol. Wuhan China 2014, 37, 185–190. [Google Scholar]
  22. Wang, Z.; Zhu, S.; Liu, Y. Comparative application of different water quality evaluation methods in the lower reaches of the Luan River. Water Saving Irrig. 2019, 10, 68–72. [Google Scholar]
  23. Ning, Y.; Yin, F.; Li, X. Evaluation of water quality in Huangshi section of Yangtze River based on comprehensive pollution index method and grey correlation analysis method. Hubei China Norm. Univ. Nat. Sci. Ed. 2020, 40, 39–46. [Google Scholar]
  24. Li, L.; Men, B.; Peng, R. Water Quality Evaluation of Wenyu River Based on Single Factor Evaluation and Comprehensive Pollution Index Method. Nat. Environ. Poll Technol. 2021, 20, 40–52. [Google Scholar]
  25. Zhou, L.; Liu, M.; Li, J. Research on the evaluation of acoustic environment quality by the comprehensive pollution index method: Taking Nan’an District of Chongqing as an example. Southwest China Norm. Univ. Nat. Sci. Ed. 2015, 40, 144–150. [Google Scholar]
  26. Wen, M.; Ju, L.; Yi, B. Comprehensive assessment of sedimentary environmental quality in Shuangtaizi Estuary. Period. Ocean Univ. China 2011, 41, 391–397. [Google Scholar]
  27. Yang, H. Evaluation of ambient air quality in Datong City and suggestions for improvement. Environ. Sustain. Dev. 2018, 43, 42–44. [Google Scholar]
  28. Yuan, Z.; Zhou, X.; Huang, H. Characteristic analysis and risk assessment of suitable habitat environment index in Juandanbai, Hunan. J. Hunan Univ. Chin. Med. 2018, 38, 750–754. [Google Scholar]
  29. Jiang, W.; Liang, X.; Xiao, C. Analysis and Evaluation of Shallow Groundwater Quality in Qing’an County by Improved Comprehensive Pollution Index Method. Water Saving Irrig. 2013, 09, 47–53. [Google Scholar]
  30. Du, S.; Guan, Y.; Li, X. Water quality evaluation based on improved comprehensive pollution index based on entropy weight method: Taking Baiyun Lake as an example. Acta Sci. Circumstantiae 2022, 42, 205–212. [Google Scholar]
  31. Wang, Q.; Li, F.; Fan, Z. Assessment of the physical habitat of Dahuofang Reservoir inflow rivers and its impact on water quality. Acta Sci. Circumstantiae 2015, 35, 2850–2859. [Google Scholar]
  32. Wang, Q.; Li, F.; Fan, Z. Spatial characteristics of water quality in Dahuofang Reservoir and inflowing rivers in Liaoning Province and the relationship between the water quality of the river and reservoir. Sci. Limnol. Sin. 2016, 28, 775–784. [Google Scholar]
  33. Wang, Z. Response of water diversion from Dahuofang Reservoir to changes in soil erosion in the upstream basin. Water Res. Plan. Des. 2018, 10, 15–17. [Google Scholar]
  34. Wang, M.; Duan, L.; Wang, J. Evolution characteristics of water environment in Dahuofang Reservoir from 1996 to 2015. Environ. Sci. Technol. Wuhan China 2021, 44, 100–107. [Google Scholar]
  35. Jia, L. Research on water quality prediction model of Dahuofang Reservoir. Water Res. Power 2016, 34, 15–19. [Google Scholar]
  36. Hao, F.; Yang, D.; Sun, M. The impact of Jiangsu sewage treatment differential pricing policy on surface water quality: A study based on the synthetic control method. Resour. Environ. Yangtze Val. 2020, 29, 459–467. [Google Scholar]
  37. Zhang, P.; Wu, Y.; Pang, S. Changes and influencing factors of COD_(Cr) degradation coefficient in the North Canal of reclaimed water recharge river. Sci. Limnol. Sin. 2019, 31, 99–112. [Google Scholar]
  38. Wang, J.; Zhai, Q.; Guo, Q. Evaluation of water environment carrying capacity in Taihu Lake Basin. China Environ. Sci. Chin. Ed. 2017, 37, 1979–1987. [Google Scholar]
  39. Yang, W.; Lai, Z.; Zeng, Y. Spatial and temporal distribution characteristics of COD_(Mn) in surface waters of the middle and lower reaches of the Pearl River and water environment assessment. China Environ. Sci. Chin. Ed. 2017, 26, 643–648. [Google Scholar]
  40. Zheng, J.; Li, F.; Sun, L. Identification and analysis of main factors of eutrophication in mixed salt water bodies in coastal areas: Taking Qingjing Lake in Tianjin as an example. Acta Sci. Circumstantiae 2016, 36, 785–791. [Google Scholar]
  41. Zhu, G.; Xu, H.; Zhu, M. Changes in the eutrophication status of lakes in the middle and lower reaches of the Yangtze River in the past three decades and its influencing factors. Sci. Limnol. Sin. 2019, 31, 1510–1524. [Google Scholar]
  42. Liu, L.; Yu, Y.; Zhang, Y. Optimization of comprehensive evaluation indicators for water environment quality in Dianchi Lake. Environ. Monit. China 2016, 32, 7–12. [Google Scholar]
  43. Pan, T.; Qi, J.; Wu, Q. Release patterns of nitrogen and phosphorus pollutants in river sediments in the North Canal Basin. Environ. Monit. China 2019, 35, 51–58. [Google Scholar]
  44. Zhang, Y.; Lin, J.; Wang, H. Research on environmental quality standards of surface water in China. Res. Environ. Sci. 2020, 33, 2523–2538. [Google Scholar]
  45. National Standards of the People’s Republic of China, Environmental Quality Standards for Surface Water; State Environmental Protection Administration: Beijing, China, 2002.
  46. Zhang, S.; Lin, L.; Wang, Z. Temporal and spatial variation characteristics of water quality in the middle and lower reaches of the Han River during wet and dry periods. J. Yangtze River Sci. Res. 2021, 38, 47–53. [Google Scholar]
  47. Chen, Z.; Fan, H. Levene test for homogeneity of variances. Chin. J. Health Stat. 2005, 6, 408–420. [Google Scholar]
  48. Cui, R.; Tong, D. Aviation AC series arc fault detection based on Levene test. Transact. Chin. Electron. Soc. 2021, 36, 3034–3042. [Google Scholar]
  49. Chen, C.; Wang, S.; Yu, Y.; Dong, M.; Li, Y. Temporal trends and source apportionment of water pollution in Honghu Lake, China. Environ. Sci. Pollut. Res. 2021, 28, 60130–60144. [Google Scholar] [CrossRef]
  50. Li, Y.; Liu, J.; Qin, G. Water quality evolution characteristics and pollution source analysis in the Huntai Basin. China Rural. Water Hydrop. 2021, 8, 14–17. [Google Scholar]
  51. Raridah, F.M.; Tahir, W.; Yahaya, N.K.E.M. Studies on the current state of water quality in the Segamat River. In Proceedings of the 4th International Conference on Civil and Environmental Engineering for Sustainability (IConCEES), Selangor, Malaysia, 4–5 December 2017. [Google Scholar]
  52. Choi, H.; Cho, Y.C.; Kim, S.H.; Yu, S.J.; Kim, Y.S.; Im, J.K. Water Quality Assessment and Potential Source Contribution Using Multivariate Statistical Techniques in Jinwi River Watershed, South Korea. Water 2021, 13, 2976. [Google Scholar] [CrossRef]
  53. Yang, J. Dynamic identification and analysis of the evolution trend of total elements of water quality in two typical reservoirs in Liaoning Province. Water Res. Plan. Des. 2019, 6, 38–41. [Google Scholar]
  54. Pang, Y.; Xiang, S.; Chu, Z.l. Research on the relationship between agricultural land and water quality of rivers in the Erhai Lake Basin. Environ. Sci. Beijing China 2015, 36, 4005–4012. [Google Scholar]
  55. Woldeab, B.; Ambelu, A.; Mereta, T.S.; Beyene, A. Effect of watershed land use on tributaries’ water quality in the east African Highland. Environ. Monit. Assess. 2018, 191, 36. [Google Scholar] [CrossRef] [PubMed]
Figure 1. Location map of Dahuofang Reservoir and the upstream watershed.
Water 14 01398 g001
Figure 2. Frequency distribution map of water quality indicators. (Yellow columns represent the frequency of occurrence of concentrations and the red lines are the concentration frequency distribution curves).
Water 14 01398 g002
Figure 3. Water quality evaluation results for each indicator of the Beizamu section from 2003 to 2021. (a) low water period (May), (b) high water period (September).
Water 14 01398 g003
Figure 4. Exceeding multiples of each index of the Beizamu section from 2003 to 2021. (a) low water period (May), (b) high water period (September).
Water 14 01398 g004
Figure 5. Relationship between rainfall and excessive multiples of TP in the Beizamu section. (Note: the rainfall data were from 1 January 2003 to 9 November 2021).
Water 14 01398 g005
Figure 6. Water quality evaluation results for each indicator of the Gulou section from 2003 to 2021. (a) low water period (May), (b) high water period (September).
Water 14 01398 g006
Figure 7. Water quality evaluation results for each indicator of the Taigou section from 2003 to 2021. (a) low water period (May), (b) high water period (September).
Water 14 01398 g007
Figure 8. Comprehensive pollution index of the Beizamu section from 2003 to 2021. (a) low water period (May), (b) high water period (September).
Water 14 01398 g008
Figure 9. Comprehensive pollution index of the Gulou section from 2003 to 2021. (a) low water period (May), (b) high water period (September).
Water 14 01398 g009
Figure 10. Comprehensive pollution index of the Taigou section from 2003 to 2021. (a) low water period (May), (b) high water period (September).
Water 14 01398 g010
Table 1. Surface water classification standards of China (GB3838-2002).
IndicatorsClassification
IIIIIIIVV
CODMn (mg L−1)2461015
DO (mg L−1)334610
COD (mg L−1)1515203040
Ammonia Nitrogen (mg L−1)0.150.51.01.52.0
TN (mg L−1)0.20.51.01.52.0
TP (mg L−1)0.020.10.20.30.4
Table 2. Comprehensive pollution index classification standards.
Range of PLevelWater Quality
P ≤ 0.2betterbasically qualified
0.21 ≤ P < 0.40good
0.41 ≤ P < 0.71light pollution
0.71 ≤ P ≤ 1.0moderate pollution
1.0 ≤ P ≤ 2.0heavy pollutionpolluted
P > 2.0serious pollutionheavily polluted
Table 3. Statistical description of the Beizamu section.
IndicatorLow Water PeriodHigh Water PeriodP
MaxMinMeanSDMaxMinMeanSD
DO/(mg L−1)10.74.69.1051.30711.368.911.543.560.045
BOD5/(mg L−1)4.10.72.0160.9423.40.31.5320.8610.136
CODMn/(mg L−1)5.601.93.4111.0236.40.93.0911.0860.372
TP/(mg L−1)0.090.0050.0380.0310.150.0050.0450.0370.556
TN/(mg L−1)0.500.020.1530.154.961.612.7280.7840.199
NH3-H/(mg L−1)3.702.042.8540.4430.390.010.1220.1030.598
Table 4. Statistical description of the Gulou section.
IndicatorLow Water PeriodHigh Water PeriodP
MaxMinMeanSDMaxMinMeanSD
DO/(mg L−1)11.706.709.7121.11912.507.108.9331.3470.007
BOD5/(mg L−1)3.400.601.5980.6422.500.401.3880.5530.372
CODMn/(mg L−1)3.801.602.6420.6094.301.402.5710.7520.704
TP/(mg L−1)0.090.050.0260.0250.0760.0050.0270.0210.871
TN/(mg L−1)3.961.652.6090.5864.291.4452.5220.6890.457
NH3-H/(mg L−1)0.300.010.0770.0730.2570.0200.0920.0750.376
Table 5. Statistical description of the Taigou section.
IndicatorLow Water PeriodHigh Water PeriodP
MaxMinMeanSDMaxMinMeanSD
DO/(mg L−1)11.805.909.1991.29810.537.108.7420.9790.125
BOD5/(mg L−1)2.400.401.3270.5513.200.201.1370.6390.188
CODMn/(mg L−1)3.101.302.0720.5663.401.102.2410.6730.438
TP/(mg L−1)0.220.0050.0370.0550.2400.0050.0410.0590.401
TN/(mg L−1)3.9401.4102.7110.6263.291.132.0750.5840.007
NH3-H/(mg L−1)1.200.020.1320.2570.900.020.1740.2200.509
Table 6. The original weights and improved weights of the three river sections.
IndicatorOriginal Weights Improved Weights
BeizamuGulouTaigou
Low Water PeriodHigh Water PeriodLow Water PeriodHigh Water PeriodLow Water PeriodHigh Water Period
NH3-H0.1670.3410.2850.3270.3020.4310.320
TP0.1670.2880.2780.3350.2850.3340.363
BOD50.1670.1630.1880.1400.1480.0920.142
CODMn0.1670.1040.1180.0800.1080.0610.076
TN0.1670.0540.0960.0780.1010.0510.071
DO0.1670.0500.0350.0400.0560.0310.028
Table 7. The average P values of the three river sections from 2003 to 2021.
SectionOriginal MethodImproved Method
Low Water PeriodHigh Water PeriodLow Water PeriodHigh Water Period
Beizamu (Hun River)1.759
(polluted)
1.708
(polluted)
1.119
(polluted)
1.080
(polluted)
Gulou (Suzi River)1.540
(polluted)
1.483
(polluted)
1.002
(polluted)
0.930
(basically qualified)
Taigou (She River)1.507
(polluted)
1.421
(polluted)
0.999
(basically qualified
0.902
(basically qualified)
Publisher’s Note: MDPI stays neutral with regard to jurisdictional claims in published maps and institutional affiliations.

