
Monitoring and Mapping of Soil Salinity on the Exposed Seabed of the Aral Sea, Central Asia

Abstract
:1. Introduction
2. Materials and Methods
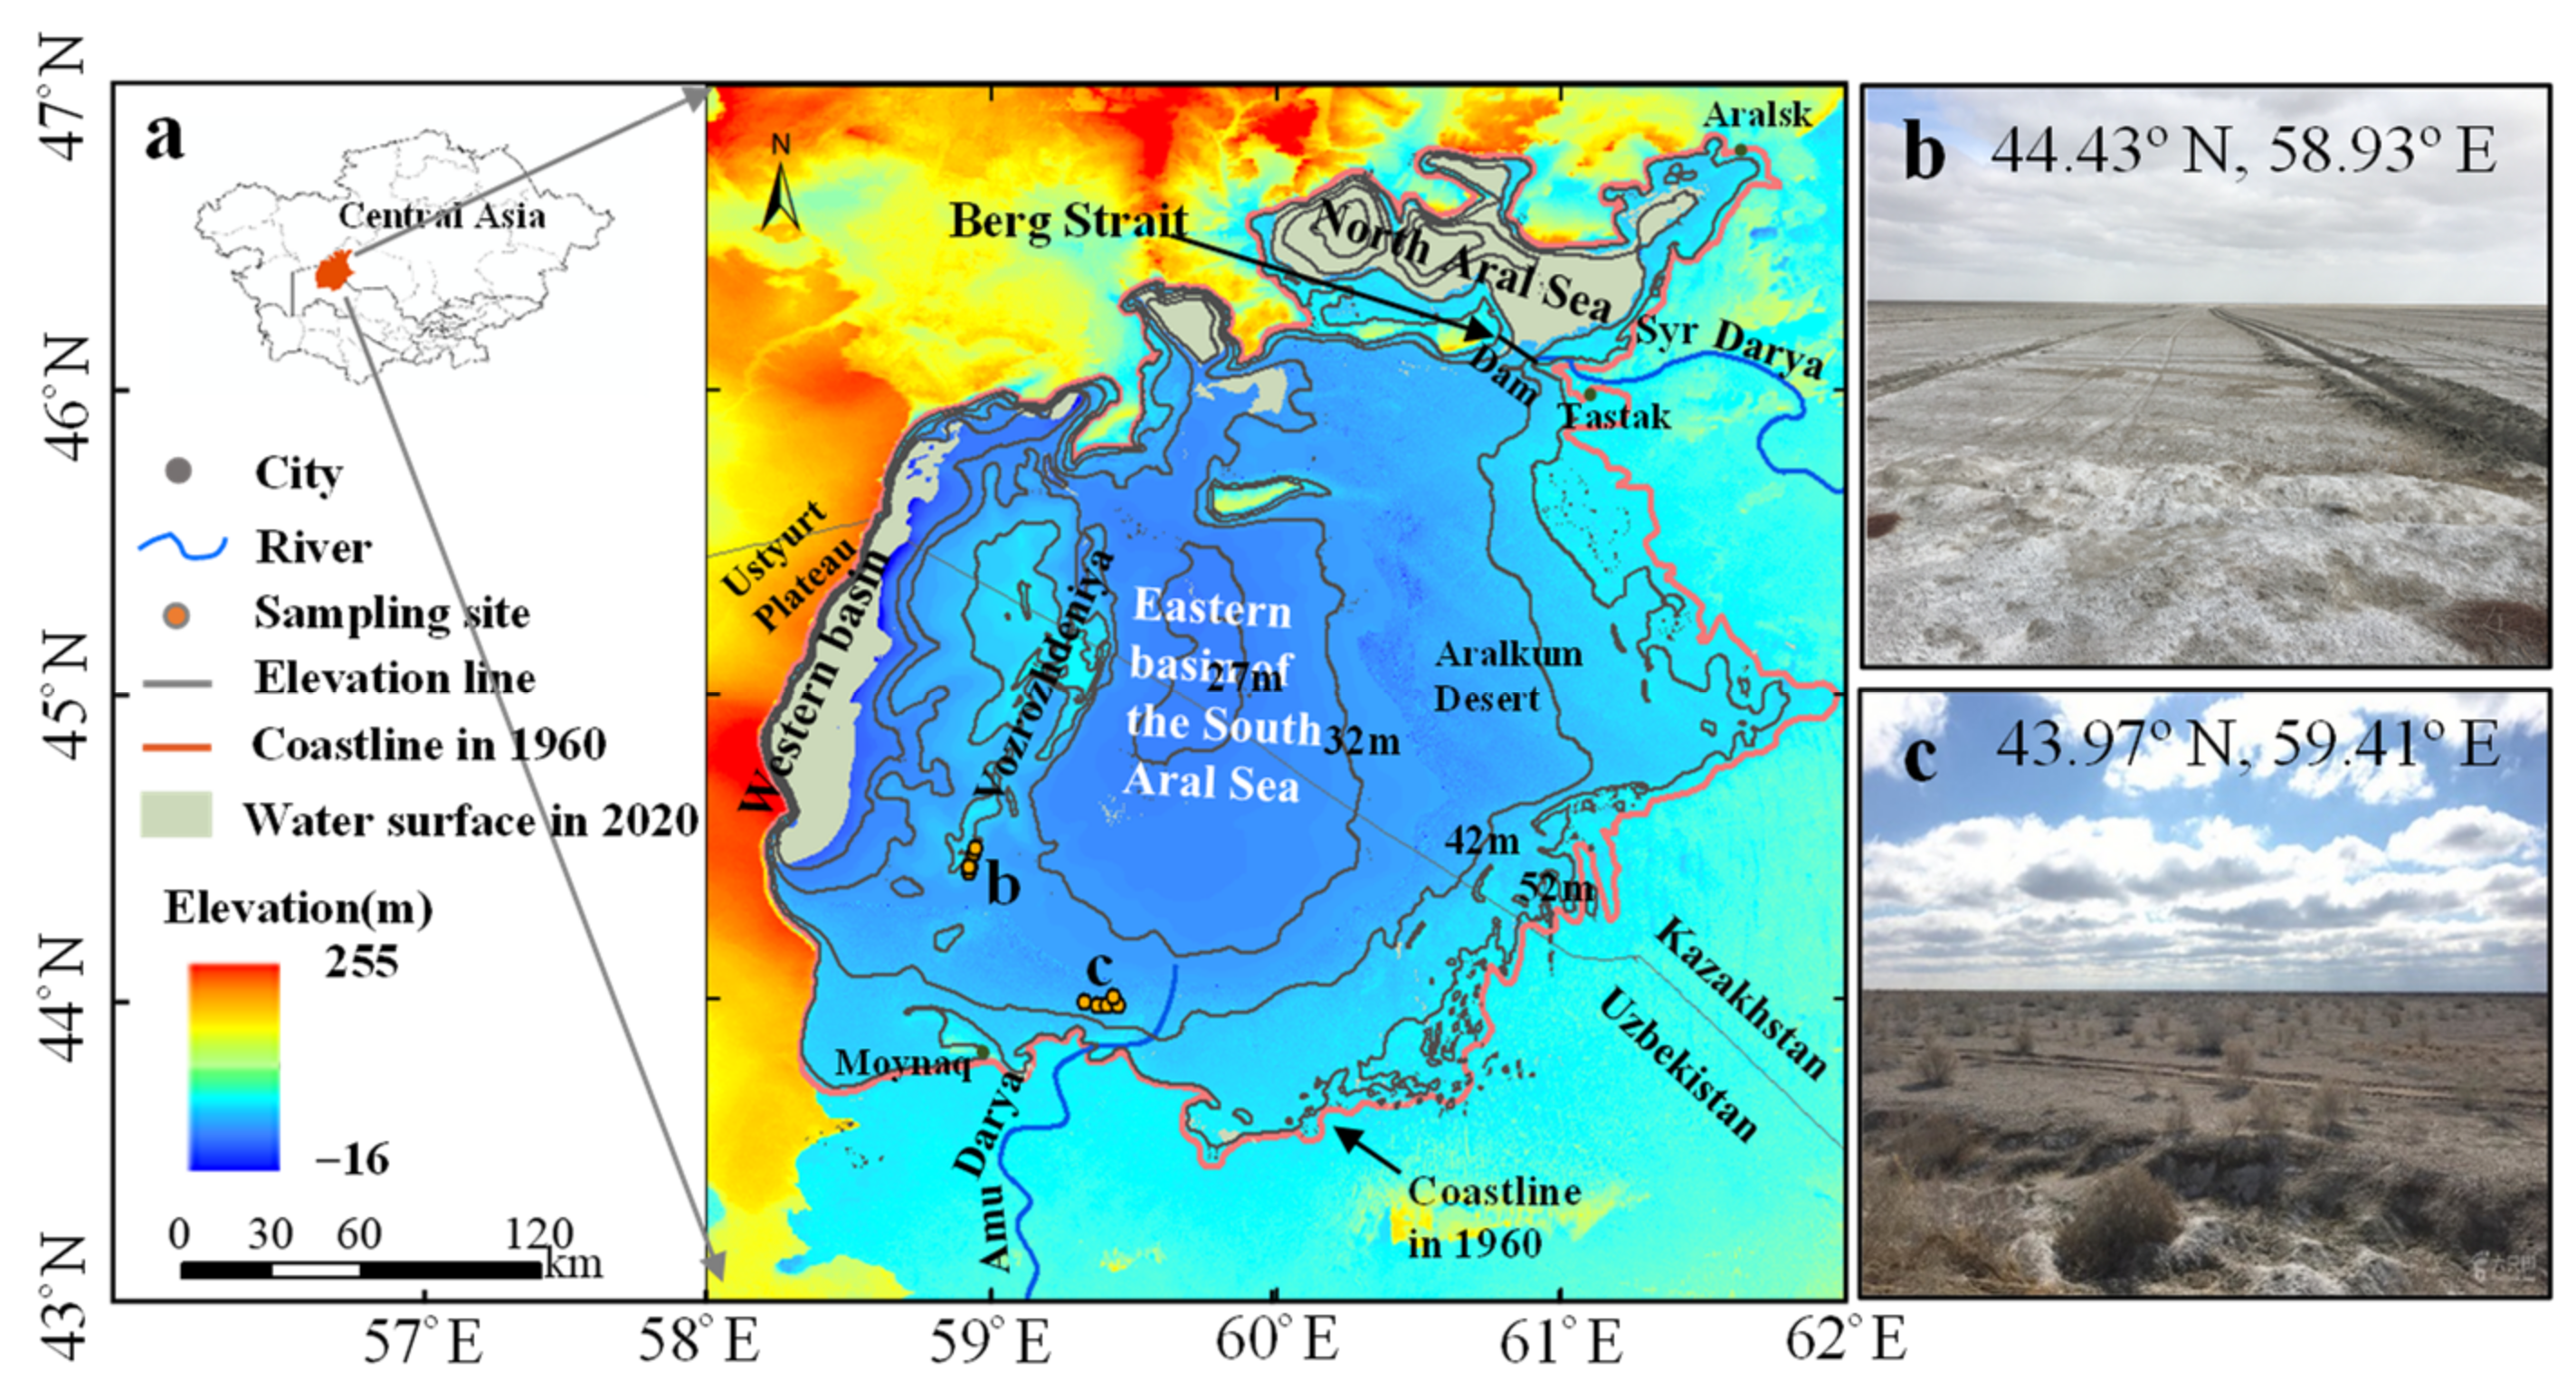
2.1. Study Region
2.2. Soil Sampling and Analysis
2.3. Soil Salinity Indices
2.4. Water Salinity
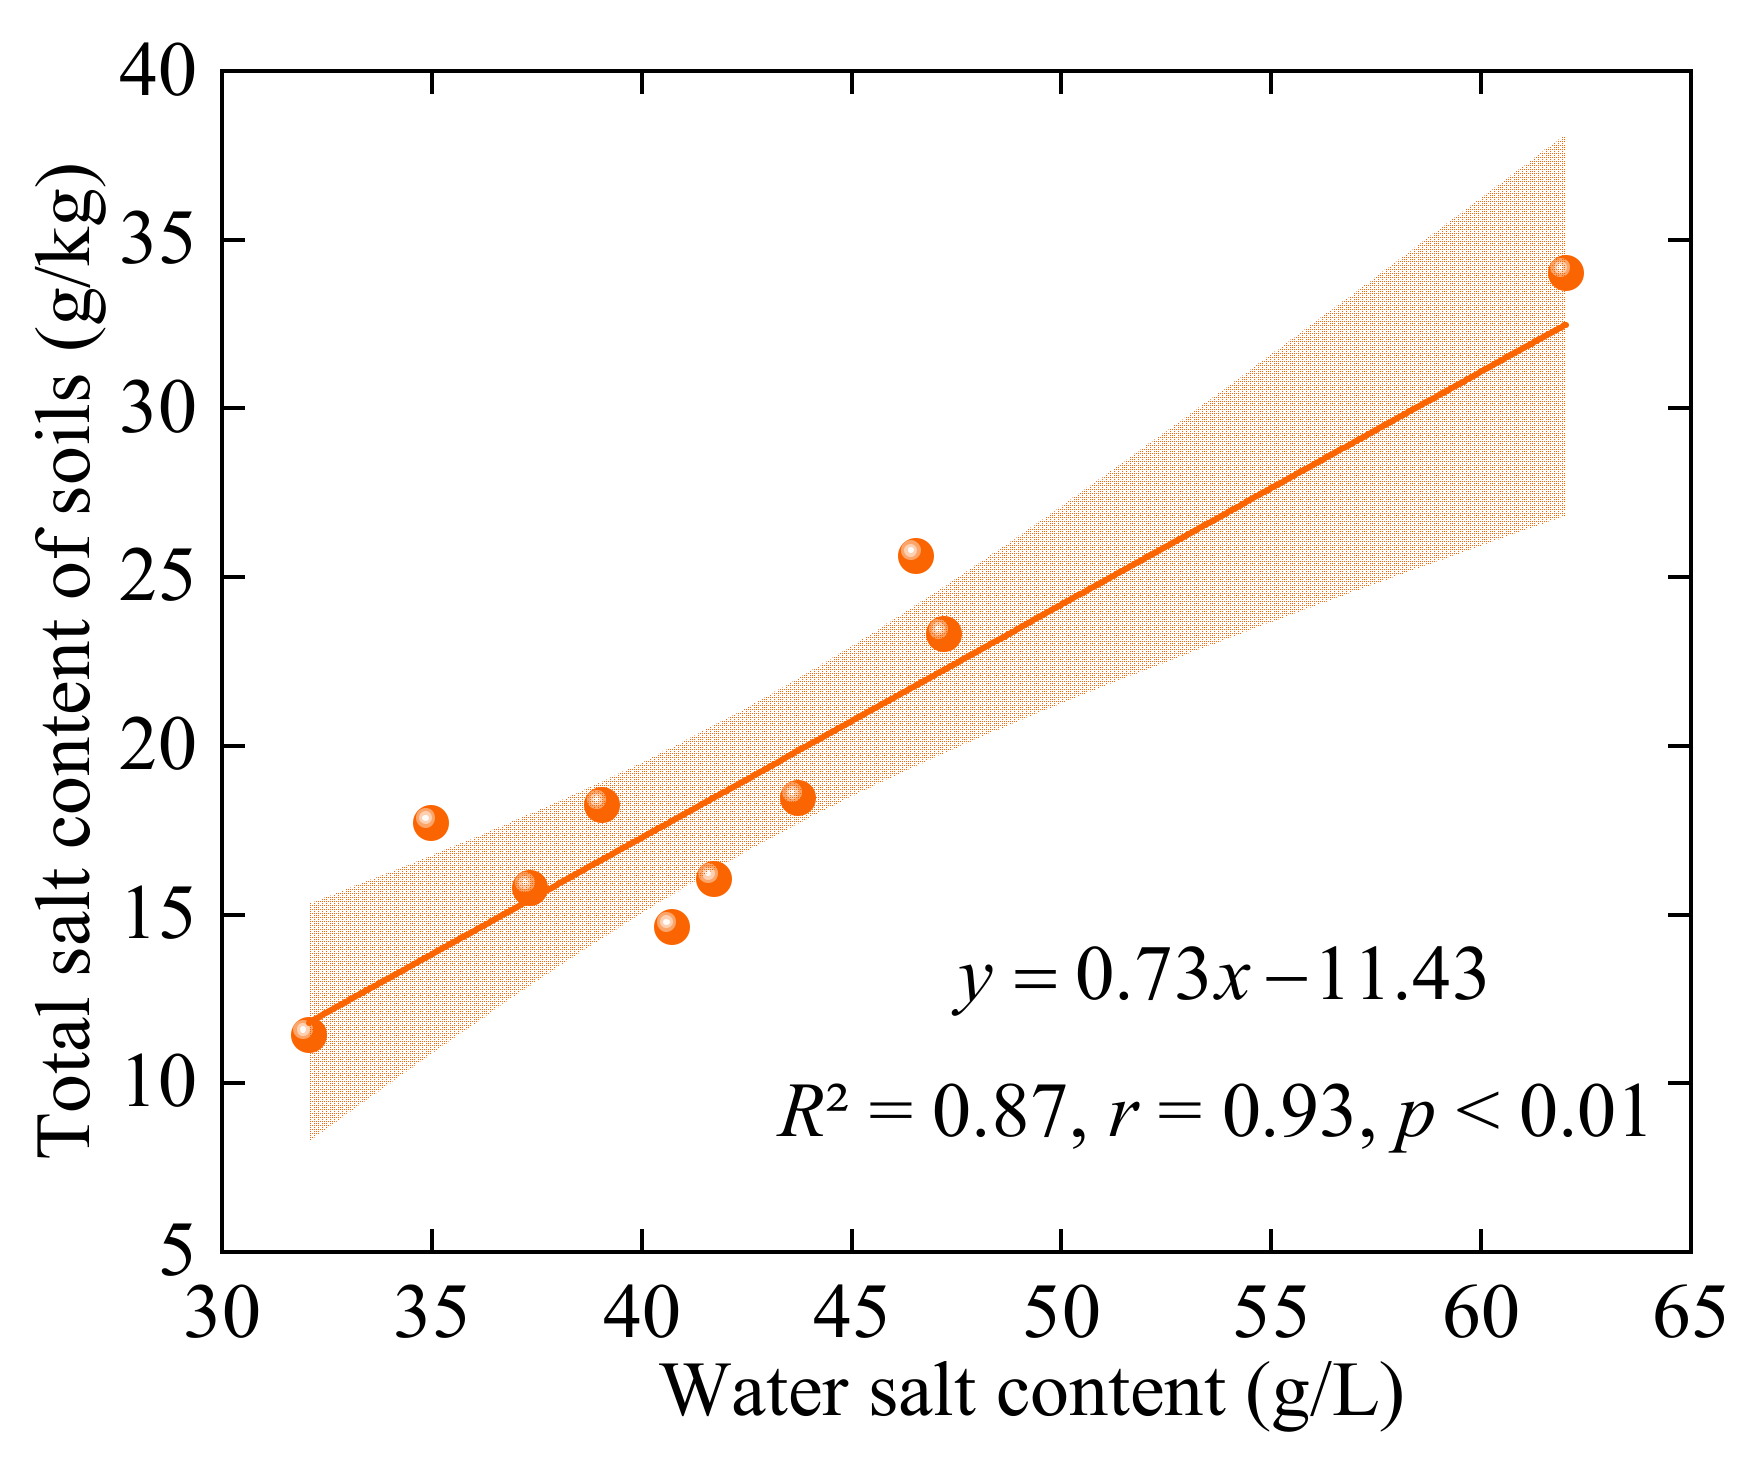
2.5. Correlation Analysis Method
3. Results and Discussion
3.1. Soil Salinity Vertical Distribution
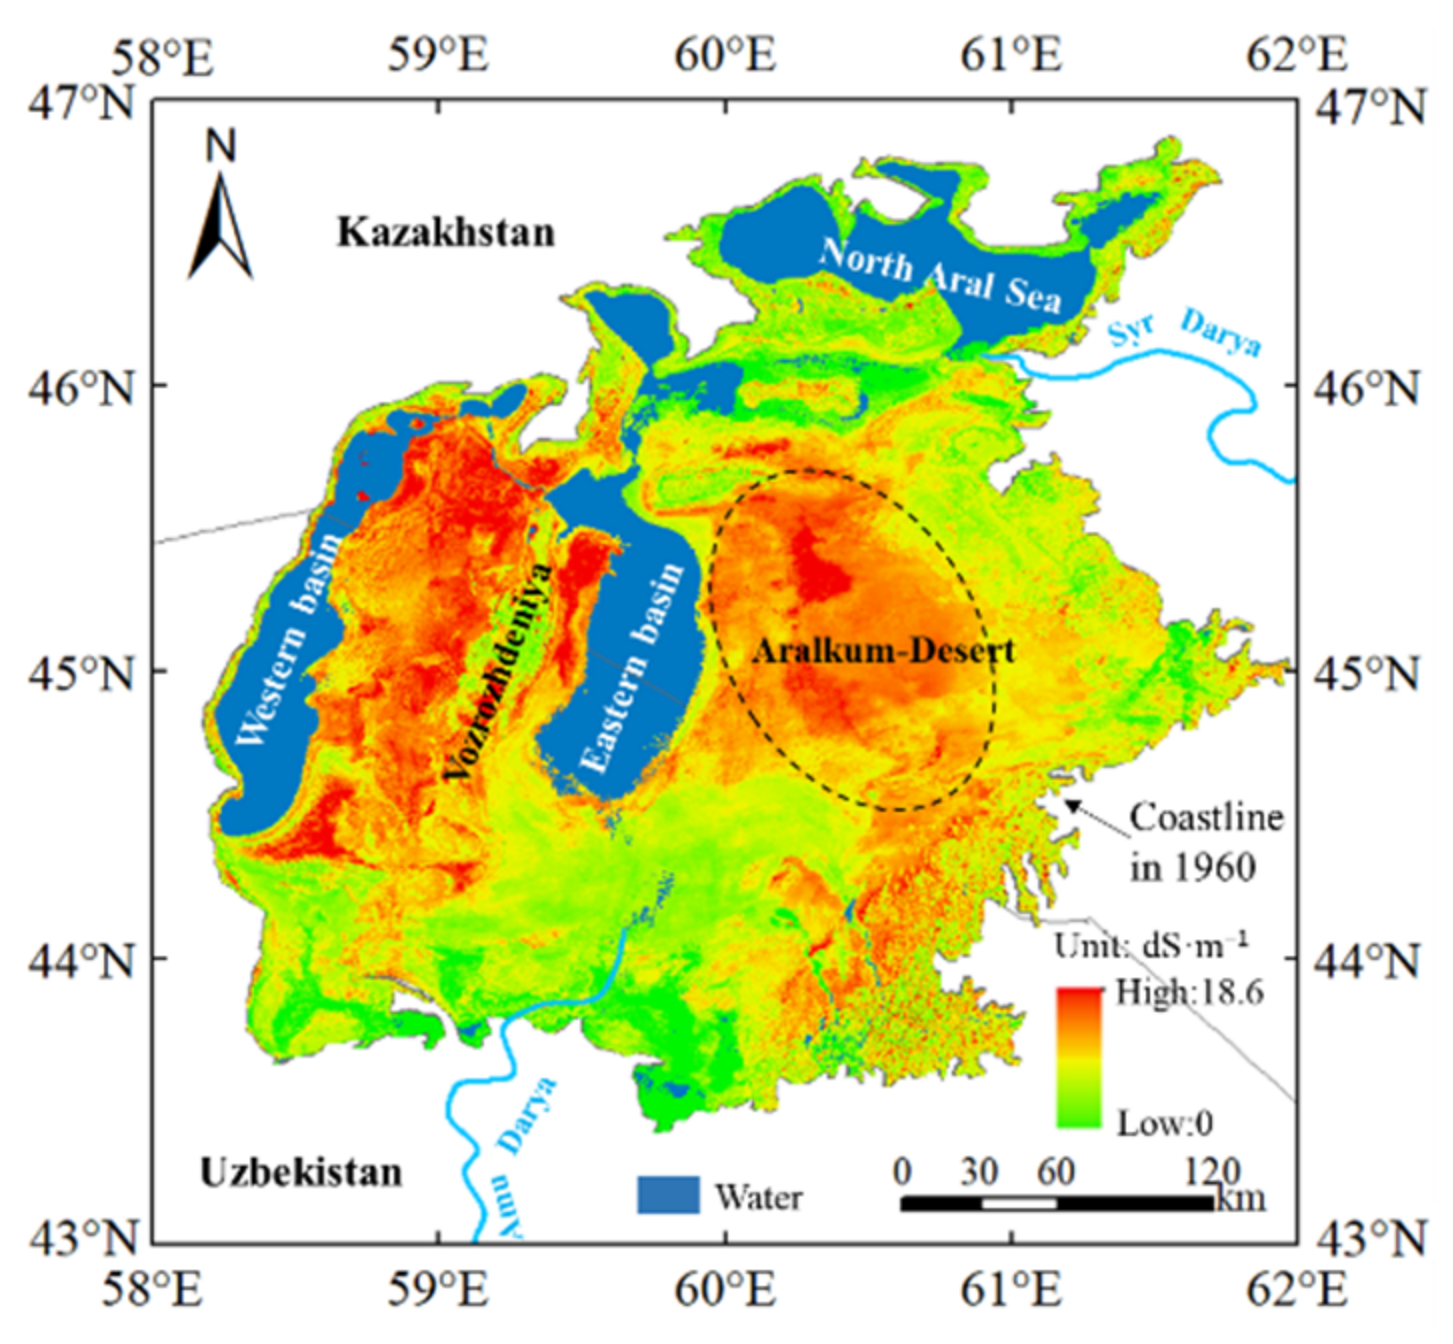
3.2. Distribution of Topsoil Salinity
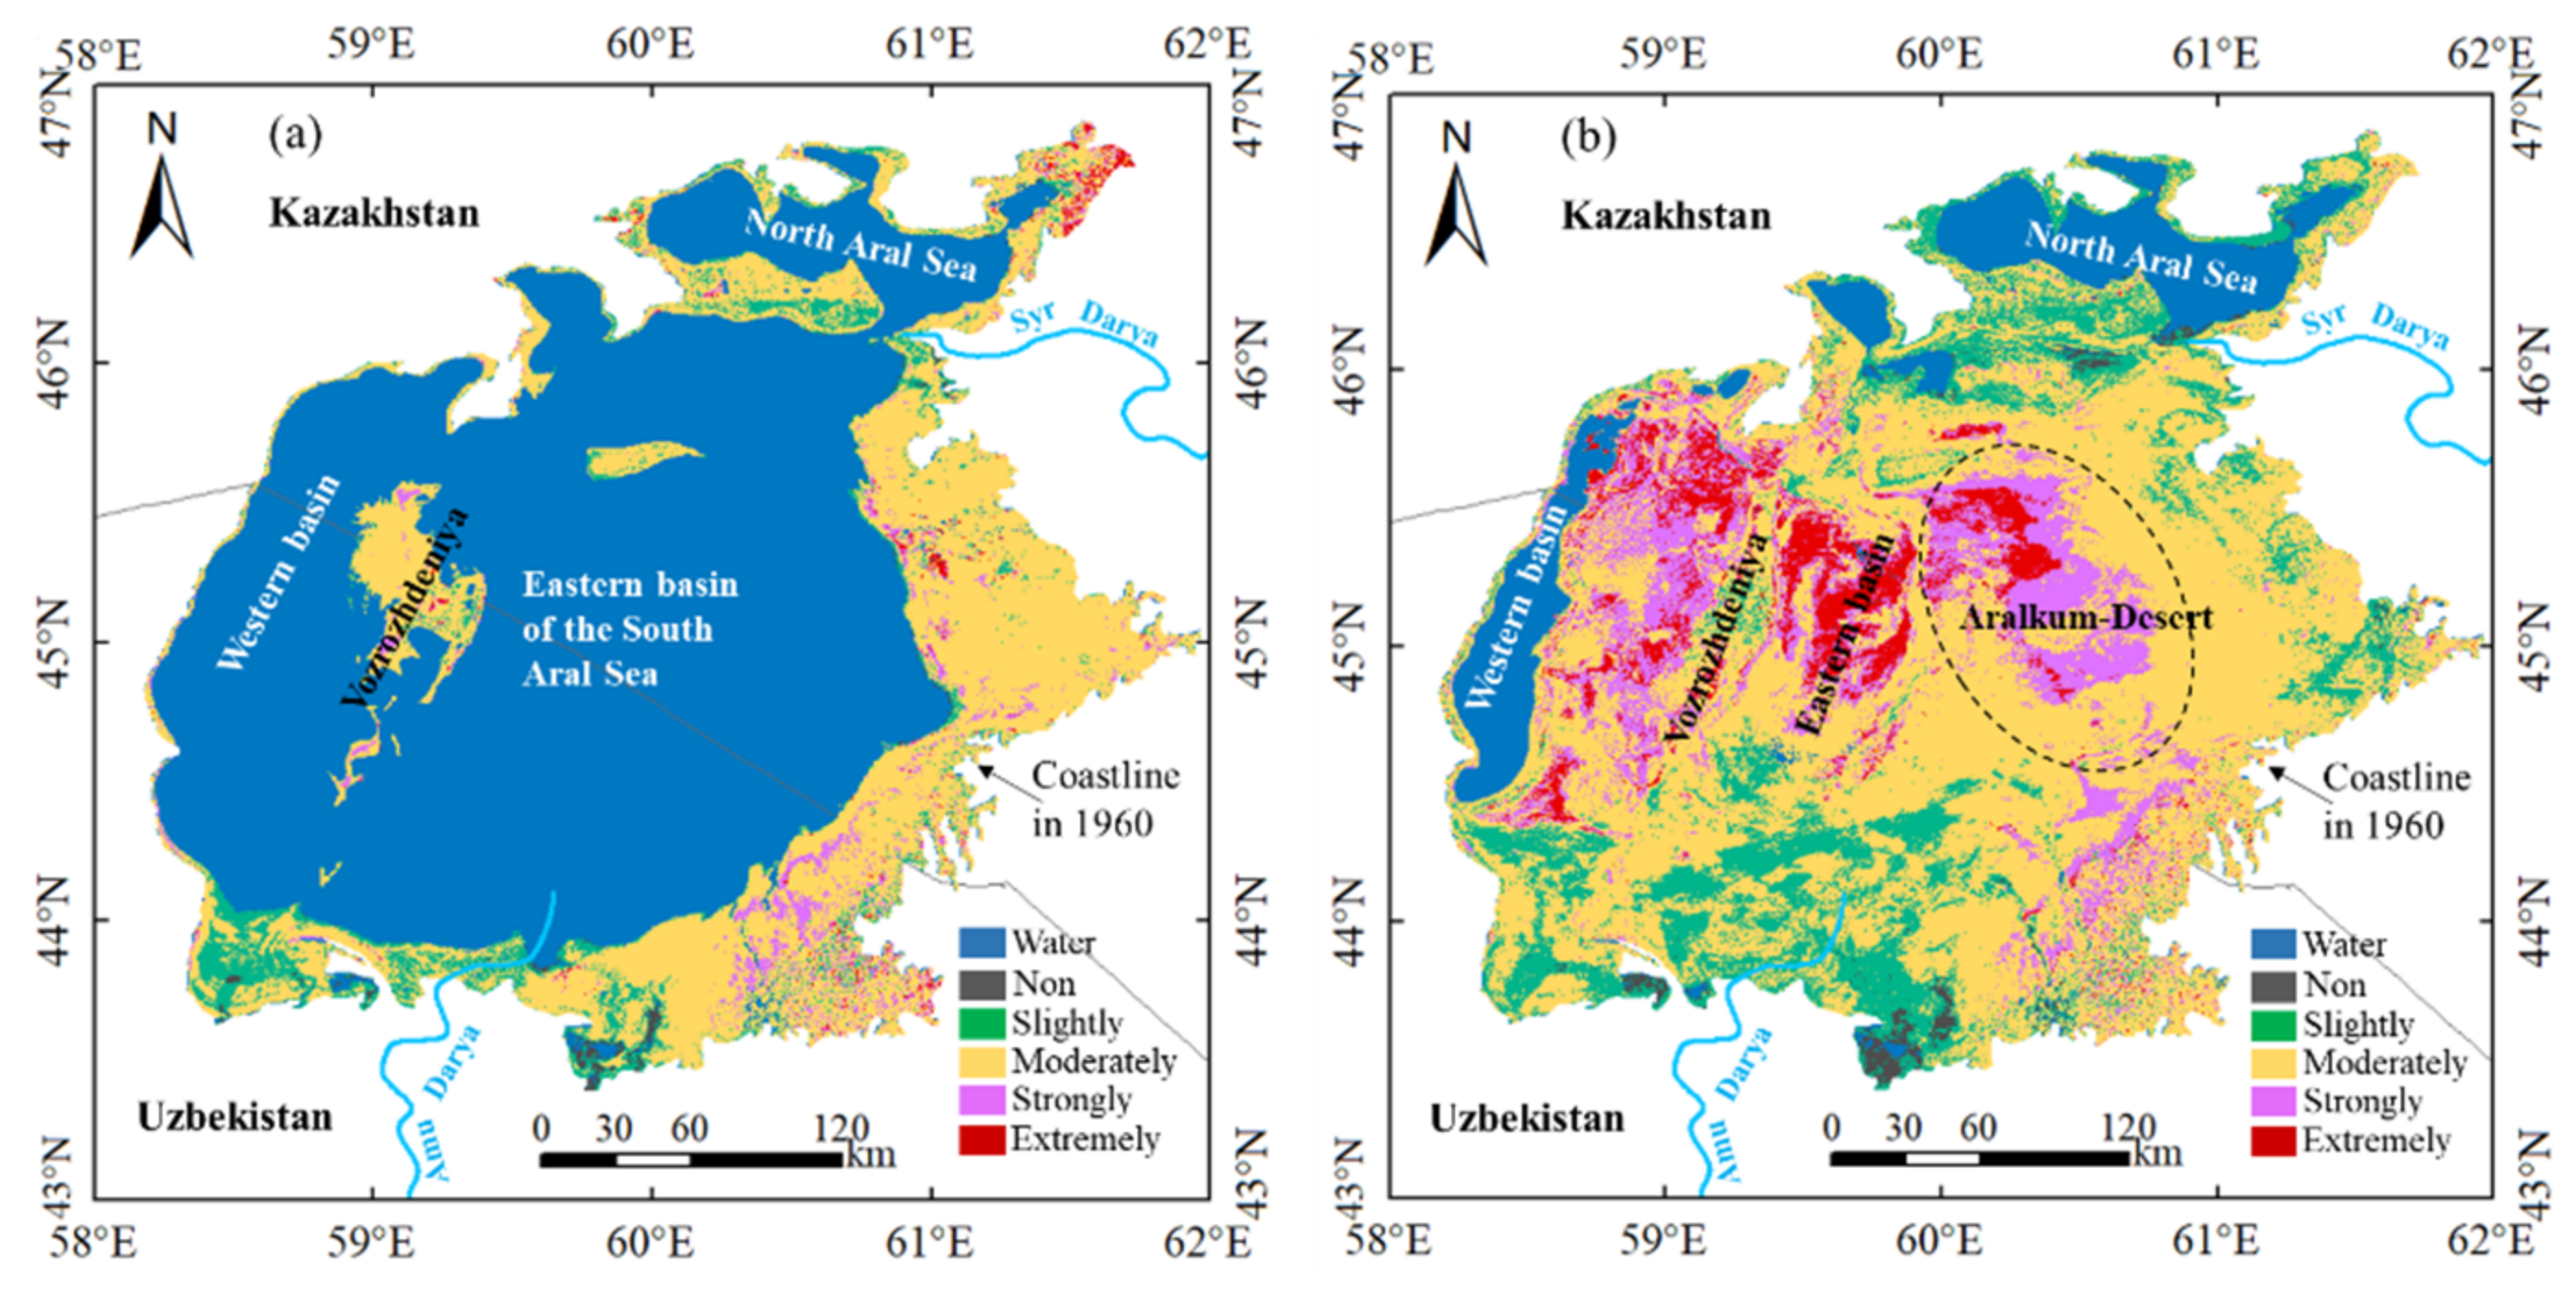
3.3. Changes in Topsoil Salinization Levels
4. Conclusions
Author Contributions
Funding
Institutional Review Board Statement
Informed Consent Statement
Data Availability Statement
Acknowledgments
Conflicts of Interest
References
- Hassani, A.; Azapagic, A.; Shokri, N. Global Predictions of Primary Soil Salinization Under Changing Climate in the 21st Century. Nat. Commun. 2021, 12, 6633. [Google Scholar] [CrossRef] [PubMed]
- Wu, W.; Mhaimeed, A.S.; Al-Shafie, W.M.; Ziadat, F.; Dhehibi, B.; Nangia, V.; De Pauw, E. Mapping Soil Salinity Changes Using Remote Sensing in Central Iraq. Geoderma Reg. 2014, 2–3, 21–31. [Google Scholar] [CrossRef]
- Ivushkin, K.; Bartholomeus, H.; Bregt, A.K.; Pulatov, A.; Kempen, B.; De Sousa, L. Global Mapping of Soil Salinity Change. Remote Sens. Environ. 2019, 231, 111260. [Google Scholar] [CrossRef]
- Food and Agriculture Organization of the United Nations. Global Map of Salt-Affected Soils. 2021. Available online: https://www.fao.org/global-soil-partnership/gsasmap/en (accessed on 10 December 2021).
- Ma, L.; Yang, S.; Simayi, Z.; Gu, Q.; Li, J.; Yang, X.; Ding, J. Modeling Variations in Soil Salinity in the Oasis of Junggar Basin, China. Land Degrad. Dev. 2018, 29, 551–562. [Google Scholar] [CrossRef]
- Shrivastava, P.; Kumar, R. Soil Salinity: A Serious Environmental Issue and Plant Growth Promoting Bacteria as One of the Tools for Its Alleviation. Saudi J. Biol. Sci. 2015, 22, 123–131. [Google Scholar] [CrossRef] [Green Version]
- Wang, J.; Ding, J.; Yu, D.; Ma, X.; Zhang, Z.; Ge, X.; Teng, D.; Li, X.; Liang, J.; Lizaga, I.; et al. Capability of Sentinel-2 MSI Data for Monitoring and Mapping of Soil Salinity in Dry and Wet Seasons in the Ebinur Lake Region, Xinjiang, China. Geoderma 2019, 353, 172–187. [Google Scholar] [CrossRef]
- Taghadosi, M.M.; Hasanlou, M.; Eftekhari, K. Soil Salinity Mapping Using Dual-Polarized SAR Sentinel-1 Imagery. Int. J. Remote Sens. 2019, 40, 237–252. [Google Scholar] [CrossRef]
- Rao, B.R.M.; Sharma, R.C.; Ravi Sankar, T.; Das, S.N.; Dwivedi, R.S.; Thammappa, S.S.; Venkataratnam, L. Spectral Behaviour of Salt-Affected Soils. Int. J. Remote Sens. 1995, 16, 2125–2136. [Google Scholar] [CrossRef]
- Farifteh, J.; Van der Meer, F.; Atzberger, C.; Carranza, E.J.M. Quantitative Analysis of Salt affected Soil Reflectance Spectra: A Comparison of Two Adaptive Methods (PLSR and ANN). Remote Sens. Environ. 2007, 110, 59–78. [Google Scholar] [CrossRef]
- Elnaggar, A.A.; Noller, J.S. Application of Remote-Sensing Data and Decision-Tree Analysis to Mapping Salt-Affected Soils Over Large Areas. Remote Sens. 2010, 2, 151–165. [Google Scholar] [CrossRef] [Green Version]
- Fan, X.; Liu, Y.; Tao, J.; Weng, Y. Soil Salinity Retrieval from Advanced Multi-Spectral Sensor with Partial Least Square Regression. Remote Sens. 2015, 7, 488–511. [Google Scholar] [CrossRef] [Green Version]
- Scudiero, E.; Skaggs, T.H.; Corwin, D.L. Regional-Scale Soil Salinity Assessment Using Landsat ETM+ Canopy Reflectance. Remote Sens. Environ. 2015, 169, 335–343. [Google Scholar] [CrossRef] [Green Version]
- Wang, J.; Peng, J.; Li, H.; Yin, C.; Liu, W.; Wang, T.; Zhang, H. Soil Salinity Mapping Using Machine Learning Algorithms with the Sentinel-2 MSI in Arid Areas, China. Remote Sens. 2021, 13, 305. [Google Scholar] [CrossRef]
- Al-Ali, Z.M.; Bannari, A.; Rhinane, H.; El-Battay, A.; Shahid, S.A.; Hameid, N. Validation and Comparison of Physical Models for Soil Salinity Mapping Over an Arid Landscape Using Spectral Reflectance Measurements and Landsat-OLI Data. Remote Sens. 2021, 13, 494. [Google Scholar] [CrossRef]
- Gorji, T.; Sertel, E.; Tanik, A. Monitoring Soil Salinity via Remote Sensing Technology Under Data Scarce Conditions: A Case Study from Turkey. Ecol. Indic. 2017, 74, 384–391. [Google Scholar] [CrossRef]
- Wang, X.; Zhang, F.; Ding, J.; Kung, H.T.; Latif, A.; Johnson, V.C. Estimation of Soil Salt Content (SSC) in the Ebinur Lake Wetland National Nature Reserve (ELWNNR), Northwest China, Based on a Bootstrap-BP Neural Network Model and Optimal Spectral Indices. Sci. Total Environ. 2018, 615, 918–930. [Google Scholar] [CrossRef]
- Zhang, T.T.; Qi, J.G.; Gao, Y.; Ouyang, Z.T.; Zeng, S.L.; Zhao, B. Detecting Soil Salinity with MODIS Time Series VI Data. Ecol. Indic. 2015, 52, 480–489. [Google Scholar] [CrossRef]
- Ge, Y.; Abuduwaili, J.; Ma, L.; Liu, D. Temporal Variability and Potential Diffusion Characteristics of Dust Aerosol Originating from the Aral Sea Basin, Central Asia. Water Air Soil Pollut. 2016, 227, 1–12. [Google Scholar] [CrossRef]
- Semenov, O.E. Dust Storms and Sandstorms and Aerosol Long-Distance Transport. In Aralkum-A Man-Made Desert; Breckle, S.W., Wucherer, W., Dimeyeva, L., Ogar, N., Eds.; Springer: Berlin/Heidelberg, Germany, 2012; Volume 218, pp. 73–82. [Google Scholar]
- Zucca, C.; Middleton, N.; Kang, U.; Liniger, H. Shrinking Water Bodies as Hotspots of Sand and Dust Storms: The Role of Land Degradation and Sustainable Soil and Water Management. Catena. 2021, 207, 105669. [Google Scholar] [CrossRef]
- Indoitu, R.; Kozhoridze, G.; Batyrbaeva, M.; Vitkovskaya, I.; Orlovsky, N.; Blumberg, D.; Orlovsky, L. Dust Emission and Environmental Changes in the Dried Bottom of the Aral Sea. Aeolian Res. 2015, 17, 101–115. [Google Scholar] [CrossRef]
- Karami, S.; Hossein Hamzeh, N.H.; Kaskaoutis, D.G.; Rashki, A.; Alam, K.; Ranjbar, A. Numerical Simulations of Dust Storms Originated from Dried Lakes in Central and Southwest Asia: The Case of Aral Sea and Sistan Basin. Aeolian Res. 2021, 50, 100679. [Google Scholar] [CrossRef]
- Kunii, O.; Hashizume, M.; Chiba, M.; Sasaki, S.; Shimoda, T.; Caypil, W.; Dauletbaev, D. Respiratory Symptoms and Pulmonary Function Among School-Age Children in the Aral Sea Region. Arch. Environ. Health. 2003, 58, 676–682. [Google Scholar] [CrossRef] [PubMed]
- Micklin, P. The Future Aral Sea: Hope and Despair. Environ. Earth Sci. 2016, 75, 844. [Google Scholar] [CrossRef]
- Wæhler, T.A.; Dietrichs, E.S. The Vanishing Aral Sea: Health Consequences of an Environmental Disaster. Tidsskriftet 2017, 137. [Google Scholar] [CrossRef] [PubMed] [Green Version]
- Wicke, B.; Smeets, E.; Dornburg, V.; Vashev, B.; Gaiser, T.; Turkenburg, W.; Faaij, A. The Global Technical and Economic Potential of Bioenergy from Salt-Affected Soils. Energy Environ. Sci. 2011, 4, 2669–2681. [Google Scholar] [CrossRef] [Green Version]
- Hassani, A.; Azapagic, A.; Shokri, N. Predicting Long-Term Dynamics of Soil Salinity and Sodicity on a Global Scale. Proc. Natl Acad. Sci. USA 2020, 117, 33017–33027. [Google Scholar] [CrossRef]
- Li, J.; Pu, L.; Zhu, M.; Zhang, J.; Li, P.; Dai, X.; Xu, Y.; Liu, L.; Liu, L. Evolution of Soil Properties Following Reclamation in Coastal Areas: A Review. Geoderma 2014, 226–227, 130–139. [Google Scholar] [CrossRef]
- An, J.; Chang, H.; Han, S.H.; Khamzina, A.; Son, Y. Changes in Basic Soil Properties and Enzyme Activities Along an Afforestation Series on the Dry Aral Sea Bed, Kazakhstan. For. Sci. Technol. 2020, 16, 26–31. [Google Scholar] [CrossRef] [Green Version]
- Kim, J.; Song, C.; Lee, S.; Jo, H.W.; Park, E.; Yu, H.; Cha, S.; An, J.; Son, Y.; Khamzina, A.; et al. Identifying Potential Vegetation Establishment Areas on the Dried Aral Sea Floor Using Satellite Images. Land Degrad. Dev. 2020, 31, 2749–2762. [Google Scholar] [CrossRef]
- Shen, H.; Abuduwaili, J.; Ma, L.; Samat, A. Remote Sensing-Based Land Surface Change Identification and Prediction in the Aral Sea Bed, Central Asia. Int. J. Environ. Sci. Technol. 2019, 16, 2031–2046. [Google Scholar] [CrossRef]
- Wang, X.; Chen, Y.; Li, Z.; Fang, G.; Wang, F.; Liu, H. The Impact of Climate Change and Human Activities on the Aral Sea Basin Over the Past 50 Years. Atmos. Res. 2020, 245, 105125. [Google Scholar] [CrossRef]
- Kuz’mina, Z.V.; Treshkin, S.E. Formation of vegetation on solonchaks of the dried Aral Sea bed under changing climate conditions. Russ. Agr. Sci. 2009, 35, 37–41. [Google Scholar] [CrossRef]
- Aladin, N.V.; Gontar, V.I.; Zhakova, L.V.; Plotnikov, I.S.; Smurov, A.O.; Rzymski, P.; Klimaszyk, P. The zoocenosis of the Aral Sea: Six decades of fast-paced change. Environ. Sci. Pollut. Res. 2019, 26, 2228–2237. [Google Scholar] [CrossRef] [PubMed] [Green Version]
- Aladin, N.; Plotnikov, I.; Ballatore, T.; Micklin, P. Review of technical interventions to restore the Northern Aral Sea. Small. 2008, 1000, 1000. [Google Scholar]
- Benduhn, F.; Renard, P. A dynamic model of the Aral Sea water and salt balance. J. Mar. Syst. 2004, 47, 35–50. [Google Scholar] [CrossRef]
- Metternicht, G.I.; Zinck, J.A. Remote Sensing of Soil Salinity: Potentials and Constraints. Remote Sens. Environ. 2003, 85, 1–20. [Google Scholar] [CrossRef]
- Mulder, V.L.; De Bruin, S.; Schaepman, M.E.; Mayr, T.R. The Use of Remote Sensing in Soil and Terrain Mapping-A Review. Geoderma. 2011, 162, 1–19. [Google Scholar] [CrossRef]
- Khan, N.M.; Rastoskuev, V.V.; Sato, Y.; Shiozawa, S. Assessment of Hydro Saline Land Degradation by Using a Simple Approach of Remote Sensing Indicators. Agric. Water Manag. 2005, 77, 96–109. [Google Scholar] [CrossRef]
- Douaoui, A.E.K.; Nicolas, H.; Walter, C. Detecting Salinity Hazards Within a Semiarid Context by Means of Combining Soil and Remote-Sensing Data. Geoderma. 2006, 134, 217–230. [Google Scholar] [CrossRef]
- Abbas, A.; Khan, S.; Hussain, N.; Hanjra, M.A.; Akbar, S. Characterizing Soil Salinity in Irrigated Agriculture Using a Remote Sensing Approach. Phys. Chem. Earth. 2013, 55–57, 43–52. [Google Scholar] [CrossRef]
- Farahmand, N.; Sadeghi, V. Estimating Soil Salinity in the Dried Lake Bed of Urmia Lake Using Optical Sentinel-2 Images and Nonlinear Regression Models. J. Indian Soc. Remote Sens. 2020, 48, 675–687. [Google Scholar] [CrossRef]
- Bannari, A.; Guedon, A.M.; El-Harti, A.; Cherkaoui, F.Z.; El-Ghmari, A. Characterization of Slightly and Moderately Saline and Sodic Soils in Irrigated Agricultural Land Using Simulated Data of Advanced Land Imaging (EO-1) Sensor. Soil Sci. Plan. 2008, 39, 2795–2811. [Google Scholar] [CrossRef]
- Keith, D.A.; Rodríguez, J.P.; Rodríguez-Clark, K.M.; Nicholson, E.; Aapala, K.; Alonso, A.; Zambrano-Martínez, S. Scientific foundations for an IUCN Red List of Ecosystems. PLoS ONE 2013, 8, e62111. [Google Scholar]
- Gaybullaev, B.; Chen, S.C.; Gaybullaev, G. The large Aral Sea water balance: A future prospective of the large Aral Sea depending on water volume alteration. Carbonates Evaporites 2014, 29, 211–219. [Google Scholar] [CrossRef]
- Pearson, K. Notes on the history of correlation. Biometrika 1920, 13, 25–45. [Google Scholar] [CrossRef]
- Löw, F.; Navratil, P.; Bubenzer, O. Landscape Dynamics in the Southern Aralkum: Using MODIS Time Series for Land Cover Change Analysis. In Aralkum Man-Made Desert; Springer: Berlin/Heidelberg, Germany, 2012; pp. 83–96. [Google Scholar]
- Asfaw, E.; Suryabhagavan, K.V.; Argaw, M. Soil Salinity Modeling and Mapping Using Remote Sensing and GIS: The Case of Wonji Sugar Cane Irrigation Farm, Ethiopia. J. Saudi Soc. Agric. Sci. 2018, 17, 250–258. [Google Scholar] [CrossRef] [Green Version]
- Chang, C.W.; Laird, D.A.; Mausbach, M.J.; Hurburgh, C.R., Jr. Near-Infrared Reflectance Spectroscopy–Principal Components Regression Analyses of Soil Properties. Soil Sci. Soc. Am. J. 2001, 65, 480–490. [Google Scholar] [CrossRef] [Green Version]
- Gopalakrishnan, T.; Kumar, L. Linking long-term changes in soil salinity to paddy land abandonment in Jaffna Peninsula, Sri Lanka. Agriculture 2021, 11, 211. [Google Scholar] [CrossRef]
- Wang, Z.; Zhang, F.; Zhang, X.; Chan, N.W.; Kung, H.T.; Zhou, X.; Wang, Y. Quantitative evaluation of spatial and temporal variation of soil salinization risk using GIS-based geostatistical method. Remote Sens. 2020, 12, 2405. [Google Scholar] [CrossRef]
- Gorji, T.; Tanik, A.; Sertel, E. Soil Salinity Prediction, Monitoring and Mapping Using Modern Technologies. Procedia Earth Planet. Sci. 2015, 15, 507–512. [Google Scholar] [CrossRef] [Green Version]
- Shirato, Y.; Taniyama, I.; Zhang, T.H. Changes in Soil Properties After Afforestation in Horqin Sandy Land, North China. Soil Sci. Plant Nutr. 2004, 50, 537–543. [Google Scholar] [CrossRef] [Green Version]


| Classification | Non-Saline | Slightly Saline | Moderately Saline | Strongly Saline | Extremely Saline |
|---|---|---|---|---|---|
| EC/dS m−1 | 0–2 | 2–4 | 4–8 | 8–16 | >16 |
| Index Name | Spectral Function | References |
|---|---|---|
| Brightness index (BI) | (Khan et al. [40]) | |
| Salinity index 1 (SI1) | (Khan et al. [40]) | |
| Salinity index 2 (SI2) | (Douaoui et al. [41]) | |
| Salinity index 3 (SI3) | (Abbas et al. [42]) | |
| Salinity index 4 (SI4) | (Kim et al. [31]) | |
| Normalized difference salinity index (NDSI) | (Farahmand and Sadeghi [43]) | |
| Normalized difference vegetation index (NDVI) | (Bannari et al. [44]) |
| BI | SI1 | SI2 | SI3 | SI4 | NDSI | NDVI | |
|---|---|---|---|---|---|---|---|
| EC | −0.44 | −0.20 | −0.46 | −0.26 | 0.92 ** | 0.69 * | −0.69 * |
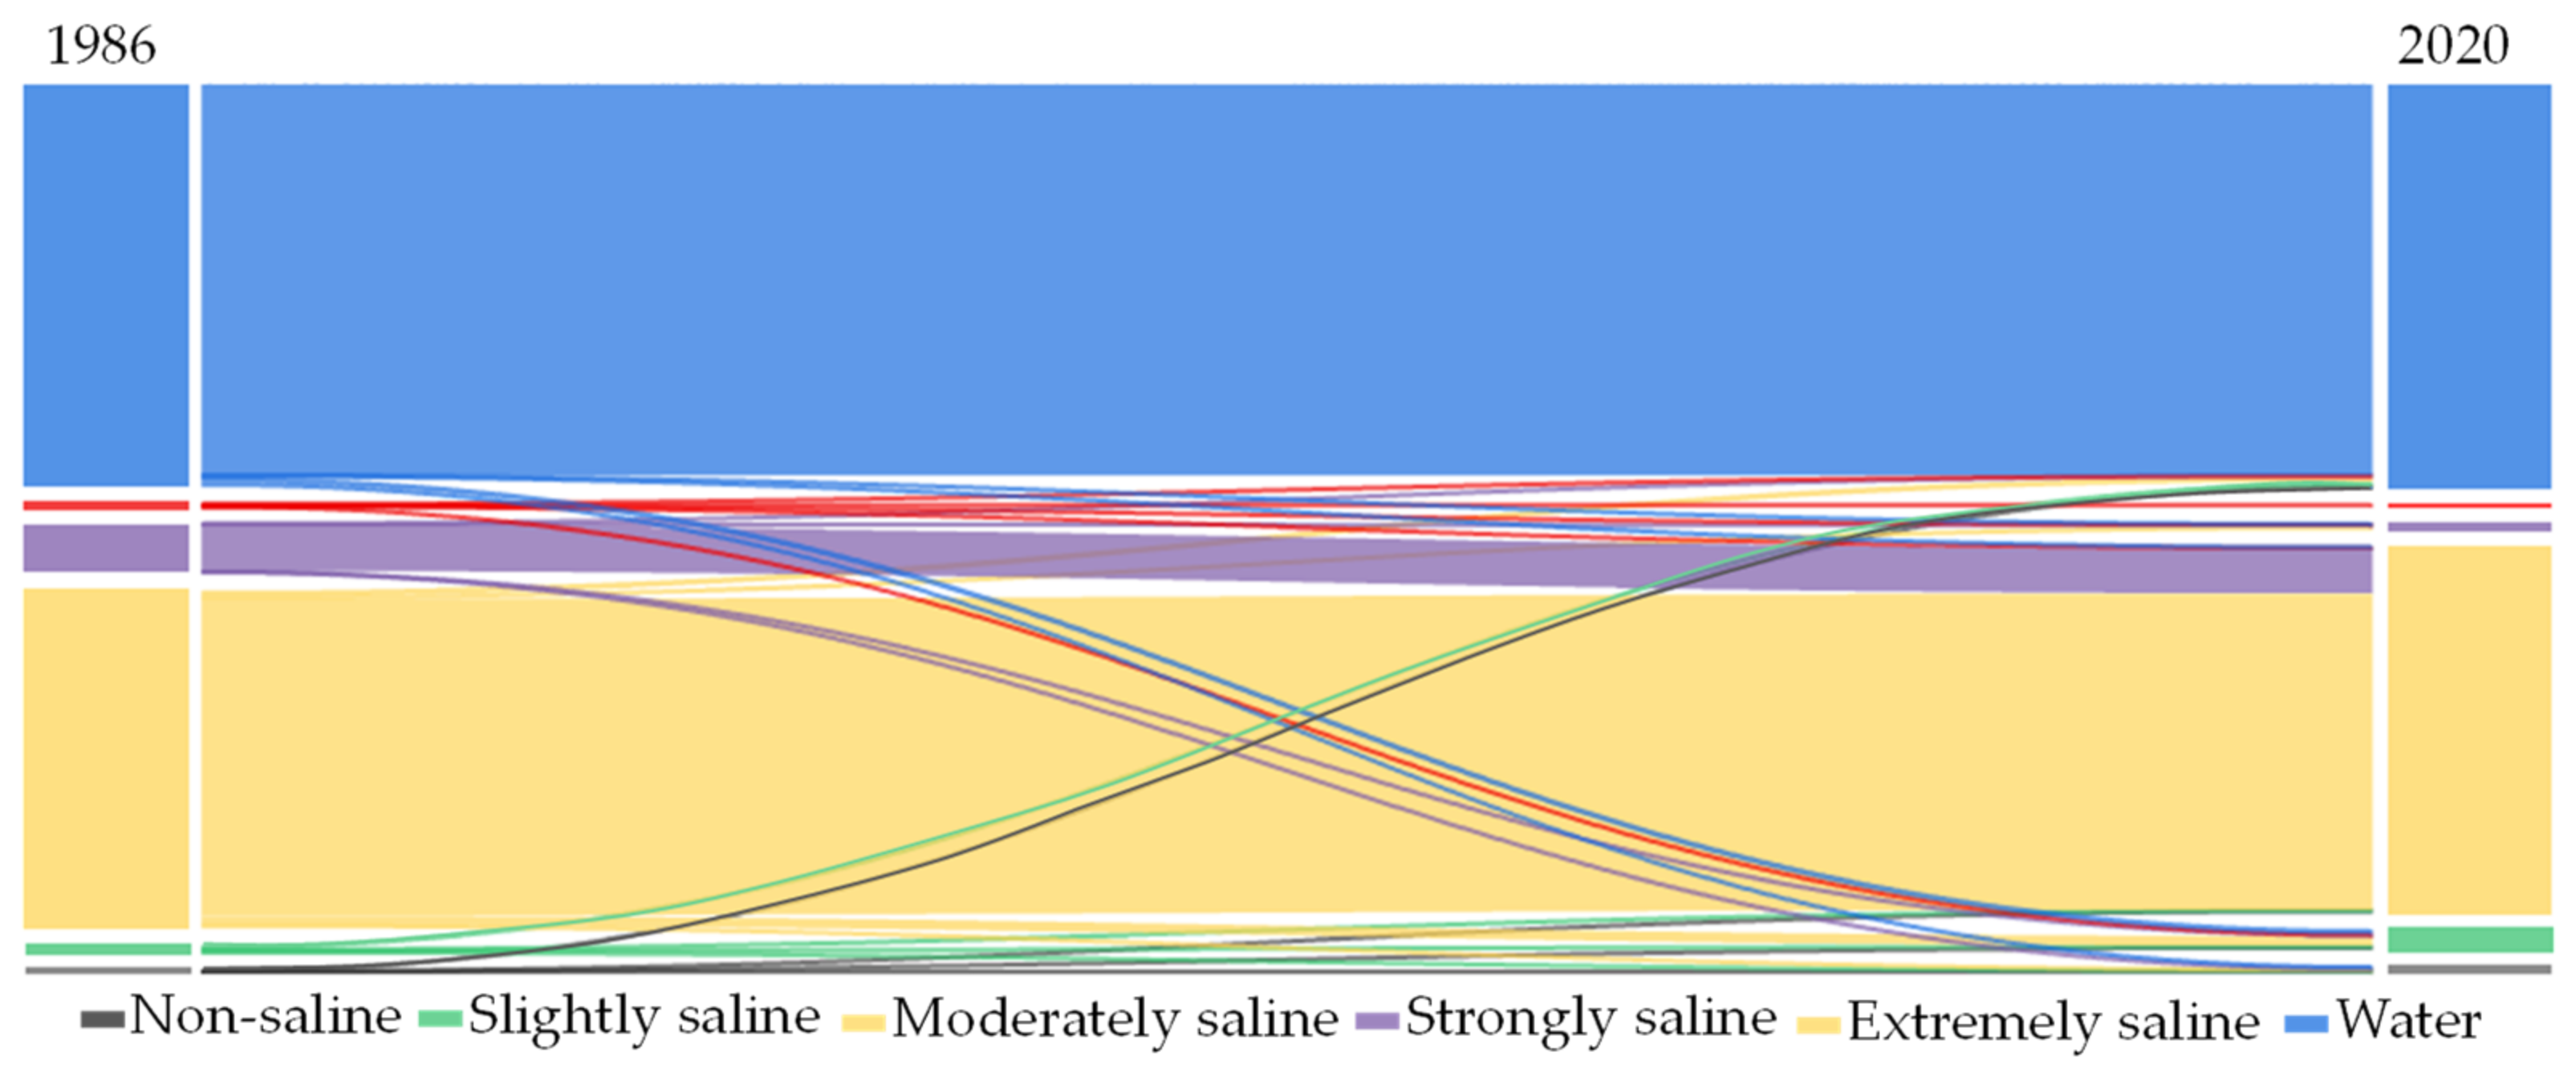
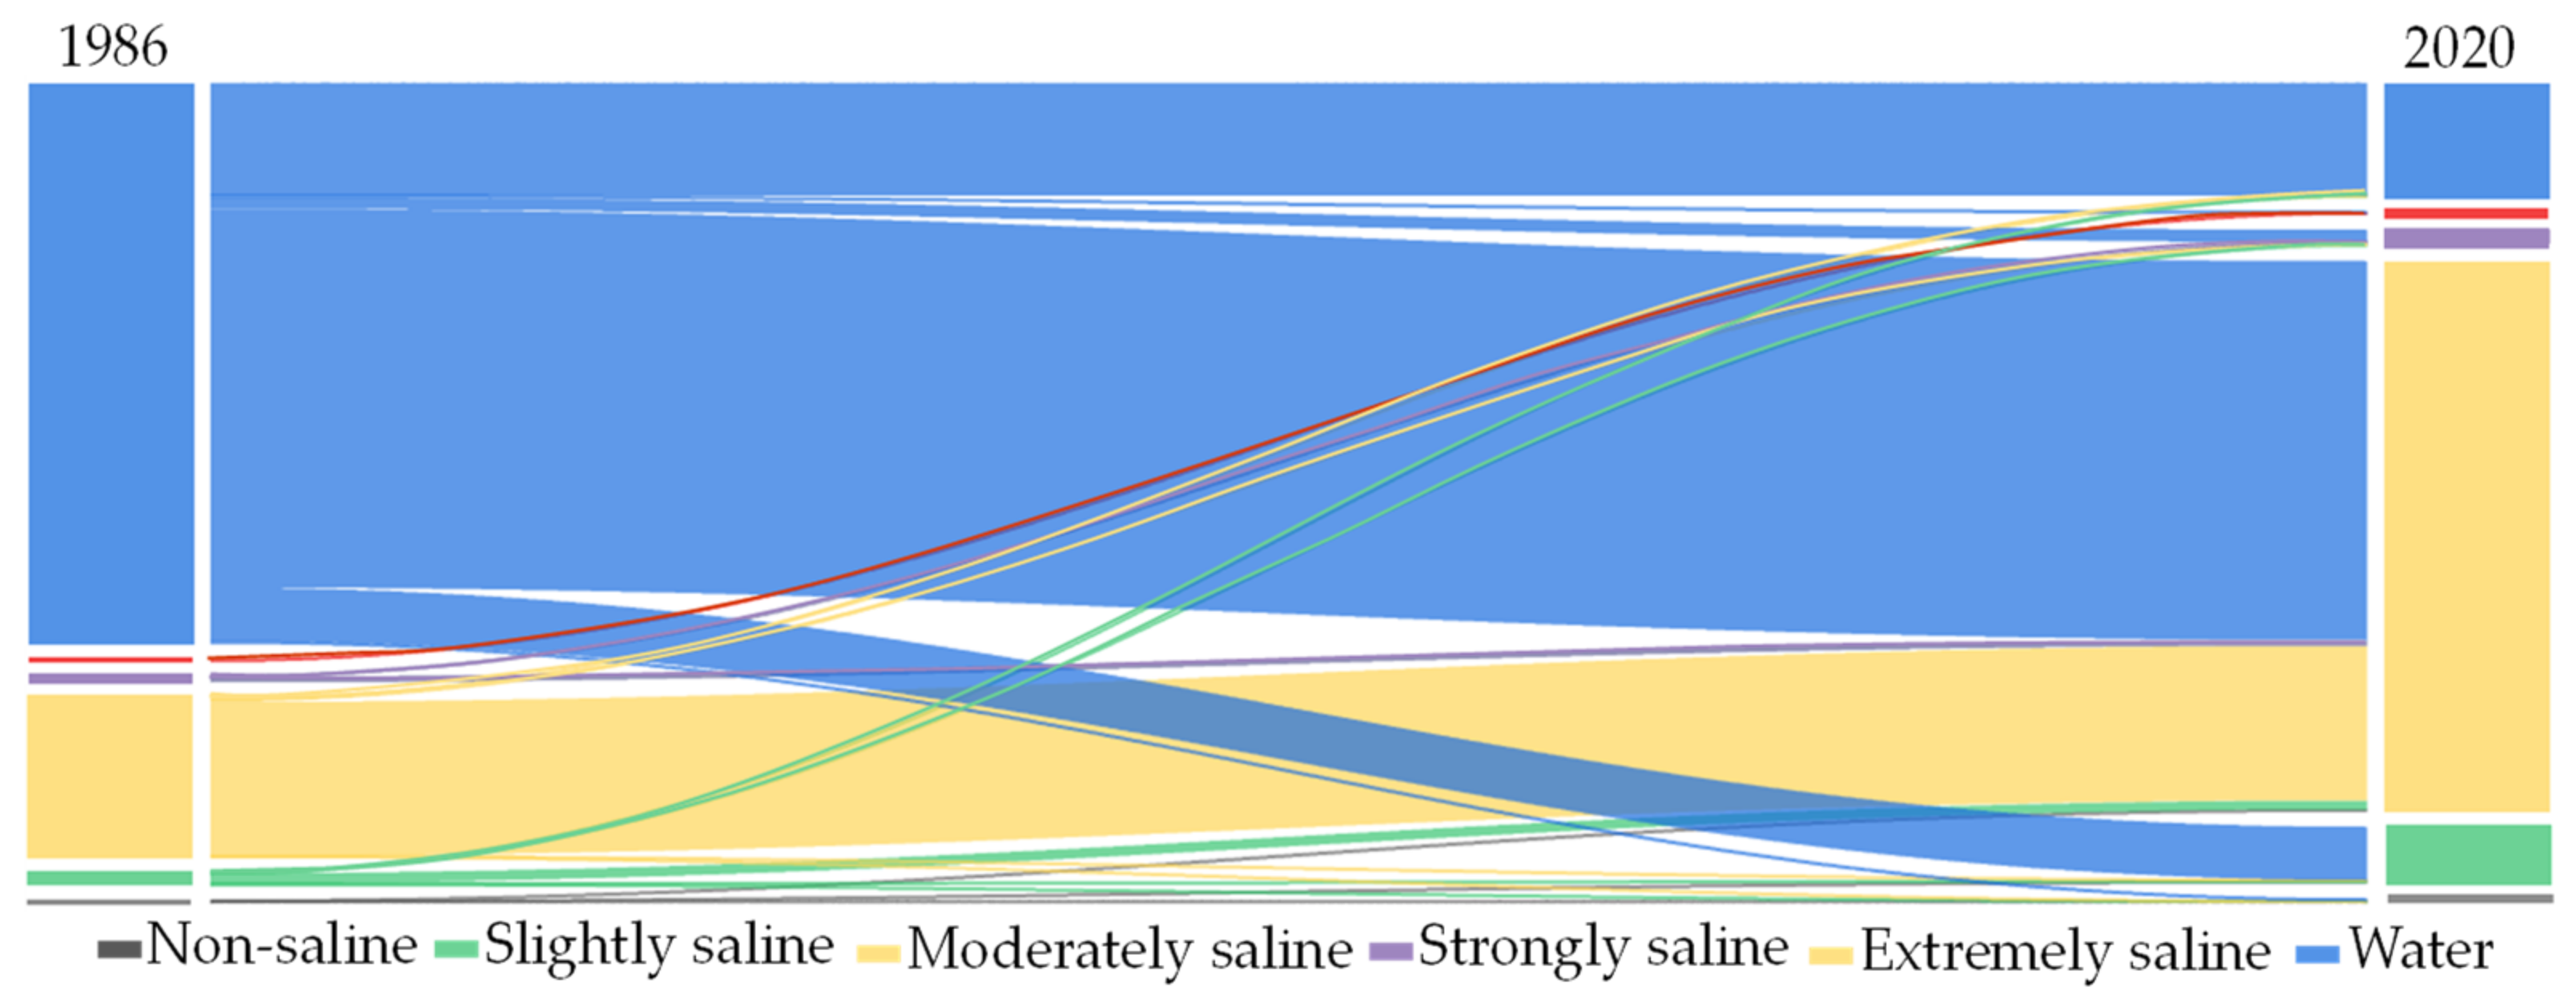
| Classification | North Aral Sea (%) | South Aral Sea (%) | ||
|---|---|---|---|---|
| 1986 | 2020 | 1986 | 2020 | |
| Water | 50.3 | 50.3 | 76.1 | 15.0 |
| Non-saline | 0.2 | 0.8 | 0.1 | 0.4 |
| Slightly saline | 1.0 | 2.3 | 1.5 | 7.5 |
| Moderately saline | 42.1 | 45.6 | 21.2 | 73.8 |
| Strongly saline | 6.0 | 0.7 | 0.8 | 2.1 |
| Extremely saline | 0.3 | 0.2 | 0.2 | 1.2 |
Publisher’s Note: MDPI stays neutral with regard to jurisdictional claims in published maps and institutional affiliations. |
© 2022 by the authors. Licensee MDPI, Basel, Switzerland. This article is an open access article distributed under the terms and conditions of the Creative Commons Attribution (CC BY) license (https://creativecommons.org/licenses/by/4.0/).
Share and Cite
Duan, Z.; Wang, X.; Sun, L. Monitoring and Mapping of Soil Salinity on the Exposed Seabed of the Aral Sea, Central Asia. Water 2022, 14, 1438. https://doi.org/10.3390/w14091438
Duan Z, Wang X, Sun L. Monitoring and Mapping of Soil Salinity on the Exposed Seabed of the Aral Sea, Central Asia. Water. 2022; 14(9):1438. https://doi.org/10.3390/w14091438
Chicago/Turabian StyleDuan, Zihao, Xiaolei Wang, and Lin Sun. 2022. "Monitoring and Mapping of Soil Salinity on the Exposed Seabed of the Aral Sea, Central Asia" Water 14, no. 9: 1438. https://doi.org/10.3390/w14091438
APA StyleDuan, Z., Wang, X., & Sun, L. (2022). Monitoring and Mapping of Soil Salinity on the Exposed Seabed of the Aral Sea, Central Asia. Water, 14(9), 1438. https://doi.org/10.3390/w14091438