Article

Assessing Surface Water Quality for Irrigation Purposes in Some Dams of Asir Region, Saudi Arabia Using Multi-Statistical Modeling Approaches

1
Department of Civil Engineering, King Khalid University, P.O. Box 394, Abha 61411, Saudi Arabia
2
Department of Disaster Management, Begum Rokeya University, Rangpur 5400, Bangladesh
3
Department of Chemical Engineering, King Khalid University, P.O. Box 394, Abha 61411, Saudi Arabia
4
Department of Geography, Faculty of Natural Science Jamia Millia Islamia, New Delhi 110025, India
*
Author to whom correspondence should be addressed.
Water 2022, 14(9), 1439; https://doi.org/10.3390/w14091439
Submission received: 19 February 2022 / Revised: 20 April 2022 / Accepted: 25 April 2022 / Published: 30 April 2022
(This article belongs to the Section Water, Agriculture and Aquaculture)

Abstract

:
The dam is a crucial water source for both consumption and irrigation in the Asir region of the Kingdom of Saudi Arabia. The current study evaluates surface water quality at the dam and examines the effects of some physicochemical and trace metals on irrigation using multiple statistical approaches. The physicochemical parameters and trace metals of the dam water were measured at 27 sites in the Asir region. Three sites were generated using the K-mean clustering technique; the first group included five sites, the second group contained 20 sites, and the third group added 2 sites. The chemical facies of the surface water were Na-K-SO42−. The surface water had low levels of Zn (0.19 mg/L), Cd (0.10 mg/L) and Pb (0.22 mg/L) except for B (38.50 mg/L), excessive concentrations of Na (2090.65 mg/L), K (535.72 mg/L), SO42− (208.11 mg/L) and Cl (105.96 mg/L), while pH varied between 6.0 and 8.5 except at a few sites. The EC (electrical conductivity) values were within the standard for irrigation purposes. The results of irrigation water indices such as magnesium absorption ratio (MAR), magnesium hazard (MH), Kelly’s ratio (KR), and soluble sodium percentage (SSP) indicate that dam water is mostly fit for irrigation except for sodium percentage (Na%) and sodium adsorption ratio (SAR). The irrigation water quality index (IWQI) values revealed that 51.85% of samples had a high suitability class and 11.11% of samples had moderate suitability, whereas the rest were low suitability for irrigation use. The redundancy analysis (RDA) biplot revealed that water pH, DO, TH, and SO42− were increased with decreased EC and salt level. The generalized linear model (GLM) model found that salt had a negative effect on the amount of Fe, Ni, Se, and Al concentrations. The study recommends that proper protective measures, including acceptable criteria for different water parameters, are required to reduce the potential influence of physicochemical parameters and metals on irrigation water in agricultural fields.

1. Introduction

Water is a precious resource for humans, particularly for drinking and irrigation uses. The demand for water consumption has grown owing to increasing agricultural and industrial activity, rapid urbanization, and population expansion [1,2]. People rely on surface water, which is occasionally provided by rivers, lakes, dams, and private wells, to meet their water demands [3]. Dams are regarded as one of the most significant water sources in arid and semiarid regions, including Saudi Arabia [4]. In 2018, the Saudi Ministry of Environment, Water, and Agriculture reported that the Kingdom of Saudi Arabia has 509 dams, 117 of which are in the Asir region, that retain rainwater for various purposes [5]. Some major dams are located in the Asir region, including King Fahd dam (capacity: 325 MCM with a height of 103 m), and Wadi Abha dam (capacity: 213 MCM with a height of 32 m) [4]. The spatial distribution of those dams is presented in supplementary Figure S1. The major goals of these dams in this region are to recharge neighboring wells, defend against floods, and provide irrigation [6]. However, the quality of water kept in such dams is affected by a variety of factors, including toxic elements and microbiological pollutants from rainfall, air, dead plants and animals, soil, and residential wastes [3]. Furthermore, increasing salinity is a common result of water evaporation [7].
Surface water is impacted by natural and human influences, both of which are known to have a detrimental impact on water quality. Natural processes include precipitation, weathering, sediment movement, and dust deposition in the atmosphere [8], whereas human-induced processes include urban growth, agricultural and farming operations, and industrial and municipal wastes. These processes often degrade the water quality, and the physical and environmental integrity of aquatic life [9,10].
Urban run-offs and contaminated water from residential and industrial sources harm rivers and streams, causing eutrophication and trace metal inputs [11,12]. Uncontrolled release of polluted water into aquatic environments degrades water quality, making surface water unsuitable for drinking and irrigation uses [9]. However, poor irrigation water quality affects agricultural crop productivity and negatively impacts the health of local residents. The effect of water quality is assessed by the subsequent impact of the irrigation water on soil properties and agricultural crops [9,13,14]. Thus, monitoring irrigation water quality is imperative in enhancing ecological and human health states [15].
The comparison of the results of geochemical modeling and the analytical data acquired for the groundwaters of the Pollino National Park shows that concentrations of major solutes, SiO2, Li, Al, and Fe of the different chemical types of water, are explained by the dissolution of pertinent lithotypes [16]. Water chemistry is predominantly regulated by natural processes such as dissolution of silicates, and evaporites and soil leaching, followed by human activities as the second factor [17]. Excessive ingestion of fluoride through the consumption of F rich drinking water could cause adverse effects on human health. For this reason, the WHO has fixed 1.5 mg/L as the maximum F concentration for drinking water [18]. Good irrigation water quality may improve agricultural output when managed properly [19]. When the quality of irrigation water is poor, advanced management techniques are needed to stop the water from getting worse and also reduce crop yield loss [20].
The problems induced by poor water quality differ dependent on the contaminants and concomitant hazards. Excessive salt, for instance, may generate soil sodicity and create problems [8]. The USDA (United States Department of Agriculture) model and irrigation water quality index (IWQI) are the most widely used for quantifying water salinity. The salt absorption ratio (SAR) is an excellent measure of sodium levels in irrigation water [21]. While high magnesium concentration may improve alkalinity, excessive chloride content and the presence of boron may induce plant toxicity, as well as other elements such as trace metals that may be detrimental to crops and humans [3]. It is hard for plant roots to acquire water because of the high salinity pressure created by a lot of water-soluble ions surrounding them. This makes it hard for plants to grow and make it more difficult for them to get water.
Agriculture is strongly reliant on water availability, which is the key limiting element for semiarid farming. Such an issue is critical in Saudi Arabia, where the country is suffering from prolonged times of drought in which drinking water consumption takes on a higher importance [22]. Pollutants from domestic and industrial operations are discharged via the open drainage system, in addition to surface waterways (dams) and groundwater. Farmers use this water source every day, even though these pollutants are not always thoroughly cleaned [4].
The Asir region is quickly expanding its rainwater storage infrastructure by constructing dams. The dam is anticipated to provide potable water to nearly two million people by 2030, as well as irrigating around 15,000 ha of agricultural land in the Asir region [23]. Physiochemical parameters influencing poor water quality need proper monitoring to reduce health hazards before dam water is utilized for various purposes [3,24]. This poor water quality causes major health and environmental hazards [25,26], necessitating an irrigation appropriateness study. However, none of the earlier cited works has conducted a comprehensive systematic analysis of dam surface water quality with the irrigation water quality indices and the impacts of individual metals in the Asir region. No studies have been performed so far in the Asir region of Saudi Arabia to assess the appropriateness of dam water for irrigation use. Therefore, this study intends to analyze the irrigation water quality to recognize the physiochemical characteristics of surface dam water from the Asir region. Besides, this research aims to (i) assess variations in water physicochemical parameters, (ii) use water quality indices to determine irrigation suitability; (iii) analyze the variations of irrigation water indices amongst sites to highlight associations between irrigation water quality parameters (iv) investigate irrigation water parameters and relationships using redundancy and correlation analysis, and, (v) use a generalized linear model (GLM) to test the effect. The novel aspect of this study is that for the first time, systematic analysis was carried out to appraise the suitability of surface water in the Asir region for irrigation using a multi-statistical modeling approach, and also the effects of some trace metals on irrigation water quality indices. Water managers, local establishments, and decision makers can use our analysis as a baseline dataset to understand the current surface water quality condition for irrigation purposes and to comprehend management actions.

2. Materials and Methods

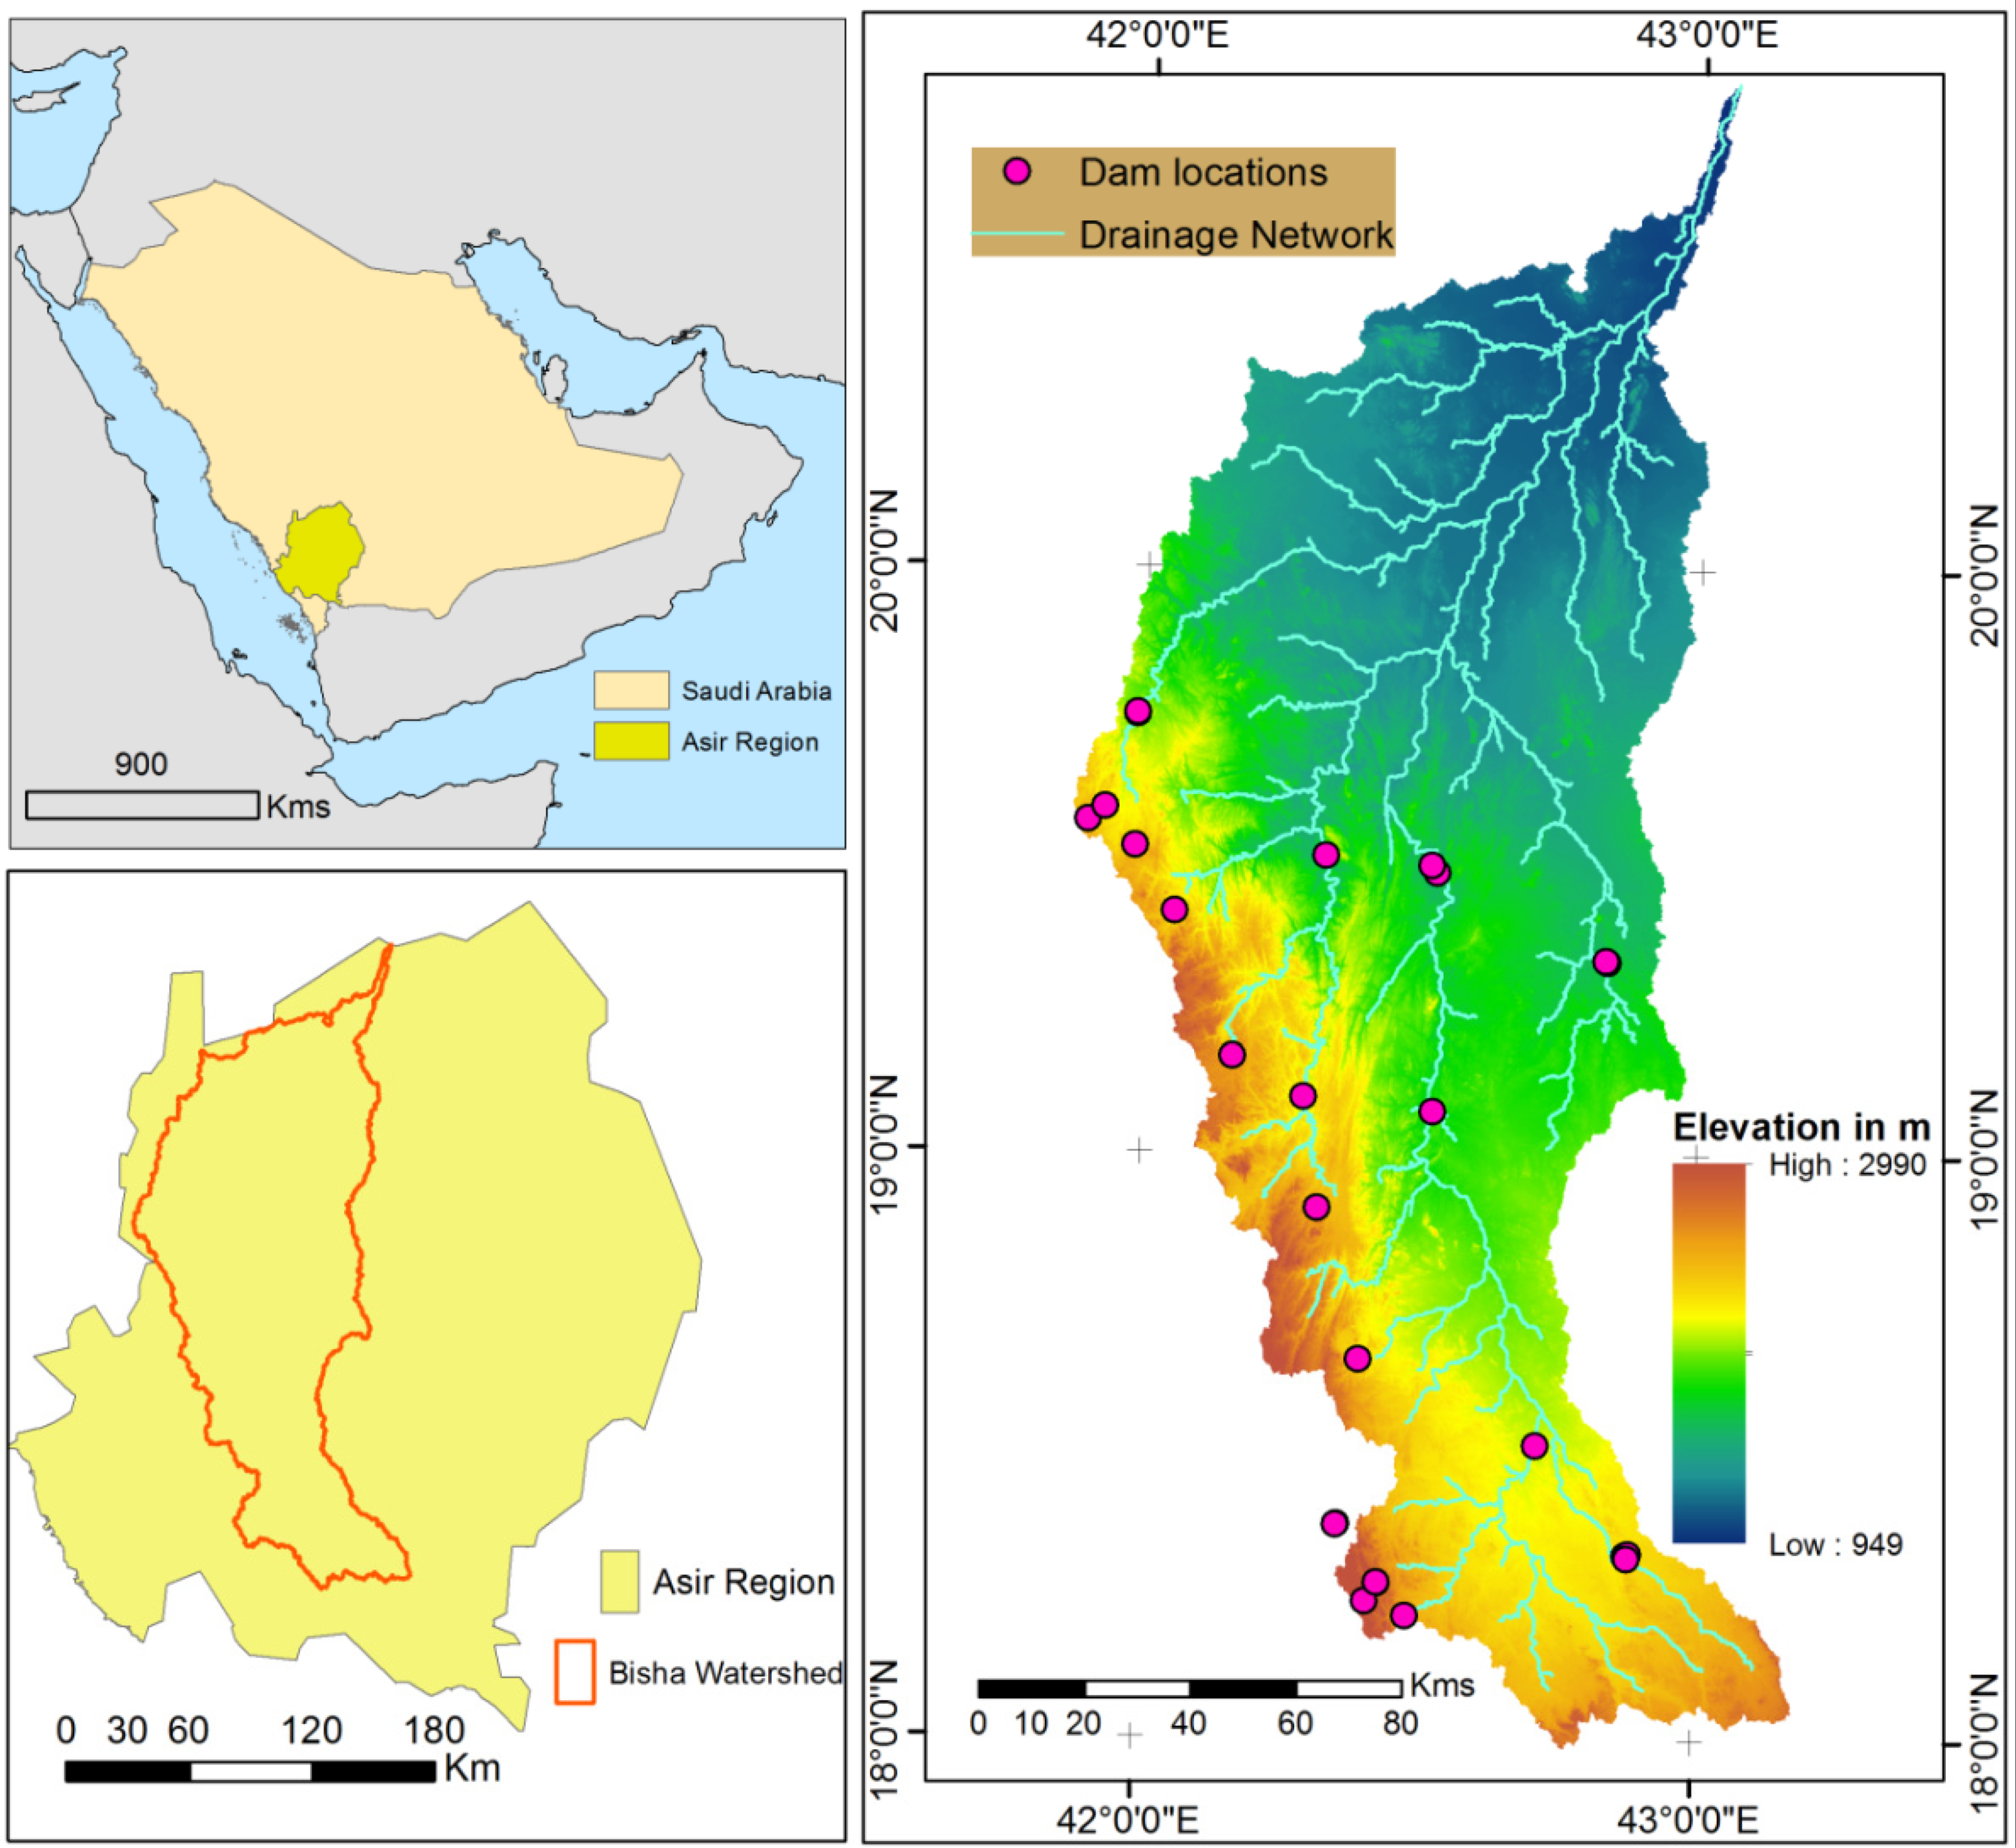
2.1. Study Area Description

The Bisha watershed is 21,260 km2 in area and is bordered by Yemen. It is found in the Asir region. The Bisha watershed is located between 17°59′27.588″ and 20°49′13.958″ N of the equator, and between 41°49′50.825″ and 43°11′20.254″ E of the Greenwich meridian (Figure 1). Highlands, high mountains (between 2000 and 3000 m above sea level), plateaus, and Wadiyan are all part of the scenery. It also includes a large area of the desert to the north and east, stretching all the way to Bisha. With a mean elevation of 1655 m, the elevation ranges from 950 to 2980 m above sea level. The climate of the area varies greatly depending on the terrain and season. Semi-arid regions in the south, and desert regions in the north have vastly different climates. The average temperature has ranged between 12 °C and 44 °C over the last 30 years. Annual rainfall averages 245 mm. Rainfall totalling more than 200 mm per year is restricted to a 20–30 km wide crest zone [5]. As a result, eastward and northward Wadi flow decreases significantly downstream, and deposition at the plateau’s eastern edge exceeds erosion. Forests and Juniperus procera line the watershed’s highland, which are home to a diversity of unique and unusual plants and species.
By constructing check dams, the Asir region is rapidly improving its rainwater gathering capabilities. They collect enough water to irrigate 15,000 hectares of farmland. If only a fourth of the water lost to run-off could be recovered, it would be enough to meet all Saudi Arabia’s current agricultural needs. The Asir escarpment receives nearly 60% of Saudi Arabia’s run-off, which flows to the shore. Sand and gravel wadi constructions allow run-off to quickly sink into underground waterbodies (wadi) and replenish groundwater. Storm run-off occurs year-round in Asir. Dam building has a lengthy history in the nation, notably in Hijaz and Asir. Dams are constructed to collect run-off and feed the groundwater network, but some also provide drinking water and agricultural irrigation.
The surface geology of the study area is comprised of quaternary alluvium, quartz sandstone, and conglomerate sedimentary rocks, whereas secondary rocks contain mostly limestone with lateral diagenetic changes that enhance pore space along with the karstification process (Figure S2). The lithology consists of coarse-grained sand, gravel and Wajid sandstone at the bottom, and fine-grained sand, and clay at the upper part in the Asir region. Most of the area is occupied by sedimentary rocks, except for Harrart and Wadi, which were filled with Precambrian shields. Most of the surface water comes from unconfined quaternary alluvial aquifers, which are fed by surface runoff from the Asir region’s mountain range.

2.2. Data Collection and Analytical Design

Surface water samples were collected at depths of 10 cm from 27 stations throughout the 27 dams (Figure 1) during October and November 2021. The water samples used to determine trace metal concentrations were all taken at the same depth. The approach for physiochemical studies was based on FAO (1985), which is generally used globally. In sterile polyethylene terephthalate bottles, water samples were collected (1 L capacity). Prior to collection, bottles were cleaned with mild hydrochloric acid and rinsed with distilled water in the lab, and then washed three times with water at the site before filling with the water sample [27].
The pH, electrical conductivity (EC), and total dissolved solid (TDS) were measured on-site using a portable pH, EC electrode (Oakton), and TDS meter (HANNA) (HANNA). For cation analysis, the samples were acidified with nitric acid (50 percent) pH, whereas those collected for anion analysis were not acidified. The materials were kept cold in an ice box before being brought to the laboratory and maintained at 4 degrees Celsius for further chemical analysis. The samples were analyzed for major cations (Mg2+, Ca2+, Na+, K+) and major anions (F, Cl, SO42−) using the Sykam ion chromatography system (S151-A IC, Sykam, Germany). Inductively coupled plasma atomic emission spectroscopy was used to identify trace metals (Cd, Pb, Al, Se, Zn, Ni, B, Mn, Cu, and Fe) (ICP MODEL-ICAP PRO X ICP-OES). FAO criteria, which are based on a set of guideline values, were utilized to evaluate irrigation water quality [28] (Table 1). Analytical grade reagents, standards, and compounds were employed throughout the study (Merck). Following sample analysis, the normalized charged balance index (NCBI) was calculated using the standard procedure, and the values of NCBI were found to range between 0.15.

2.3. Irrigation Water Quality Parameters

The irrigation water quality parameters have been employed by using these equations:
Total Hardness (TH)
Total hardness in ppm was calculated by the following equation [29,30]:
TH = 2.497 Ca 2 + + 4.11 Mg 2 +
Percentage of Sodium (Na%)
According to Todd, (1980) Na% was determined by using this equation:
Na % = Na + Na + + Ca + + Mg + × 100
Sodium Adsorption Ratio (SAR)
SAR is expressed as Equation (3) by the US Salinity Laboratory [31]. “The greater the risk of Na+, which leads to the establishment of a crop-unfriendly alkaline soil, the higher the SAR values in the water”.
MAR = Mg + Ca + + Mg + × 100  
SAR = Na + ( Ca + + Mg + ) / 2
Kelley’s Ratio
The Kelley’s ratio (KR) [32] is estimated as described by Equation (5):
KR = Na + Ca + + Mg +
Magnesium Adsorption Ratio
“The magnesium adsorption ratio (MAR) [30], also referred as magnesium hazard (MH), which is calculated by Equation (5) In this study, MAR (meq/L) and MH (%) both have been considered in different units”.
MAR = Mg + Ca + + Mg + × 100
Soluble Sodium Percentage (SSP)
SSP was employed by Todd (1980) which is described with the Equation (7):
SSP = Na + + K + Ca + + Mg + + Na + + K + × 100
The graphical approach, the classification and accuracy of water for irrigation purposes are demonstrated using USSL Richard’s [33] and Wilcox’s [34]. SAR and electrical conductivity are represented in the USSL diagram. It represents the four levels of water quality: low, medium, high, and very high. Wilcox’s diagram, on the other hand, shows electrical conductivity and the sodium percentage. It illustrates five categories of water: excellent, good, permissible, doubtful, and unsuitable. Grapher software was used to generate the diagrams.
IWQI calculation
The WQI value is used to assess the impact of natural and man-made activities on numerous primary parameters of groundwater chemistry [35]. The WQI for the various sampling stations was calculated using the weighted arithmetic index approach, which considered the following parameters: DO, pH, EC, TDS, TH, SSP, MAR, Na%, SAR, MH and KR.
To calculate water quality index value the following equations were performed.
At first the proportionality constant (Kp) was calculated [36]:
K p = 1   ( 1 X k )
where, Xk = standard quality value of a kth parameter
Then the unit weight (UWk) of the individual parameter was determined by this formula:
UW k = K p K p
After that the quality rating (QRk) of the individual parameter was determined:
QR k = ( 100 MV k V c ) ( X k V c )
“where, MVk represents the measured value of a kth parameter in the examined groundwater and Vc represents the ideal concentration of each parameter”.
“In the freshwater (Vc is considered as zero, excluding the ideal concentration of pH is considered as 7.00 and the ideal concentration of DO is considered as 14.60 mg/L)”.
In the last step, the WQI is calculated by this Equation (11):
IWQI =   QR k UW kc ( X k V c )
Based on the IWQI value, the classes of water e.g., <22 is regarded as low suitability, 22–37 is considered as moderate suitability, and >37 is recorded as high suitability [37].

2.4. Statistical Analyses

R version 3.3.0 was used for statistical analysis [38]. The physiochemical parameters of irrigation water were performed using basic statistics (mean and standard deviation (SD), and the water quality indices were shown as boxplots to highlight the variance of values across the study clusters. From the (HCA), we got 3 clusters. K-means HCA technique was added in this analysis. The K-mean hierarchal clustering technique reduces the distances in each cluster center within the clusters [39]. The advantage of the K-mean clustering is that it can aid in classifying sampling sites in a systematic way. ANOVA was used to compare changes in each physicochemical parameter and water index between study clusters. Tukey’s post hoc tests were used to find homogeneous locations. There were no significant relationships found between water physicochemical properties and irrigation water indices. The correlation matrices were plotted in R using the corrplot value [38]. Asir-related physicochemical variables and irrigation indicators were studied in R using the “vegan” package. The RDA was plotted using correlative scaling. The impacts of water irrigation parameters on physiochemical properties and trace metals were studied using a GLM. The GLM model comprises all water physicochemical properties as explanatory variables. Each model was then simplified using the “backward/forward” stepwise selection process (AIC). The final model was selected for its low AIC.

3. Results

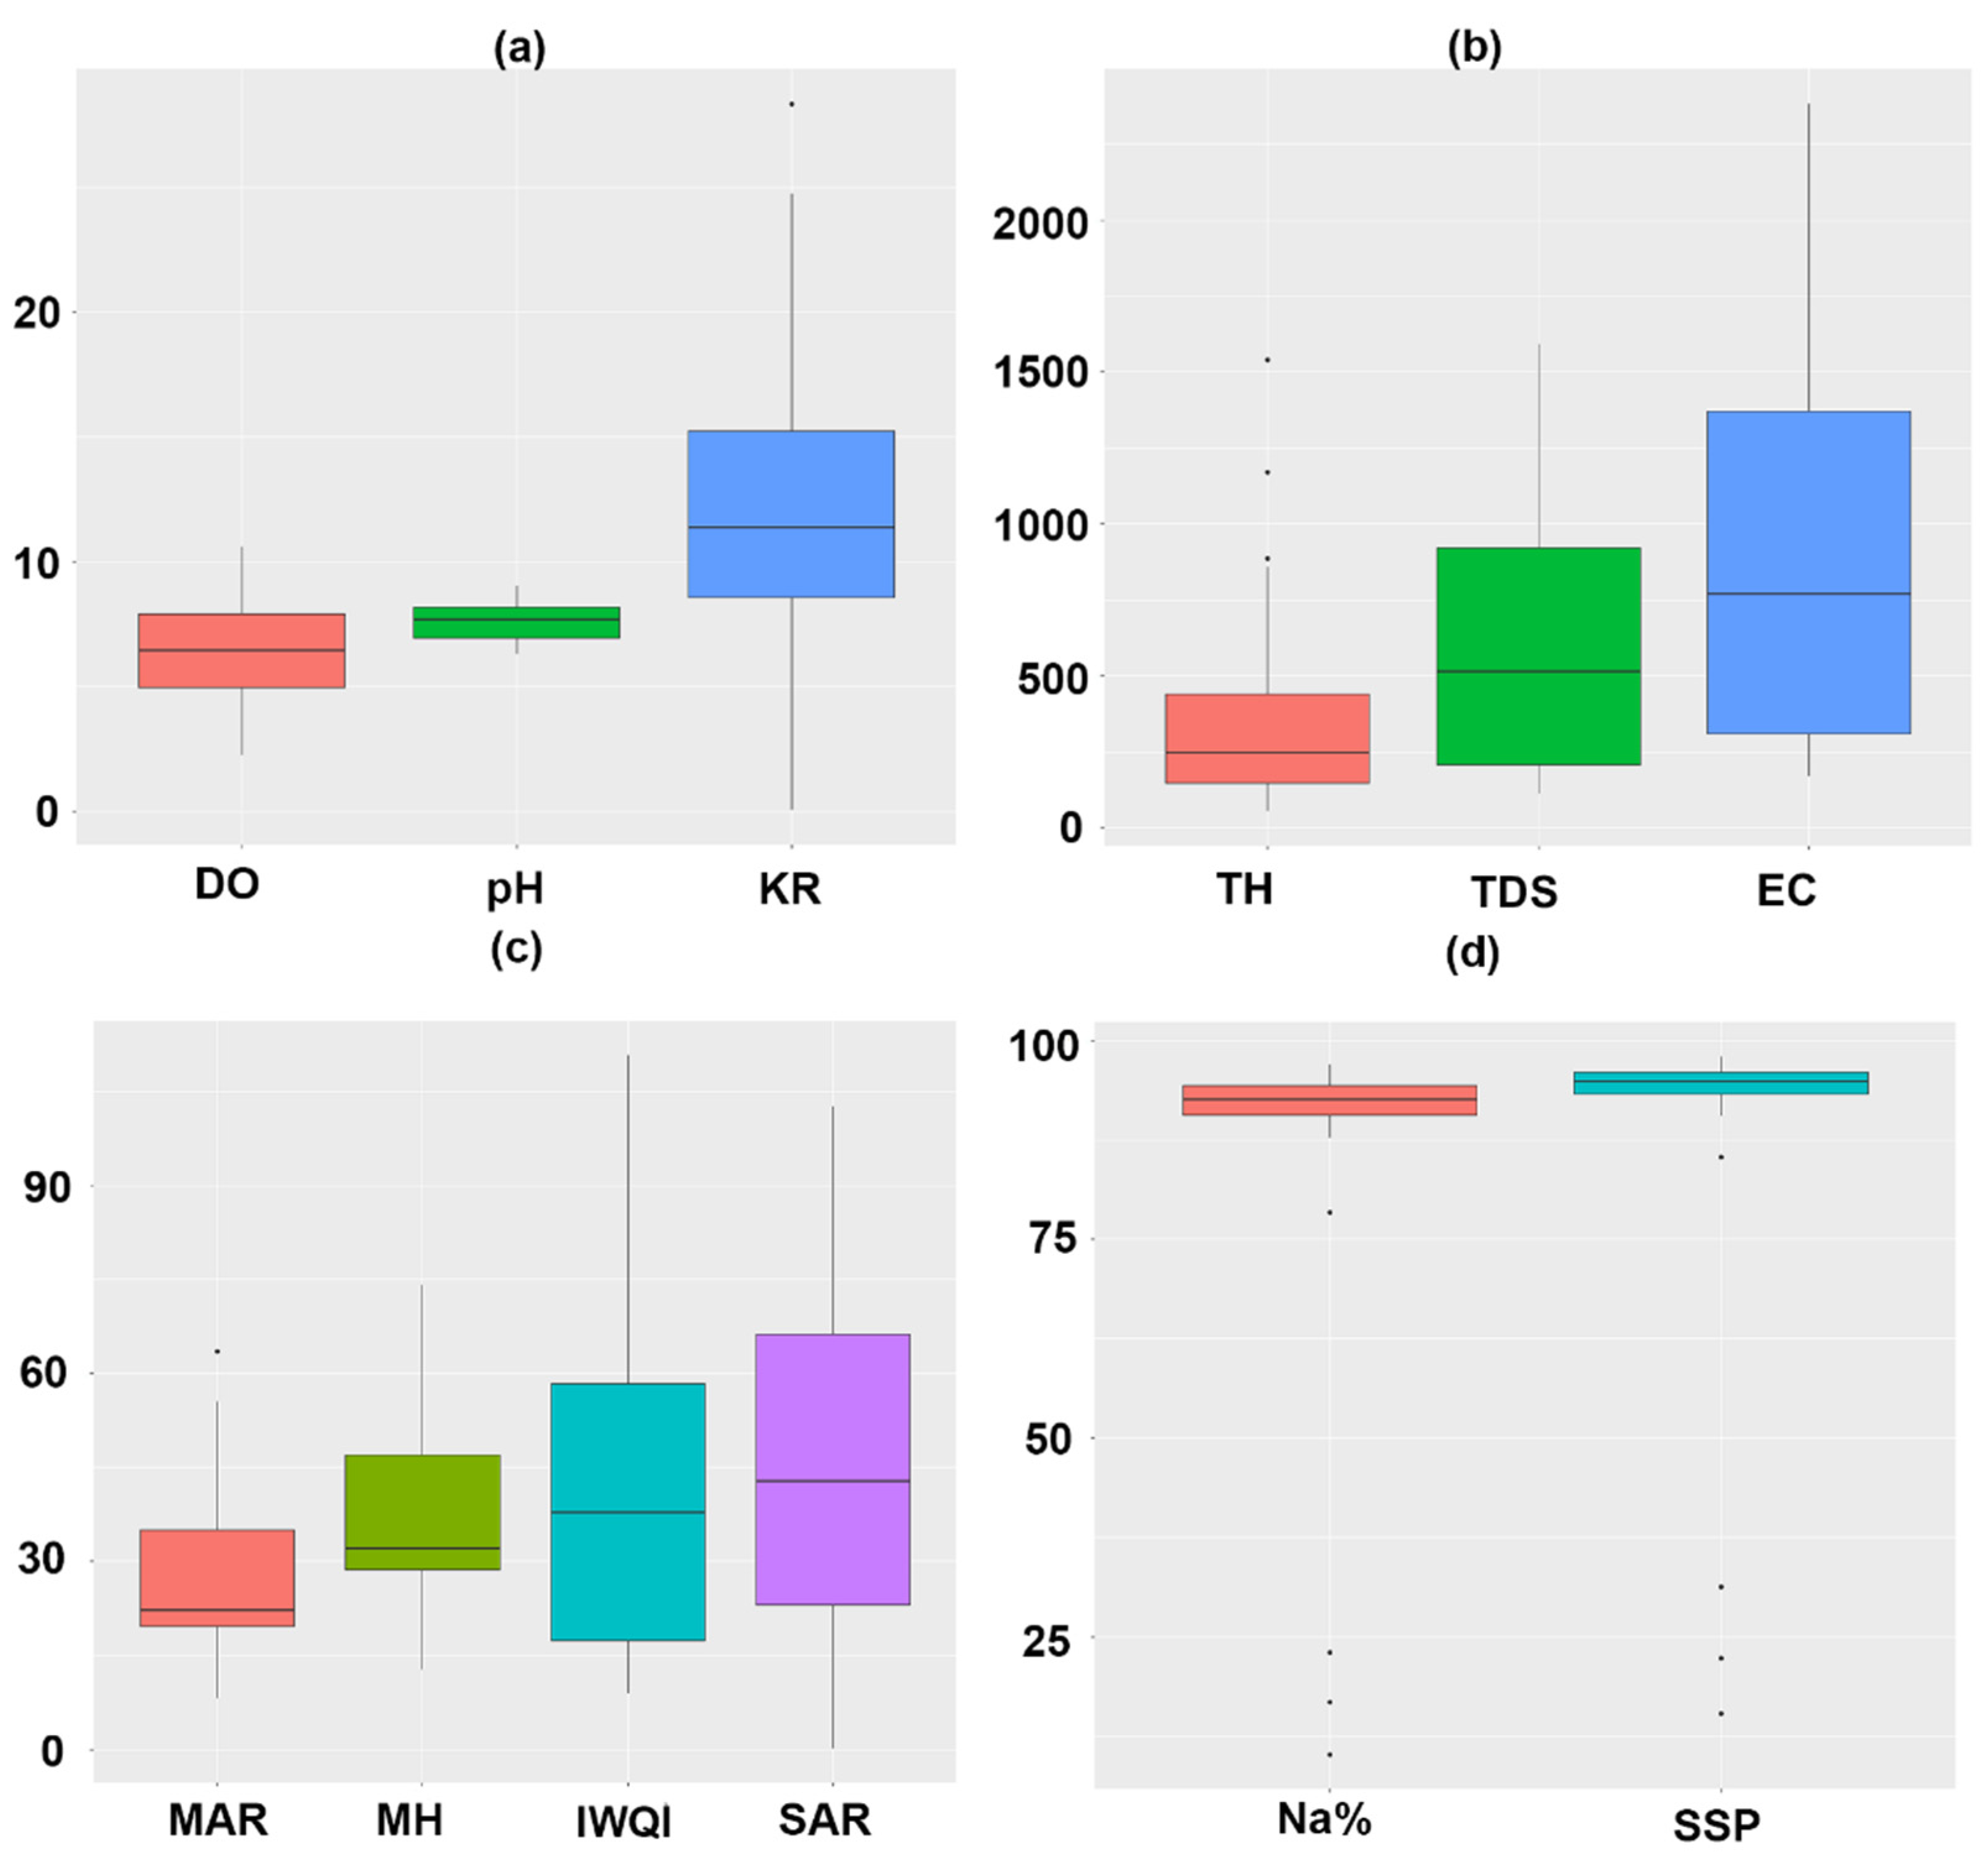
3.1. Variation of Physicochemical Parameters

Dissolved oxygen (DO) is a critical factor for aquatic life. DO is usually measured to evaluate the quality of water pollution [40]. DO content ranged between 6.00 and 9.72 mg/L, recorded at C2 and C3, with a mean of 6.46 2.19 mg/L, indicating moderate pollution.
The pH of the research sites’ dam surface water ranged from 7.39 (C2) to 8.83 (C3), with an average of 7.61, suggesting that pH is symmetrical and values are quite near to each other [13]. Except for two samples (SM5 and SM8), the FAO categorization of irrigation water quality placed practically all samples (98%) in the normal pH range (6.0–8.5) (Table 1). The pH of irrigation water ranged from mildly acidic (6.29) to extremely alkaline (9.04). Most tested samples were mildly alkaline (pH > 7). Because dissolved CO2 causes the release of Na and K, the pH and alkalinity of surface water increases [41]. The pH of dam water is adequate for the FAO [42] irrigation water standard.
The significant variations relied on the study site clusters. Electrical conductivity (EC) ranged from 649 uS/cm recorded at C2 to 2340 uS/cm at C3, with an average value of 903.81 and 671.89 s/cm (Table 2). Dam water samples acquired during October and November had EC (3000 uS/cm) which were demarcated within the class “Eligible”. Similarly, the TDS (total dissolved solid) values varied from 434 to 1555 mg/L at C2 and C3, with an average value of 604.44 and 447.94 mg/L (Table 2). TDS values were within the FAO standard limit (2000 mg/L), which is shown by the number of dissolved salts that were observed in the dam during low water periods. The standard deviation of TDS is very high (447), which means that TDS values are not close to each other.
Based on anion, such as Cl concentrations, varied between 79.31 and 271.98 mg/L recorded at C2 and C3, respectively, with a mean (±std. deviation) of 105.96 ± 104.50 mg/L (Table 2). Based on Cl content, most of the water samples (97%) were within the threshold limit set by FAO (1985) (250 meq/L) except for three sites (SM7-8 and SM31), indicating water in these sites as a “growing problem” (Table S1). SO42− concentrations ranged between 64.45 mg/L in C2 and 1293.87 mg/L in C3, with a mean of 208.11 ± 344.01 mg/L. With a mean of 1.91 and 1.73 mg/L, F concentration was usually high in the study region, above the FAO (1985) standard threshold (>1.50 mg/L) for 55.55% of the samples examined. Regarding the cation Na+, the findings indicated levels ranging from 1483.88 mg/L at C2 to 6203 mg/L at C3, with an average (±std. deviation) of 2090.65 ± 1811.56 mg/L. Na+ levels above 900 mg/L in 70% of the water samples tested during our investigation, classifying it as an “increasing concern” by the FAO [42]. K+ values above 2 mg/L in virtually all water tests were an “increasing issue”.
The cation tendency in all dams of Abha region is Na+ > K+ > Ca2+ > Mg2+, with Na+ as the main cation, and SO42− > Cl > F, with SO42− as the dominating anion. Our findings indicated that the content of trace metals (Cd, Pb, Al, Se, Zn, Ni, B, Mn, Cu, and Fe) was below the limits of detectability of the instrument (Table 1). The one-way ANOVA test indicated that among the clusters, C1 and C2 ranged significantly between the study sites (p < 0.001), but no significant differences were found between C3 (p > 0.1) (Table S2).

3.2. Indices of Irrigation Water Quality

Piper’s diagram revealed that the chemical facies of water samples obtained from the study dam sites were Na+-K+, Cl-SO42−, and Ca2+-Mg2+. (Figure 2). According to Richards, the Riverside diagram [33] exhibited the following classes (Figure 3): (i) C1S1: 3.7% of samples were of an excellent quality for irrigation purposes; (ii) C2S1: 11.11% of samples were medium salinity and low alkalinity hazards; (iii) C2S4: 33.03% of samples were medium salinity and high alkalinity hazards, exhibiting poor quality for agricultural purposes and could not be used for irrigation purposes; and (iv) C3S4: 44.44% of samples were relatively poor quality for irrigation purposes; (v) C4S4: 7.4% of samples were of extremely low quality and may be utilized for light, well-drained soils with gypsum amendments and drought-resistant plants, notably in Cluster C3. These ratings suggested that the quality of irrigation water was generally extremely bad owing to a high hazard of salinization with a low to high risk of sodicity. The high salinity might have occurred due to intense anthropogenic activities in the study sites.
Except for cluster C3, the irrigation water indices (Na%, SAR, MH, SSP, and KR) varied significantly across study clusters (p < 0.001) (Figure 4). Most irrigation indicators (SAR, Na percent, SSP, and KR) had higher values in clusters C1 and C2 than in cluster C3. Table 3 lists the values for several irrigation water quality indices for each sample location (n = 27). According to Na%, 3.70% of the samples were in the excellent quality category, 7.41% were of good quality, while 88.89% were unsuitable for irrigation purposes. Based on SAR, Na%, KR, and SSP values, the water tested at the dam locations was mostly unsuitable for irrigation. A KR ratio >1 implies a high Na+ content in water. Dietary KR levels varied from 0.06 to 28.32 percent, with a mean (±std. deviation) of 11.82 ± 7.58. (Figure 5a). KR evaluated 11.11 percent of the samples as appropriate for irrigation, whereas the other samples (88.89%) had poor irrigation water quality (Table 3). The computed TH values varied from 56.38 to 1539, with an average (±std. deviation) value of 379.07 ± 358.45 (Figure 5b). Most of the water samples (74.07%) were in the hard to very hard categories based on the TH index. In contrast, according to the MH and MAR indices, 89% of the water samples were of an excellent quality for irrigation. The IWQI ranged from 8.94 to 110.69, with a mean (±std. deviation) value of 42.38 ± 28.37 (Figure 5c). According to the IWQI index, 51.85% of the samples had high suitability, 11.11% were moderate, and the remaining samples had low suitability for irrigation purposes.
Cluster C3 has the highest values for SAR, Na%, SSP, and KR, with averages of 73.71 meq/L (SAR), 91.62 (Na%), 94.22% (SSP), and 10.12 meq/L (KR). The calculated SAR values ranged from 0.15 to 102.61, with a mean (±std. deviation) value of 43.71 ± 29.10 (Figure 5c). The computed SSP values ranged from 15.45 to 97.96, with a mean (±std. deviation) value of 86.92 ± 23.26 (Figure 5d). According to the SSP index, 7.41% of samples were fit for irrigation, whereas 88.9% of samples were unsuitable for irrigation. The maximum value of IWQI was detected at S7 (110.69), MH at S10 (67.18%), and MAR at S10 (55.43 meq/L) (Table 3).

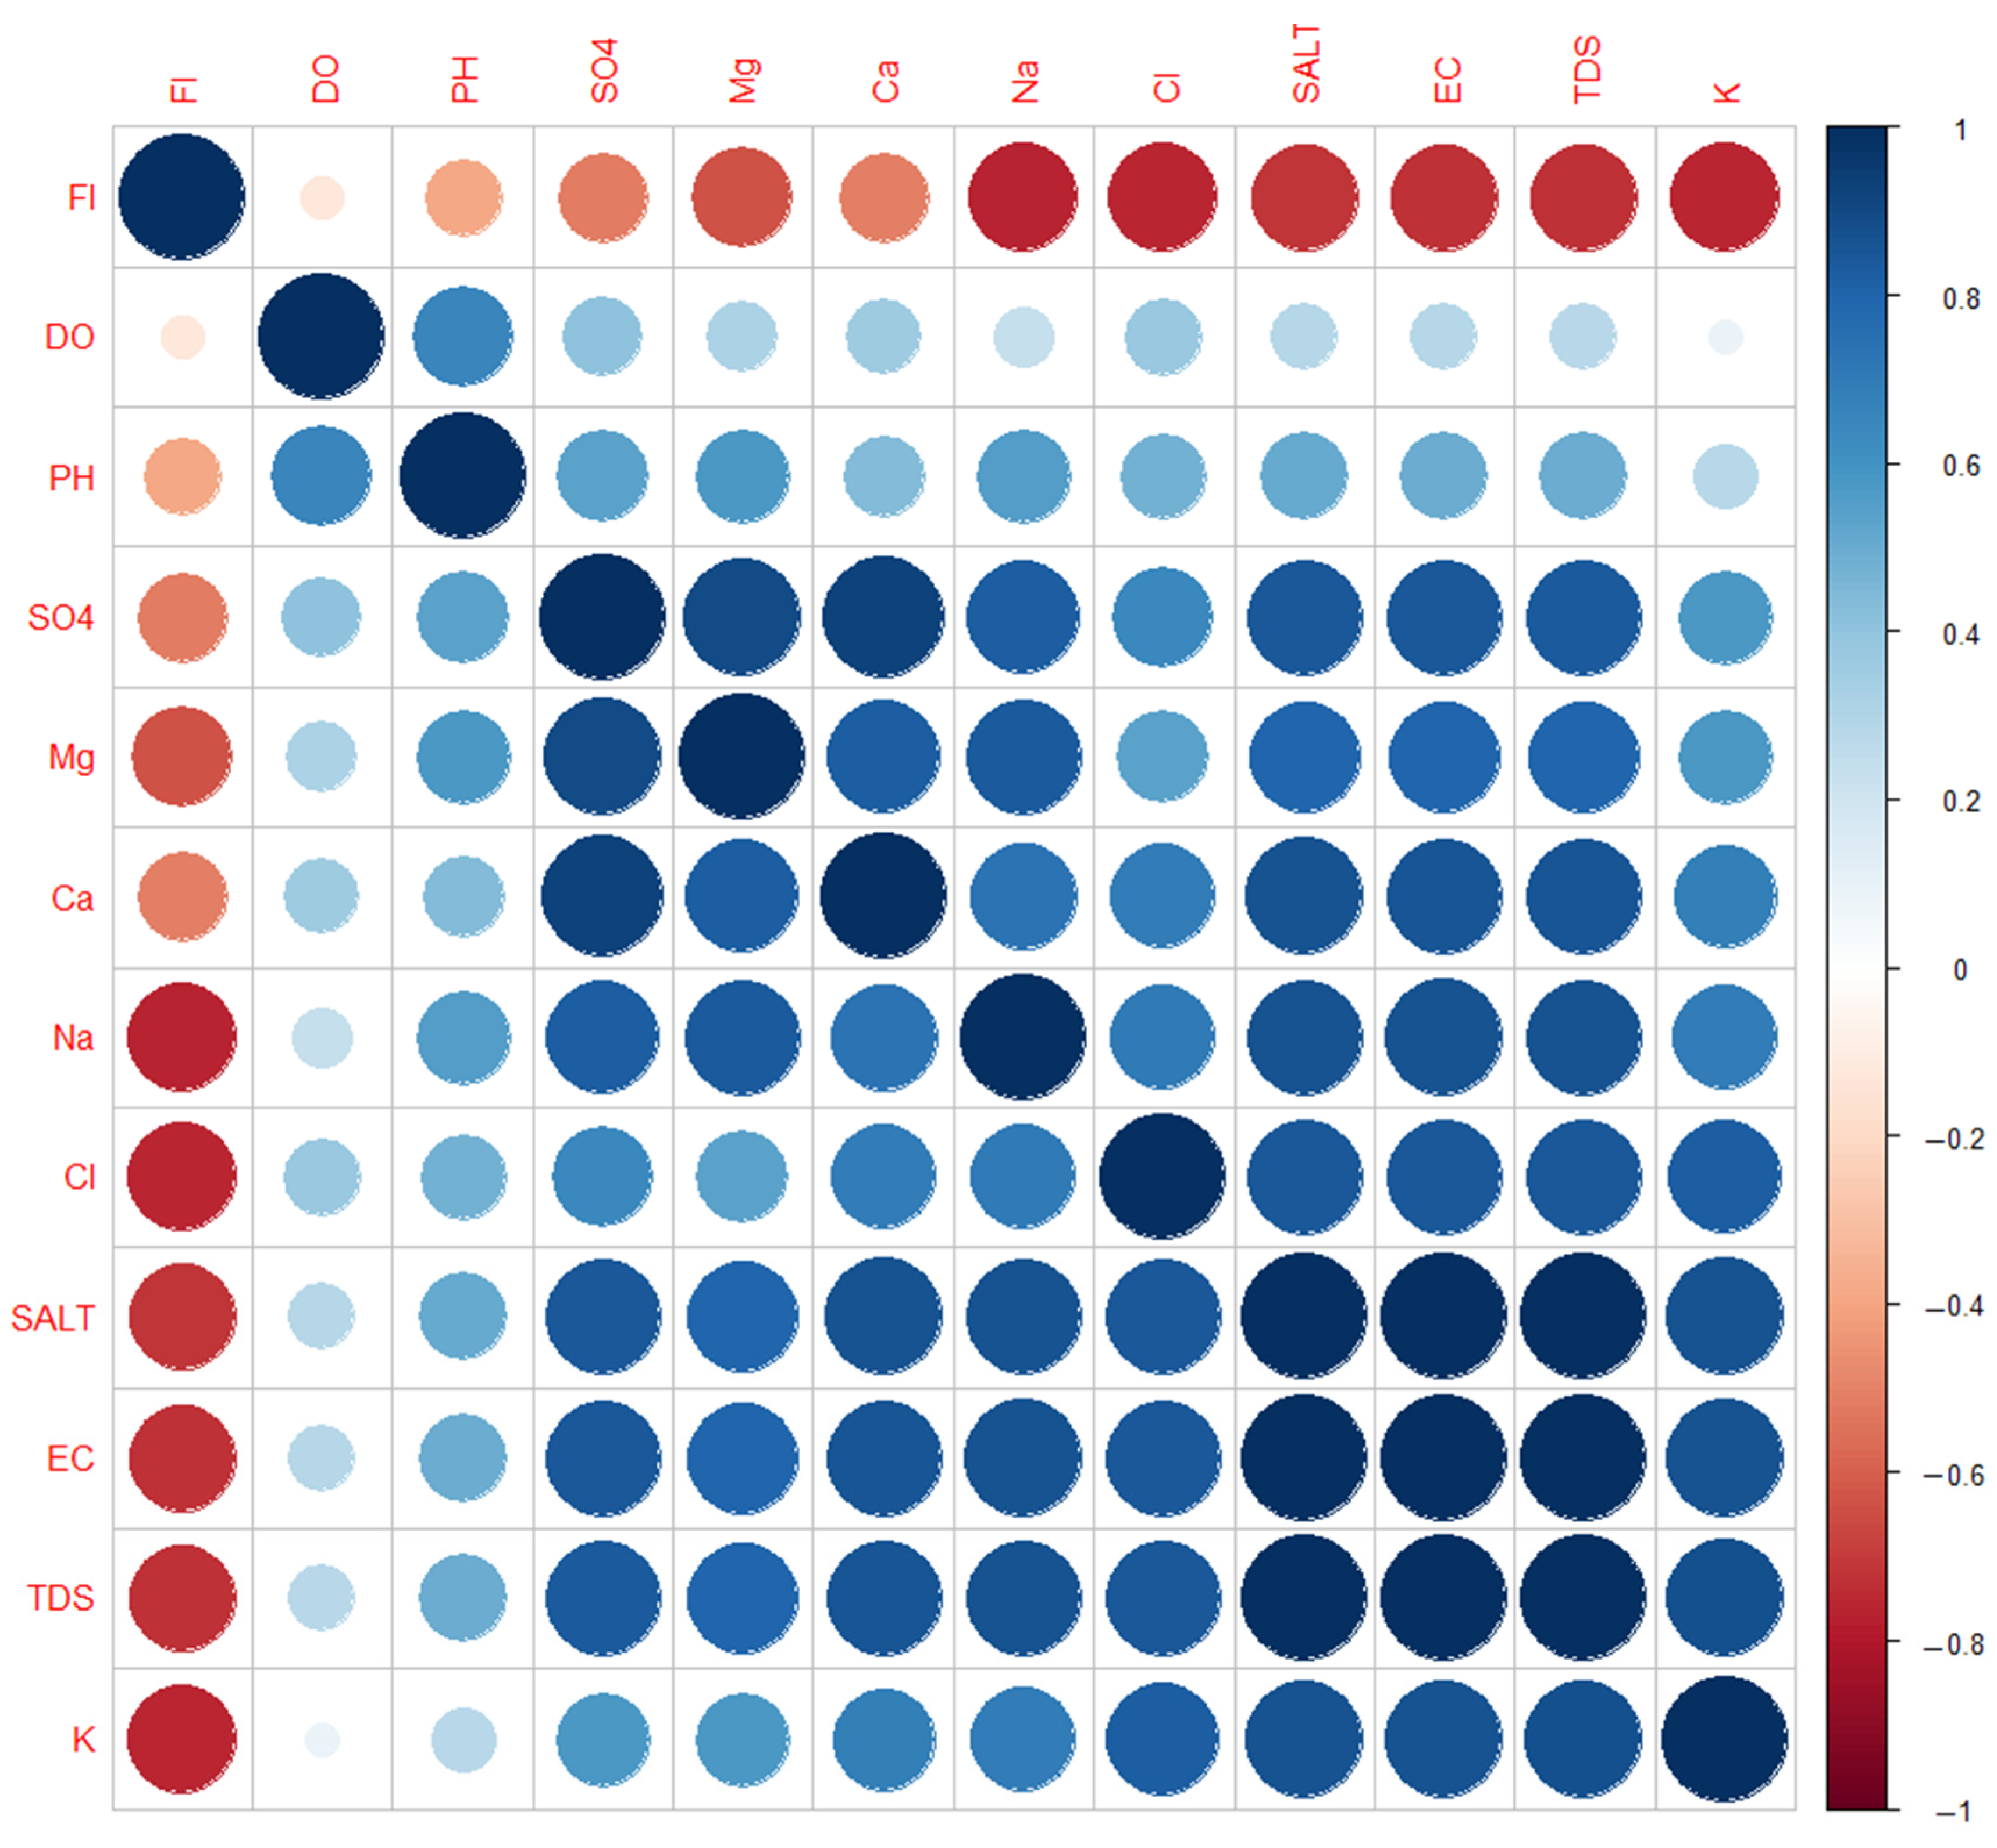
3.3. Associations between Irrigation Water Parameters

Of these 112 correlation tests among physicochemical variables of water samples, 82 were statistically significant (p < 0.05). Most significant associations were positive and were observed between Na+, EC, Cl, K+, Al, Ca2+, Mg2+, and other variables (Figure 6). Figure 6 shows a correlation between trace elements and physicochemical attributes. This information is required to determine the relationship between trace elements, and trace elements and physicochemical attributes. EC was significantly correlated with Ca2+, Mg2+, Na+, K+, Cl, and SO42−, indicating diverse origins of salinity. Correlations revealed that water pH was negatively associated with F, Pb, Cu, and Cd. Of the 76 correlation tests between irrigation water quality indices, 68 were statistically significant (p < 0.05). Only three correlations were not statistically significant (Figure 7). Most of these correlations were significant. Besides, pH was positively correlated with TH, MAR, SAR, MH, and IWQI (Figure 7). Figure 7 reveals correlations between irrigation quality indices and physicochemical attributes. Here it shows the association between irrigation indices with physicochemical attributes.

3.4. Irrigation Water and Physicochemical Parameter Associations

The RDA examining associations between irrigation water indices and physicochemical parameters showed that the elucidated controlled eigen values for the axes were 45.26% and 17.82% for the first and second axes, respectively (Figure 8). Physicochemical parameters were positively associated with Mg2+ and Ca2+ that were placed on the positive edge of the axis along with some irrigation quality parameters (IWQI, SSP, MAR, SAR, Na%, KR, and MH). Based on the first RDA axis, all trace metals (e.g., Pb, Se, Al, Zn, B, Ni, Cd, Mn, Cu, and Fe) were positively associated with F and Cl, including irrigation water quality indices (e.g., SSP, MAR, MH, KR, IWQI, SAR, Na%). pH was placed on the positive edge of the second RDA axis, which indicated that it was positively associated with DO, TH, and SO42− (Figure 8). On the second RDA axis, Na+ and K+ correlated negatively with EC, salt, and TDS. The RDA biplot demonstrated that on the first axis, irrigation water quality indices were favorably connected, while on the second axis, they were inversely correlated with EC, TDS, and salt. The latter indices, such as Cl, F, Ca2+, and Mg2+, increased in accordance with the increase in the trace metals.

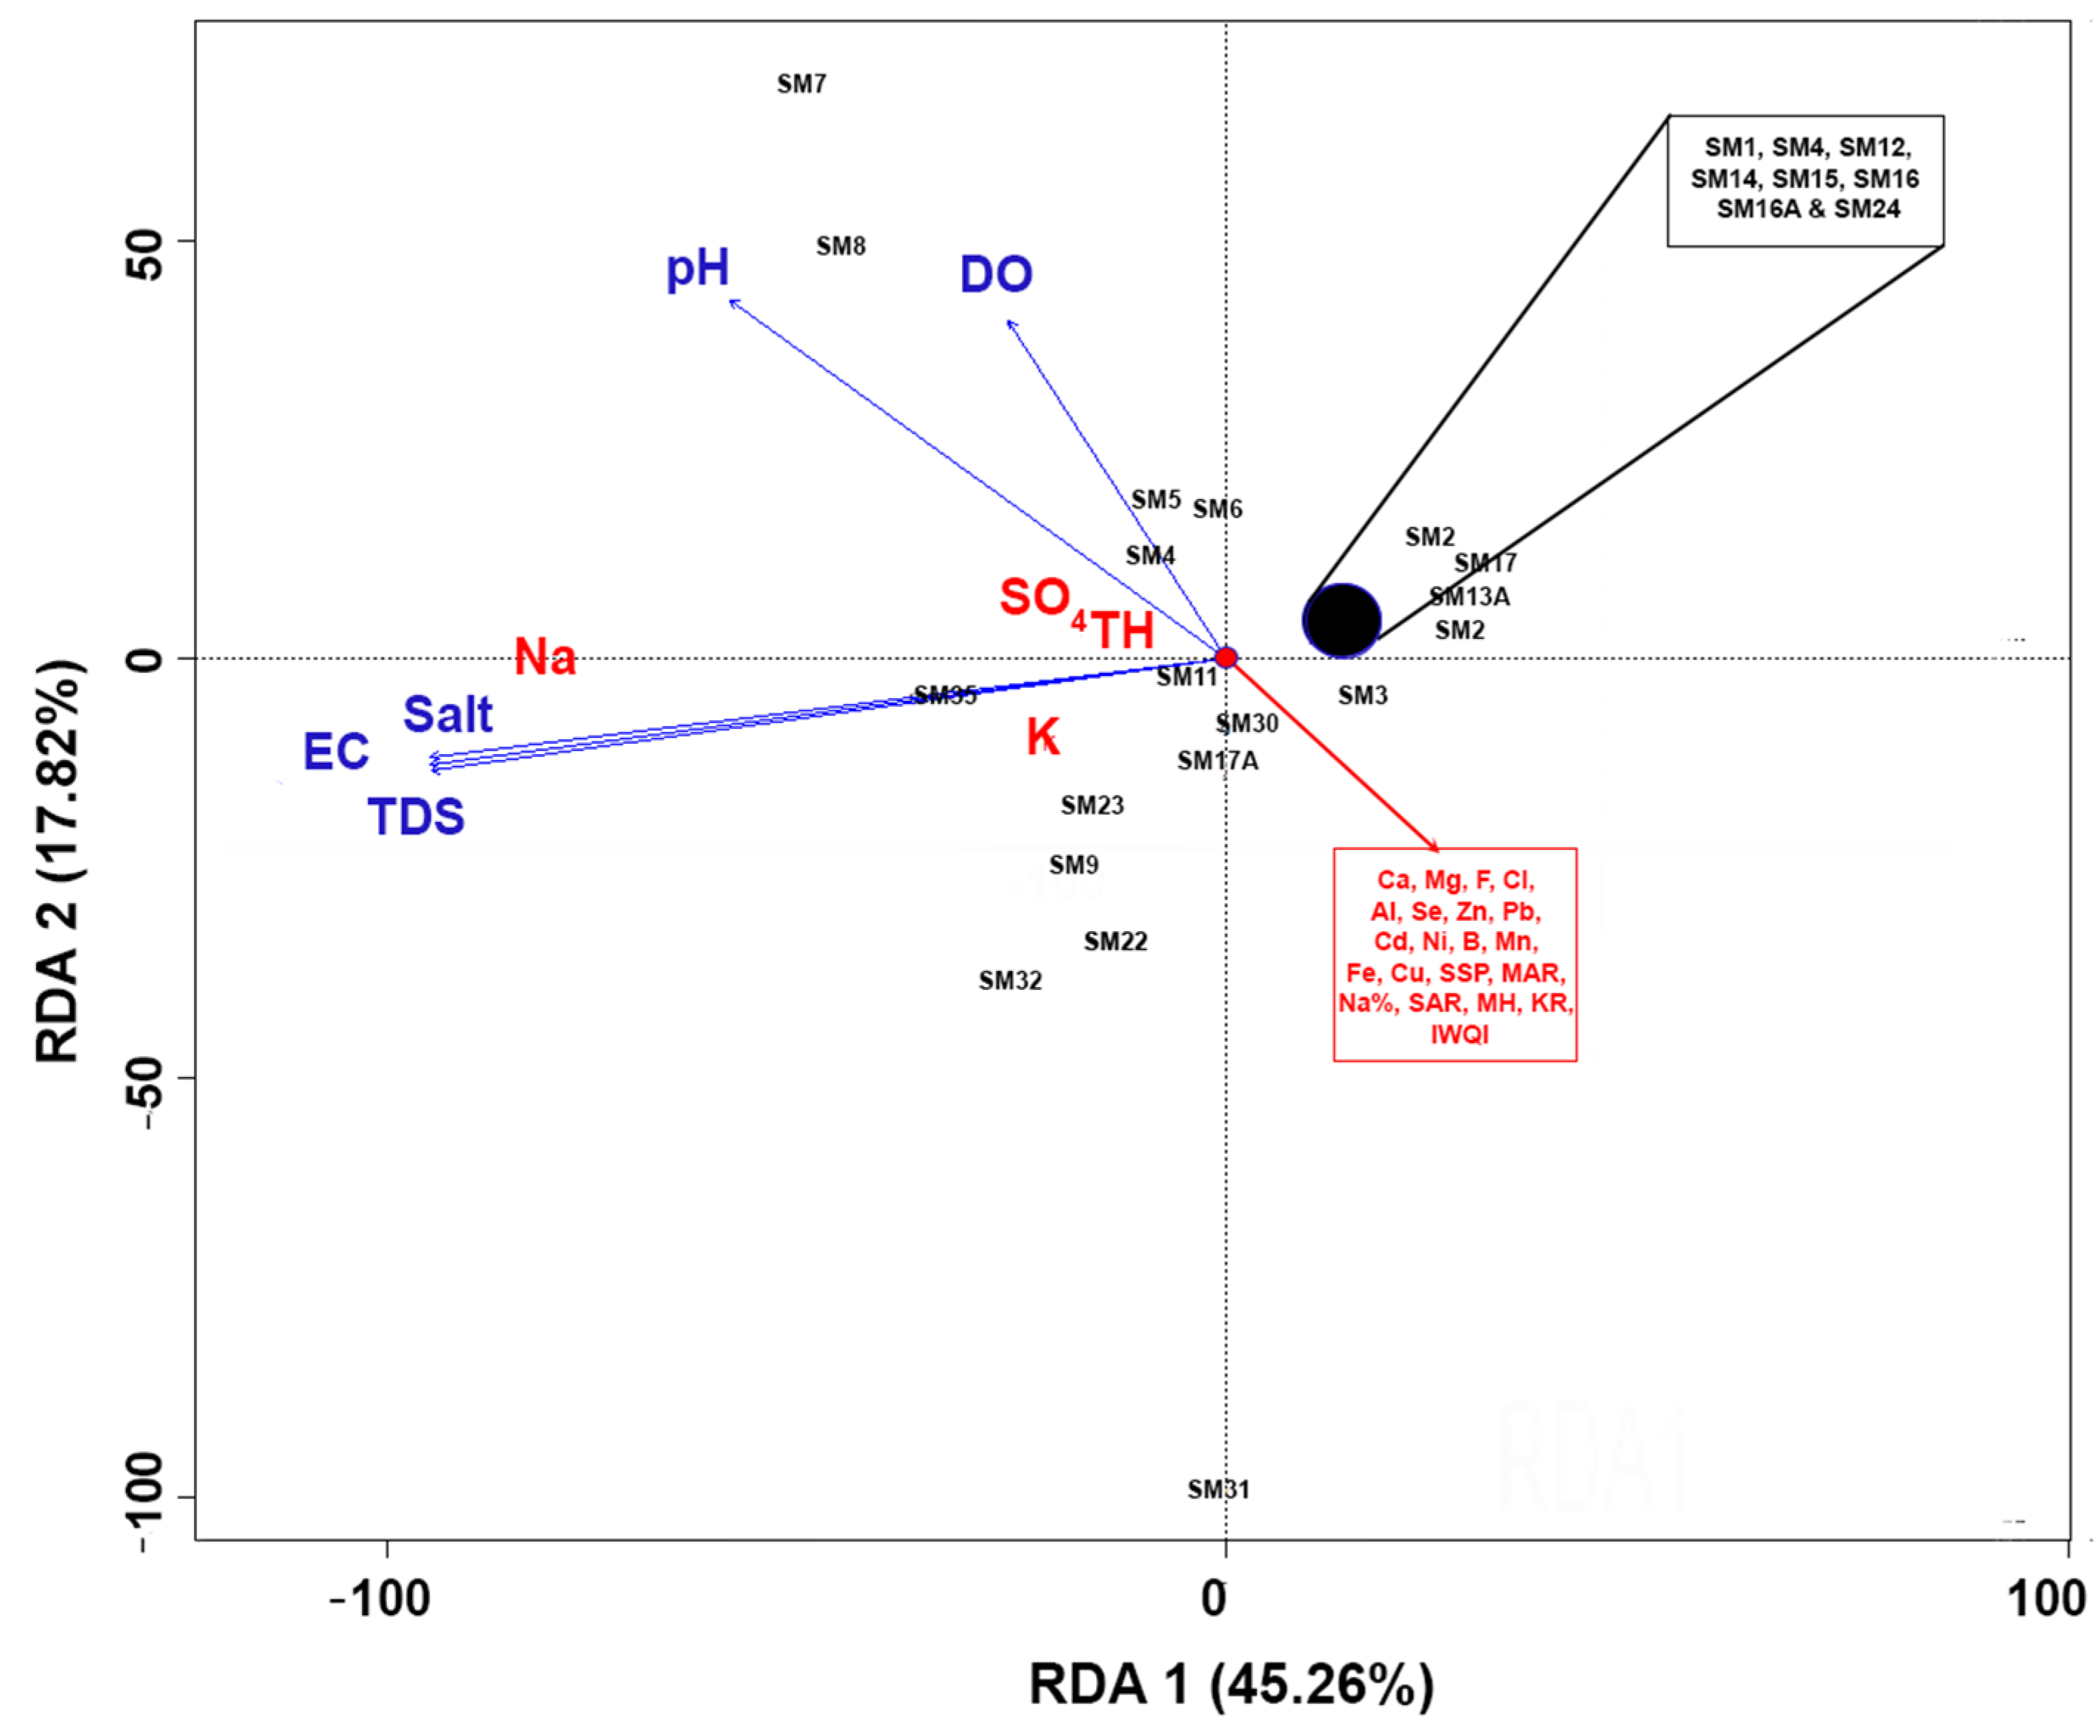
3.5. Impacts of Irrigation Water Variables on Physicochemical Properties

The generalized linear models (GLM) revealed that DO was insignificantly and positively influenced by water SO42− and Pb-concentrations (p < 0.05) (Table 4). In addition, the GLMs showed that EC was negatively influenced by water Na+ and Cu concentrations (p < 0.05). Besides, EC was positively and negatively associated with K+ and Al content (p < 0.05). That means EC significantly increased with the increase in water K+ concentration and the decrease in Al content. Similar to EC, TDS and salt were significantly and positively associated with K+ (p < 0.05). However, the impacts of other physicochemical parameters on EC and TDS were insignificant (p > 0.05). The GLMs model found that salt had a negative effect on the amount of Fe, Ni, Se, and Al in the body (p < 0.05).

4. Discussion

The Asir region’s dam water quality evaluation shows substantial variance in water physicochemical characteristics across research locations. The water is SO42−, Cl, Na+, and K+, with cations Na+ > K+ > Ca2+ > Mg2+ and anions SO42− > Cl > F. Na+ and K+ concentrations in surface water around the research area may be increased by human activities as well as seepage of salty water from nearby rivers. The excessive amount of Na+ in the dam water can trigger due to natural sources e.g., evaporation, agricultural inputs, and carbonate weathering processes. The leaching of salty wastes from the soil by precipitation may also contribute to the water’s chemical composition. The SO42− adsorption occurred from the atmosphere or breakdown of organic materials in the recharge zone. Additionally, SO42− content might be increased because of organic dimethyl sulphide gas, which raises the SO42− in surface water. The excessive SO42− could be contributed to the dissolution of gypsum from the salty Asir area [6].
Surface water chemistry is influenced by a variety of factors, including geological conditions, chemical weathering of various rocks, and the impact of external contamination sources [16,17,18]. The related factors and their associations generate complicated water chemistry. Weathering is the geogenic chemical process that is driven by the solute content along the surface water flow direction. Silicate weathering may occur from precipitation saturated with SO42− and developing in rich sulfuric acid. This acid affects the dissolution of silicate minerals in the water system [8]. When in contact with groundwater, the surface water in the Asir region undergoes halite and silicate mineral dissolution.
In the dam water, there were modest amounts of trace metals such as Pb and Se, as well as significant levels of EC. EC, MH, KR, and MAR indices indicated it was suitable for irrigation, but SAR and Na percent readings indicated it was unsuitable for agriculture. The salinity hazard index revealed that most water samples (80%) were inappropriate for irrigation.
According to the FAO [42] standard level, irrigation water upstream of the Asir area is severely salty, with EC values above 3000 uS/cm. Continuous irrigation with salty water may cause soil salinization. In Algeria, irrigation with high saline water was reported by Merouche et al. [13] and Bouaroudj et al. [3] Etteieb [14] and Siddique et al. [12] also found similar results in the Uyyakondan channel in southern India and central Bangladesh., The salinity issue arises when the salt concentration of the soil solution exceeds the crop’s minimal salt tolerance thresholds, which vary by crop type. Soil salinity reduces soil production [15]. Moreover, the pH of surface waters in the research areas was found to be somewhat alkaline like that of Bassuony et al. [43] for water samples from Egypt’s northeast Delta, Bouaroudj et al. [3] for Beni Haroun dam water in Algeria, and Shammi et al. [44] for surface water in Khulna District, Bangladesh. Except for a few locations (SM5, SM8), irrigation water with a pH outside the typical range [6.0–8.5] might cause nutritional imbalances, whereas pH below this range can cause irrigation pipe corrosion [19]. Previous research has shown that irrigation raises pH in the soil [4]. High levels of basic cations like Na and K in water may make soil more alkaline and speed up denitrification, which produces hydroxyl ions. Ammonium nitrification may also make soil more alkaline. In contrast, Ahmed et al. [25] observed that SO42− and TH raised water pH.
In general, salt dilutes in water. Unless leached, salts build in evapotranspiration to toxic levels for plants. In irrigation water, water factors affect physicochemical qualities. The rate of water drainage, which is directly proportional to the intensity of irrigation, affects the vertical distribution of these salts in water [2]. High temperatures affect gas solubility, salt dissociation, and pH determination [27]. High temperatures impact water electrical conductivity by increasing salt mobility [45], and pH by shifting the calco-carbonic equilibrium towards carbonate production [45].
Our samples exhibited significant SO42−and Cl levels, affecting crop output and quality. The high SO42−and Cl level in Asir surface water is consistent with prior research [19]. Alarmingly, rising SO42− levels may be linked to increased water contamination from unregulated industrial wastewater discharges. High-content Cl may be hazardous to plant development. Even moderately resistant plants suffer when Na+ and K+ content surpasses FAO [42] recommendation ranges (900 and 2 mg/L). Root and leaf ingestion at these amounts may cause Na+ poisoning [1]. Water with high Na+ content helps dissolve anhydrite and halite [8].
Our samples had significant levels of SO42−, a byproduct of fertilizer usage. The SO42− values in the study region’s surface water are lower than FAO standards [42], and even lower than those reported from the Medjerda River in Tunisia [14]. Sulfate fertilizer is used extensively in intensive farming, resulting in high quantities of SO42− in surface water. Excess SO42− ions enter surface waters after rain [46]. The examined dam’s Cl contents are greater than those in the Faridpur district, central Bangladesh [2]. Ca2+, K+, Na+, and F irrigation water causes a white color on fruits and plants, lowering their quality [28].
During the present investigation, only 40% of the Asir area dam water samples were classified as excellent or good for irrigation. Surprisingly, 58% of water samples from the Beni Haroun Dam in eastern Algeria were rated as “excellent” or “good” [3]. According to IWQI, 63% of the samples in Asir were suitable for irrigation. SAR and Na% were categorized as suspicious in this study’s samples. Except for B and Cu, trace metal concentrations were low throughout the investigation. The levels of Cd and Pb in this research were lower than those in Bangladeshi surface water [12]. However, these levels are below the FAO’s recommended limits (0.01% Pb, 0.003% Cd). A modest excess of dissolved trace elements may trigger bioaccumulation in plant tissue, causing mild to major plant damage and subsequent crop loss [10].
In the Asir region, more dams for agricultural use, as suggested by a few studies in arid and semi-arid areas [4,5], could help grow crops and keep soil from being lost. The artificial recharge method can be utilized for the study region to reduce the sodium hazard. Furthermore, some researchers reported that advanced irrigation techniques like micro-irrigation and drip-irrigation [15] could reduce the effects of irrigation water pollutants and soil losses while increasing crop productivity. An econometric analysis of these methods is suggested before using the models on a large scale. Our work is aligned with the earlier studies [2,3,7]. However, they did not show the effects of metals or ions on irrigation water quality. The assessment of surface water appropriateness for irrigation purposes can be more robust when the soil physicochemical parameters of the field survey are identified. Thus, future research on the soil parameters is also suggested for the current study region.

5. Conclusions

For the first time, this study aims to evaluate the surface dam water quality in the Asir region based on physiochemical variables and irrigation water quality indices. This implies that surface water can be utilized for irrigation purposes with specific precautions. This study shows that the order of abundance of ions in tested surface water samples is Na+ > K+ > Ca2+ > Mg2+ > and major anions are SO42− > Cl > F, respectively. The Piper diagram depicts that the main water type was Na–K–SO42–. Between C1 and C2 there were substantial variations in irrigation quality indicators (Na%, SAR, MH, MAR, SSP, EC, and KR). Most irrigation indices in clusters C1 and C3 were greater than in C2. Richard Diagram recognized five classes of water: (i) C1S3 had moderate or poor quality in 3.7% of samples, (ii) C2S1 (11.11%) had poor or bad quality, (iii) C2S4 (25.93%) had very bad quality, (iv) C3S4 (44.44%) was considered inappropriate, and (v) C4S4 (7.4%) was deemed unfit for irrigation. According to the IWQI results, 63% of the samples belonged to the high suitability water type, whereas 37% belonged to the low suitability water type for irrigation usage. According to the RDA findings, most of the irrigation index parameters had a positive significant connection with each other and may have come from comparable origins. Except for SAR and Na%, the EC, SSP, MH, MAR, and KR values in this investigation indicated that the surface water samples belonged to appropriate classes for irrigation usage. An increase in pH, DO, TH, and SO42−, and a decrease in EC and salt were found in the RDA biplot. Due to the lack of groundwater resources in Saudi Arabia, particularly in the Asir region, dam water can be used for irrigation with precautionary measures. Continuous monitoring of irrigation water quality and variability is important to protect this valuable resource from being polluted and contaminated by soils that are nearby.

Supplementary Materials

The following supporting information can be downloaded at: https://www.mdpi.com/article/10.3390/w14091439/s1, Figure S1: Spatial distribution of the 27 dams in the Asir region, Figure S2: Lithological map of the study area. Table S1: Physicochemical parameters and trace metals of the tested water samples in the Asir region, Table S2: ANOVAs testing spatial and temporal variations of water physicochemical parameters in the Asir region.

Author Contributions

Conceptualization, M.A. (Majed Alsubih) and J.M.; Data curation, J.M., A.R.M.T.I. and M.A. (Mohd. Ahmed); Formal analysis, M.A. (Majed Alsubih), J.M., A.R.M.T.I., S.T. and M.A. (Mohd. Ahmed); Funding acquisition, J.M.; Investigation, M.K.A.; Methodology, J.M. and A.R.M.T.I.; Project administration, M.A. (Majed Alsubih), J.M. and M.K.A.; Resources, M.A. (Majed Alsubih), A.R.M.T.I., M.K.A. and N.B.K.; Software, J.M. and S.T.; Supervision, M.A. (Majed Alsubih), J.M. and M.K.A.; Validation, N.B.K.; Visualization, A.R.M.T.I.; Writing—original draft, J.M. and A.R.M.T.I.; Writing—review and editing, M.A. (Majed Alsubih), M.K.A., N.B.K. and S.T. All authors have read and agreed to the published version of the manuscript.

Funding

Funding for this research was given under award numbers IFP-KKU-2020/13 by the deputyship for research & innovation, Ministry of education in Saudi Arabia.

Data Availability Statement

Not applicable.

Acknowledgments

The authors extend their appreciation to the deputyship for research & innovation, Ministry of education in Saudi Arabia for funding this research work through the project number IFP-KKU-2020/13.

Conflicts of Interest

The authors declare no conflict of interest.

References

  1. Siddique, M.A.B.; Khan, R.; Islam, A.R.M.T.; Alam, M.K.; Islam, M.S.; Hossain, M.S.; Habib, M.A.; Akbor, M.A.; Bithi, U.H.; Rashid, M.B.; et al. Quality assessment of freshwaters from a coastal city of southern Bangladesh: Irrigation feasibility and preliminary health risks appraisal. Environ. Nanotechnol. Monit. Manag. 2021, 16, 100524. [Google Scholar] [CrossRef]
  2. Safiur Rahman, M.; Saha, N.; Islam, A.R.M.T.; Shen, S.; Bodrud-Doza, M. Evaluation of Water Quality for Sustainable Agriculture in Bangladesh. Water Air Soil Pollut. 2017, 228, 385. [Google Scholar] [CrossRef]
  3. Bouaroudj, S.; Menad, A.; Bounamous, A.; Ali-Khodja, H.; Gherib, A.; Weigel, D.E.; Chenchouni, H. Assessment of water quality at the largest dam in Algeria (Beni Haroun Dam) and effects of irrigation on soil characteristics of agricultural lands. Chemosphere 2019, 219, 76–88. [Google Scholar] [CrossRef] [PubMed]
  4. Khalaf Ahmed Albaggar, A. Investigation of some physical, chemical, and bacteriological parameters of water quality in some dams in Albaha region, Saudi Arabia. Saudi J. Biol. Sci. 2021, 28, 4605–4612. [Google Scholar] [CrossRef]
  5. Mallick, J.; Kumar, A.; Almesfer, M.K.; Alsubih, M.; Singh, C.K.; Ahmed, M.; Khan, R.A. An index-based approach to assess groundwater quality for drinking and irrigation in Asir region of Saudi Arabia. Arab. J. Geosci. 2021, 14, 157. [Google Scholar] [CrossRef]
  6. Mallick, J. Hydrogeochemical characteristics and assessment of water quality in the Al-Saad Lake, Abha Saudi Arabia. Appl. Water Sci. 2017, 7, 2869–2882. [Google Scholar] [CrossRef] [Green Version]
  7. Islam, A.R.M.T.; Shen, S.; Haque, M.A.; Bodrud-Doza, M.; Maw, K.W.; Habib, M.A. Assessing groundwater quality and its sustainability in Joypurhat district of Bangladesh using GIS and multivariate statistical approaches. Environ. Dev. Sustain. 2017, 20, 1935–1959. [Google Scholar] [CrossRef]
  8. Towfiqul Islam, A.R.M.; Shen, S.; Bodrud-Doza, M.; Safiur Rahman, M. Assessing irrigation water quality in Faridpur district of Bangladesh using several indices and statistical approaches. Arab. J. Geosci. 2017, 10, 418. [Google Scholar] [CrossRef]
  9. Ouali, N.; Belabed, B.E.; Chenchouni, H. Modelling environment contamination with heavy metals in flathead grey mullet Mugil cephalus and upper sediments from north African coasts of the Mediterranean Sea. Sci. Total Environ. 2018, 639, 156–174. [Google Scholar] [CrossRef]
  10. Islam, A.R.M.T.; Islam, H.M.T.; Mia, M.U.; Khan, R.; Habib, M.A.; Bodrud-Doza, M.; Siddique, M.A.B.; Chu, R. Co-distribution, possible origins, status and potential health risk of trace elements in surface water sources from six major river basins, Bangladesh. Chemosphere 2020, 249, 126180. [Google Scholar] [CrossRef]
  11. Bodrud-Doza, M.; Islam, A.R.M.T.; Ahmed, F.; Das, S.; Saha, N.; Rahman, M.S. Characterization of groundwater quality using water evaluation indices, multivariate statistics and geostatistics in central Bangladesh. Water Sci. 2016, 30, 19–40. [Google Scholar] [CrossRef] [Green Version]
  12. Siddique, M.A.B.; Islam, A.R.M.T.; Hossain, M.S.; Khan, R.; Akbor, M.A.; Hasanuzzaman, M.; Sajid, M.W.M.; Mia, M.Y.; Mallick, J.; Rahman, M.S.; et al. Multivariate statistics and entropy theory for irrigation water quality and entropy-weighted index development in a subtropical urban river, Bangladesh. Environ. Sci. Pollut. Res. 2021, 29, 8577–8596. [Google Scholar] [CrossRef] [PubMed]
  13. Merouche, A.; Selvam, S.; Imessaoudene, Y.; Maten, C.N. Assessment of dam water quality for irrigation in the northeast of catchment Cheliff-Zahrez, Central Algeria. Environ. Dev. Sustain. 2020, 22, 5709–5730. [Google Scholar] [CrossRef]
  14. Etteieb, S.; Cherif, S.; Tarhouni, J. Hydrochemical assessment of water quality for irrigation: A case study of the Medjerda River in Tunisia. Appl. Water Sci. 2017, 7, 469–480. [Google Scholar] [CrossRef] [Green Version]
  15. Soltani, A.A.; Bermad, A.; Boutaghane, H.; Oukil, A.; Abdalla, O.; Hasbaia, M.; Oulebsir, R.; Zeroual, S.; Lefkir, A. An integrated approach for assessing surface water quality: Case of Beni Haroun dam (Northeast Algeria). Environ. Monit. Assess. 2020, 192, 630. [Google Scholar] [CrossRef]
  16. Apollaro, C.; Fuoco, I.; Bloise, L.; Calabrese, E.; Marini, L.; Vespasiano, G.; Muto, F. Geochemical modeling of water-rock interaction processes in the Pollino National Park. Geofluids 2021, 2021, 1–17. [Google Scholar] [CrossRef]
  17. Wu, J.; Li, P.; Wang, D.; Ren, X.; Wei, M. Statistical and multivariate statistical techniques to trace the sources and affecting factors of groundwater pollution in a rapidly growing city on the Chinese Loess Plateau. Hum. Ecol. Risk Assess. Int. J. 2019, 26, 1603–1621. [Google Scholar] [CrossRef]
  18. Fuoco, I.; Apollaro, C.; Criscuoli, A.; De Rosa, R.; Velizarov, S.; Figoli, A. Fluoride Polluted Groundwaters in Calabria Region (Southern Italy): Natural Source and Remediation. Water 2021, 13, 1626. [Google Scholar] [CrossRef]
  19. Roy, K. Irrigation Water Quality Assessment and Identification of River Pollution Sources in Bangladesh: Implications in Policy and Management. J. Water Resour. Hydraul. Eng. 2015, 4, 303–317. [Google Scholar] [CrossRef]
  20. Sarkar, S.K.; Talukdar, S.; Rahman, A.; Shahfahad; Roy, S.K. Groundwater potentiality mapping using ensemble machine learning algorithms for sustainable groundwater management. Front. Eng. Built Environ. 2021, 2, 43–54. [Google Scholar] [CrossRef]
  21. Batarseh, M.; Imreizeeq, E.; Tilev, S.; Al Alaween, M.; Suleiman, W.; Al Remeithi, A.M.; Al Tamimi, M.K.; Al Alawneh, M. Assessment of groundwater quality for irrigation in the arid regions using irrigation water quality index (IWQI) and GIS-Zoning maps: Case study from Abu Dhabi Emirate, UAE. Groundw. Sustain. Dev. 2021, 14, 100611. [Google Scholar] [CrossRef]
  22. El Osta, M.; Masoud, M.; Alqarawy, A.; Elsayed, S.; Gad, M.; Sa, A.A. Groundwater Suitability for Drinking and Irrigation Using Water Quality Indices and Multivariate Modeling in Makkah Al-Mukarramah Province, Saudi Arabia. Water 2022, 14, 483. [Google Scholar] [CrossRef]
  23. Mallick, J.; Singh, C.K.; AlMesfer, M.K.; Kumar, A.; Khan, R.A.; Islam, S.; Rahman, A. Hydro-Geochemical Assessment of Groundwater Quality in Aseer Region, Saudi Arabia. Water 2018, 10, 1847. [Google Scholar] [CrossRef] [Green Version]
  24. Mora, A.; Mahlknecht, J.; Rosales-Lagarde, L.; Hernández-Antonio, A. Assessment of major ions and trace elements in groundwater supplied to the Monterrey metropolitan area, Nuevo León, Mexico. Environ. Monit. Assess. 2017, 189, 394. [Google Scholar] [CrossRef] [Green Version]
  25. Ahmed, I.A.; Shahfahad, S.; Baig, M.R.I.; Talukdar, S.; Asgher, M.S.; Usmani, T.M.; Ahmed, S.; Rahman, A. Lake water volume calculation using time series LANDSAT satellite data: A geospatial analysis of Deepor Beel Lake, Guwahati. Front. Eng. Built Environ. 2021, 1, 107–130. [Google Scholar] [CrossRef]
  26. An, N.N.; Nhut, H.S.; Phuong, T.A.; Huy, V.Q.; Hanh, N.C.; Thao, G.T.P.; Trinh, P.T.; Hoa, P.V.; Bình, N.A. Groundwater simulation in Dak Lak province based on MODFLOW model and climate change scenarios. Front. Eng. Built Environ. 2022, 2, 55–67. [Google Scholar] [CrossRef]
  27. Rodier, J.; Legube, B.; Merlet, N. L’analyse de L’eau. 2009. Available online: https://www.oieau.fr/ReFEA/fiches/AnalyseEau/AnalyseEau_PresGen.pdf (accessed on 12 January 2022).
  28. Ayers, R.S.; Westcot, D.W. Water Quality for Agriculture, FAO Irrigation and Drainage Paper; Food and Agriculture Organization of the United Nations Rome: Rome, Italy, 1985. [Google Scholar]
  29. Todd, D.K. Groundwater Hydrology, 2nd ed.; John Wiley and Sons, Inc.: Hoboken, NJ, USA, 1980. [Google Scholar]
  30. Raghunath, H.M. Groundwater, 2nd ed.; Wiley Eastern Ltd.: New Delhi, India, 1990. [Google Scholar]
  31. Allison, L.; Bernstein, C.A.; Bower, J.W.; Brown, M.; Fireman, J.T.; Hatcher, H.E.; Hayward, G.A.; Pearson, R.C.; Reeve, L.E.; Richards Wilcox, L.A.; et al. Diagnosis and Improvement of United States Salinity Laboratory Staff. 1954. Available online: https://www.ars.usda.gov/ARSUserFiles/20360500/hb60_pdf/hb60complete.pdf (accessed on 10 January 2022).
  32. Kelley, W.P. Use of Saline Irrigation Watertitle. Soil Sci. Soc. Am. J. 1963, 95, 385–391. [Google Scholar] [CrossRef]
  33. Richards, L.A. Diagnosis and Improvement of Saline Alkali Soils, Agriculture, 160, Handbook 60; U.S. Department of Agriculture: Washington, DC, USA, 1954. [Google Scholar]
  34. Wilcox, L.V. Classification and Use of Irrigation Waters, Circular No. 969; U.S. Department of Agriculture: Washington, DC, USA, 1955. [Google Scholar]
  35. Krishna kumar, S.; Logeshkumaran, A.; Magesh, N.S.; Godson, P.S.; Chandrasekar, N. Hydro-geochemistry and application of water quality index (WQI) for groundwater quality assessment, Anna Nagar, part of Chennai City, Tamil Nadu, India. Appl. Water Sci. 2015, 5, 335–343. [Google Scholar] [CrossRef] [Green Version]
  36. Chandra, D.S.; Raju, M.V.S.; Asadi, S.S. Estimation of Water Quality Index by Weighted Arithmetic Water Quality Index Method: A Model Study. Int. J. Civ. Eng. Technol. 2017, 8, 1215–1222. [Google Scholar]
  37. Şimşek, C.; Gunduz, O. IWQ Index: A GIS-Integrated Technique to Assess Irrigation Water Quality. Environ. Monit. Assess. 2006, 128, 277–300. [Google Scholar] [CrossRef]
  38. R: The R Project for Statistical Computing. Available online: https://www.r-project.org/ (accessed on 19 February 2022).
  39. Islam, A.R.M.T.; Hasanuzzaman, M.; Jaman, M.; Alam, E.; Mallick, J.; Monirul Alam, G.M.; Sattar, M.A.; Techato, K. Assessing Farmers’ Typologies of Perception for Adopting Sustainable Adaptation Strategies in Bangladesh. Climate 2021, 9, 167. [Google Scholar] [CrossRef]
  40. Barakat, A.; El Baghdadi, M.; Rais, J.; Aghezzaf, B.; Slassi, M. Assessment of spatial and seasonal water quality variation of Oum Er Rbia River (Morocco) using multivariate statistical techniques. Int. Soil Water Conserv. Res. 2016, 4, 284–292. [Google Scholar] [CrossRef]
  41. Selvam, S.; Singaraja, C.; Venkatramanan, S.; Chung, S.Y. Geochemical Appraisal of Groundwater Quality in Ottapidaram Taluk, Thoothukudi District, Tamil Nadu using Graphical and Numerical Method. J. Geol. Soc. India 2018, 92, 313–320. [Google Scholar] [CrossRef]
  42. FAO. FAO Water Quality for Agriculture; FAO: Rome, Italy, 1985. [Google Scholar]
  43. Bassuony, M.A.; Ali, M.E.; Abdel Hameed, A.H.; Jahin, H.S. Evaluation of Irrigation Water Quality in Different Regions of North East Delta-Egypt. Int. J. Eng. Appl. Sci. 2014, 5, 10–15. [Google Scholar]
  44. Shammi, M.; Karmakar, B.; Rahman, M.M.; Islam, M.S.; Rahaman, R.; Uddin, K. Assessment of Salinity Hazard of Irrigation Water Quality in Monsoon Season of Batiaghata Upazila, Khulna District, Bangladesh and adaptation strategies. Pollution 2016, 2, 183–197. [Google Scholar]
  45. Guemmaz, F.; Neffar, S.; Chenchouni, H. Physicochemical and Bacteriological Quality of Surface Water Resources Receiving Common Wastewater Effluents in Drylands of Algeria. Handb. Environ. Chem. 2019, 98, 117–148. [Google Scholar]
  46. Guergazi, S.; Harrat, N.; Achour, S. Parametres Organiques et Potentiels de Formation du Chloroforme D’eaux de Surface de L’est Algerien. Courr. Savoir 2013, 7, 45–50. [Google Scholar]
Figure 1. Study Area.
Water 14 01439 g001
Figure 2. Irrigation water quality of estimated based on: Piper diagram.
Water 14 01439 g002
Figure 3. Irrigation water quality showing sodium and salinity hazards for irrigation uses in the analyzed samples of the study area.
Water 14 01439 g003
Figure 4. Boxplots displaying the variation of irrigation water indices analyzed following three cluster sites in the Asir region. Results of two-way ANOVAs are given between brackets as F-statistics (with degrees of freedom of numerator and denominator, respectively), and significance. The same letters associated with average values (white circles) are significantly not different following Tukey’s post-hoc test.
Water 14 01439 g004
Figure 5. Box plots show irrigation water indices in study area. Unit of RSBC, EC, and TH are mg/L, μs/cm, and mg/L, respectively. According to the similar concentration the plots have been displayed as (a) DO, pH and KR, (b) TH, TDS and EC, (c) MAR, MH, IWQI, SAR and (d) Na% and SSP.
Water 14 01439 g005
Figure 6. Correlation matrix between physicochemical parameters and trace metals, Pearson correlation test values are shown as correlation coefficients (above diagonals and shown by color and intensity of shading in pie charts and squares) and p-values (below diagonal).
Water 14 01439 g006
Figure 7. Correlation matrix between physicochemical parameters and indices of irrigation water, Pearson correlation test values are presented as correlation coefficients (above diagonals and shown by color and intensity of shading in pie charts and squares) and p-values (below diagonal).
Water 14 01439 g007
Figure 8. Redundancy analysis diagram showing associations between water physicochemical parameters and toxic metals in the study area.
Water 14 01439 g008
Table 1. Guidelines for the interpretation of irrigation water quality according to FAO [28] (EC: electrical conductivity, SAR: sodium absorption ratio).
Potential Irrigation ProblemsUnitRestriction on Irrigation
No ProblemGrowing ProblemSerious Problem
Salinity: ECmS/cm<0.70.7–3.0>3.0
Total dissolved solids (TDS)mg/L<450450–2000>2000
Infiltration:
EC (SAR=0–3)mS/cm>0.70.7–0.2<0.2
EC (SAR=3–6)mS/cm>1.21.3–0.3<0.3
EC (SAR=6–12)mS/cm>1.91.9–0.5<0.5
EC (SAR=12–20)mS/cm>2.92.9–1.3<1.3
EC (SAR=20–40)mS/cm>5.05.0–2.9<2.9
Toxicity of certain ions (affecting sensitive crops)
Sodium: surface irrigation
Sodium: irrigation by sprinkling
SAR
meq/L
3
<3
3–9
>3
>9
Chloride: surface irrigation
Chloride: irrigation by sprinkling
meq/L
meq/L
<4
<3
4–10
>3
>10
Boronmg/L<0.70.7–3.0>3.0
Various effects
Nitrogen (NO3–N)mg/L<55–30>30
Bicarbonate (HCO3)meq/L<1.51.5–8.5>8.5
pHunitlessNormal range: 6.5–8.4
Table 2. Physico-chemical parameters and trace metals of analyzed water samples in the study.
C1C2C3All SitesStandard Values ([39])
Mean ± Std. Dev.Mean ± Std. Dev.Mean ± Std. Dev.Mean ± Std. Dev.
DO6.99 ± 2.276 ± 1.999.72 ± 1.076.46 ± 2.19-
pH7.97 ± 0.757.39 ± 0.678.83 ± 0.37.61 ± 0.776.0–8.5 a
EC1348.2 ± 559.22649.1 ± 463.012340 ± 56.57903.81 ± 671.893000 a
TDS902.4 ± 373.21434.9 ± 310.471555 ± 49.5604.44 ± 447.942000 a
SALT674 ± 295.19319.25 ± 234.431205 ± 21.21450.56 ± 346.74-
Ca2+128.61 ± 60.453.26 ± 23.95288.96 ± 67.884.67 ± 74.15400 a
Mg2+88.31 ± 29.6217.48 ± 14.09153.7 ± 22.3740.69 ± 46.1860 a
K+932.78 ± 725.2390.06 ± 373.5999.59 ± 60.43535.72 ± 496.172 a
Na+2872.6 ± 1262.741483.88 ± 1350.956203.53 ± 137.572090.65 ± 1811.56900 a
F0.42 ± 0.352.43 ± 1.720.43 ± 0.011.91 ± 1.731.5 b
Cl146.14 ± 121.7379.32 ± 88.03271.98 ± 0.74105.96 ± 104.5250 b
SO42−348.44 ± 142.6264.45 ± 81.621293.87 ± 1.62208.11 ± 344.01500 b
Al0.63 ± 0.551.65 ± 2.70.11 ± 0.021.34 ± 2.380.2 b
Se0.15 ± 0.090.3 ± 0.250.07 ± 0.090.26 ± 0.230.01 b
Zn0.14 ± 0.240.22 ± 0.490.06 ± 00.19 ± 0.443 b
Pb0.24 ± 0.230.23 ± 0.190.07 ± 0.060.22 ± 0.190.01 b
Cd0.04 ± 0.020.12 ± 0.080.02 ± 0.010.1 ± 0.080.003 b
Ni0.27 ± 0.20.29 ± 0.320.03 ± 0.010.27 ± 0.290.02 b
B28 ± 17.841.6 ± 57.234 ± 0.1138.5 ± 49.70.3 b
Mn0.14 ± 0.088.96 ± 39.60.08 ± 0.046.67 ± 340.5 b
Fe0.41 ± 0.362.18 ± 6.250.09 ± 01.7 ± 5.41-
Cu3.86 ± 4.376.63 ± 3.080.4 ± 0.055.66 ± 3.662 b
TH684.89 ± 177.14205.05 ± 94.391354.8 ± 261.55379.07 ± 358.45-
SSP94.44 ± 1.2384.3 ± 26.6894.22 ± 1.0586.92 ± 23.26-
MAR42.08 ± 12.2123.49 ± 13.6734.93 ± 2.0627.78 ± 14.73-
Na%91.26 ± 2.0580.32 ± 28.6691.62 ± 1.3783.18 ± 25.01-
SAR47.86 ± 17.2739.68 ± 31.2773.71 ± 5.5243.71 ± 29.1-
MH53.81 ± 13.1632.43 ± 15.246.9 ± 2.2637.46 ± 16.54-
KR9.29 ± 3.0412.62 ± 8.5910.12 ± 1.7311.82 ± 7.58-
a FAO [42] Water quality for agriculture. Food and Agriculture Organization; b WHO (1993) Guidelines for drinking-water quality, 2nd edn. World Health Organization, Geneva.
Table 3. Classes of quality indices applied for irrigation water in the study area.
Quality Indices [Unit]ValuesClasses of Quality or SuitabilityFrequency of Water Samples [%]
C1C2C3All Sites
EC [uS/cm]<250C1: Excellent015011.11
[250–750]C2: Good050037.04
[750–2250]C3: Eligible10035044.44
[2250–5000]C4: Not recommended001007.41
>5000C5: Unsuitable (bad)0000
Na [%]<20Excellent0503.7
[20–40]Good01007.41
[40–60]Eligible0000
[60–80]Not recommended0000
>80Unsuitable (bad)1008510088.89
SAR [meq/L]<10Excellent020014.81
[10–18]Good0000
[18–26]Uncertain2015014.81
>26Unsuitable806510070.37
KR [meq/L]<1Suitable015011.11
>1Unsuitable1008510088.89
MH [%] <50Suitable4090100100
>50Unsuitable601000
TH (ppm)<75 Soft 0503.7
[75–150]Moderately hard030022.22
>150–300Hard040029.63
>300 Very hard1002510044.44
SSP (meq/L)<20Excellent0503.7
[20–40]Good01007.41
[40–80]Fair0000
>80Poor1008510088.89
MAR (meq/L)<50Excellent809010088.89
>50Causes harmful effect to soil2010011.11
IWQI<22Low Suitability050037.04
[22–37]Medium Suitability015011.11
>37High Suitability1003510051.85
Table 4. Generalized linear model (GLM) testing the effects of toxic metals and physiochemical parameter on the variation of irrigation water quality indices. Model parameters were selected using the ‘backward/forward’ stepwise procedure based on the Akaike information criterion (AIC).
Water Quality ParametersMetalsEst.2.5% CI97.5% CISEt-ValuepSig.
DO(Intercept)10.2304.73415.7212.4293.9150.002**
Pb500.700−564.7581566.180471.0001.0630.347n.s.
SO42−0.007−0.0020.0160.0041.8400.099n.s.
pH(Intercept)9.5567.81411.2980.77012.4090.000***
Cu−21.190−39.131−3.2517.930−2.6720.026*
Na+−0.001−0.0010.0000.000−2.5040.034*
EC(Intercept)0.271−0.0160.1770.3940.6900.508n.s.
K+0.0010.0020.0020.0002.6220.028*
SO42−0.0010.0000.0000.0010.7950.447n.s.
B0.113−0.5490.7750.2930.3880.707n.s.
Al−1.934−43.90040.03218.550−0.1040.919***
Zn21.750−94.933138.43251.5800.4220.683n.s.
Ni−68.930−270.050132.18388.900−0.7750.458n.s.
Se−20.900−98.80757.00234.440−0.6070.559n.s.
Mn0.607−5.7636.9782.8160.2160.834n.s.
TDS(Intercept)194.200−4.044154e792.768264.6000.7340.482n.s.
K+0.4596.815119e0.8500.1732.6570.026*
SO42−0.360−6.2001.3400.4330.8310.427n.s.
B75.470−3.696520.564196.8000.3840.710n.s.
Al−1494.000−2.97126,721.99012,470.0000.1209073.000n.s.
Zn14,640.000−6.38193,093.97034,680.0000.4226828.000n.s.
Ni−45,210.000−1.80490,014.31059,780.0000.7564688.000n.s.
Se−13,460.000−6.583685e38,923.22023,150.0000.5815754.000n.s.
Mn387.400−3.8964670.6921893.0000.2058424.000n.s.
SALT(Intercept)95.670−347.530538.879195.9000.4880.637n.s.
K+0.3520.6410.6410.1282.7530.022*
SO42−0.2440.9700.9700.3210.7600.467n.s.
B31.920361.471361.471145.7000.2190.832n.s.
Al−143.40020,748.37020,748.3709235.0000.0160.988n.s.
Fe−1700.00024,398.87024,398.87011,540.0000.1470.886n.s.
Ni−42,530.00057,592.85057,592.85044,260.0000.9610.362n.s.
Se−10,020.0003580.0623580.0627140.0000.5850.573n.s.
(Est.: estimate, 2.5% CI and 97.5% CI: lower and upper bounds of confidence intervals, SE: standard error, p: p-value, Sig.: statistical significance, ***: p < 0.001, **: p < 0.01, *: p < 0.05, ns: p > 0.05).
Publisher’s Note: MDPI stays neutral with regard to jurisdictional claims in published maps and institutional affiliations.

