Article

Bias Adjustment of Four Satellite-Based Rainfall Products Using Ground-Based Measurements over Sudan

by
Magdi S. A. Siddig
1,*,
Salma Ibrahim
1,
Qingchun Yu
1,
Abdelmula Abdalla
2,
Yahia Osman
3,
Isameldin Abakar Atiem
4,
Shindume Lomboleni Hamukwaya
5 and
Mazahir M. M. Taha
6
1
School of Water Resources and Environment, China University of Geosciences (Beijing), Beijing 100083, China
2
Ministry of Transport and Logistic Services (MOTLS), Riyadh 12211, Saudi Arabia
3
Irrigation Engineering and Hydraulics Department, Faculty of Engineering, Alexandria University, Alexandria 22301, Egypt
4
Civil Engineering Department, Faculty of Engineering, University of Nyala, Nyala 63311, Sudan
5
School of Engineering and the Built Environment, University of Namibia, Ongwediva 33004, Namibia
6
Civil Engineering Department, Alzaiem Alazhari University, Khartoum 1432, Sudan
*
Author to whom correspondence should be addressed.
Water 2022, 14(9), 1475; https://doi.org/10.3390/w14091475
Submission received: 15 March 2022 / Revised: 26 April 2022 / Accepted: 2 May 2022 / Published: 4 May 2022
(This article belongs to the Section Hydrology)

Abstract

:
Satellite-based rainfall estimates (SREs) represent a promising alternative dataset for climate and hydrological studies, where gauge observations are insufficient. However, these datasets are accompanied by significant uncertainties. Therefore, this study aims to minimize the systematic bias of Artificial Neural Networks–Cloud Classification System (PERSIANN-CCS), Artificial Neural Networks-Climate Data Record (PERSIANN-CDR), Climate Hazards Group InfraRed Precipitation with Station data (CHIRPS), and Global Precipitation Climatology Project (GPCP) rainfall estimates using a quantile mapping (QM) method with climatic zones (CZs). The adjusted rainfall estimates were evaluated for the period from 2003–2017; data from 2003 to 2016 were used for calibration, and data from 2017 were used for validation. The results revealed significant improvements for the adjusted PERSIANN-CCS, PERSIANN-CDR, CHIRPS, and GPCP monthly time series in terms of all statistical measures and evaluation of overall CZs. In terms of Root Mean Square Errors (RMSEs), the adjusted CHIRPS did not show an improvement. This method successfully removed the mean bias of the daily time series for all SREs. The findings suggest that this method can be applied to correct the systematic bias of all SREs in the monthly time series in the future without the need for further gauge measurements over Sudan.

Graphical Abstract

1. Introduction

Precipitation is an essential meteorological factor in hydrologic processes, and accurate estimates are critical in hydrological and climate research. Rain gauges offer the most precise rain measurements [1,2,3,4,5,6,7,8,9]. Studies of hydrological and climate conditions need spatial rather than point inputs. However, rain gauge readings are questionable when data are moved to ungauged areas, limiting the rain gauge’s ability to cover a larger area [10,11,12,13].
Satellite estimates are a promising alternative to precipitation measurements in regions where gauge observations are limited in spatial and temporal availability or are entirely unavailable. Satellite-based retrieval algorithms generate rainfall estimates with better spatial and temporal coverage than gauge observations [14,15,16,17,18,19]. However, satellite-based rainfall estimates (SREs) are embodied by systematic bias resulting from any one of the different sources, such as sampling error, sensor limitations, and biases from estimations by retrieval algorithms [17,20,21]. Previous research found that the biases in SREs resulted in systemic overestimation or underestimation in hydrological simulations [22,23,24].
Researchers found significant biases in SREs and recommended bias adjustment before using SREs for hydrological modeling or climate change research [25]. Several new strategies for reducing bias have been developed in recent years, including linear scaling, local intensity scaling, and histogram equalization (QM or probability mapping) [26]. By determining a multiplicative or an additive factor, SREs are rectified to match the mean of rain gauge data. No precipitation variance is accounted for when a linear scaling method is used [27,28,29,30,31]. Schmidli recommends using the local intensity method to solve the scaling problem [32]. The local intensity approach compares wet- and dry-day frequencies and intensities based on SREs estimates and rain gauge measurements. This can be done in two ways. To establish a threshold, the SRE’s wet day intensity is adjusted to match the wet day of rain gauge values. This is determined and used as an adjustment factor for SREs as a second step, i.e., the SREs mean to rain gauge mean ratio. However, this method does not consider daily precipitation occurrences [33].
The QM technique matches SREs’ probability density function (PDF) with the rain gauge measurements’ PDF. Prior to matching the two PDFs, cumulative distribution functions (CDFs) must be fitted [34,35]. According to Chen and co-workers, the QM strategy can reduce model precipitation estimations’ systematic bias so that no other method can be utilized [33].
Researchers found that the QM technique reduced systematic bias in regional climate model precipitation projections. The non-parametric QM technique for bias correction is often recommended because it does not rely on a fixed function and provides more flexibility. QM’s hydrological performance is superior to other approaches [23,36]. Distribution-based bias correction using historical data reduces the need for current reference data by relying on the distribution of primary data.
In particular, the non-parametric QM method is widely employed for bias adjustment because of its characteristic of being independent of any predetermined distribution function and, as such, is more flexible. Zhang and Tang recently produced reliable rainfall data for hydrological modeling by employing QM to adjust satellite precipitation using gauge observation in China [37]. Other studies have also used similar distribution-based methods for adjusting SREs [38]. As such, it is only a logical step to examine the degree of effectiveness of the QM method in adjusting the bias of SREs.
Therefore, this study used the QM method bias-adjusting framework. The current research aims to minimize the systematic bias inherent in the daily rainfall products from remotely sensed data using PERSIANN-CCS, PERSIANN-CDR, CHIRPS, and GPCP over Sudan. The framework was then tested using PERSIANN-CCS, PERSIANN-CDR, CHIRPS, and GPCP estimates, with rain gauge measurements as reference data over Sudan. This study shows that this method can be used to correct SREs in areas where rain gauges are limited in both time and space.

2. Materials and Methods
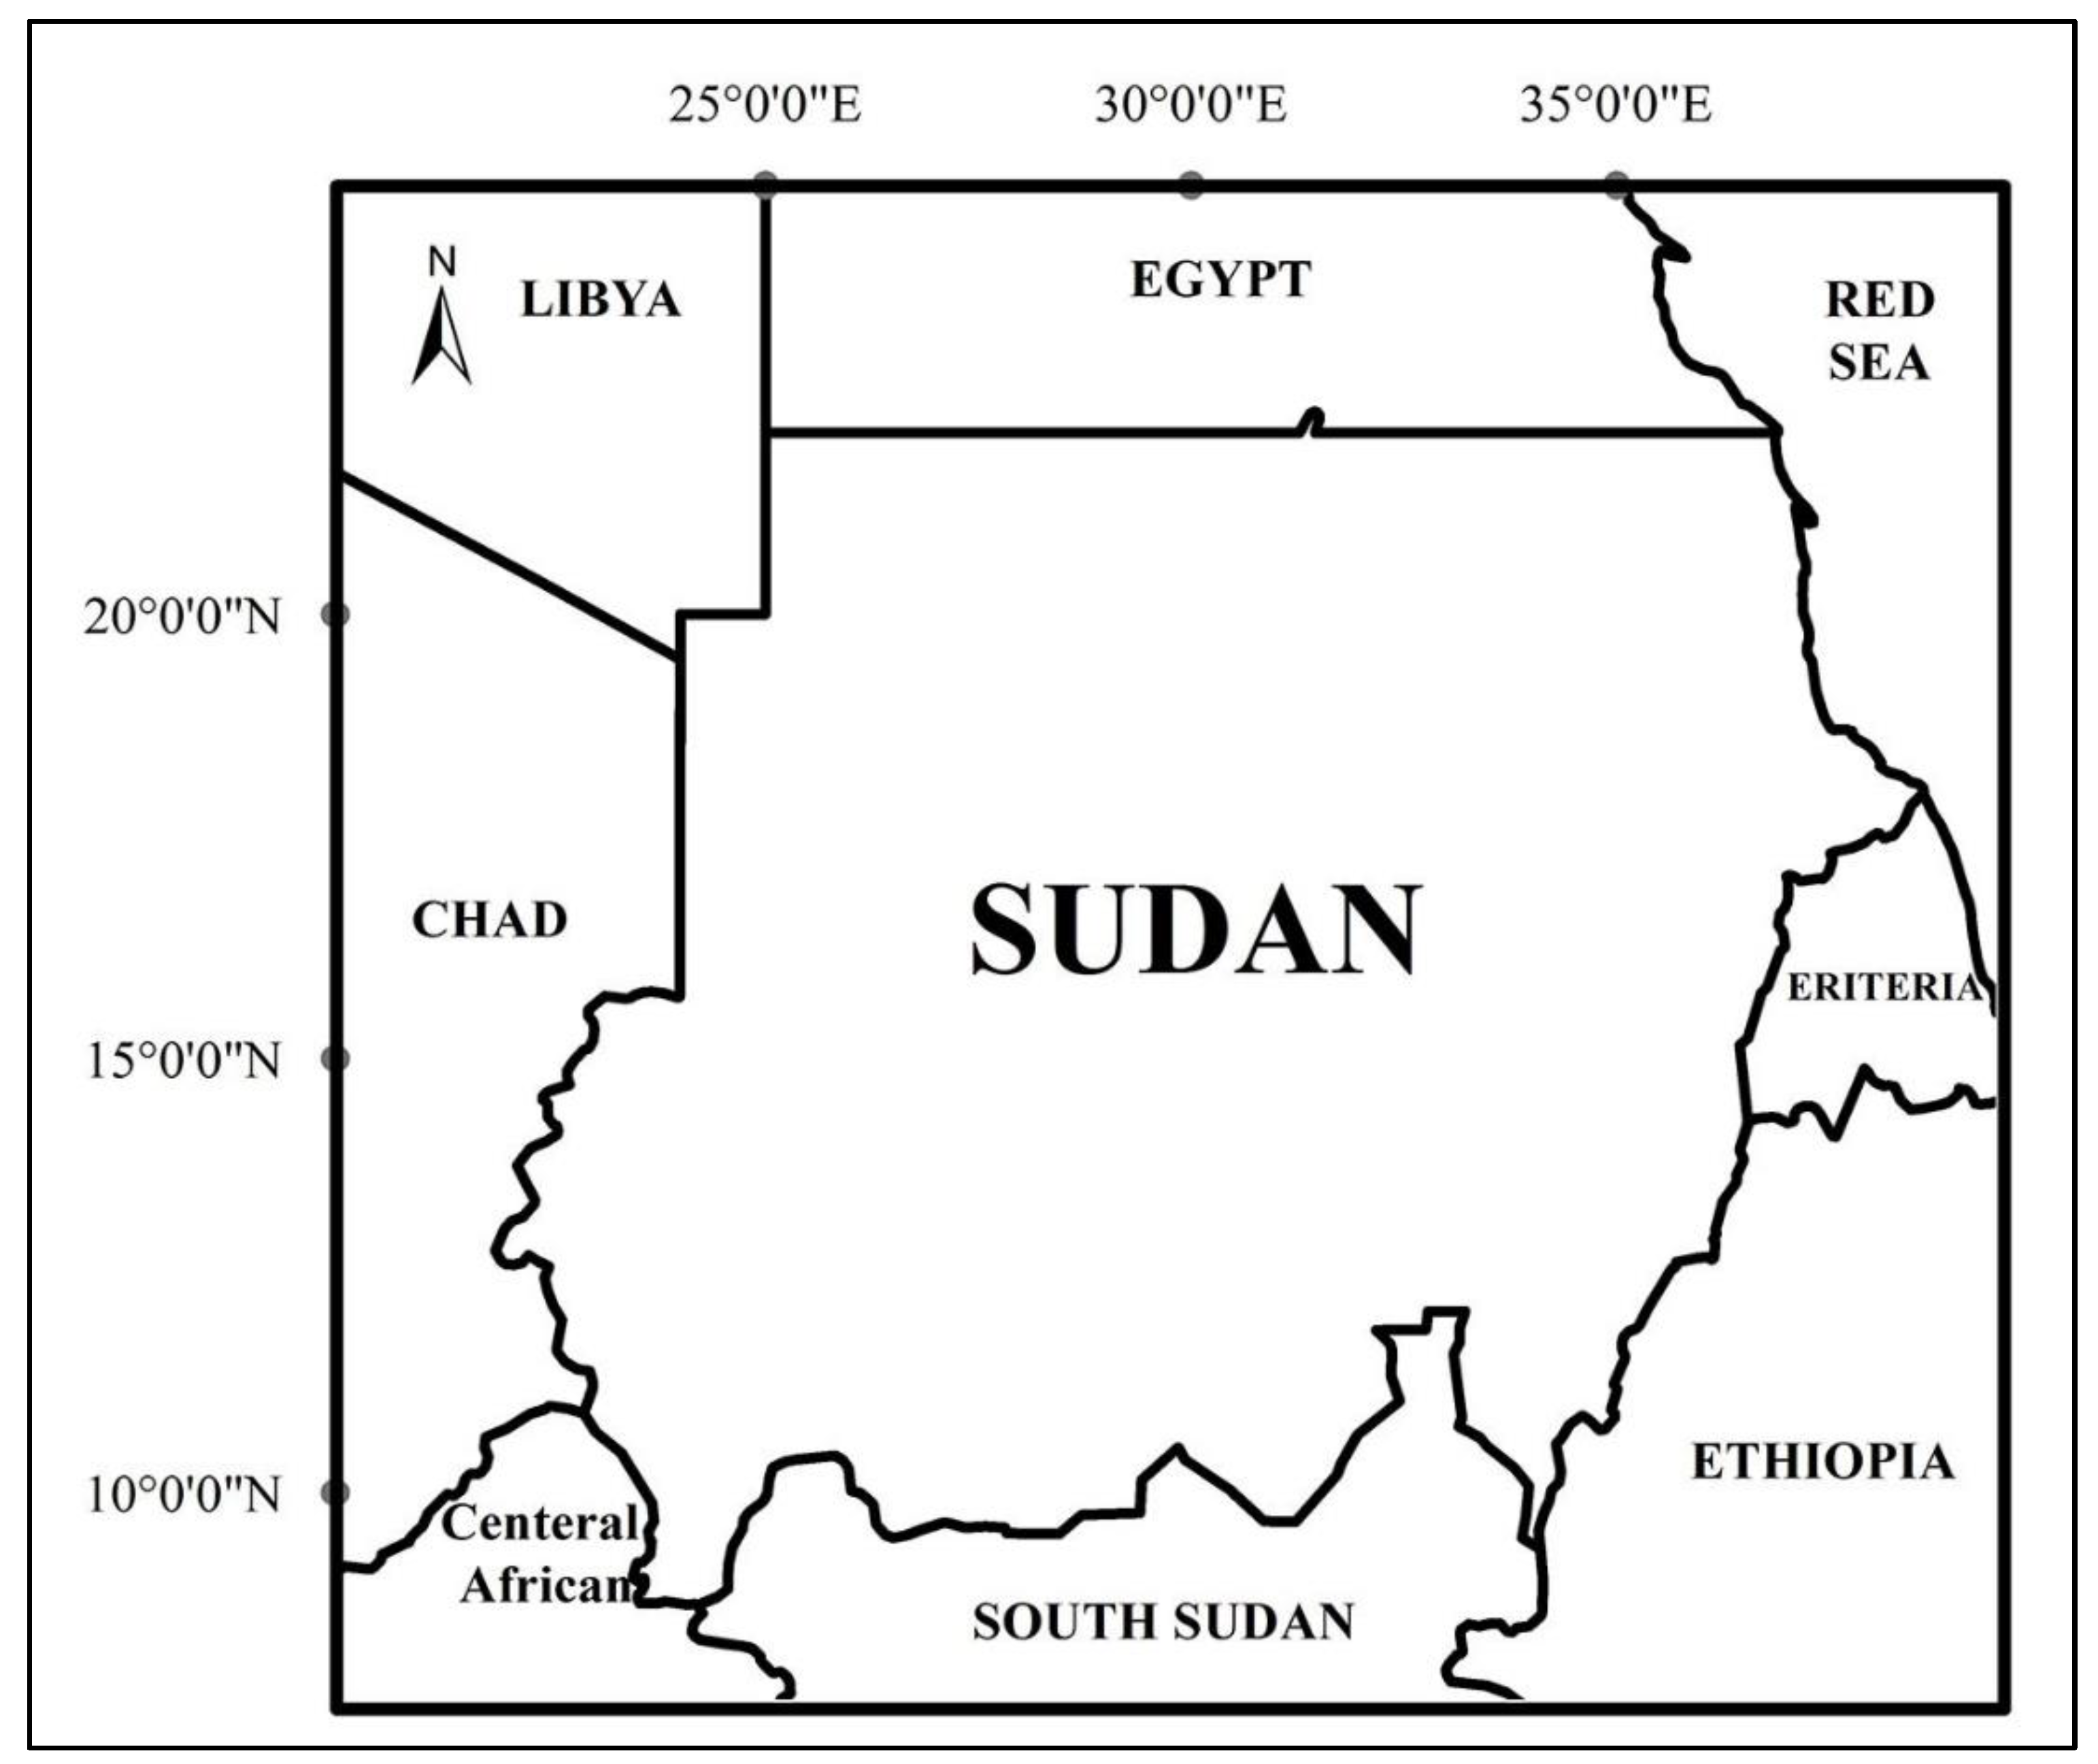
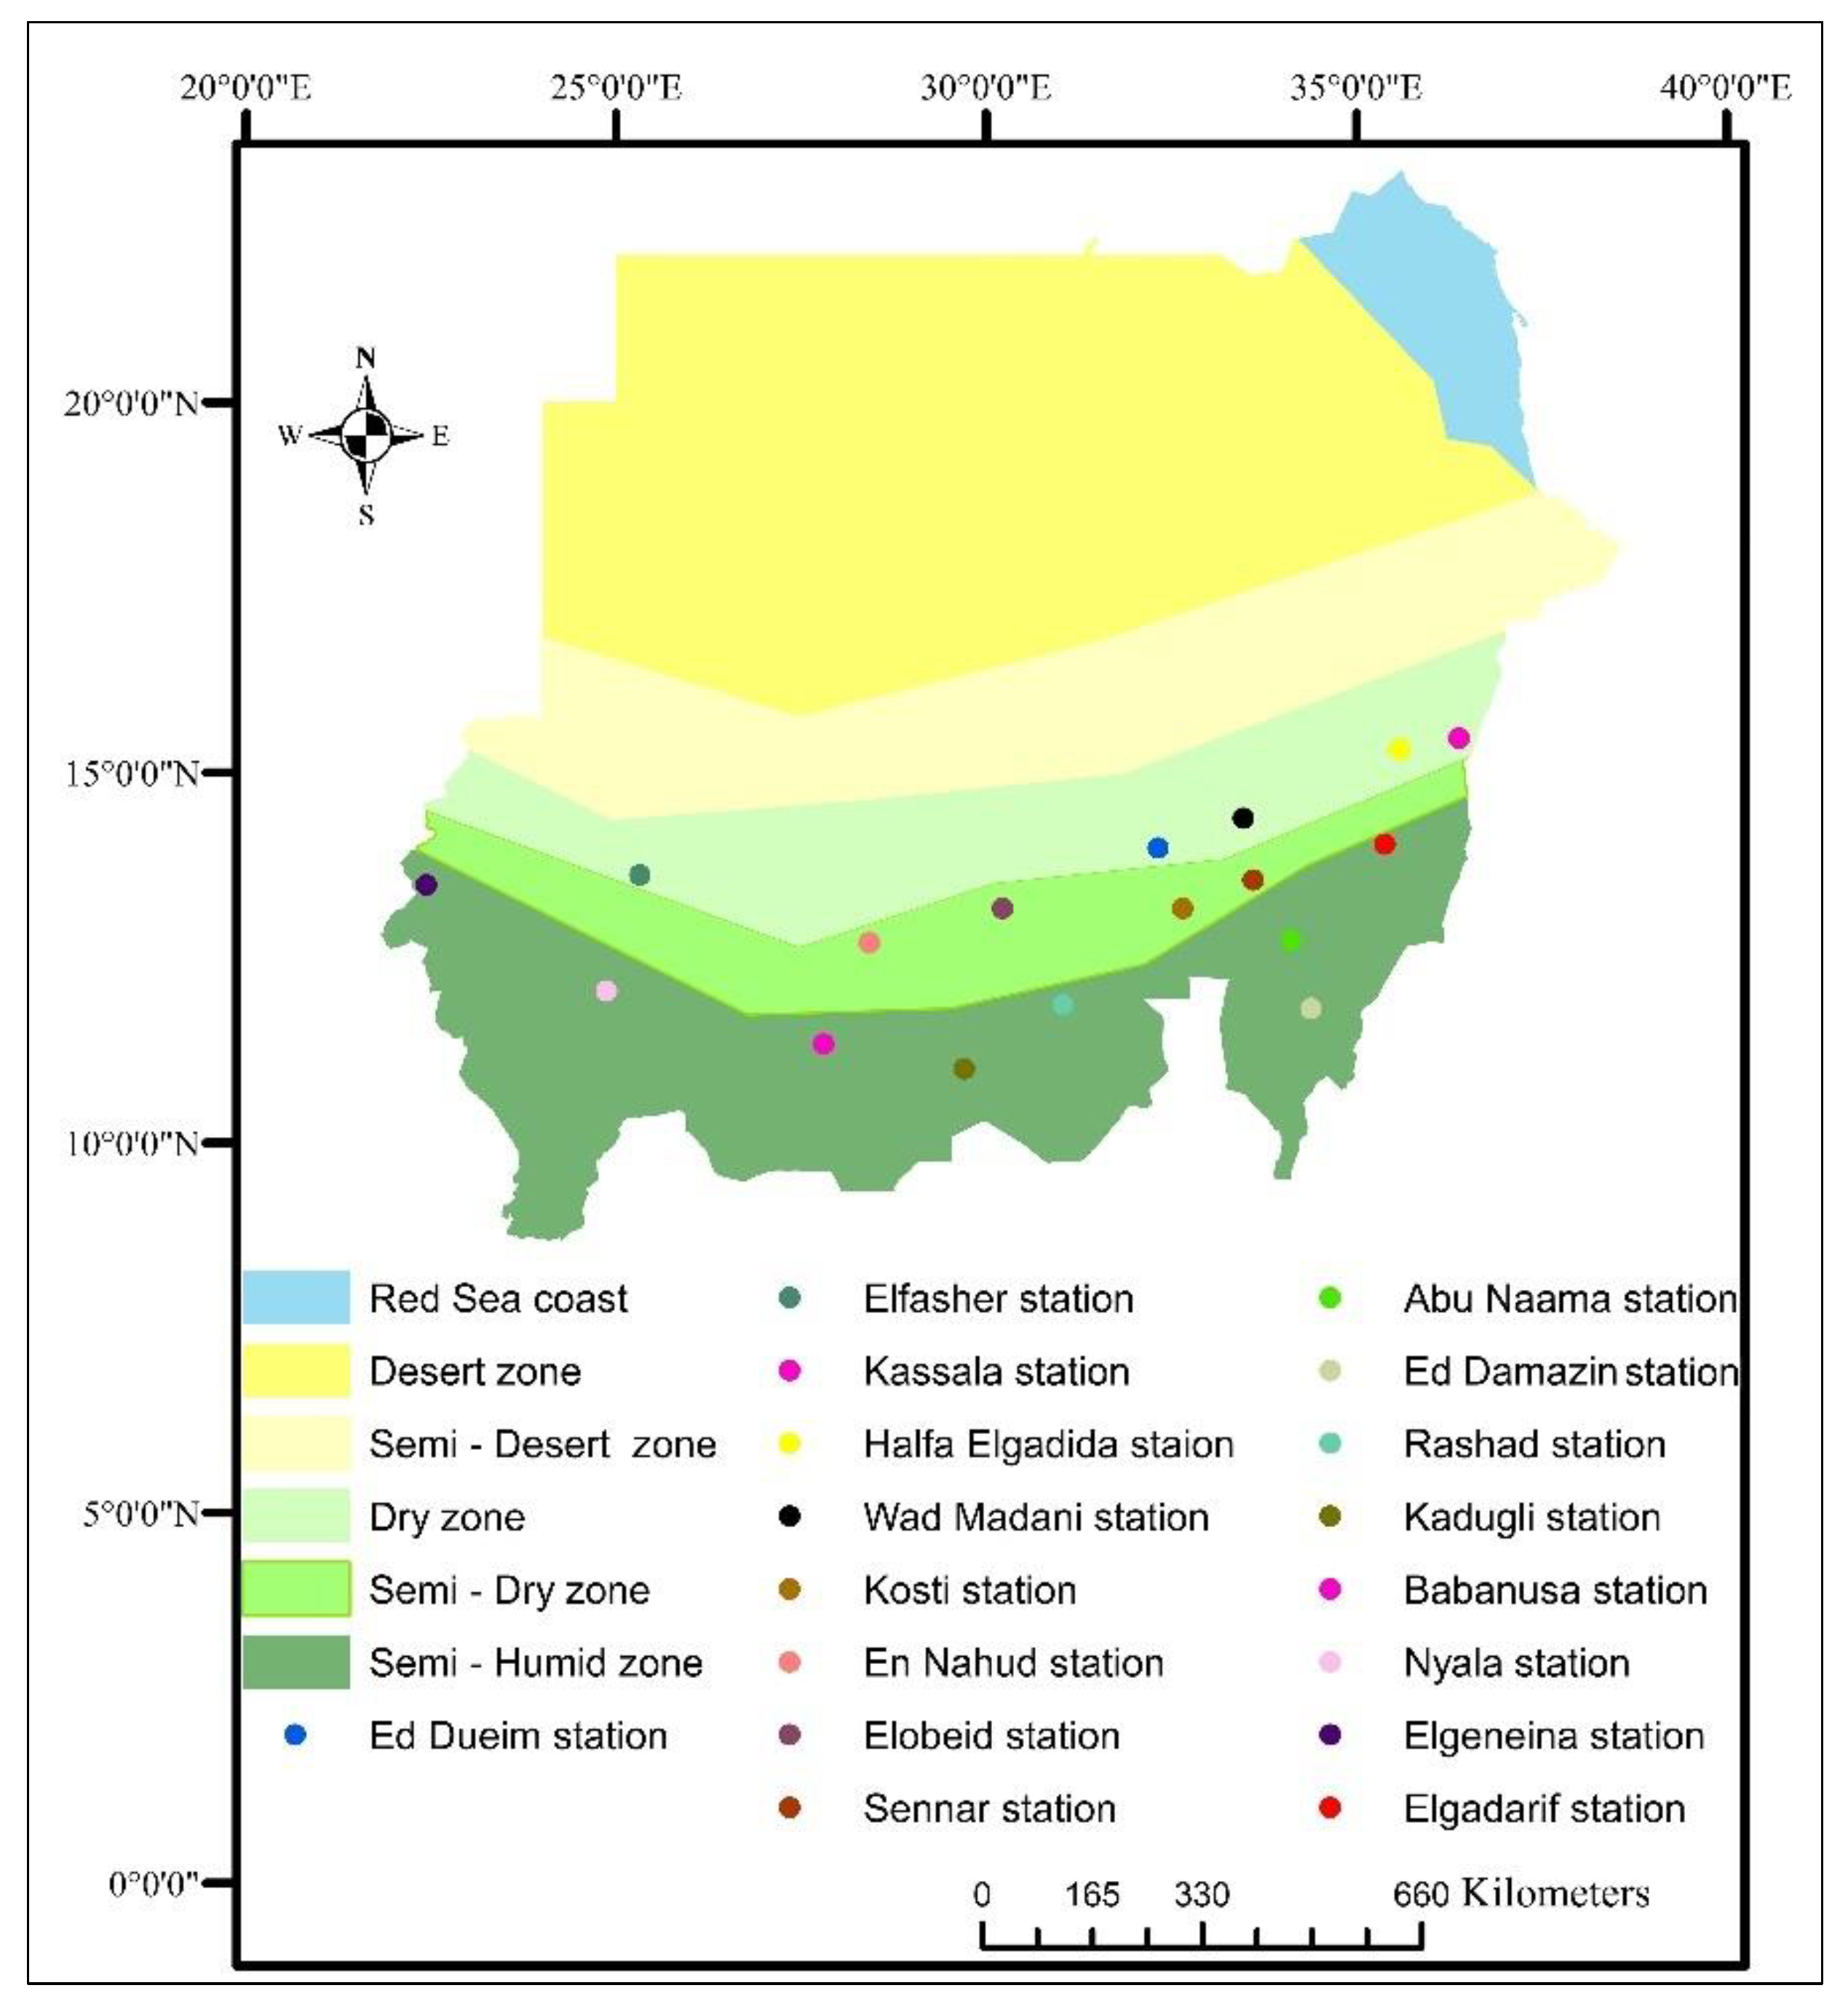
2.1. Study Area

Sudan is a country in northeast Africa with a population of roughly 43 million people (World Population Prospects, Population Division, United Nations). The country’s latitude and longitude are 10.55° and 21.07° N, and 22.45° and 37.73° E, respectively. Sudan is bordered by Egypt in the north, the Red Sea in the east, Eritrea in the southeast, Ethiopia in the south, South Sudan to the south, Central African Republic to the southwest, Chad to the west, and Libya in the northwest (Figure 1). It occupies an area of 1,886,068 km2 and is characterized by massive plains and plateaus. The highest point in Sudan is in the west over Jabal Marrah, with an altitude of 3042 m, and the lowest point is sea level on the Red Sea. Sudan’s climate is tropical (almost arid or semi-arid), and hot throughout the year, with a dry winter and a rainy summer. Seasons are distributed as follows: (1) the region between 10–16° N has a dry season from November to February, a hot season from March to May, and a wet season from June to October; (2) the northern region (north of 16° N) has a dry season from October to March, a hot season from April to June, and a wet season from July to September; and (3) the Red Sea coast has a dry season from February to April and a hot season from October to January [39]. The country covers an area falling into six climate zones distributed from the south to the north semi-humid, semi-dry, dry, semi-desert, desert, and the Red Sea coast (Figure 2).
Rainfall has a significant influence on the environment and the socioeconomic conditions of Sudan. Sudan’s economy is mainly dependent on rain-fed agriculture and is directly affected by the amount of rainfall distribution. Annual rainfall variation is most prominent in the country’s dry north, where average variability currently surpasses 100 percent, whereas rainfall variability at the national level decreases to approximately 0.2 percent each year. Sometimes for consecutive years, the amount of rain in the dry season has increased by 20 to 30 mm each year in the far north and south. The amount of rain in the rainy season has decreased by 10 to 30 mm each year in the west.
As a result of its topographical features, Sudan lacks suitable evaporation fields due to the complete absence of any significant water bodies inside the country, with the possible exceptions of the Nile system and the swampy area of the Sudd region. This also applies to the immediate surroundings of Sudan, except for the Red Sea coast, whose narrowness and location greatly reduce its evaporation potential.

2.2. Datasets

2.2.1. Historical Data

Daily rainfall observations from 17 weather stations from 2003 to 2017 were obtained from the Sudan National Meteorological Department (SNMD). The 17 weather stations are distributed over three zones, with eight stations located in the semi-humid zone (Abu Naama, Ed Damazin, Rashad, Kadugli, Babanusa, Nyala, Egeneina, and Elgadarif stations), four stations in the semi-dry zone (Kosti, En Nahud, Elobied, and Sennar), and five stations in the dry zone (Ed Dueim, Elfasher, Kassala, Halfa Elgadida, and Wad Madani station) (Figure 2). The desert, semi-desert, and the Red Sea coast zones have insignificant amounts of rainfall and were thus excluded from this study.

2.2.2. Satellite-Based Estimation

Four SREs from different satellites derived from remotely sensed information were used: PERSIANN-CCS, PERSIANN-CDR, CHIRPS, and GPCP (Table 1). These rainfall products were chosen because they met the required conditions, such as having enough data and having good data resolution.
PERSIANN-CCS is a product of the Center for Hydrometeorology and Remote Sensing (CHRS), University of California, Irvine, and was developed for categorizing cloud features. The main characteristic of the PERSIANN–CSS is a variable threshold cloud segmentation algorithm that employs computer image processing to identify and differentiate cloud features [40].
Another product of the CHRS, University of California, Irvine [41] is the PERSIANN-CDR, whose input data for the algorithm is collected from the Gridded Satellite (GridSat-B1) data from the International Satellite Cloud Climatology Project (ISCCP) B1 Infrared Window Channel and the GPCP v2.2.
The CHIRPS product is a quasi-global rainfall dataset spanning 30 years. CHIRPS uses 0.05° resolution satellite images in conjunction with in situ station data to generate gridded rainfall time series for trend analysis and seasonal monitoring. CHIRPS collaborates with the United States Geological Survey (USGS) and the Climate Hazards Group at the University of California, Santa Barbara (UCSB). It was created using five datasets gathered from diverse sources, including national and regional meteorological agencies [42].
GPCP has long offered worldwide comprehensive precipitation data by combining satellite and gauge estimates of the utmost quality. It also provides daily precipitation datasets at 1° resolution from 1996 to the current [43,44].
Table 1. An overview of the four satellite-based rainfall products used in this study with their temporal and spatial coverages and spatial and temporal resolutions.
Satellite ProductTemporal CoverageSpatial CoverageSpatial ResolutionTemporal ResolutionReference
PERSIANN-CCS2003–present60° S–60° N0.04° × 0.04°Daily[45]
PERSIANN-CDR1983–present60° S–60° N0.25° × 0.25°Daily[46]
CHIRPS Version 2.01981–present50° S–50° N0.05° × 0.05°Daily[47]
GPCP-1DD1996–present90° S–90° N01° × 01°Daily[20]

2.3. Methodology

Fifteen years of daily gauge observations from 2003 to 2017 and four SREs (Ori-CCS, Ori-CDR, Ori-CHIRPS, and Ori-GPCP) were adjusted using the QM method. In this study, data from 2003 to 2016 were used for calibration, whereas data for 2017 was explicitly used for validation purposes. The CZs were introduced to collect more samples to calculate stable CDFs and extend the bias-adjusted rainfall estimations to areas with limited or unavailable rain gauges. Three of the six climatic zones available in the study area were considered (semi-humid, semi-dry, and dry) for this study; these zones are in the region between 10° and 16° N (Figure 2). This region is the rainy area of Sudan, which has three seasons: a dry season from November to February, a hot season from March to May, and a wet season from June to October. However, the rainfall occurs only in the wet season (June–October). Therefore, the CDFs computed for the climatic zones were constructed using the wet season data. The adjusted four SREs were evaluated on a temporal scale using quantitative statistical measures: the Mean Bias (MB), the Root Mean Square Error (RMSE), and the Correlation Coefficient (CORR). The current study focused on minimizing the systematic bias of four SREs by considering CZs.

2.3.1. Quantile Mapping

The QM technique is a distribution-based method sensitive to the sample size used to construct the cumulative distribution functions (CDFs). Thus, to obtain stable CDFs, it is highly recommended to increase the sample size. In order to obtain more samples, it is necessary to broaden the sample coverage inside the same CZ. The non-parametric quantile mapping method was employed for mapping rainfall estimates from Ori-CCS, Ori-CDR, Ori-CHIRPS, and Ori-GPCP to the reference gauge measurements. The QM is computed using non-parametric CDFs that are determined from the Ori-CCS, Ori-CDR, Ori-CHIRPS, and Ori-GPCP rainfall data at satellite pixels and the corresponding gauge observations.
By using QM approaches, post-processing outputs from climate models are commonly subjected to statistical changes. The statistical transformations entail employing a mathematical function to translate the distribution functions of the modeled variables into the observed ones [36]:
x 0 = f ( x m )
where x0 = observed variable; xm = modeled variable; and f() = transformation function. Since QM approaches use the quantile–quantile connection to converge simulated functions to observed distribution functions, the quantile relation may be calculated for both observed and simulated time series [48]:
x 0 = F 0 1 [ F m ( x m ) ]
where F m ( x m ) = CDF of x m ; and F 0 1 [] = inverse form of the CDF of x 0 , this is referred to as the quantile function in the scientific community.
The transformation function can be built using a variety of frameworks. As a result, various non-parametric transformation QM methods are employed to rectify biases, such as:
  • Empirical quantiles (QUANT): This method estimates the empirical CDF values of the time series observed and modeled with regularly spaced quantiles [49].
  • Robust empirical quantiles (RQUANT): This method employs linear squares regression to estimate the quantile–quantile relationship’s values for time series with regularly spaced quantiles [50].
  • Smoothing splines (SSPLIN): The quantile–quantile plot of the observed and modeled time series is fitted with a smoothing spline in this method [51].
This study corrected the systematic bias of four satellite-based rainfall estimations using the non-parametric empirical quantile mapping approach, QUANT. A non-parametric QM was used to adjust CDFs of daily Org-GPCP, Org-CHIRPS, Org-CDR, and Ori-CCS estimates to match CDFs of daily rain gauge data for each CZ (Figure 3). It was assumed that CDFs from the rain gauge for each season and SREs within the same CZ are the same. As a result, the CDFs of SREs and gauge observations can be estimated by collecting co-located rain gauge data and SREs inside the same CZ. Seasonal CDFs are computed for each CZ. Figure 3a–c shows Org-GPCP, Org-CHIRPS, Org-CDR, Ori-CCS, and the rain gauge observation CDFs for semi-humid, semi-dry, and dry zones, respectively.

2.3.2. Bias Correction of Satellite-Based Rainfall Estimates

With reference to the seasonally determined non-parametric CDFs over Sudan, the Adj-CCS, Adj-CDR, Adj-CHIRPS, and Adj-GPCP R i ( t ) daily rainfall at satellite pixel i was computed from the daily Ori-CCS, Ori-CDR, Ori-CHIRPS, and Ori-GPCP r i ( t ) rainfall at satellite pixel i and time t within a season (s) as follows:
R i ( t )   =   W i ·   CDF G s   1 ( CDF sat s   ( r i ( t ) ) )   =   W i · r i   ( t ) ,
where CDF G s   1 is the inverse CDF of gauge observations for the season (s), CDF sat s is the CDF of Ori-CCS, Ori-CDR, Ori-CHIRPS, or Ori-GPCP rainfall for the season (s), and r ( t ) represents the bias-corrected estimates based on the non-parametric QM method. The weighting factor (w) of each r ( t ) is estimated based on the distance of a satellite pixel (i) at a resolution to the center of a 1° × 1° box. However, in this study, the weighting factor (w) equals 1, because the satellite rainfall recorded at each station records at the same point, so there is no box. The bias correction flowchart is presented in Figure 4.

2.3.3. Evaluation

The evaluation of QM-CZ results for the Ori-CCS, Ori-CDR, Ori-CHIRPS, and Ori-GPCP rainfall estimates during the calibration and validation periods was achieved using the observed gauge measurements as a reference. The evaluation of the performance of datasets in the temporal distribution in monthly and daily time steps for the three CZs was considered in the current study, namely, semi-humid, semi-dry, and dry zones. The temporal pattern evaluation aims to assess the bias adjustment of satellite-based rainfall time series in specified regions relevant to applying SREs at a local scale to hydrological studies.
The performance of the Ori-CCS, Ori-CDR, Ori-CHIRPS, and Ori-GPCP rainfall estimates was analyzed based on three statistical measures: MB, RMSE, and CORR. The statistics were determined from the temporal valuations using Equations (4)–(6):
BIAS = 1 n k = 1   n ( S k G k ) ,
RMSE = 1 n k = 1 n ( S k G k ) 2 ,
CORR = k = 1 n ( G k G   ¯   ) ( S k S ¯ ) k = 1 n ( G k G   ¯ ) 2 × k = 1 n ( S k S ¯ ) 2 ,
where Gk is the gauge observations and G   ¯ is the average of the gauge observations; Sk and S ¯ are the satellite estimates and their average, respectively.
By increasing CORR and reducing RMSE and absolute bias, Adj-CCS estimates show improved performance.

3. Results and Discussion

In evaluating rainfall estimates from different satellites, the CCS, CDR, CHIRPS, and GPCP monthly and daily time steps with three CZs, semi-humid, semi-dry, and dry, were considered. The historical time series for every time step was divided into calibration and validation periods. Simultaneously, the statistical measures used in assessing MB, RMSE, and CORR were calculated by Equations (2)–(4). The results of the QM with CZs for the four SREs are discussed as follows.

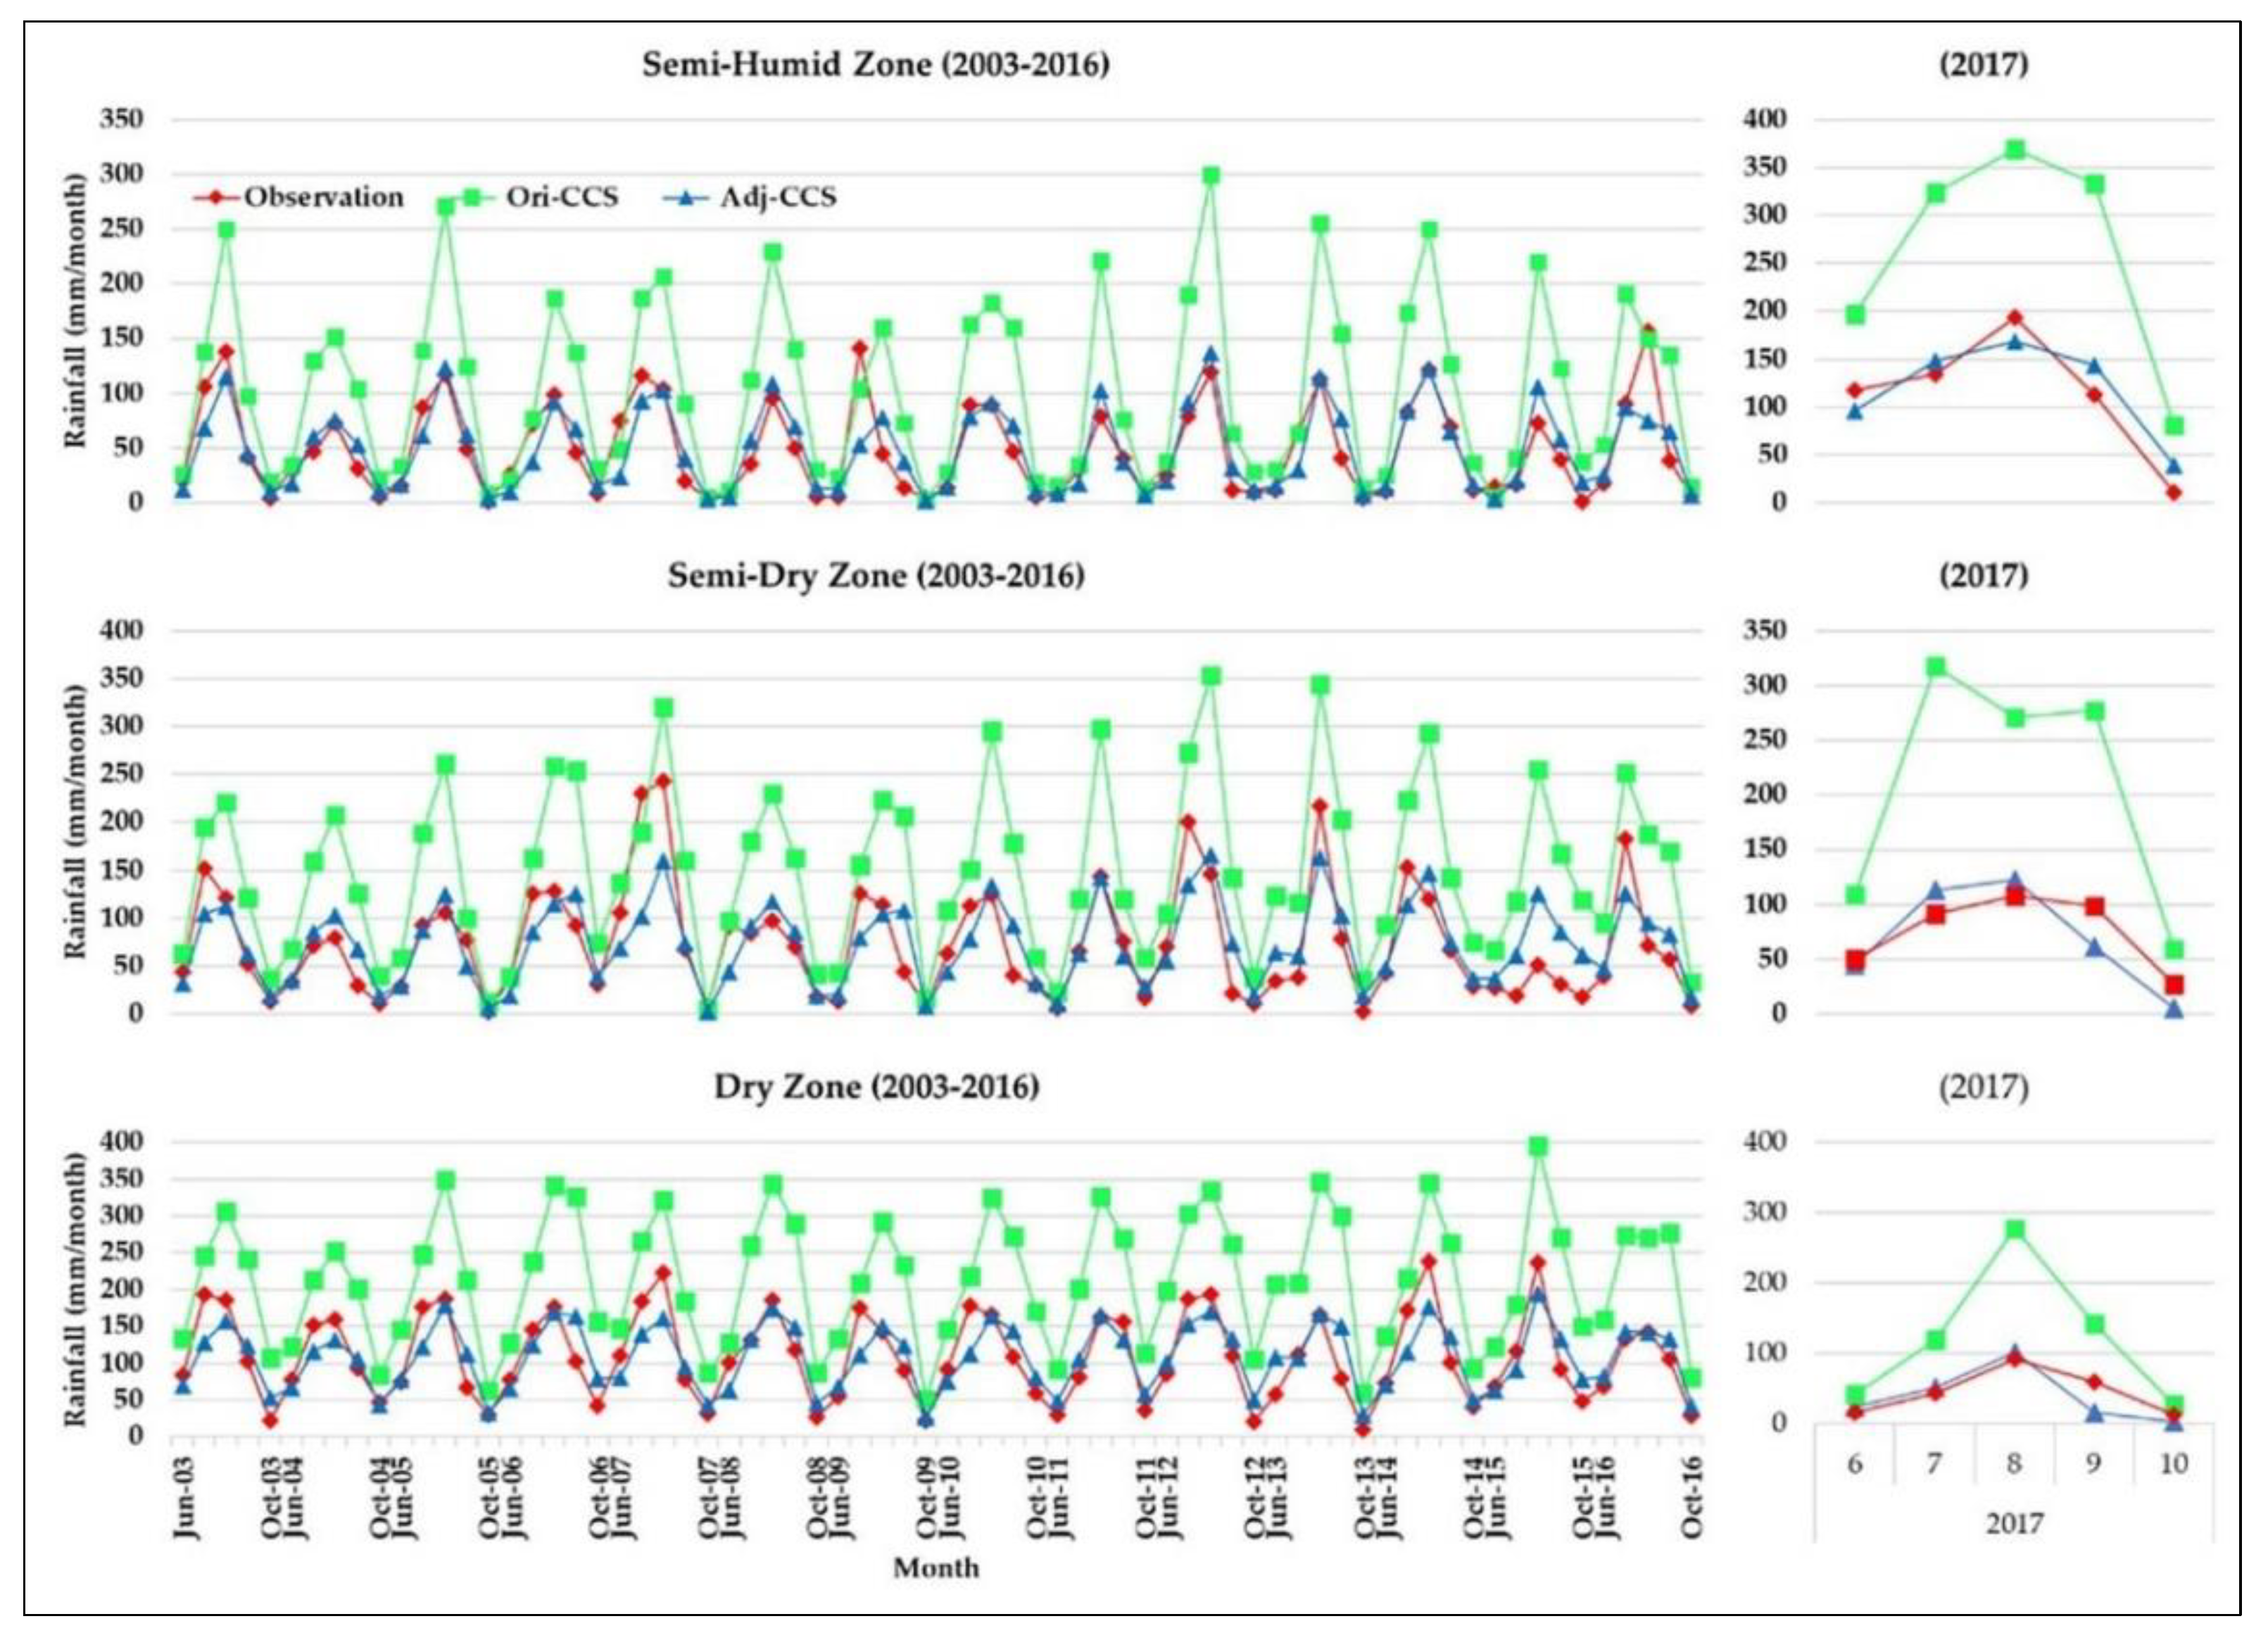
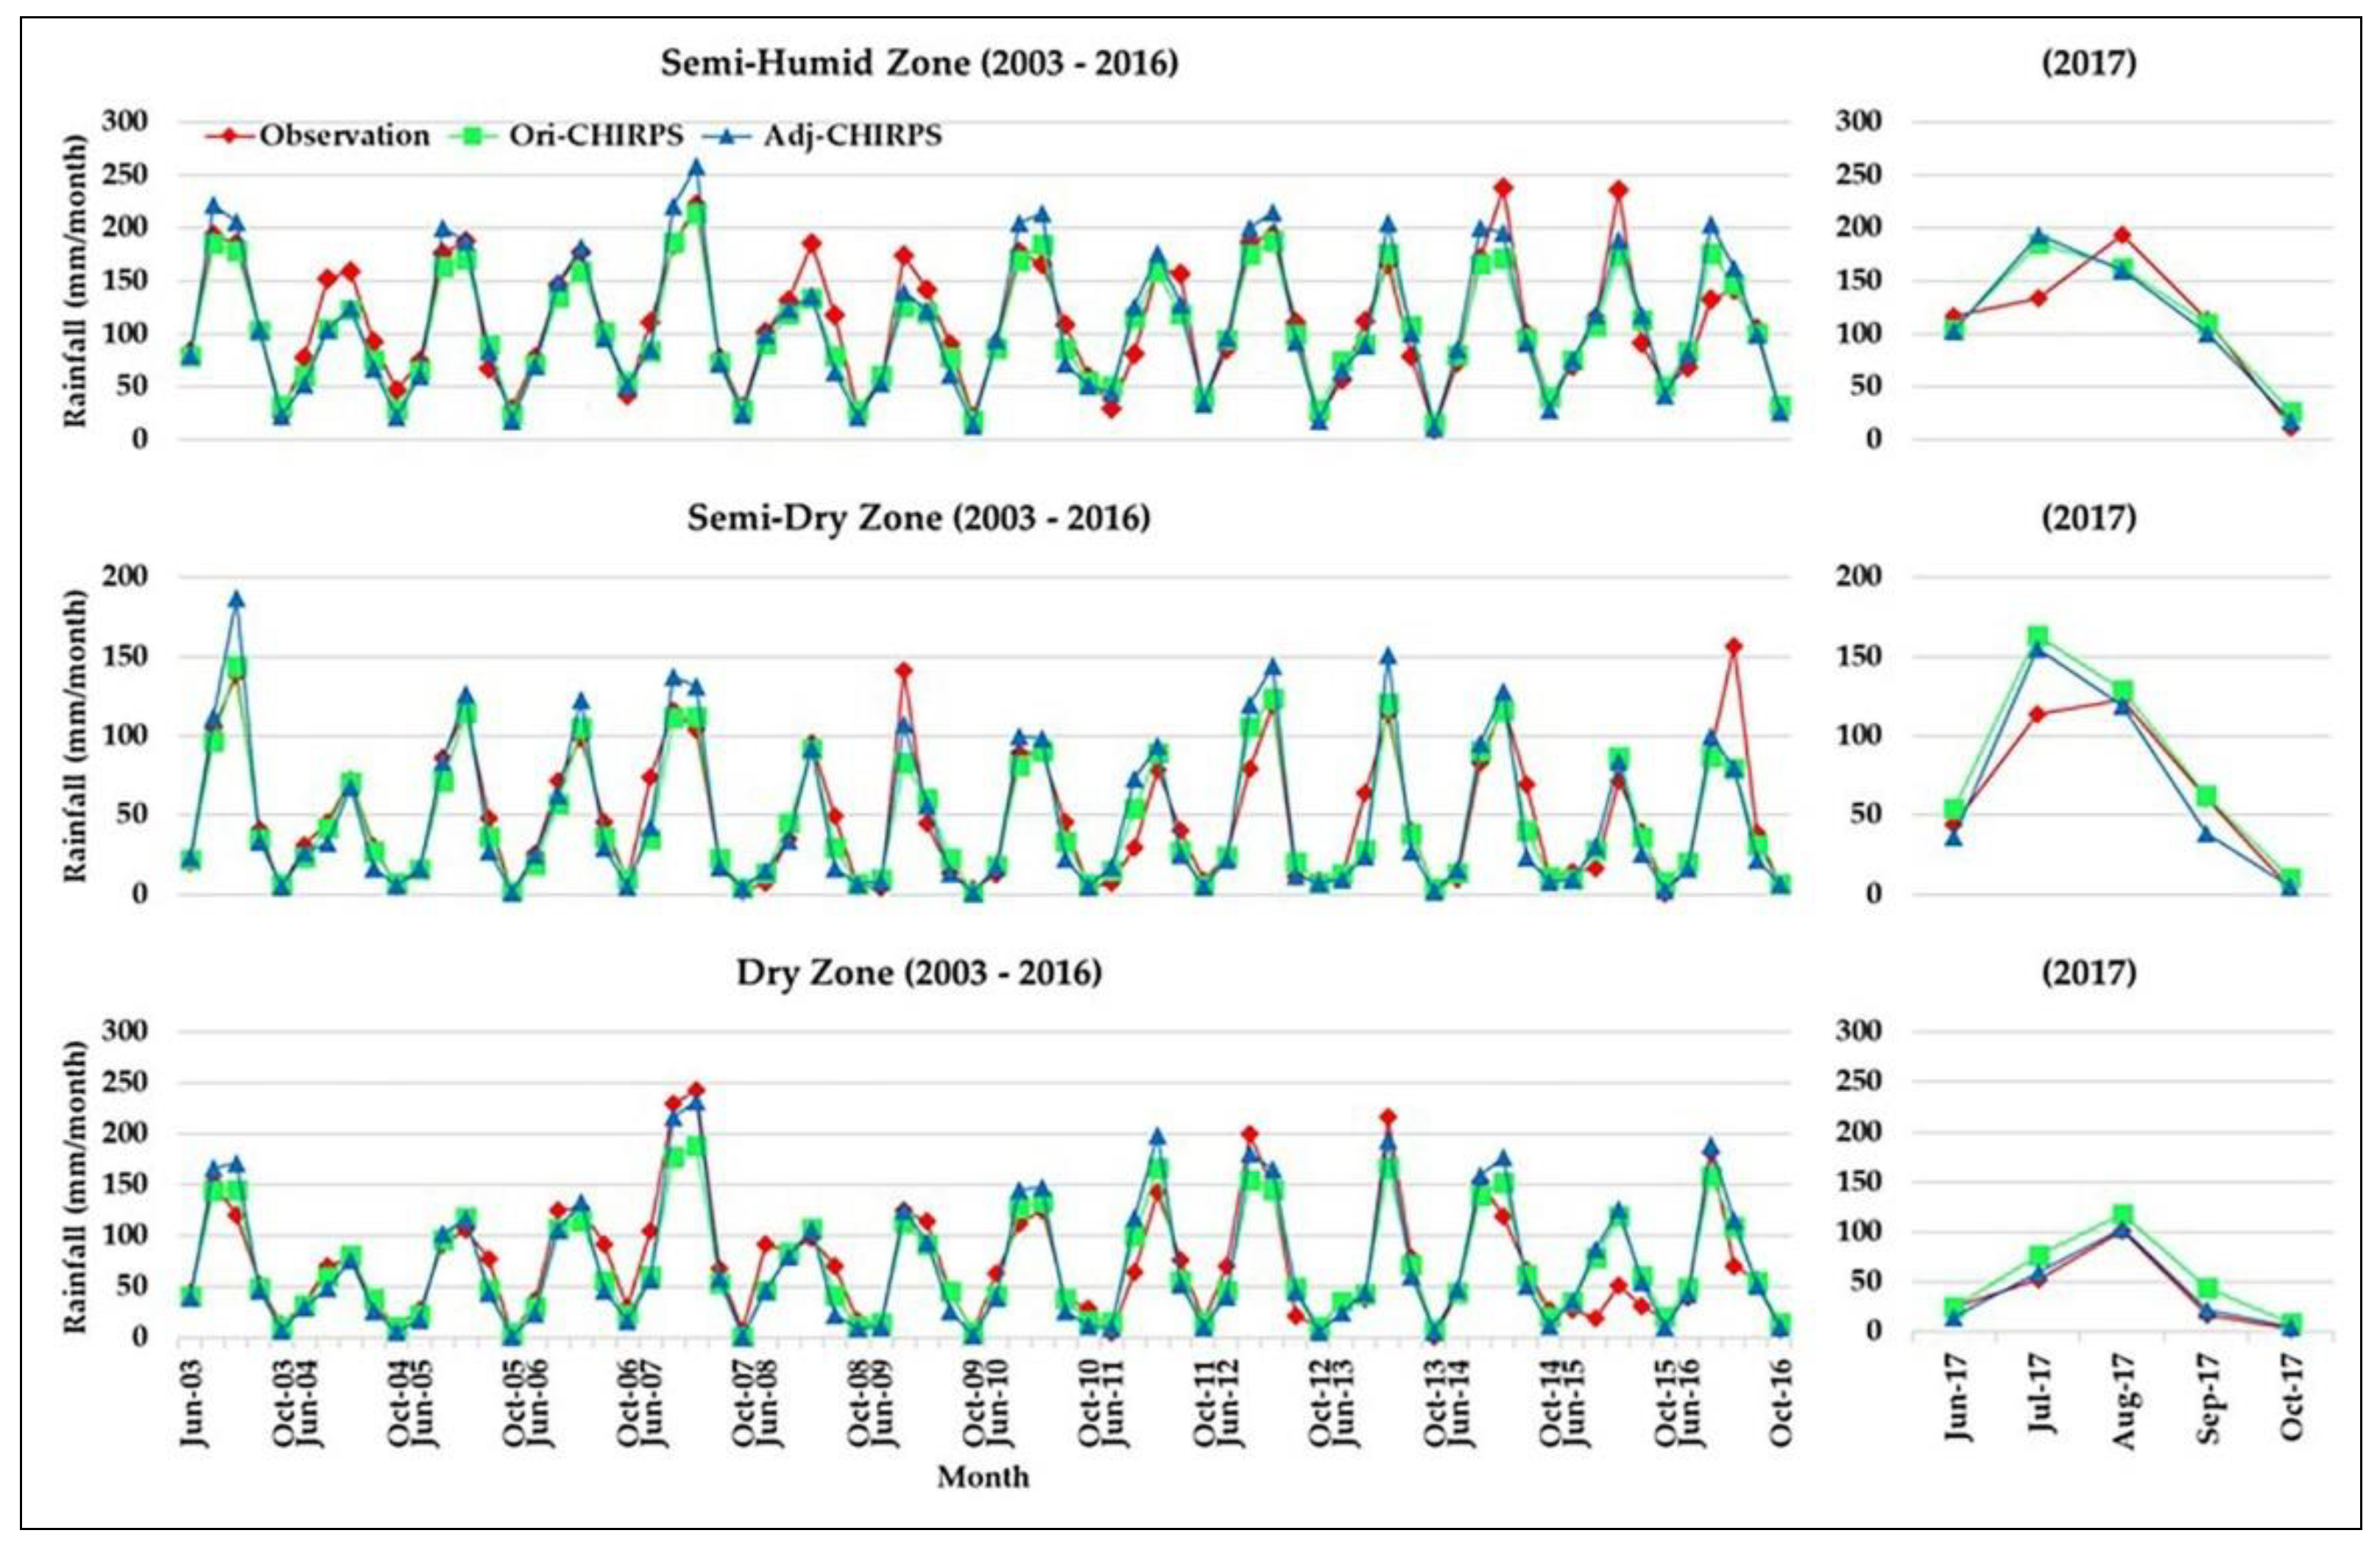
3.1. Monthly Time Series

For time series evaluation of monthly rainfall estimates, plots were constructed of gauge observations (red), Ori-CCS, Ori-CDR, Ori-CHIRPS, and Ori-GCPC (green), and Adj-CCS, Adj-CDR, Adj-CHIRPS, and Adj-GCPC (blue) over semi-humid, semi-dry, and dry zones for calibration and validation periods. In contrast, the quantitative statistical measures for evaluating the four SREs in the three CZs are provided in Table 2.
Based on the rain gauge measurements, the areal mean monthly rainfall estimates of Ori-CCS indicate systematic biases over the three CZs, as presented in Table 2. Overestimation of areal mean monthly rainfall estimates in semi-humid, semi-dry, and dry zones by Ori-CCS was noticed during the calibration period; the MBs were approximately 103.17, 74.23, and 52.67 mm/month for the three CZs, respectively, and the RMSEs were 114.40, 91.54, and 72.68 mm/month, respectively. The CORRs in all zones were favorably high for the calibration period, with values exceeding 0.80, and even higher during the validation period, with values of 0.88. These CORRs show that the advanced features of the areal mean monthly Ori-CCS rainfall estimates were consistent with the rain gauge observations.
The Adj-CCS rainfall estimates series revealed a significant enhancement in data quality. The Adj-CCS areal mean monthly rainfall estimates over the three CZs were reduced during the calibration period (Figure 5). The changes as a result of the adjustments applied show that the Adj-CCS areal mean monthly rainfall estimates were well correlated with the gauge observations. Consequently, the RMSEs and absolute MBs of areal mean monthly rainfall estimates in the calibration period decreased, on average, for the overall CZs, by 99% and 68%, respectively. The RMSEs and absolute MBs decreased by 83% and 95%, respectively, for the validation period. The CORRs of the areal mean monthly rainfall were also slightly increased in semi-humid and dry zones, whereas in the semi-dry zone, the CORRs of the areal mean monthly rainfall remained constant during calibration. Minor increases were observed for the CORRs over semi-humid and semi-dry zones. However, there was a slight decrease in the dry zone throughout the validation period. Generally, CORRs between the rain gauge observations and the adj-CCS show very high values, from 0.81 to 0.85 during calibration and from 0.82 to 0.92 during validation of overall CZs.
According to Table 2, the areal mean monthly rainfall estimates of the Ori-CDR evaluation revealed systematic overestimation of biases over the three CZs during the calibration period; the MBs were approximately 18.77 mm/month in the semi-humid zone, 15.99 mm/month in the semi-dry zone, and 16.03 mm/month in the dry zone, and the RMSEs were 28.73 mm/month in the semi-humid zone, 32.44 mm/month in the semi-dry zone, and 25.37 mm/month in the dry zone. The CORRs in these three zones were significantly high, with an average value of 0.91 during the calibration and the validation periods. These CORRs show that the areal mean monthly Ori-CDR rainfall estimates were consistent with the gauge observations.
The Adj-CDR rainfall estimates series revealed a significant improvement in data quality. As illustrated in Figure 6, the Adj-CDR areal mean monthly rainfall estimates in the calibration period over the three CZs were reduced. These adjustments show a good similarity between the Adj-CDR areal mean monthly rainfall estimates and gauge observations. Consequently, during the calibration period, the RMSEs and absolute MBs of areal mean monthly rainfall estimates were decreased by 22% and 70%, on average, respectively. For the validation period, the RMSEs and utter MBs were decreased, on average, by 48% and 80%, respectively. The CORRs of the areal mean monthly rainfall were also estimated to slightly decrease over semi-humid and dry zones. However, they remained constant for semi-dry zones throughout the calibration period.
In contrast, the CORRs of the areal mean monthly rainfall estimates for the semi-humid zone decreased, whereas those of the dry zone increased slightly. In contrast, the CORRs of the semi-dry zone remained unchanged during the validation period. In general, the CORRs between the rain gauge observations and the adj-CDR displayed very high values, ranging from 0.87 to 0.94 during both periods of the overall CZs.
Unlike the Ori-CCS and Ori-CDR rainfall estimates, the Ori-CHIRPS investigation showed systematic underestimating biases throughout the calibration period (Table 2); the MBs for semi-humid, semi-dry, and dry zones, respectively, were roughly 6.46, 2.96, and 2.66 mm/month. Similarly, the RMSEs were 21.38, 23.18, and 15.94 mm/month for semi-humid, semi-dry, and dry zones, respectively. Regarding calibration and validation, these zones had CORRs that exceeded 0.91. Ori-CHIRPS estimates appeared to be consistent with the gauge data, as seen by these CORRs.
Adj-CHIRPS areal monthly rainfall estimates for the three CZs did not exhibit an improvement in calibration during the experiment (Figure 7). This does not clearly show the relationship between the Adj-CHIRPS areal mean monthly rainfall estimates and gauge observations. The RMSEs of areal mean monthly rainfall estimates increased, with values of 15% for the semi-humid zone, 9% for the semi-dry zone, and 17% for the dry zone in the calibration period. By comparison, absolute MBs were reduced by values greater than 87%, 86%, and 82% for the CZs, respectively, during the calibration period. The CORRs of the areal mean monthly rainfall estimates exhibited a slight decrease in overall zones during the calibration period and, during the validation period, CORRs decreased slightly in semi-humid and semi-dry zones but increased slightly in the dry zone. Unexpectedly, the CORRs between the rain gauge observations and the adj-CHIRPS displayed very high values, ranging from 0.91 to 0.93 and 0.86 to 0.99, respectively, throughout the calibration and validation periods of overall CZs.
According to Table 2, the areal mean monthly rainfall estimates of the Ori-GPCP evaluation displayed systematic overestimation of biases for overall CZs during the calibration period; the MBs were 7.83, 5.90, and 13.19 mm/month for semi-humid, semi-dry, and dry zones, respectively. Similarly, the RMSEs were 20.56, 26.32, and 22.36 mm/month, corresponding to semi-humid, semi-dry, and dry zones, respectively. For both the calibration and validation periods, the CORRs at these zones were high for all CZs. These CORRs show that the areal mean monthly Ori-GPCP estimates correlated well with gauge observations.
Therefore, the Adj-GPCP rainfall estimates series significantly improved the data quality. The Adj-GPCP areal mean monthly rainfall estimates of the three zones were generally reduced during the calibration period (Figure 8). These adjustments showed a good relationship between the Adj-GPCP areal mean monthly rainfall estimates and gauge observations. The RMSEs of the areal mean monthly rainfall estimates decreased by 1%, 3%, and 31% for semi-humid, semi-dry, and dry zones, respectively, during calibration; they decreased by 14%, 87%, and 64% for the same zones, respectively, during validation. By comparison, the absolute MBs were reduced by more than 90% across all CZs during calibration and validation, except for the semi-humid zone during validation, where the absolute MBs were reduced by 83%. Generally, the CORRs between the rain gauge observations and the Adj-GPCP showed very high values, ranging from 0.90 to 0.96 during calibration and from 0.84 to 1.00 during the validation period for overall CZs.

3.2. Daily Time Series

An evaluation of the series was also carried out on a daily scale (Table 3). The MBs, RMSEs, and CORRs of mean areal daily estimates for CCS, CDR, CHIRPS, and GPCP for both original and adjusted estimates over time in each zone were computed for the calibration and validation periods. Data from rain gauge observations and product estimation (CCS, CDR, CHIRPS, and GPCP) in 2003, 2008, 2013, and 2017 were chosen to show the cumulative rainfall evaluation of CZs.
Table 3 shows that Ori-CCS overestimated the areal mean daily rainfall during calibration, with 0.42, 0.61, and 0.34 mm per day for semi-humid, semi-dry, and dry zones, respectively. During the validation, the Ori-CCS overestimated the areal mean daily rainfall by 0.60, 1.12, and 0.54 mm per day for semi-humid, semi-dry, and dry zones, respectively. In addition, the daily RMSEs were 1.62, 2.75, and 1.77 mm per day for semi-humid, semi-dry, and dry zones, respectively, during the calibration years. During validation, the daily RMSEs were 2.31, 4.48, and 1.99 mm per day for semi-humid, semi-dry, and dry zones, respectively.
Hence, according to Table 3, the areal mean daily estimations of the Adj-CCS MBs were reduced to approximately zero for semi-humid, semi-dry, and dry zones, respectively, during calibration and validation. However, the daily CORRs remained almost the same through the calibration and validation for all CZs.
As indicated in Table 3, the Ori-CDR overestimated the areal mean daily rainfall, by 0.08, 0.13, and 0.10 mm per day during the calibration for semi-humid, semi-dry, and dry zones, respectively. During validation, the Ori-CDR overestimated areal mean daily rainfall by 0.11, 0.27, and 0.20 mm per day, respectively, for semi-humid, semi-dry, and dry zones. In addition, daily RMSEs during calibration were 1.17 mm for the semi-humid zone, 1.95 mm for the semi-dry zone, and 1.31 mm for the dry zone. During the validation period, the daily RMSEs were 1.51, 2.28, and 1.33 mm per day for the semi-humid, semi-dry, and dry zones, respectively.
Hence, according to Table 3, the areal mean daily estimations of the Adj-CDR MBs were reduced to around zero for semi-humid, semi-dry, and dry zones, respectively, during the calibration and validation periods. However, the daily CORRs remain almost the same during both the calibration and validation periods for all CZs.
However, the Ori-CHIRPS underestimates the areal mean daily rainfall, by −0.03, −0.02, and −0.02 mm per day during calibration for semi-humid, semi-dry, and dry zones, respectively (Table 3). Conversely, during validation, the Ori-CHIRPPS overestimated the areal mean daily rainfall by 0.02, 0.12, and 0.10 mm per day for semi-humid, semi-dry, and dry zones, respectively. In addition, daily RMSEs during calibration were 1.17 mm for the semi-humid zone, 1.93 mm for the semi-dry zone, and 1.30 mm for the dry zone. During the validation year, the daily RMSEs were 1.48, 2.31, and 1.26 mm per day for semi-humid, semi-dry, and dry zones, respectively.
During calibration and validation, the daily mean areal rainfall estimations of the Adj-CHIRPS MBs (Table 3) were reduced to around zero for semi-humid, semi-dry, and dry zones. However, the daily RMSEs increased slightly during the calibration and validation periods, whereas the daily CORRs remained unchanged during both the calibration and validation periods.
Finally, Table 3 shows that Ori-GPCP overestimated the areal mean daily rainfall by 0.03, 0.05, and 0.09 mm per day during the semi-humid, semi-dry, and dry calibration zones, respectively. The Ori-GPCP, however, overestimated the areal mean daily rainfall by 0.08, 0.16, and 0.18 mm per day during validation for zones semi-humid, semi-dry, and dry, respectively. Additionally, the daily RMSEs during calibration were 1.27 mm for the semi-humid zone, 2.17 mm for the semi-dry zone, and 1.44 mm for the dry zone. During the validation year, the daily RMSEs were 1.67, 2.65, and 1.47 mm per day for semi-humid, semi-dry, and dry zones, respectively.
Hence, according to Table 3, the areal mean daily estimations of the Adj-GPCP MBs were reduced to approximately zero for all zones during both periods. However, the daily CORRs remained almost the same for all zones during calibration and validation periods.
Figure 9 shows the calibration periods for the three zones were 2003, 2008, and 2013, and the validation period was 2017. Additionally, the gauge observations (red), original satellite estimations (green), and bias-adjusted estimations (blue) for each of those years are shown in Figure 9. Calibration validation shows that Ori-CCS overestimated CZs in the given years. The cumulative rainfall time series from Adj-CCS were adjusted to match those from gauge readings for overall CZs. For both calibration and validation years, the suggested QM technique was found to be effective in correcting the systematic bias of Ori-CCS rainfall estimations over the studied CZs.
Data from 2003, 2008, and 2013 were used for calibration for the three zones, and 2017 data was used for validation (Figure 10), indicating the accrued daily rainfall time series from the gauge observations, original satellite, and bias-adjusted estimations. Ori-CDR overestimated all CZs during the calibration and validation periods in the selected years. Adjusted rainfall time series were consistent with the overall CZ rainfall time series in all selected years for both periods once the adjustment was made. Thus, the suggested QM method may be used to correct the systematic bias in Ori-CDR rainfall estimates for calibration and validation years over the CZs that were taken into account.
Rainfall measurements, satellite estimations, and bias-adjusted estimates for the years 2003, 2008, and 2013 were utilized to represent the calibration period, and 2017 was used for the validation period. Figure 11 shows the accrued daily rainfall time series. Over the semi-humid zone, Ori-CHIRPS was reliable in 2003 and 2017, whereas it was overestimated in 2008 and underestimated in 2013. For the semi-dry zone, Ori-CHIRPS was accurate in 2003, although it was overestimated in 2008 and underestimated in 2013. In contrast, for the dry zone, Ori-CHIRPS was stable in 2003, 2008, and 2013 but was significantly underrated in 2017. For all years except 2003, the Adj-CHIRPS total annual precipitation data were consistent with the gauge measurements over the semi-dry and dry zones after the adjustment. Thus, the suggested QM technique efficiently corrected Ori-CHIRPS rainfall estimates’ systematic bias for calibration and validation years over the considered CZs.
Daily observations from rain gauges, satellite estimates, and bias-adjusted estimates are shown in Figure 12 for each of the three zones.
Ori-GPCP rainfall estimates were consistent with rain gauge observations in 2003 and 2008 and underestimated in 2013 and 2017 over the semi-humid zone. In contrast, Ori-GPCP was consistent with rain gauge observation over the semi-dry zone in the chosen years and underestimated in the validation period. Ori-GPCP was minimized over the dry zone during both periods in the selected years. There were no discrepancies between Adj-rainfall GPCP’s time series and the entire CZ rainfall time series in the years selected by the adjustment. This shows that the QM technique successfully adjusted the systematic bias of Ori-GPCP rainfall estimates over the CZs studied for the calibration and validation years.
Specifically, QM altered the CDFs of SRE observations to be consistent with CDFs of rain gauge observations, thus aiding in the correction of the significant amount of bias from the SREs. However, QM does not correct SRE estimates by matching the procedures from one event to the next over a period of time. Since the QM correction only considers the probability distribution of rainfall, it ignores the effects of daily adjustments and simultaneous observations. To this end, rather than reducing random mistakes, the QM technique can assist in correcting biases in the overall magnitude of rain. Many academic papers have highlighted this as a weakness of quality management [52].

4. Conclusions

The adjusted rainfall products of four satellites were evaluated in monthly and daily time steps over the three CZs. The results of the areal mean monthly rainfall time series revealed that the QM with CZs successfully minimized the systematic bias and RMSE of the Ori-CCS by 68% and 99%, respectively, during the calibration period; furthermore, the systematic bias and RMSE decreased by 95% and 83%, respectively, during the validation period, with very high CORRs overall for the CZs during both periods. The QM with CZs also successfully reduced the systematic bias and RMSE of the Ori-CDR by 70% and 80%, respectively, during the calibration period, whereas the systematic bias and RMSEs decreased by 22% and 48%, respectively, during the validation period, with very high CORRs overall for the CZs during both periods. The QM with CZs successfully adjusted only the systematic bias of the Ori-CHIRPS by 84% overall for the CZs during both periods; however, no improvement was noted in RMSEs or CORRs, although the CORRs were very high overall for the CZs during both periods. The CORRs in Table 2 and Table 3 do not show much improvement after bias adjustment. This was ascribed to random inaccuracies in local time, the study duration (2003–2017), and inconsistency in satellite estimation. In particular, missing and false alarms for satellite estimates are seldom correctable using the QM technique. Furthermore, the QM with CZs successfully adjusted the systematic bias and RMSEs of the Ori-GPCP by 90% and 30%, respectively, during the calibration period, whereas the systematic bias and RMSEs decreased by 83% and 64%, respectively, during the validation period, with very high CORRs overall for the CZs during both periods.
For the daily rainfall products, during the calibration period, the QM with CZs successfully minimized the systematic bias by 99%, 97%, 85%, and 100% for Ori-CCS, Ori-CDR, Ori-CHIRPS, and Ori-GPCP, respectively, whereas the RMSEs were decreased by 29% for only Ori-CCS, and with minor changes for Ori-CDR, Ori-CHIRPS, and Ori-GPCP overall CZs. In addition, the CORRs between the rain gauge observations and the four SREs were almost constant but with low values of overall CZs. Overall, the QM method with CZs showed that all SREs were adjusted well during the validation period. The QM method can reduce the systematic mean bias of the daily and monthly time series for all SREs.

Author Contributions

Conceptualization, M.S.A.S.; methodology, M.S.A.S., S.I. and A.A.; software, M.S.A.S., A.A. and Y.O.; validation, M.S.A.S., S.I., A.A., Y.O., I.A.A., S.L.H. and M.M.M.T.; formal analysis, S.L.H.; data curation, M.S.A.S., S.I., Y.O., I.A.A. and M.M.M.T.; writing—original draft preparation, M.S.A.S., S.I. and S.L.H.; writing—review and editing, M.S.A.S. and S.L.H.; visualization, M.S.A.S., S.I., A.A., Y.O., I.A.A., S.L.H. and M.M.M.T.; supervision, Q.Y. All authors have read and agreed to the published version of the manuscript.

Funding

This research received no external funding.

Institutional Review Board Statement

Not applicable.

Informed Consent Statement

Not applicable.

Data Availability Statement

The data used to support this study are included in the manuscript.

Acknowledgments

This research was partially supported by the China Scholarship Council (CSC) of the People’s Republic of China’s Ministry of Education and China University of Geoscience.

Conflicts of Interest

The authors declare no conflict of interest.

Abbreviations

SREsSatellite-based Rainfall Estimates
PERSIANN-CCSArtificial Neural Networks–Cloud Classification System
PERSIANN-CDRArtificial Neural Networks-
CHIRPSClimate Hazards Group InfraRed Precipitation with Station data
GPCPGlobal Precipitation Climatology Project
QMQuantile Mapping
CZsClimatic Zones
CDFCumulative Distribution Function
SNMDSudan National Meteorological Department
CHRSCenter for Hydrometeorology and Remote Sensing
ISCCPInternational Satellite Cloud Climatology Project
USGSUnited States Geological Survey
UCSBUniversity of California, Santa Barbara
RMSEsRoot Mean Square Errors
Ori-CCSOriginal Cloud Classification System
Ori-CDROriginal Climate Data Record
Ori-CHIRPSOriginal Climate Hazards Group InfraRed Precipitation with Station data
Ori-GCPCOriginal Global Precipitation Climatology Project
Adj-CCSAdjustment Cloud Classification System
Adj-CDRAdjustment Climate Data Record
Adj-CHIRPSAdjustment Climate Hazards Group InfraRed Precipitation with Station data
Adj-GCPCAdjustment Global Precipitation Climatology Project
MBMean Bias
CORRCorrelation Coefficient

References

  1. Maliva, R.; Missimer, T. [Environmental Science and Engineering] Arid Lands Water Evaluation and Management; Springer: Berlin/Heidelberg, Germany, 2012. [Google Scholar] [CrossRef]
  2. Sultana, R.; Nasrollahi, N. Evaluation of Remote Sensing Precipitation Estimates over Saudi Arabia. J. Arid. Environ. 2018, 151, 90–103. [Google Scholar] [CrossRef]
  3. Derin, Y.; Anagnostou, E.; Berne, A.; Borga, M.; Boudevillain, B.; Buytaert, W.; Chang, C.-H.; Delrieu, G.; Hong, Y.; Hsu, Y.C.; et al. Multiregional Satellite Precipitation Products Evaluation over Complex Terrain. J. Hydrometeorol. 2016, 17, 1817–1836. [Google Scholar] [CrossRef]
  4. Behrangi, A.; Khakbaz, B.; Jaw, T.C.; AghaKouchak, A.; Hsu, K.; Sorooshian, S. Hydrologic Evaluation of Satellite Precipitation Products over a Mid-Size Basin. J. Hydrol. 2011, 397, 225–237. [Google Scholar] [CrossRef] [Green Version]
  5. Fabry, F. Meteorological Value of Ground Target Measurements by Radar. J. Atmos. Oceanic Technol. 2004, 21, 560–573. [Google Scholar] [CrossRef]
  6. Sadeghi, M.; Nguyen, P.; Naeini, M.R.; Hsu, K.; Braithwaite, D.; Sorooshian, S. PERSIANN-CCS-CDR, a 3-Hourly 0.04° Global Precipitation Climate Data Record for Heavy Precipitation Studies. Sci. Data 2021, 8, 157. [Google Scholar] [CrossRef]
  7. Amorim, J.d.S.; Viola, M.R.; Junqueira, R.; Oliveira, V.A.d.; Mello, C.R. Evaluation of Satellite Precipitation Products for Hydrological Modeling in the Brazilian Cerrado Biome. Water 2020, 12, 2571. [Google Scholar] [CrossRef]
  8. Pang, J.; Zhang, H.; Xu, Q.; Wang, Y.; Wang, Y.; Zhang, O.; Hao, J. Hydrological Evaluation of Open-Access Precipitation Data Using SWAT at Multiple Temporal and Spatial Scales. Hydrol. Earth Syst. Sci. 2020, 24, 3603–3626. [Google Scholar] [CrossRef]
  9. Jiang, X.; Liu, Y.; Wu, Y.; Wang, G.; Zhang, X.; Meng, Q.; Gu, P.; Liu, T. Evaluation of the Performance of Multi-Source Precipitation Data in Southwest China. Water 2021, 13, 3200. [Google Scholar] [CrossRef]
  10. Huff, F.A. Sampling Errors in Measurement of Mean Precipitation. J. Appl. Meteorol. 1970, 9, 35–44. [Google Scholar] [CrossRef]
  11. Goovaerts, P. Geostatistics for Natural Resources Evaluation; Oxford University Press: Oxford, UK, 1997; ISBN 9780195115383. [Google Scholar] [CrossRef]
  12. Haberlandt, U. Geostatistical Interpolation of Hourly Precipitation from Rain Gauges and Radar for a Large-Scale Extreme Rainfall Event. J. Hydrol. 2007, 332, 144–157. [Google Scholar] [CrossRef]
  13. Wang, N.; Liu, W.; Sun, F.; Yao, Z.; Wang, H.; Liu, W. Evaluating Satellite-Based and Reanalysis Precipitation Datasets with Gauge-Observed Data and Hydrological Modeling in the Xihe River Basin, China. Atmos. Res. 2020, 234, 104746. [Google Scholar] [CrossRef]
  14. Goovaerts, P. Geostatistical Methodes for Incorporating Elevation into the Spatial Interpolation of Rainfall. J. Hydrol. 2000, 228, 113–129. [Google Scholar] [CrossRef]
  15. Boushaki, F.I.; Hsu, K.-L.; Sorooshian, S.; Park, G.-H.; Mahani, S.; Shi, W. Bias Adjustment of Satellite Precipitation Estimation Using Ground-Based Measurement: A Case Study Evaluation over the Southwestern United States. J. Hydrometeorol. 2009, 10, 1231–1242. [Google Scholar] [CrossRef]
  16. Pan, B.; Hsu, K.; AghaKouchak, A.; Sorooshian, S. Improving Precipitation Estimation Using Convolutional Neural Network. Water Resour. Res. 2019, 55, 2301–2321. [Google Scholar] [CrossRef] [Green Version]
  17. Sadeghi, M.; Asanjan, A.A.; Faridzad, M.; Nguyen, P.; Hsu, K.; Sorooshian, S.; Braithwaite, D. PERSIANN-CNN: Precipitation Estimation from Remotely Sensed Information Using Artificial Neural Networks–Convolutional Neural Networks. J. Hydrometeorol. 2019, 20, 2273–2289. [Google Scholar] [CrossRef]
  18. Zhao, B.; Dai, Q.; Zhuo, L.; Mao, J.; Zhu, S.; Han, D. Accounting for Satellite Rainfall Uncertainty in Rainfall-Triggered Landslide Forecasting. Geomorphology 2022, 398, 108051. [Google Scholar] [CrossRef]
  19. Hussein, K.A.; Alsumaiti, T.S.; Ghebreyesus, D.T.; Sharif, H.O.; Abdalati, W. High-Resolution Spatiotemporal Trend Analysis of Precipitation Using Satellite-Based Products over the United Arab Emirates. Water 2021, 13, 2376. [Google Scholar] [CrossRef]
  20. Huffman, G.J.; Adler, R.F.; Morrissey, M.M.; Bolvin, D.T.; Curtis, S.; Joyce, R.; McGavock, B.; Susskind, J. Global Precipitation at One-Degree Daily Resolution from Multisatellite Observations. J. Hydrometeor. 2001, 2, 36–50. [Google Scholar] [CrossRef] [Green Version]
  21. Sun, Q.; Miao, C.; Duan, Q.; Ashouri, H.; Sorooshian, S.; Hsu, K. A Review of Global Precipitation Data Sets: Data Sources, Estimation, and Intercomparisons. Rev. Geophys. 2018, 56, 79–107. [Google Scholar] [CrossRef] [Green Version]
  22. Behrangi, A.; Andreadis, K.; Fisher, J.B.; Turk, F.J.; Granger, S.; Painter, T.; Das, N. Satellite-Based Precipitation Estimation and Its Application for Streamflow Prediction over Mountainous Western US Basins. J. Appl. Meteorol. Climatol. 2014, 53, 2823–2842. [Google Scholar] [CrossRef] [Green Version]
  23. Thiemig, V.; Rojas, R.; Zambrano-Bigiarini, M.; De Roo, A. Hydrological Evaluation of Satellite-Based Rainfall Estimates over the Volta and Baro-Akobo Basin. J. Hydrol. 2013, 499, 324–338. [Google Scholar] [CrossRef]
  24. Gebregiorgis, A.S.; Tian, Y.; Peters-Lidard, C.D.; Hossain, F. Tracing Hydrologic Model Simulation Error as a Function of Satellite Rainfall Estimation Bias Components and Land Use and Land Cover Conditions: Tracing Hydrologic Model Simulation Error. Water Resour. Res. 2012, 48, 11. [Google Scholar] [CrossRef] [Green Version]
  25. Fang, G.H.; Yang, J.; Chen, Y.N.; Zammit, C. Comparing Bias Correction Methods in Downscaling Meteorological Variables for a Hydrologic Impact Study in an Arid Area in China. Hydrol. Earth Syst. Sci. 2015, 19, 2547–2559. [Google Scholar] [CrossRef] [Green Version]
  26. Rodrigues, D.T.; Santos e Silva, C.M.; dos Reis, J.S.; Palharini, R.S.A.; Cabral Junior, J.B.; da Silva, H.J.F.; Mutti, P.R.; Bezerra, B.G.; Goncalves, W.A. Evaluation of the Integrated Multi-SatellitE Retrievals for the Global Precipitation Measurement (IMERG) Product in the São Francisco Basin (Brazil). Water 2021, 13, 2714. [Google Scholar] [CrossRef]
  27. Lin, T.; Hu, L.; Guo, Z.; Qin, Y.; Yang, Z.; Zhang, G.; Zheng, M. Sources of Polycyclic Aromatic Hydrocarbons to Sediments of the Bohai and Yellow Seas in East Asia: Sources of Pahs to BS and YS Sediments. J. Geophys. Res. 2011, 116, 23305. [Google Scholar] [CrossRef]
  28. Tesfagiorgis, K.; Mahani, S.E.; Krakauer, N.Y.; Khanbilvardi, R. Bias Correction of Satellite Rainfall Estimates Using a Radar-Gauge Product—A Case Study in Oklahoma (USA). Hydrol. Earth Syst. Sci. 2011, 15, 2631–2647. [Google Scholar] [CrossRef] [Green Version]
  29. Seo, D.-J.; Breidenbach, J.P. Real-Time Correction of Spatially Nonuniform Bias in Radar Rainfall Data Using Rain Gauge Measurements. J. Hydrometeorol. 2002, 3, 93–111. [Google Scholar] [CrossRef] [Green Version]
  30. Smith, T.M.; Arkin, P.A.; Bates, J.J.; Huffman, G.J. Estimating Bias of Satellite-Based Precipitation Estimates. J. Hydrometeorol. 2006, 7, 841–856. [Google Scholar] [CrossRef]
  31. McCollum, J.R.; Krajewski, W.F.; Ferraro, R.R.; Ba, M.B. Evaluation of Biases of Satellite Rainfall Estimation Algorithms over the Continental United States. J. Appl. Meteorol. 2002, 41, 1065–1080. [Google Scholar] [CrossRef]
  32. Schmidli, J.; Frei, C.; Vidale, P.L. Downscaling from GCM Precipitation: A Benchmark for Dynamical and Statistical Downscaling Methods. Int. J. Climatol. 2006, 26, 679–689. [Google Scholar] [CrossRef]
  33. Chen, J.; Brissette, F.P.; Chaumont, D.; Braun, M. Finding Appropriate Bias Correction Methods in Downscaling Precipitation for Hydrologic Impact Studies over North America: Evaluation of Bias Correction Methods. Water Resour. Res. 2013, 49, 4187–4205. [Google Scholar] [CrossRef]
  34. van Steenbergen, E.F.; Ellemers, N. Is Managing the Work-Family Interface Worthwhile? Benefits for Employee Health and Performance. J. Organiz. Behav. 2009, 30, 617–642. [Google Scholar] [CrossRef]
  35. Themeßl, M.J.; Gobiet, A.; Heinrich, G. Empirical-Statistical Downscaling and Error Correction of Regional Climate Models and Its Impact on the Climate Change Signal. Clim. Chang. 2012, 112, 449–468. [Google Scholar] [CrossRef]
  36. Piani, C.; Weedon, G.P.; Best, M.; Gomes, S.M.; Viterbo, P.; Hagemann, S.; Haerter, J.O. Statistical Bias Correction of Global Simulated Daily Precipitation and Temperature for the Application of Hydrological Models. J. Hydrol. 2010, 395, 199–215. [Google Scholar] [CrossRef]
  37. Zhang, X.; Tang, Q. Combining Satellite Precipitation and Long-Term Ground Observations for Hydrological Monitoring in China: Satellite-Aided Hydrological Monitoring. J. Geophys. Res. Atmos. 2015, 120, 6426–6443. [Google Scholar] [CrossRef] [Green Version]
  38. Shen, Y.; Zhao, P.; Pan, Y.; Yu, J. A High Spatiotemporal Gauge-Satellite Merged Precipitation Analysis over China. J. Geophys. Res. Atmos. 2014, 119, 3063–3075. [Google Scholar] [CrossRef]
  39. Elagib, N.A.; Mansell, M.G. Recent Trends and Anomalies in Mean Seasonal and Annual Temperatures over Sudan. J. Arid. Environ. 2000, 45, 263–288. [Google Scholar] [CrossRef]
  40. Hong, Y.; Hsu, K.-L.; Sorooshian, S.; Gao, X. Precipitation Estimation from Remotely Sensed Imagery Using an Artificial Neural Network Cloud Classification System. J. Appl. Meteorol. 2004, 43, 1834–1853. [Google Scholar] [CrossRef] [Green Version]
  41. Hsu, K.; Gao, X.; Sorooshian, S.; Gupta, H.V. Precipitation Estimation from Remotely Sensed Information Using Artificial Neural Networks. J. Appl. Meteorol. 1997, 36, 1176–1190. [Google Scholar] [CrossRef]
  42. Funk, C.C.; Peterson, P.J.; Landsfeld, M.F.; Pedreros, D.H.; Verdin, J.P.; Rowland, J.D.; Romero, B.E.; Husak, G.J.; Michaelsen, J.C.; Verdin, A.P. A Quasi-Global Precipitation Time Series for Drought Monitoring; US Geological Survey Data Series; US Geological Survey: Reston, VA, USA, 2014. [Google Scholar] [CrossRef]
  43. Meadows, G.A.; Meadows, L.A.; Wood, W.L.; Hubertz, J.M.; Perlin, M. The Relationship between Great Lakes Water Levels, Wave Energies, and Shoreline Damage. Bull. Am. Meteorol. Soc. 1997, 78, 675–682. [Google Scholar] [CrossRef] [Green Version]
  44. Miao, C.; Ashouri, H.; Hsu, K.-L.; Sorooshian, S.; Duan, Q. Evaluation of the PERSIANN-CDR Daily Rainfall Estimates in Capturing the Behavior of Extreme Precipitation Events over China. J. Hydrometeorol. 2015, 16, 1387–1396. [Google Scholar] [CrossRef] [Green Version]
  45. Hong, Y.; Gochis, D.; Cheng, J.; Hsu, K.; Sorooshian, S. Evaluation of PERSIANN-CCS Rainfall Measurement Using the NAME Event Rain Gauge Network. J. Hydrometeorol. 2007, 8, 469–482. [Google Scholar] [CrossRef] [Green Version]
  46. Ashouri, H.; Hsu, K.-L.; Sorooshian, S.; Braithwaite, D.K.; Knapp, K.R.; Cecil, L.D.; Nelson, B.R.; Prat, O.P. PERSIANN-CDR: Daily Precipitation Climate Data Record from Multisatellite Observations for Hydrological and Climate Studies. Bull. Am. Meteorol. Soc. 2015, 96, 69–83. [Google Scholar] [CrossRef] [Green Version]
  47. Funk, C.; Peterson, P.; Landsfeld, M.; Pedreros, D.; Verdin, J.; Shukla, S.; Husak, G.; Rowland, J.; Harrison, L.; Hoell, A.; et al. The Climate Hazards Infrared Precipitation with Stations—A New Environmental Record for Monitoring Extremes. Sci. Data 2015, 2, 150066. [Google Scholar] [CrossRef] [PubMed] [Green Version]
  48. Ringard, J.; Seyler, F.; Linguet, L. A Quantile Mapping Bias Correction Method Based on Hydroclimatic Classification of the Guiana Shield. Sensors 2017, 17, 1413. [Google Scholar] [CrossRef] [Green Version]
  49. Osuch, M.; Lawrence, D.; Meresa, H.K.; Napiorkowski, J.J.; Romanowicz, R.J. Projected Changes in Flood Indices in Selected Catchments in Poland in the 21st Century. Stoch. Environ. Res. Risk Assess. 2017, 31, 2435–2457. [Google Scholar] [CrossRef] [Green Version]
  50. Villani, V.; Rianna, G.; Mercogliano, P.; Zollo, A.L. Statistical Approaches versus Weather Generator to Downscale RCM Outputs to Slope Scale for Stability Assessment: A Comparison of Performances. Electron. J. Geotech. Eng. 2015, 20, 22. [Google Scholar]
  51. Kouhestani, S.; Eslamian, S.S.; Abedi-Koupai, J.; Besalatpour, A.A. Projection of Climate Change Impacts on Precipitation Using Soft-Computing Techniques: A Case Study in Zayandeh-Rud Basin, Iran. Glob. Planet. Chang. 2016, 144, 158–170. [Google Scholar] [CrossRef]
  52. Ajaaj, A.A.; Mishra, A.K.; Khan, A.A. Comparison of BIAS Correction Techniques for GPCC Rainfall Data in Semi-Arid Climate. Stoch. Environ. Res. Risk Assess. 2016, 30, 1659–1675. [Google Scholar] [CrossRef]
Figure 1. Location of the study area, Sudan.
Water 14 01475 g001
Figure 2. Climatic zones and locations of rain gauges over Sudan.
Water 14 01475 g002
Figure 3. Seasonal (wet season) CDFs of daily gauge and Ori-CCS, Ori-CDR, Ori-CHIRS, and Ori-GPCP: (a) semi-humid zone, (b) semi-dry, and (c) dry zone.
Water 14 01475 g003
Figure 4. The bias correction flowchart.
Water 14 01475 g004
Figure 5. The areal mean monthly rainfall series for gauge observations, Ori-CCS, and Adj-CCS.
Water 14 01475 g005
Figure 6. The areal mean monthly rainfall series for gauge observation, Ori-CDR, and Adj-CDR.
Water 14 01475 g006
Figure 7. The areal mean monthly rainfall series for gauge observation, Ori-CHIRPS, and Adj-CHIRPS.
Water 14 01475 g007
Figure 8. The areal mean monthly rainfall series for gauge observations, Ori-GPCP, and Adj-GPCP.
Water 14 01475 g008
Figure 9. The cumulative rainfall for gauge observations, Ori-CCS, and Adj-CCS.
Water 14 01475 g009
Figure 10. The cumulative rainfall for gauge observation, Ori-CDR, and Adj-CDR.
Water 14 01475 g010
Figure 11. The cumulative rainfall for gauge observations, Ori-CHIRPS, and Adj-CHIRPS.
Water 14 01475 g011
Figure 12. The cumulative rainfall for gauge observations, Ori- GPCP, and Adj- GPCP.
Water 14 01475 g012
Table 2. Monthly time series evaluation statistics.
SatelliteStatisticsCalibration (2003–2016)Validation (2017)
Semi-Humid
Zone
Semi-Dry
Zone
Dry
Zone
Semi-Humid
Zone
Semi-Dry
Zone
Dry
Zone
Ori-
SREs
Adj-
SREs
Ori-
SREs
Adj-
SREs
Ori-
SREs
Adj-
SREs
Ori-
SREs
Adj-
SREs
Ori-
SREs
Adj-
SREs
Ori-
SREs
Adj-
SREs
CCSMB103.17−0.1374.230.8952.670.41147.495.28137.695.6782.355.55
RMSE114.4031.4191.5433.9372.6822.20159.6324.49153.4123.28102.3720.69
CORR0.840.850.810.810.840.850.890.920.870.880.890.82
MB18.770.5115.99−0.6816.030.2427.273.1333.483.7030.394.73
CDRRMSE28.7322.8132.4428.0625.3717.6042.2932.1543.9021.1337.0611.41
CORR0.950.940.880.880.930.920.890.870.910.910.940.96
MB−6.46−0.78−2.96−0.41−2.66−0.474.121.6014.701.6915.051.60
CHIRPSRMSE21.3824.7023.1825.3515.9419.6427.9531.7623.2121.3318.215.86
CORR0.940.930.920.920.930.910.880.860.960.940.970.99
MB7.830.475.900.3613.190.7019.193.3519.961.5328.182.81
GPCPRMSE20.5620.3826.3225.6322.3615.4039.2534.4621.632.8135.4912.71
CORR0.960.960.900.900.940.930.850.841.001.000.940.94
Table 3. Daily time series evaluation statistics.
SatelliteStatisticsCalibration (2003–2016)Validation (2017)
Semi-Humid
Zone
Semi-Dry
Zone
Dry
Zone
Semi-Humid
Zone
Semi-Dry
Zone
Dry
Zone
Ori-
SREs
Adj-
SREs
Ori-
SREs
Adj-
SREs
Ori-
SREs
Adj-
SREs
Ori-
SREs
Adj-
SREs
Ori-
SREs
Adj-
SREs
Ori-
SREs
Adj-
SREs
CCSMB0.420.000.610.010.340.000.600.021.120.050.540.04
RMSE1.621.152.751.921.771.282.311.494.482.261.991.19
CORR0.380.370.350.340.350.340.050.070.000.030.230.19
MB0.080.000.13−0.010.100.000.110.010.270.030.200.03
CDRRMSE1.171.191.951.981.311.321.511.512.282.201.331.23
CORR0.330.320.300.290.310.300.050.040.080.080.150.14
MB−0.030.00−0.020.00−0.020.000.020.010.120.010.100.01
CHIRPSRMSE1.171.251.932.051.301.391.481.522.312.331.261.25
CORR0.310.300.300.290.290.280.040.030.010.010.160.16
MB0.030.000.050.000.090.000.080.010.160.010.180.02
GPCPRMSE1.271.312.172.231.441.391.671.662.652.511.471.25
CORR0.330.320.290.280.320.310.030.02−0.01−0.020.200.19
Publisher’s Note: MDPI stays neutral with regard to jurisdictional claims in published maps and institutional affiliations.

