Article

A Rapid Method for Authentication of Macroalgae Based on Vis-NIR Spectroscopy Data Combined with Chemometrics Approach

1
Department of Food and Agricultural Product Technology, Faculty of Agricultural Technology, Universitas Gadjah Mada, Jalan Flora, Sleman, Yogyakarta 55281, Indonesia
2
Department of Analytical Chemistry, Faculty of Sciences, University of Cadiz, Agrifood Campus of International Excellence (ceiA3), IVAGRO, 11510 Puerto Real, Spain
3
Research Center for Fishery, National Research and Innovation Agency, Maros 90511, Indonesia
4
Department of Chemistry, Faculty of Mathematics and Natural Sciences, Bogor Agricultural University, Jalan Tanjung Kampus IPB Dramaga, Bogor 16680, Indonesia
*
Author to whom correspondence should be addressed.
Water 2023, 15(1), 100; https://doi.org/10.3390/w15010100
Submission received: 30 November 2022 / Revised: 13 December 2022 / Accepted: 22 December 2022 / Published: 28 December 2022

Abstract

:
Macroalgae are an essential basic ingredient for many industries from which numerous derived products with great economic value are manufactured. Each macroalga has a unique composition that might provide specific physical and chemical information that can be used as markers for authentication. Their compositions may differ depending on different factors, including geographical regions. Unsupervised exploratory techniques, namely principal component analysis (PCA) and hierarchical cluster analysis (HCA), and nonparametric supervised methods including support vector machines (SVMs) and random forests (RFs), were applied to the Vis-NIR spectroscopic data to standardize the quality of macroalgae based on three regional zones in Indonesia (Western, Central, Eastern). A total of 35 macroalgae samples from six islands in Indonesia were analyzed. The PCA and HCA results present a tendency for the samples to be distributed and clustered according to the type of their species. Meanwhile, the SVM successfully classified samples based on their regional zones, and when combined with five-fold cross-validation, acquired an accuracy of 82%. The RF model algorithm obtained an accuracy of 100%, 80%, and 82% for the training, test, and five-fold cross-validation, respectively.

1. Introduction

As the world’s second-largest producer of macroalgae, Indonesia produced 9.9 million tons of macroalgae in 2019 (27.85% of the world total production). Thousands of marine macroalgae species have been described in Indonesia’s marine waters, and some of them have been commercialized, such as Kappaphycus spp. and Gracilaria spp. [1,2,3]. Within the country, macroalgae cultivation has been implemented in 28 of the 34 provinces in Indonesia [4].
Macroalgae, which are commonly known as seaweed, are an essential raw material for many industries, such as food [5], animal feed [6], fine chemicals and biofuel [7]. The variety of macroalgae functions is influenced by their physical and chemical properties, which can be used as markers for authentication and control of the quality of macroalgae. In addition, these properties could affect the final derived product for industrial practices. It has been demonstrated that the compositions of macroalgae are strongly associated with their geographical origin [8] and they also determine the quality characteristics of each macroalga. Moreover, it has also been reported that in Indonesia, the prices in the market are strongly related to the quality of macroalgae [9]. Since macroalgae quality has become an essential issue for producers and industries concerned about the quality and economic aspects, it is necessary to develop a reliable analytical method to standardize the quality of macroalgae based on geographical origin. The analytical method, especially when applied to manage and monitor natural resources, must be a robust analysis, as some sources of uncertainty in the quantification have been identified [10,11,12]. Furthermore, it may help the producer to focus on guaranteeing the origin of Indonesia’s macroalgae species in terms of authentication.
Numerous analytical techniques, including ultra-performance liquid chromatography-photodiode array (UPLC-PDA), gas chromatography-mass spectrometry (GC-MS), and high-performance liquid chromatography (HPLC), have recently been applied to define the provenance and authenticity of food and aquaculture products [13]. All of these techniques generated good outcomes, but they also have certain limitations since they require a long analysis time, involve complicated sample preparation, and are not eco-friendly. In recent years, spectroscopic methods have gained popularity on an industrial scale because they are more efficient, non-destructive, and easy to operate [14,15,16]. For instance, a fluorescence spectroscopy method has been applied to authenticate baijiu spirit based on the quality of the fluorescence properties [17]. Furthermore, a visible-near infrared (Vis-NIR) reflectance spectroscopy method has been developed for saffron authentication [16] and for the identification of peaches based on their geographical origins [18].
Although this tool provides several advantages, the Vis-NIR spectroscopy technique nonetheless provides a large amount of data. Therefore, chemometrics approaches are needed to extract meaningful information so that easy and reliable interpretation can be obtained from the big data. Hence, combining the appropriate chemometrics tools in conjunction with this analytical technique may improve their capabilities. Unsupervised pattern recognition methods like principal component analysis (PCA) and hierarchical cluster analysis (HCA) are frequently performed to handle multivariate data without knowing the previous samples’ classification tendencies. However, because unsupervised algorithms cannot be used to generate future predictions, they are intended to complement the use of supervised techniques in order to successfully create predictive classification or regression models [19]. Within this research, support vector machines (SVMs) and random forest (RFs) are two non-parametric learning algorithms that have been newly applied for classification and regression tasks [19,20]. An example of their application was a study by Calle et al. that applied chemometrics methods, namely SVMs and RFs, in tandem with FT-IR fingerprint data to characterize Sherry vinegar according to its origins [21]. The Vis-NIR spectra combined with HS-IMS data sets and SVMs have also been used to control the quality of honey [22].
Henceforth, this study aimed to discriminate macroalgae from three different regions, namely Western, Central, and Eastern Indonesia, based on their species and geographical origin in terms of authentication. For this purpose, Vis-NIR spectroscopy data were used in combination with unsupervised pattern recognition methods such as HCA and PCA, as well as SVMs and RFs as non-parametric learning algorithms. Additionally, a comparison of the results obtained from different multivariate data analysis techniques to classify the macroalgae samples was established.

2. Materials and Methods

2.1. Samples

Three species of macroalgae, namely Kappaphycus alvarezii, Euchema spinosum, and Gracilaria changii, were obtained by direct sampling from the farmers in six different is-lands and cultivation origins in Indonesia, including Sumatera, Java, Celebes, Bali, West Nusa Tenggara, and Papua. The macroalgae samples were sorted based on three categories according to the three regional zones of Indonesia, namely: Western, Central, and Eastern Indonesia. The macroalgae sampling was carried out from August 2020 to December 2021, and the measurement was conducted from January to June 2022. Fresh macroalgae samples were freeze-dried for 48 h using a freeze-dryer. A Retsch ZM 200 ultra-centrifugal mill was used to grind the macroalgae samples into a particle size of 0.25 m mesh (Fisher Scientific SL, Madrid, Spain). Prior to further treatment, all macroalgae samples were stored in a chiller and kept at 4 °C.
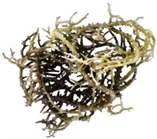
The samples were labeled with the abbreviated name of each species as follows: GR (G. changii), KA (K. alvarezii), and SP (E. spinosum). Furthermore, R1 and R2 are the labels for the first and second replications, respectively. The list of the samples’ origin, along with their codes, can be seen in Table S1. A picture of an example of each species is shown in Table 1.

2.2. Vis-NIR Spectrum Acquisition

Each Vis-NIR spectra was captured at ambient temperature using a FOSS XDS Rapid Content Spectrometer (FOSS Analytical, Hilleroed, Denmark). This instrument had a single laser beam analyzer and all the data spectra were collected from 400 to 2500 nm. For each macroalgae sample, two replications of the analysis were carried out for every two replications of the experiment and were then averaged. Consequently, 70 samples in total were collected.

2.3. Multivariate Data Analysis

All the data analyses were performed using RStudio software version 4.1.2 (RStudio Team 2021, Boston, MA, USA). The Vis-NIRS data set was created by integrating the Vis-NIR spectra for each macroalgae powder sample into a two-dimensional data matrix ( D n × p ), where n is the sum of samples and p is the number of absorbance values obtained without prior treatment. Therefore, a D 70 × 4201 matrix was subsequently acquired for multivariate data analysis. A flowchart of the multivariate data analysis is shown in Figure 1 to provide a visual perspective.
To retrieve and interpret the graphic outcomes of the multivariate data and to collect information from the data’s structure, unsupervised data analysis techniques such as principal component analysis (PCA) and hierarchical cluster analysis (HCA) were executed using a variety of packages, including hclust, ggplot2, and factoextra. Support vector machines (SVMs) and random forests (RFs) were the supervised techniques used to classify the samples.
The concept underlying SVMs is the use of a kernel function to transfer data properties onto a high-dimensional feature space. The radial basis function (RBF) kernel is one of the most widely utilized kernel functions and has been applied to a wide range of datasets. When there are a high number of training samples and a limited number of features, the RBF kernel greatly helps.
The RF algorithm is a multifunctional classifier, which is an ensemble learning technique, made up of numerous decision trees that are unrelated to any others. The sample category is chosen based on the voting mechanism of each decision tree, and the category with the most votes is decided as the final classification result.

3. Results and Discussion

3.1. Vis-NIR Data Spectra

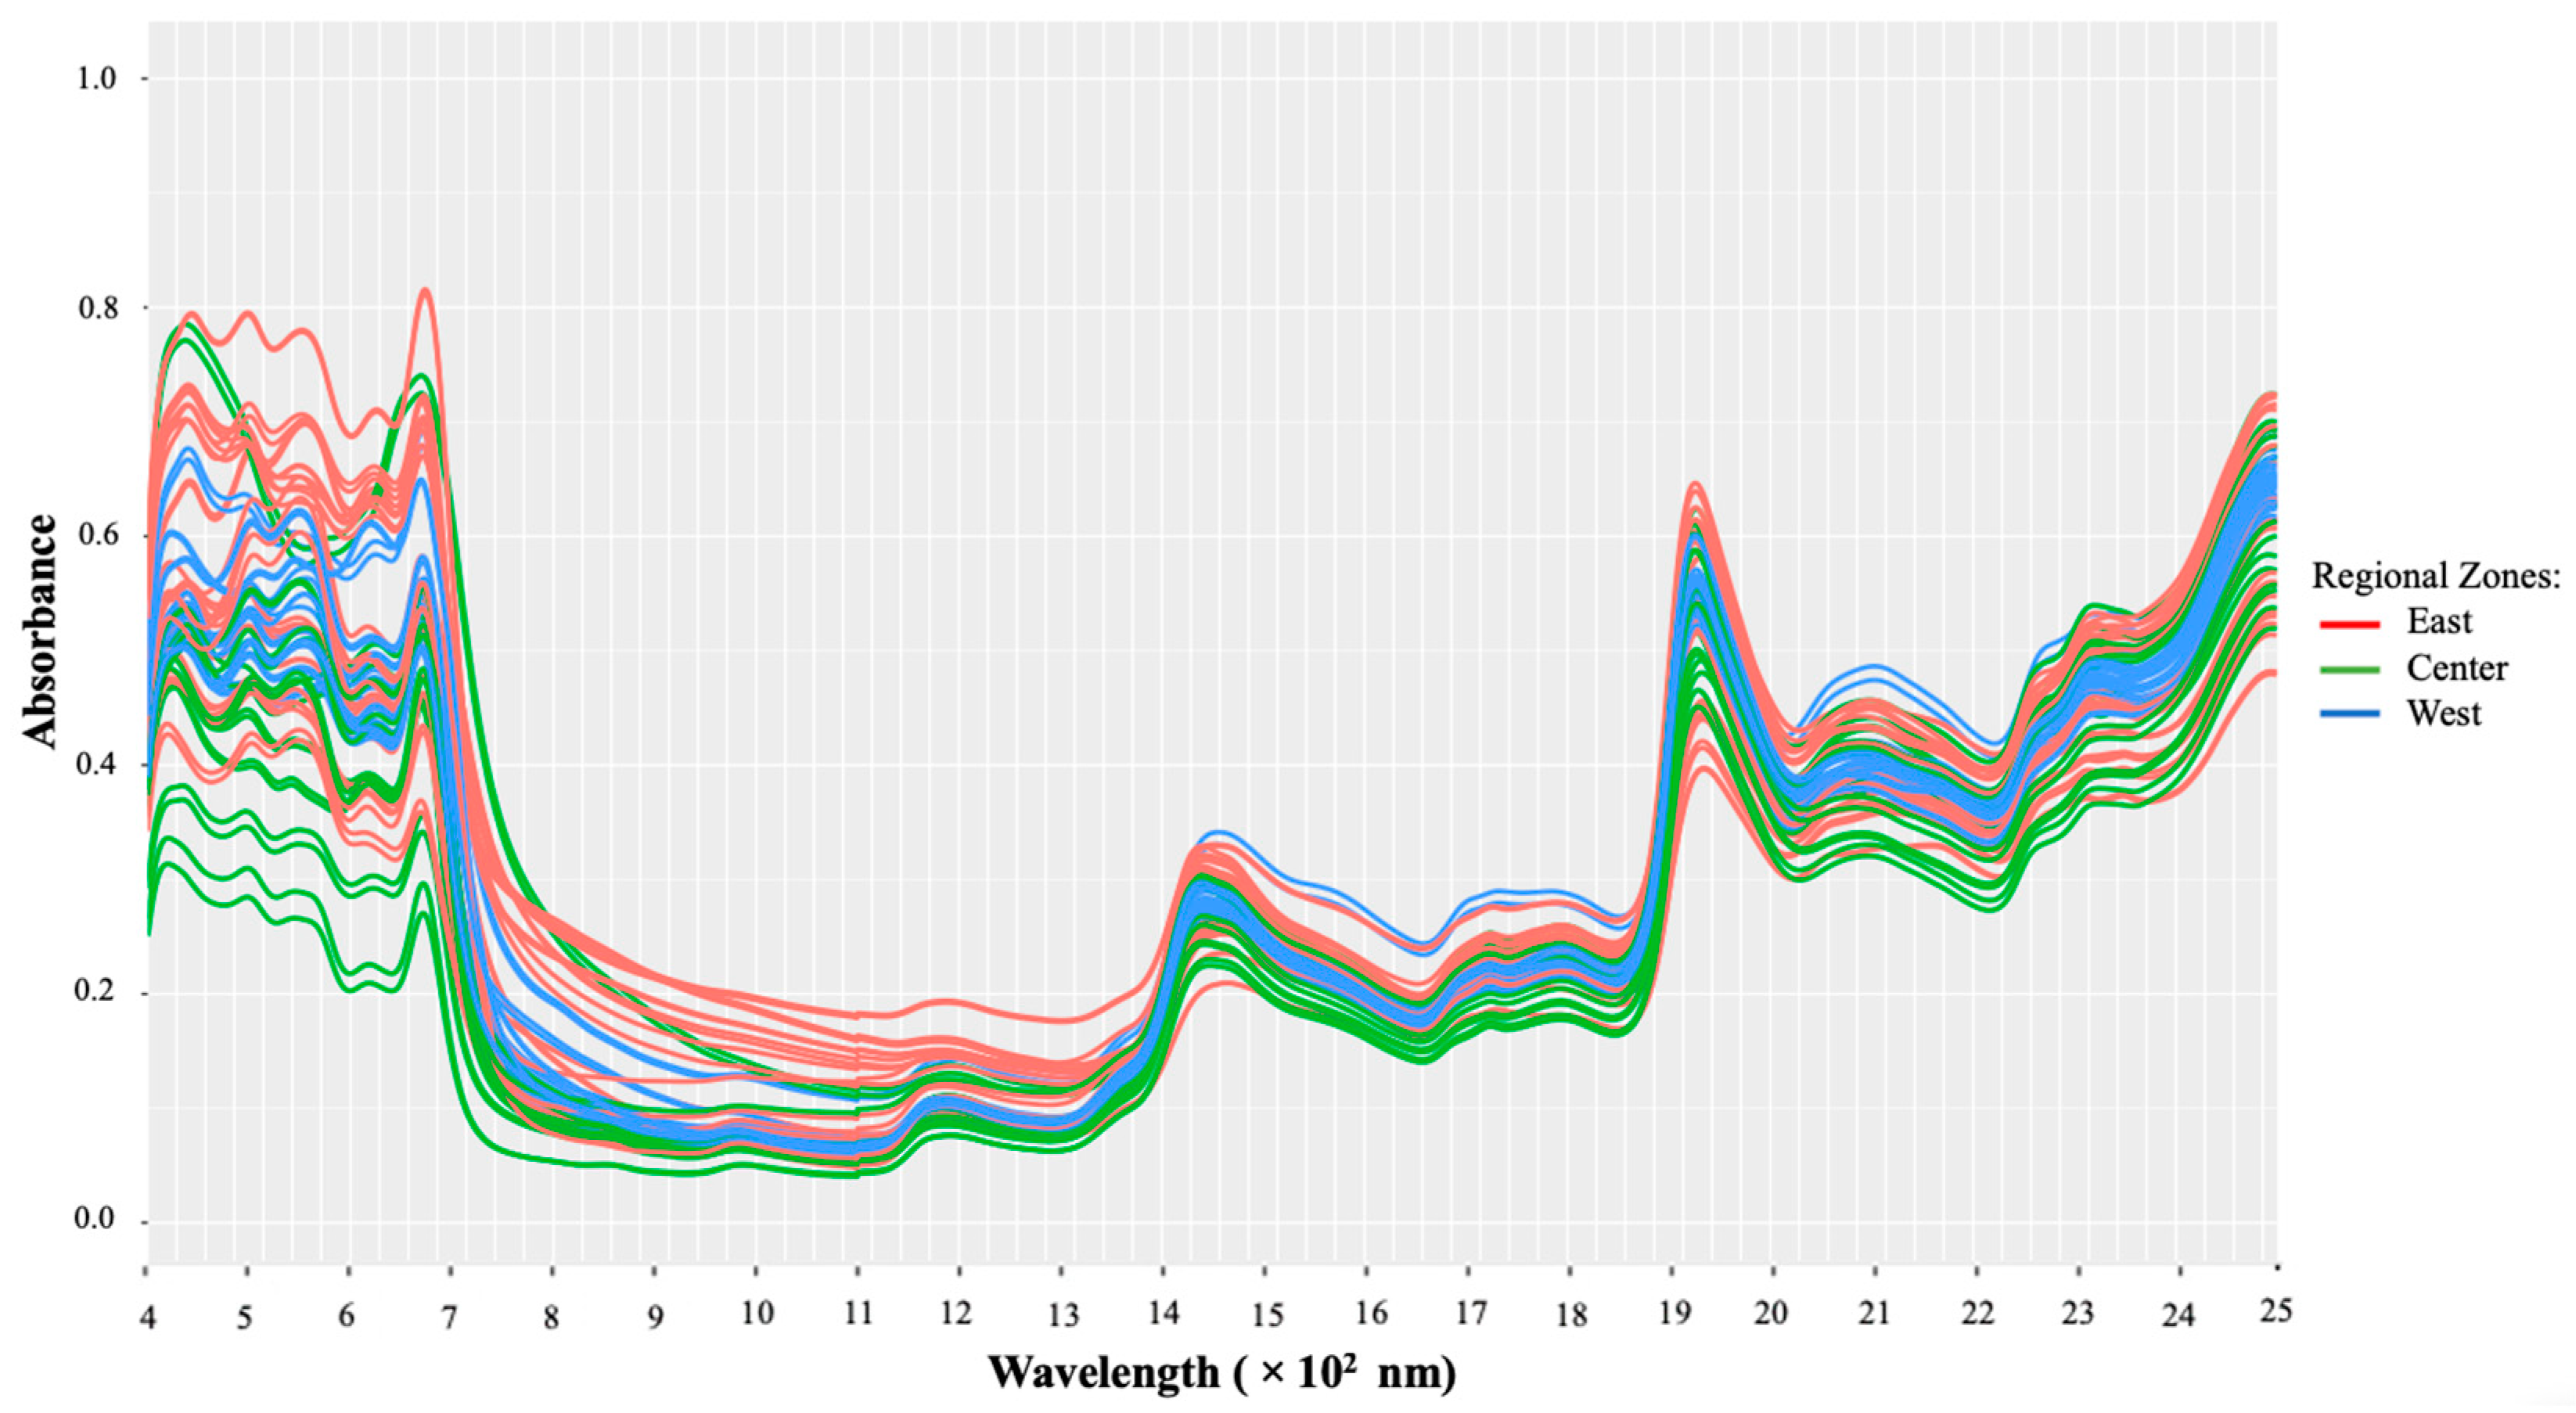
Figure 2 illustrates the raw Vis-NIR absorbance spectra of all macroalgae samples. It is obvious from the figure that the overall shape and prominent peaks were the same and closely overlapped, yet differences in their magnitudes were quite noticeable. Due to the various colors and pigments in the samples, there are subtle differences in reflectance intensity as well, notably in the visible (Vis) area (400–700 nm). It has also been reported that the environment where the macroalgae grow could affect their chemical composition, determining the different colors produced by the macroalgae [15,23].
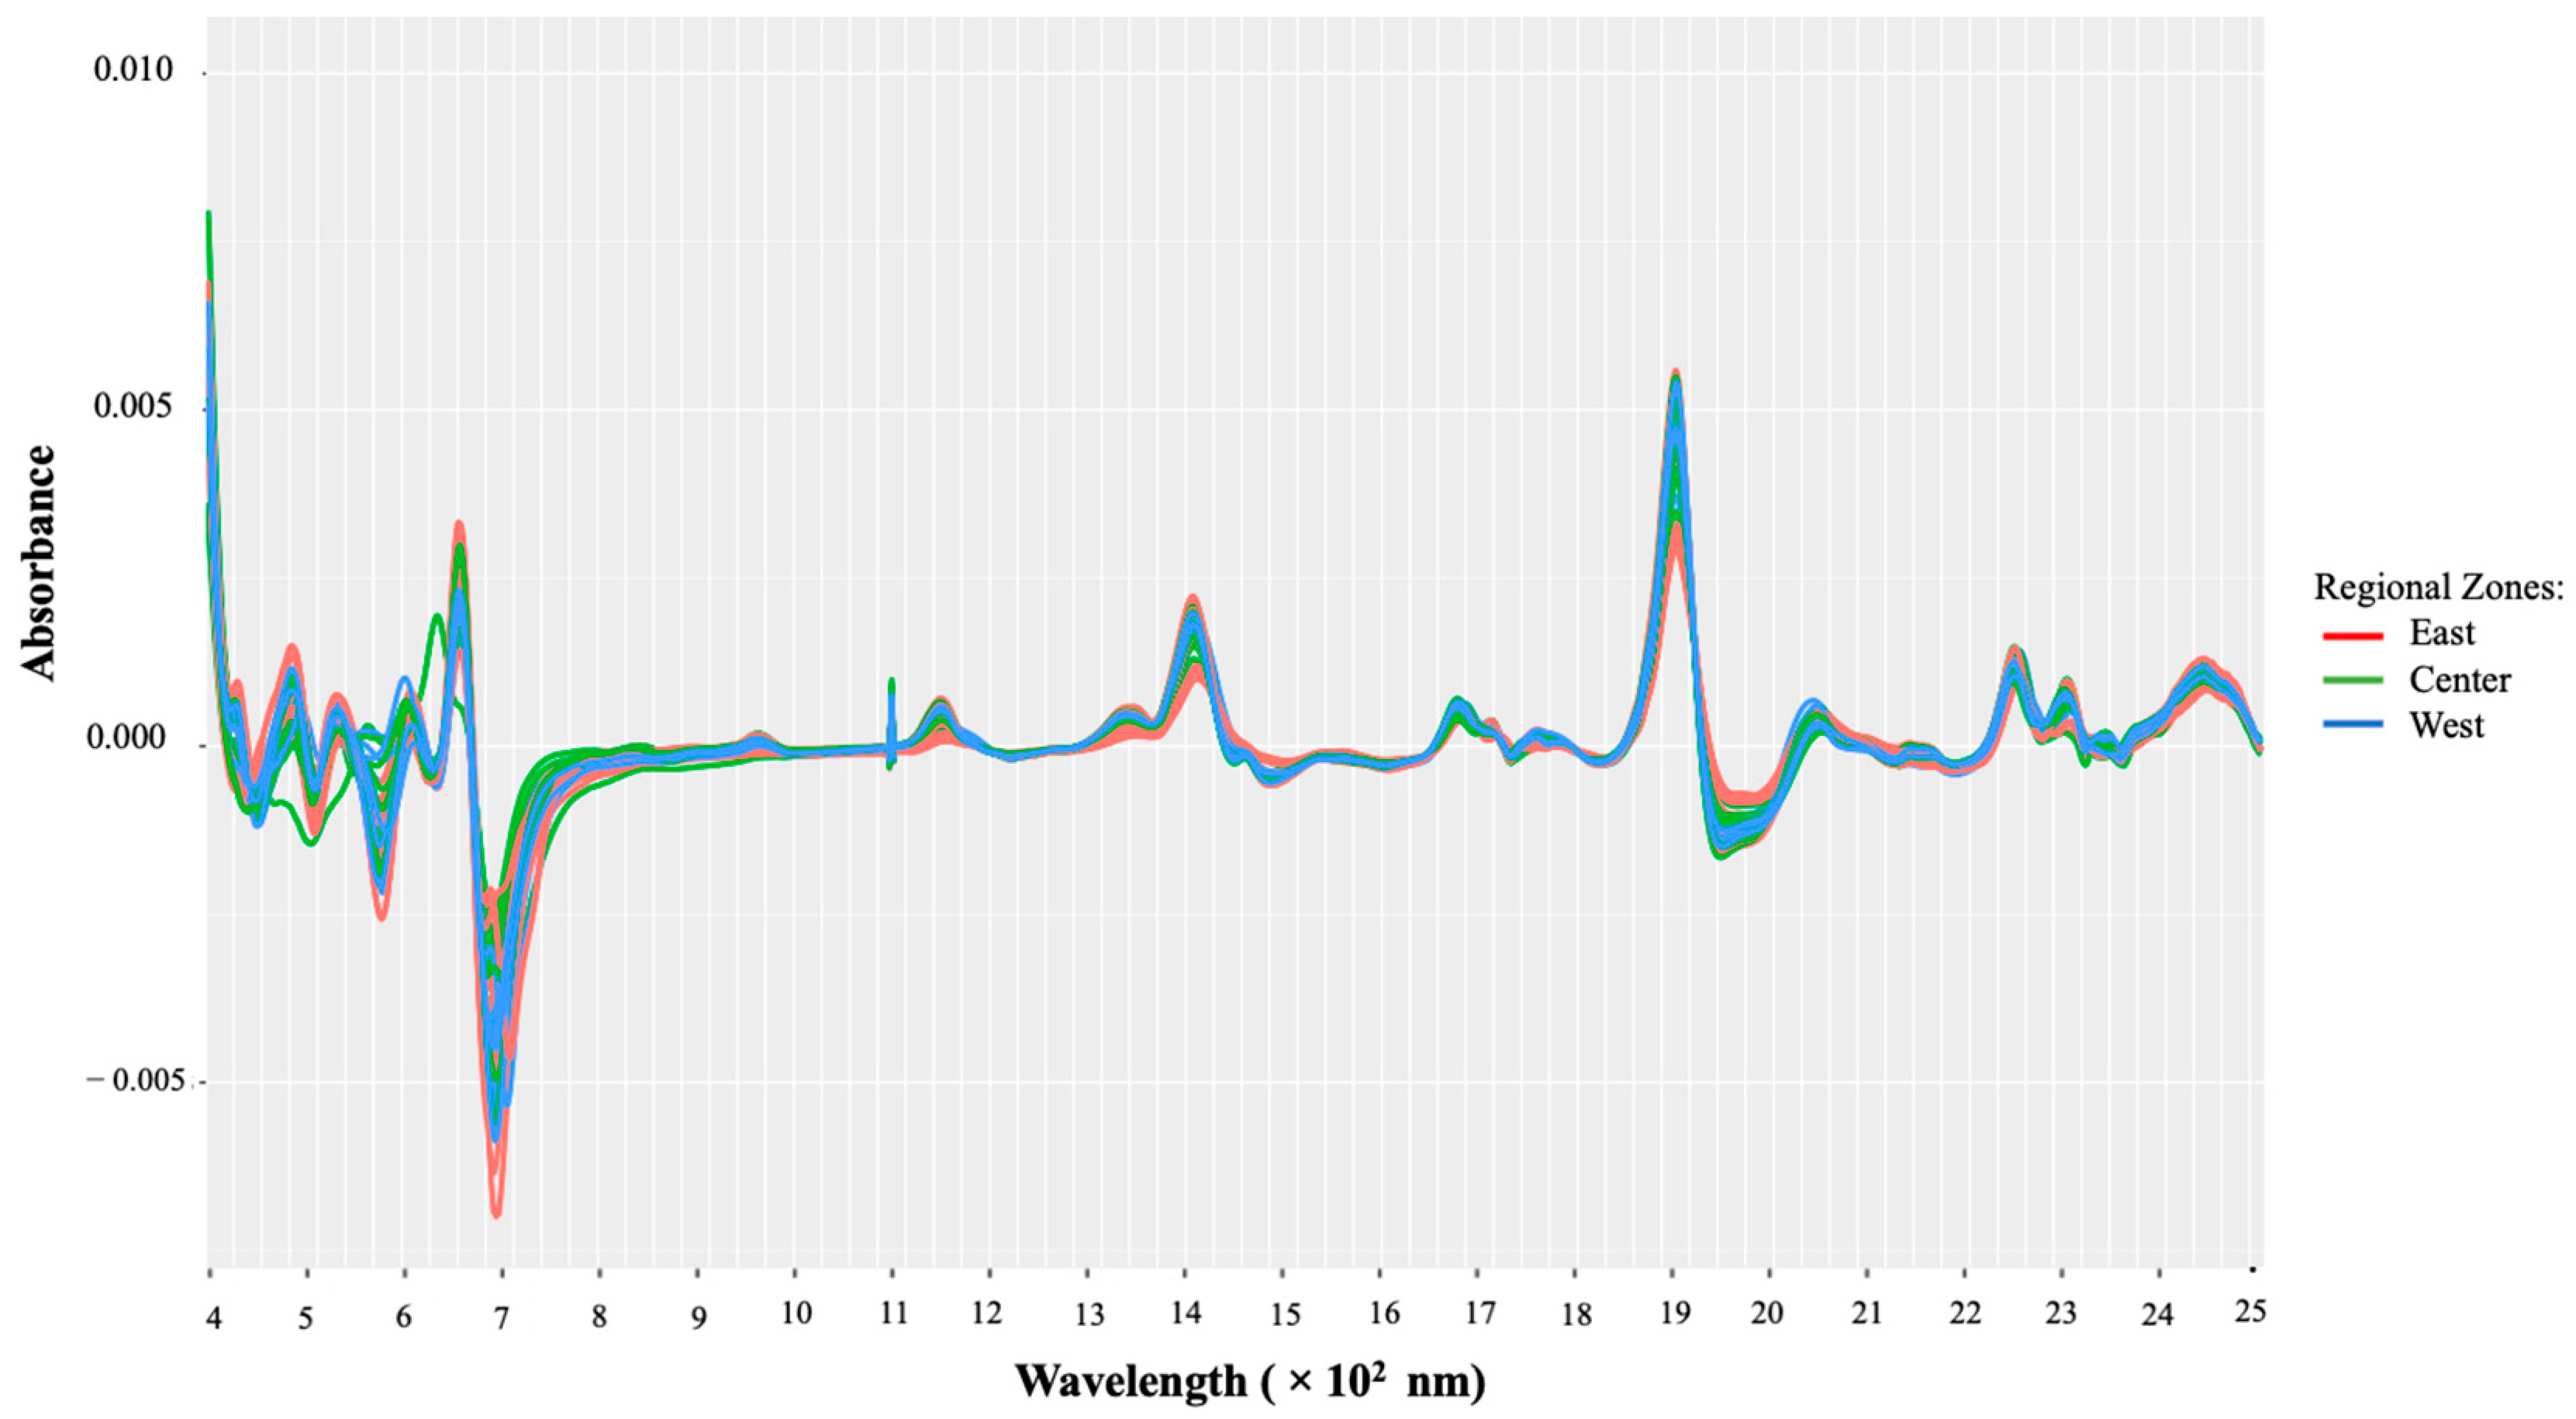
A transformation of the raw Vis-NIR data was performed; the transformation involved the Savitzky–Golay (SG) filter with the first derivative using a second-degree polynomial. To also address the issue of overlapping peaks and baseline shifts, the first derivative was chosen, and the SG filter was applied to minimize the noise. Following such pretreatment, the resulting spectra are presented in Figure 3. It should be noticed that after applying the SG filter, the resulting matrix is then reduced from 4201 to 4187 variables; hence, the data matrix used is given by D 70 × 4187 .

3.2. Exploratory Analysis

By utilizing the stats package’s hclust function, hierarchical cluster analysis (HCA) was applied to the generated dataset. For this analysis, Manhattan distance and Ward’s method were chosen for inter-individual and inter-group measurements. This approach was discovered to be the most appropriate one after utilizing the Agnes function of the cluster package to compute and compare the agglomerative coefficients derived from other linkage algorithms (Ward, average, simple, full). A value of this coefficient close to one indicates a robust clustering structure, which might define the linkage approach that could discover the clustering structures [19]. The greatest agglomerative coefficient was obtained in the present study using Ward’s approach, with values of 0.98; thus, the HCA result is visually shown with a circular dendrogram in Figure 4.
The dendrogram result obviously indicates that the macroalgae samples preferred to cluster into two principal clusters (A and B). Cluster A is dominated by the G. changii species, primarily from Eastern Indonesia (red label). In contrast, cluster B contains samples from all regional zones and consists of two other species. Cluster B is divided into two other subclusters, (1) B1, mostly dominated by the K. alvarezii species from Western Indonesia (42%) as well as Central and Eastern Indonesia (each 29%), and (2) B2, (dominated by E.spinosum), consisting of macroalgae from Western Indonesia (40%) and macroalgae from Central and Eastern Indonesia (each 30%).
In the present study, the distribution of the macroalgae samples in the plot was assessed using a principal component analysis (PCA). Figure 4 illustrates the samples based on the two principal components (PC1 and PC2). PC1 represents about 35.5% of the data variability, while PC2 represents about 20.9%. Figure 5 demonstrates that there is a trend for the sample to be distributed according to the type of its species. For instance, all G. changii from Eastern Indonesia spread well in negative scores on PC1. Meanwhile, the G. changii from Western and Central Indonesia had a negative score on PC1 and a positive score on PC2. The two other macroalgae species had primarily positive scores on PC1. The samples overlapped, and clear boundaries among the three groups (Eastern, Central, and Western Indonesia) were not observed.
As can be seen from the results of the PCA scores (Figure. 5), visually discriminating samples based on the regional zones is a challenging and subjective task. It must be concluded that the variability contributed by the species to the chemical composition producing signals in the Vis-NIR region is larger than the variability contributed by the growth geographical regions, as is reflected in PC1 and PC2. In addition, it should be noted that these samples were collected from six islands in Indonesia, with different cultivation origins, different harvest times, and different cultivation methods. All these possibilities might be several factors that explain why the samples have not adequately distributed based on the three groups. In this context, it is quite difficult to ascertain clear distribution to the excessive complexity of the matrix. Anyway, it is clear that PCA is an exploratory technique that cannot be used as an analytical parameter to classify samples based on certain groups [24]. For this reason, a supervised technique is needed to try to elucidate the variability of the samples according to their geographical origin instead of the variability related to the species.

3.3. Supervised Techniques

3.3.1. Classification Based on a Support Vector Machine (SVM)

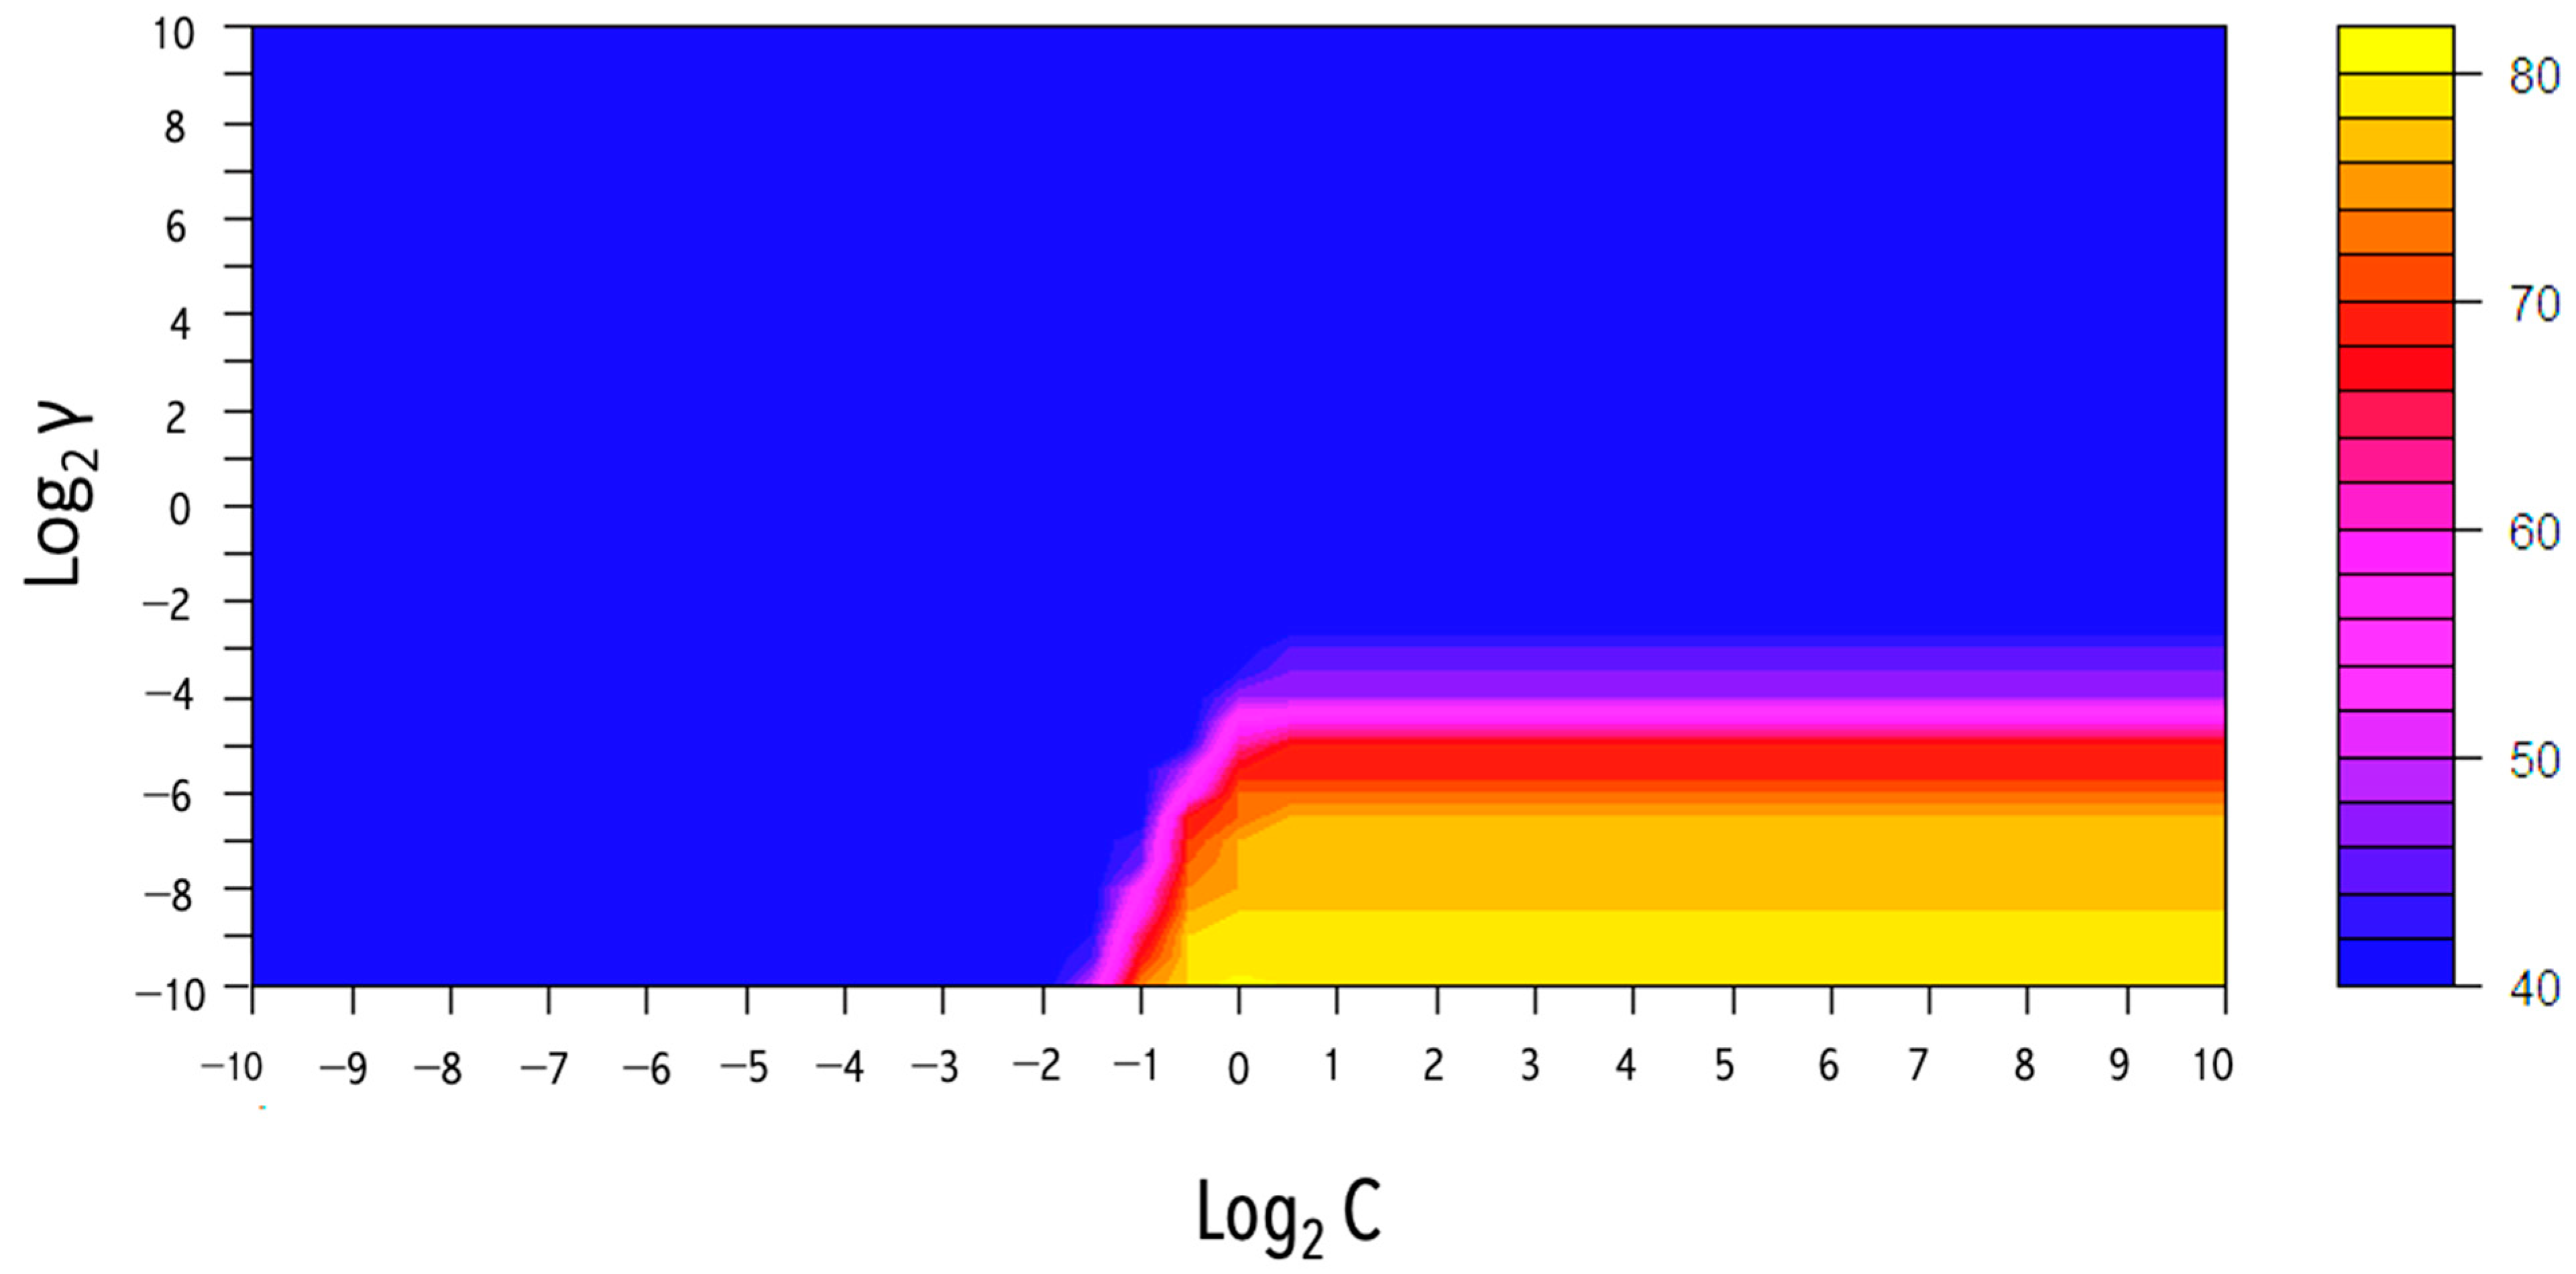
A type of non-parametric supervised algorithm, namely support vector machines (SVMs), which are frequently applied to handle and classify data into different classes, was used. SVMs have proven useful in a wide range of fields, including biology and medical food authenticity assessment [24]. The basic idea behind this technique is to discover the best hyperplane (boundary) that optimizes the margin amongst the data points (support vectors next to the hyperplane) and produces class separation with a minimum classification error [20]. Figure 6 shows the evaluation result of hyperparameter combinations on the accuracy.
The SVM algorithm could model a non-linear classifier or regression line using the kernel approach. The process includes converting data into a new dimension with clearly defined class-specific borders. Each data set in this study was randomly divided into the training set (70%) and the test set (30%). The SVM with radial basis function (RBF), namely the Gaussian kernel, was selected as the primary function. This model contains two hyperparameters (γ and C) that must be chosen. Accordingly, a second hyperparameter known as cost (C) regulates the amount of support vectors and the equilibrium between variance and bias, while γ controls the behavior of the kernel and increases the smoothness of the model [25]. Those parameters, including an exponential growth C and γ, could be optimized using the grid search technique. L o g 2 C and l o g 2 γ were evaluated using a 0.5 interval from -10 to 10. Five-fold cross-validation was also applied to examine the fusion of parameter preferences, and the preferences that obtained the best accuracy were determined. The l o g 2 γ is represented on the y-axis, while l o g 2 C is represented on the x-axis. The best value for C was 1, and the best γ was 0.000976. As can be seen in Table 2, the performance of the Vis-NIR data was 82% accurate in the five-fold cross-validation set and was 100% accurate in both the training and test sets. The results of the SVM models proved the feasibility of this analytical technique in discriminating macroalgae based on their geographical zone.

3.3.2. Classification Based on a Random Forest (RF)

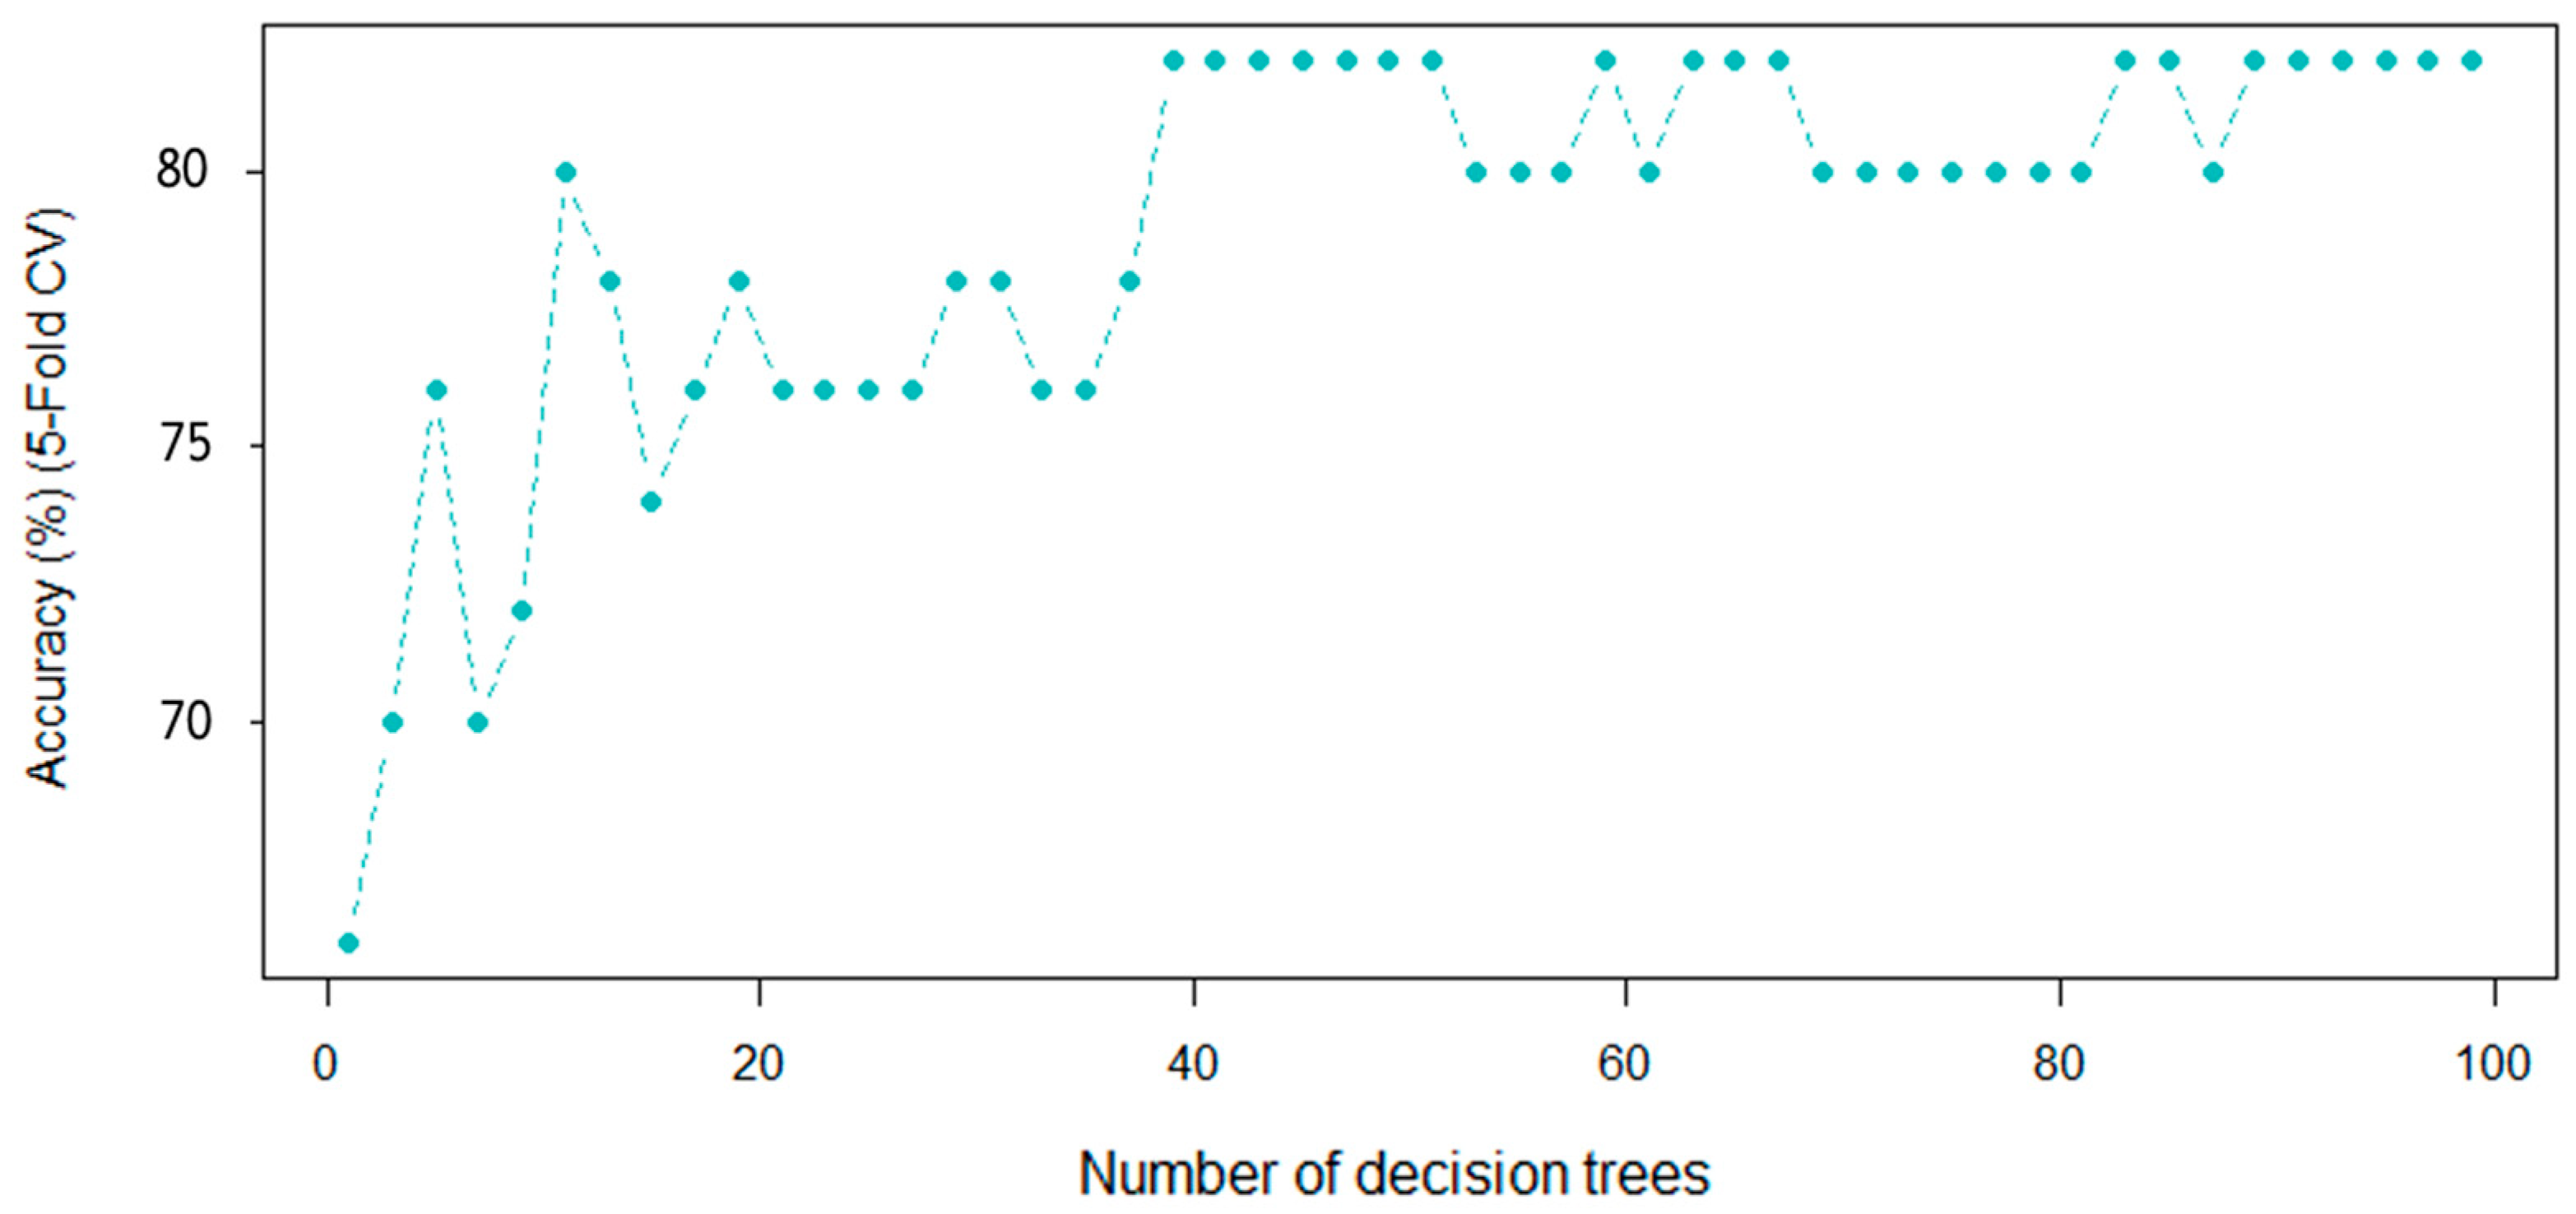
Another supervised learning algorithm, namely random forests (RFs), employ a substantial sum of independent decision trees to execute classification and regression problems as an ensemble. In this technique, there are two hyperparameters that must be adjusted, they are the number of trees (ntree) as well as the number of predictors, which are examined prior to each division (mtry). In a RF, if a large number of trees is used, they do not create a risk of overfitting. For these reasons, ntree was increased (in this case, to 100) until it was observed that the error was stabilized, while the value of mtry was 64.7. The five-fold cross-validation accuracy was chosen as the assessment criterion. Figure 7 presents the outcome graphically. As can be observed, after 40 decision trees, the accuracy rate begins to stabilize. Although the accuracy rate starts to fluctuate after 50 trees, it stabilizes again around 90 trees and remains consistent for the next 100 trees. These results indicate that the Vis-NIRS system should have between 90 and 100 decision trees.
Table 2 provides the results of the random forest models. According to the results obtained, the accuracy of the models is 100%, 80%, and 82% for the training, test, and five-fold cross-validation set, respectively. This application of a RF in the Vis-NIRS system suggests that this technique is suitable for achieving accurate classification of macroalgae according to their regional zones.
Given the structure of the RF model, the classification attributes that are particularly relevant can also be defined. Using the varimp function in the caret package in RStudio, the contribution of each variable to the model is calculated. The greatest 20 attributes and their relative importance in RF models using the Vis-NIR data set are presented in Figure S1. Two of the 20 greatest main attributes have a significant contribution (≥80 relative importance) in model development; wavelength 631.5 nm contributes the most, followed by wavelength 633 nm.

3.4. Webpage Development

The data models, along with machine learning tools (SVM and RF), achieved excellent results for the classification of macroalgae in Indonesia based on three regional zones. Accordingly, as an outcome, a simple online application based on the trained SVM and RF models has already been deployed to enable the automatic prediction and classification of macroalgae samples. It should be mentioned that the algorithms are not widely publicized owing to the difficulty of monitoring the examined sample for numerous users. Furthermore, any user can utilize the machine learning tools with the models offered on this webpage. The web application created is available at the following address: https://wjmpqu-jose0luis-perez0calle.shinyapps.io/App_Algae/ (accessed 12 November 2022).
To utilize this online application, the user simply uploads the csv or xlsx file generated by the Vis-NIRS tool’s analysis of the sample. A sample file has already been included within the application in the “Download” button. The file should be submitted by clicking the “Submit” option, and the application will generate the results automatically. Finally, this web application might be enhanced by analyzing additional samples so that the database can properly represent the results.

4. Conclusions

The capability of Vis-NIR spectroscopy along with chemometric techniques for classifying macroalgae based on three regional zones in Indonesia has been revealed. In the training set, the SVM and RF models achieved significant results for identifying macroalgae, with an accuracy of 100%. However, in classifying the samples, only the SVM model produced 100% accuracy in the test set. In addition, unsupervised techniques (PCA and HCA) revealed that the type of species tends to condition the distribution in space by the main principal components and the cluster formed in HCA. In summary, the combination of Vis-NIR spectroscopy data with chemometrics tools such as PCA and HCA, combined with SVMs and RFs have proven to be a suitable and proper analytical technique for macroalgae authentication based on three regional zones in Indonesia.

Supplementary Materials

The following supporting information can be downloaded at: https://www.mdpi.com/article/10.3390/w15010100/s1, Table S1: Lists of macroalgae samples used in this study; Figure S1: List of the 20 most important attributes in the RF model and their relative importance based on the Vis-NIR data set ( D 70 × 4187 ) .

Author Contributions

Conceptualization, F.G., M. and W.S.; methodology, M.P. and M.R.; software, J.L.P.C. and M.B.-S.; validation, W.S., M. and M.P.; formal analysis, F.G. and J.L.P.C.; investigation, F.G. and J.L.P.C.; resources, M.R., A.N. and L.; data curation, J.L.P.C., M.B.-S. and F.G.; writing—original draft preparation, F.G.; writing—review and editing, F.G., W.S., M. and M.P.; visualization, F.G.; supervision, M., W.S., M.P. and M.R.; project administration, W.S. and M.; funding acquisition, L. and A.N. All authors have read and agreed to the published version of the manuscript.

Funding

This research and APC was funded by the National Research and Innovation Agency (BRIN) through a Riset dan Inovasi untuk Indonesia (RIIM), through Research Grant No. 34/IV/KS/06/2022.

Institutional Review Board Statement

Not applicable.

Informed Consent Statement

Not applicable.

Data Availability Statement

Not applicable.

Acknowledgments

This report forms part of the activity carried out by F.G. at the University of Cadiz in the Erasmus Mundus Master in Quality in Analytical Laboratories (EMQAL) consortium under the Erasmus+ KA107 program.

Conflicts of Interest

The authors declare no conflict of interest in the analyses or interpretation of the data.

References

  1. Fisheries and Aquaculture. FAO Global Fishery and Aquaculture Production Statistics (FishStatJ). Available online: www.fao.org/fishery/statistics/software/fishstatj/en (accessed on 13 October 2022).
  2. Farobie, O.; Novi, S.; Edy, H.; Apip, A.; Asep, B.; Navid, R.M.; Yukihiko, M.; Surachai, K. The potential of sustainable biogas production from Macroalgae in Indonesia. In Proceedings of the 4th International Conference on Agricultural Engineering for Sustainable Agriculture Production, Bogor, Indonesia, 11 October 2021. [Google Scholar]
  3. Diharmi, A.; Fardiaz, D.; Andarwulan, N.; Heruwati, E.S. Chemical and Physical Characteristics of Carrageenan Extracted from Eucheuma Spinosum Harvested from Three Different Indonesian Coastal Sea Regions. Phycological. Res. 2017, 65, 256–261. [Google Scholar] [CrossRef]
  4. Badan Pusat Statistik (BPS). Statistics of Marine and Coastal Resources; Badan Pusat Statistik Press: Jakarta, Indonesia, 2017; p. 46.
  5. Palmieri, N.; Forleo, M.B. The Potential of Edible Seaweed within the Western Diet. A Segmentation of Italian Consumers. Int. J Gastron Food Sci. 2020, 20, 100202. [Google Scholar] [CrossRef]
  6. Véliz, K.; Toledo, P.; Araya, M.; Gómez, M.F.; Villalobos, V.; Tala, F. Chemical Composition and Heavy Metal Content of Chilean Seaweeds: Potential Applications of Seaweed Meal as Food and Feed Ingredients. Food Chem. 2022, 398, 133866. [Google Scholar] [CrossRef] [PubMed]
  7. Verma, P.; Kumar, M.; Mishra, G.; Sahoo, D. Multivariate Analysis of Fatty Acid and Biochemical Constitutes of Seaweeds to Characterize Their Potential as Bioresource for Biofuel and Fine Chemicals. Bioresour Technol. 2017, 226, 132–144. [Google Scholar] [CrossRef]
  8. Fernández-Segovia, I.; Lerma-García, M.J.; Fuentes, A.; Barat, J.M. Characterization of Spanish Powdered Seaweeds: Composition, Antioxidant Capacity and Technological Properties. Food Res. Int. 2018, 111, 212–219. [Google Scholar] [CrossRef]
  9. Langford, A.; Zhang, J.; Waldron, S.; Julianto, B.; Siradjuddin, I.; Neish, I.; Nuryartono, N. Price Analysis of the Indonesian Carrageenan Seaweed Industry. Aquaculture 2022, 550, 737828. [Google Scholar] [CrossRef]
  10. Lama, G.F.C.; Errico, A.; Pasquino, V.; Mirzaei, S.; Preti, F.; Chirico, G.B. Velocity Uncertainty Quantification Based on Riparian Vegetation Indices in Open Channels Colonized by Phragmites Australis. J. Ecohydraulics 2022, 7, 71–76. [Google Scholar] [CrossRef]
  11. Khan, M.A.; Sharma, N.; Lama, G.F.C.; Hasan, M.; Gerg, R.; Busico, G.; Alharbi, R.S. Three-Dimensional Hole Size (3DHS) Approach for Water Flow Turbulence Analysis over Emerging Sand Bars: Flume-Scale Experiments. Waters 2022, 14, 1889. [Google Scholar] [CrossRef]
  12. Lama, G.F.C.; Sadeghifar, T.; Azad, M.T.; Sihag, P.; Kisi, O. On the Indirect Estimation of Wind Wave Heights over the Southern Coasts of Caspian Sea: A Comparative Analysis. Water. 2022, 4, 843. [Google Scholar] [CrossRef]
  13. Cetó, X.; Sánchez, C.; Serrano, N.; Díaz-Cruz, J.M.; Núñez, O. Authentication of Paprika Using HPLC-UV Fingerprints. LWT 2020, 124, 109153. [Google Scholar] [CrossRef]
  14. Wang, P.; Chen, J.; Chen, L.; Shi, L.; Liu, H. Characteristic Volatile Composition of Seven Seaweeds from the Yellow Sea of China. Mar. Drugs 2021, 19, 192. [Google Scholar] [CrossRef] [PubMed]
  15. Mutiarahma, S.; Putra, V.G.P.; Chaniago, W.; Carrera, C.; Anggrahini, S.; Palma, M.; Setyaningsih, W. Uv-Vis Spectrophotometry and Uplc–Pda Combined with Multivariate Calibration for Kappaphycus Alvarezii (Doty) Doty Ex Silva Standardization Based on Phenolic Compounds. Sci. Pharm. 2021, 89, 47. [Google Scholar] [CrossRef]
  16. Hashemi-Nasab, F.S.; Parastar, H. Vis-NIR Hyperspectral Imaging Coupled with Independent Component Analysis for Saffron Authentication. Food Chem. 2022, 393, 133450. [Google Scholar] [CrossRef]
  17. Burns, R.L.; Alexander, R.; Snaychuk, L.; Edwards, J.C.; Fitzgerald, N.; Gao, P.; Quan, D.; Douvris, C.; Vaughan, T.; Bussan, D.D. A Fast, Straightforward and Inexpensive Method for the Authentication of Baijiu Spirit Samples by Fluorescence Spectroscopy. Beverages 2021, 7, 65. [Google Scholar] [CrossRef]
  18. Yang, Q.; Tian, S.; Xu, H. Identification of the Geographic Origin of Peaches by VIS-NIR Spectroscopy, Fluorescence Spectroscopy and Image Processing Technology. J. Food Compos. Anal. 2022, 114, 104843. [Google Scholar] [CrossRef]
  19. Barea-Sepúlveda, M.; Ferreiro-González, M.; Calle, J.L.P.; Barbero, G.F.; Ayuso, J.; Palma, M. Comparison of Different Processing Approaches by SVM and RF on HS-MS ENose and NIR Spectrometry Data for the Discrimination of Gasoline Samples. Microchem. J. 2022, 172, 106893. [Google Scholar] [CrossRef]
  20. Calle, J.L.P.; Falatová, B.; Aliaño-González, M.J.; Ferreiro-González, M.; Palma, M. Machine learning approaches over ion mobility spectra for the discrimination of ignitable liquids residues from interfering substrates. Talanta Open 2022, 6. [Google Scholar] [CrossRef]
  21. Calle, J.L.P.; Ferreiro-González, M.; Ruiz-Rodríguez, A.; Barbero, G.F.; Álvarez, J.; Palma, M.; Ayuso, J. A Methodology Based on Ft-Ir Data Combined with Random Forest Model to Generate Spectralprints for the Characterization of High-Quality Vinegars. Foods 2021, 10, 1411. [Google Scholar] [CrossRef]
  22. Pérez Calle, J.; Ferreiro-González, M.; Aliaño-González, M.; Espada-Bellido, E.; Palma, M.; Barbero, G.F. Quality control of honey by visible and near infrared spectroscopy (Vis-NIRS) and headspace-ion mobility spectrometry (HS-IMS). In Proceedings of the 3rd International Electronic Conference on Environmental Research and Public Health—Public Health Issues in the Context of the COVID-19 Pandemic, Basel, Switzerland, 11–25 January 2021. [Google Scholar]
  23. Rahi, S.; Mobli, H.; Jamshidi, B.; Azizi, A.; Sharifi, M. Achieving a Robust Vis/NIR Model for Microbial Contamination Detection of Persian Leek by Spectral Analysis Based on Genetic, IPLS Algorithms and VIP Scores. Postharvest. Biol. Technol. 2021, 175, 111413. [Google Scholar] [CrossRef]
  24. Bai, S.; Qin, D.; Chen, Z.; Wu, S.; Tang, S.; Gao, L.; Wang, P. Geographic Origin Discrimination of Red Swamp Crayfish Procambarus Clarkii from Different Chinese Regions Using Mineral Element Analysis Assisted by Machine Learning Techniques. Food Control 2022, 138, 109047. [Google Scholar] [CrossRef]
  25. Calle, J.L.P.; Ferreiro-González, M.; Ruiz-Rodríguez, A.; Fernández, D.; Palma, M. Detection of Adulterations in Fruit Juices Using Machine Learning Methods over FT-IR Spectroscopic Data. Agronomy 2022, 12, 683. [Google Scholar] [CrossRef]
Figure 1. A flowchart of the analyses conducted in this study.
Water 15 00100 g001
Figure 2. Raw Vis-NIR spectra without any pretreatment.
Water 15 00100 g002
Figure 3. Vis-NIR spectra after pretreatment using the Savitzky–Golay smoothing filter.
Water 15 00100 g003
Figure 4. The circular dendrogram produced by hierarchical cluster analysis (HCA) on the converted Vis-NIRS data set D 70 × 4187 . The macroalgae samples were colored based on 3 species: black line for G. changii, brown line for E. spinosum, and orange line for K. alvarezii, and based on regional zones of Indonesia: red for Eastern, green for Western, and blue for Central Indonesia.
Water 15 00100 g004
Figure 5. Scores were acquired for all the macroalgae samples for the first two principal components (PC1 and PC2) based on the Vis-NIRS data set ( D 70 × 4187 ) . The macroalgae samples were colored according to 3 regional zones of Indonesia: red for Central, green for Eastern, and blue for Western Indonesia.
Water 15 00100 g005
Figure 6. The grid search method results from the optimum hyperparameter combination (C and γ) for the Gaussian SVM model acquired by 5-fold CV using the Vis-NIR data set ( D 70 × 4187 ) .
Water 15 00100 g006
Figure 7. The RF performance as a function of the number of decision trees on the Vis-NIR dataset ( D 70 × 4187 ).
Water 15 00100 g007
Table 1. The selected samples of each macroalgae species.
SpeciesCultivation SiteOriginRegional ZoneSample Appearance
Kappaphycus alvareziiGeranting IslandSumateraWestern Water 15 00100 i001
Euchema spinosumJenepontoCelebesEastern Water 15 00100 i002
Gracilaria changiiKutuhBaliCentral Water 15 00100 i003
Table 2. Results of Vis-NIRS classification based on an SVM and RF are compared.
ModelParametersAccuracy (%)
Training SetTest Set5-Fold Cross-Validation
Support Vector Machine (SVM)Penalty Factor (C) = 110010082
Kernel Parameter (γ) = 0.000976
Number of Support Vectors = 50
Random Forest (RF)mtry = 64.71008082
ntree = 100
Disclaimer/Publisher’s Note: The statements, opinions and data contained in all publications are solely those of the individual author(s) and contributor(s) and not of MDPI and/or the editor(s). MDPI and/or the editor(s) disclaim responsibility for any injury to people or property resulting from any ideas, methods, instructions or products referred to in the content.