Article

The Occurrence of Catastrophic Multiple-Fatality Flash Floods in the Eastern Mediterranean Region

by
Michalis Diakakis
1,*,
Katerina Papagiannaki
2 and
Meletis Fouskaris
1
1
Faculty of Geology and Geoenvironment, National and Kapodistrian University of Athens, Panepistimioupoli, GR15784 Athens, Greece
2
Institute of Environmental Research and Sustainable Development, National Observatory of Athens, GR11810 Athens, Greece
*
Author to whom correspondence should be addressed.
Water 2023, 15(1), 119; https://doi.org/10.3390/w15010119
Submission received: 21 November 2022 / Revised: 23 December 2022 / Accepted: 23 December 2022 / Published: 29 December 2022
(This article belongs to the Special Issue Flood and Other Hydrogeomorphological Risk Management and Analysis)

Abstract

:
Despite recent technological advances, many parts of the world continue to experience flood disasters accompanied by significant loss of human lives. Understanding how frequent these deadly catastrophes are creates many uncertainties, especially in areas where disaster records are scarce or have short timeframes. It is, however, very important from a preparedness and civil protection standpoint to assess the frequency of such high-mortality events, especially considering the threat of climate change. This work develops a high-mortality flood event database using multiple international sources, covering a relatively long time window (1882–2021), exploring the deadliest floods in the Eastern Mediterranean region, and examining their seasonal distribution, their temporal evolution, and their basic spatial patterns. The study identifies 132 flash flood events (causing ≥10 fatalities) with a return period of only 1.56 years. Additionally, higher-magnitude events (>85th percentile) were found to be less common but still not very rare (return period = 9.1 years). The number of events shows an increase in recent decades, while seasonal and spatial patterns were identified as well. Overall, the findings provide a foundation for understanding how common catastrophic flood events are in the region, are beneficial for policymakers and relevant professionals, and are an important stepping stone towards a complete understanding of how extreme floods have changed in the last century or will change in the near future.

1. Introduction

Despite significant advances in flood risk management [1,2,3], extreme rainfall, and flood forecasting and warning [4,5], there is still an alarming occurrence of severe floods with multiple human losses worldwide [6,7,8,9,10]. Recent catastrophic events, such as the flood of 2021 in central Europe, show that high mortality in extreme flash floods is not on the decline, even in parts of the world with sophisticated risk mitigation measures [6,11,12].
South Europe is one of these areas [13]. Relatively recent flood disasters have shown that the region continues to record deadly flash floods, inducing considerable numbers of fatalities [9,13,14,15]. These high-magnitude, high-mortality events are of particular interest, as they can have lasting impacts on communities [16,17,18,19,20].
In order to enhance preparedness and resilience, and to deal with these impacts, governments, local authorities, risk professionals, and the public are interested to know how common such events are or will be [21], especially in light of the threat of climatic change [22,23]. The answer to this question is essential both from a civil protection and a risk management policy point of view. In addition, given the particular sensitivity of the Mediterranean region to climate change [24,25] and the threat of a rise in extreme weather events [26,27], it becomes crucial to understand better the frequency and distribution of high-mortality flash floods. The extreme importance of monitoring, collecting, and studying loss and damage data associated with climate change, including non-economic losses such as loss of life, has also been recently highlighted by international conventions such as the UNFCCC and the UNDRR Sendai Framework.
Recent works have studied flood deaths and shed light on the conditions under which flood-related fatal accidents occur [10,28,29,30,31,32,33,34]. However, in the field of temporal variations of flood mortality, previous studies have explored relatively short periods [14,15,30], hampering a more realistic assessment of the occurrence frequency of rare events. Thus, given their rarity and high variability, the relevant studies do not provide a definitive answer on the frequency and trends of such extreme events.
This work exploits disaster databases and other sources of information to develop a high-mortality flash flood events database covering the Eastern Mediterranean for 14 decades (1882–2021). The aim of the present study is to analyze this catalog of flash flood events (excluding other flood types) to provide a better understanding of their temporal evolution, their seasonal distribution, and their regional patterns. In detail, in the following chapters, this work provides insights into how often these high-mortality flash floods occur in the region and their probability of occurrence depending on their magnitude, and it explores possible temporal trends and potential differences in their seasonality across the region.

2. Materials and Methods

2.1. Study Area and Data Sources

In exploring the occurrence of patterns of high-mortality flash flood disasters, we developed a database of flash flood events causing ten fatalities or more in the broader Eastern Mediterranean region, covering the following countries: Albania, Bosnia and Herzegovina, Bulgaria, Croatia, Egypt, Greece, Israel, Italy, Lebanon, Libya, Montenegro, North Macedonia, and Turkey (Figure 1). The area is home to many diverse landscapes, characterized by its varied geography, with mountainous regions, coastal plains, sharp relief, long coastlines, and spectacular gorges, as well as desert and semi-desert areas with smaller or larger river networks. However, the Eastern Mediterranean has a warm and temperate climate, with hot and dry summers and mild and wet winters. Nevertheless, the region has a rich history of notable catastrophic flash flood events that have inflicted important impacts on the local, mostly coastal settlements and their populations [35,36], which maintain a continuous historically and culturally rich presence.
The examined period of 140 years, 1882–2021, allows for assessing such events’ frequency. The flash flood events with ten or more fatalities were chosen not arbitrarily but based on the current practice as it is reflected in the literature [10,15,37]. In addition, the threshold of 10 fatalities is also a condition for entering a fatal event in international disaster databases (e.g., EM-DAT) [38] when the other criteria for being classified as catastrophic are not met.
Furthermore, to ensure the database’s highest completeness and accuracy, we collected flood event and fatality data from various independent sources, including international databases, country-specific reports or studies, country-level databases, scientific publications, and extensive press archives. The different sources were cross-referenced and compared for each event separately. In detail, we based our analysis on publicly available international disaster and fatality databases, including the following:
  • EM-DAT [38], since 1900
  • Global Active Archive of Large Flood Events, Dartmouth Flood Observatory, University of Colorado [39], since 1985
  • Hanze-E [40], covering the period 1870–2016
  • European Past Floods (EPF) [41], covering the period 1980–2015
  • FFEM-DB [13], covering the period 1980–2020
Consequently, each event was investigated thoroughly in terms of the type of flood and its coexistence with other hazards. This database hosts only “flash floods,” that is, rapid-onset flooding events caused by short-duration, high-intensity rainfall of mainly convective origin that occur locally and usually impact basins smaller than 1000 km2 within hours of the triggering storm [35]. Further, the fatalities caused by accompanying hazards, such as landslides or other mass movement phenomena, dam breaks, and riverine or coastal flooding, were excluded, following the flood-type classification or characterization recorded in the data sources or based on evidence presented in them. Table 1 details the various sources used per country to cover all the reported flash flood events in 1882–2021. Moreover, in cases where the fatality estimate of a certain event was different between sources, we examined additional sources focusing on local studies, event-specific reports, or country-level datasets to determine a better estimate of the number of deaths.
The population data used in the analysis were drawn from the UN data portal (2022) for 1950–2021. During the period before 1950, various relevant sources were investigated (https://ourworldindata.org/ (accessed on 20 November 2022); https://www.statista.com/ (accessed on 20 November 2022); https://www.jewishvirtuallibrary.org/jewish-and-non-jewish-population-of-israel-palestine-1517-present (accessed on 20 November 2022) to record the population of each region at the beginning of each decade, while in the intervening years, statistical interpolation was applied.

2.2. Database Evaluation

In order to evaluate the completeness of this dataset, the number of events was compared to that of international databases for the respective spatial and temporal coverage. Table 2 presents the comparative analysis of the total covered events for various thresholds of flash flood fatalities between the present paper and each database separately. Overall, the results reveal the greater coverage achieved by using multiple sources.

2.3. Database Structure and Analysis

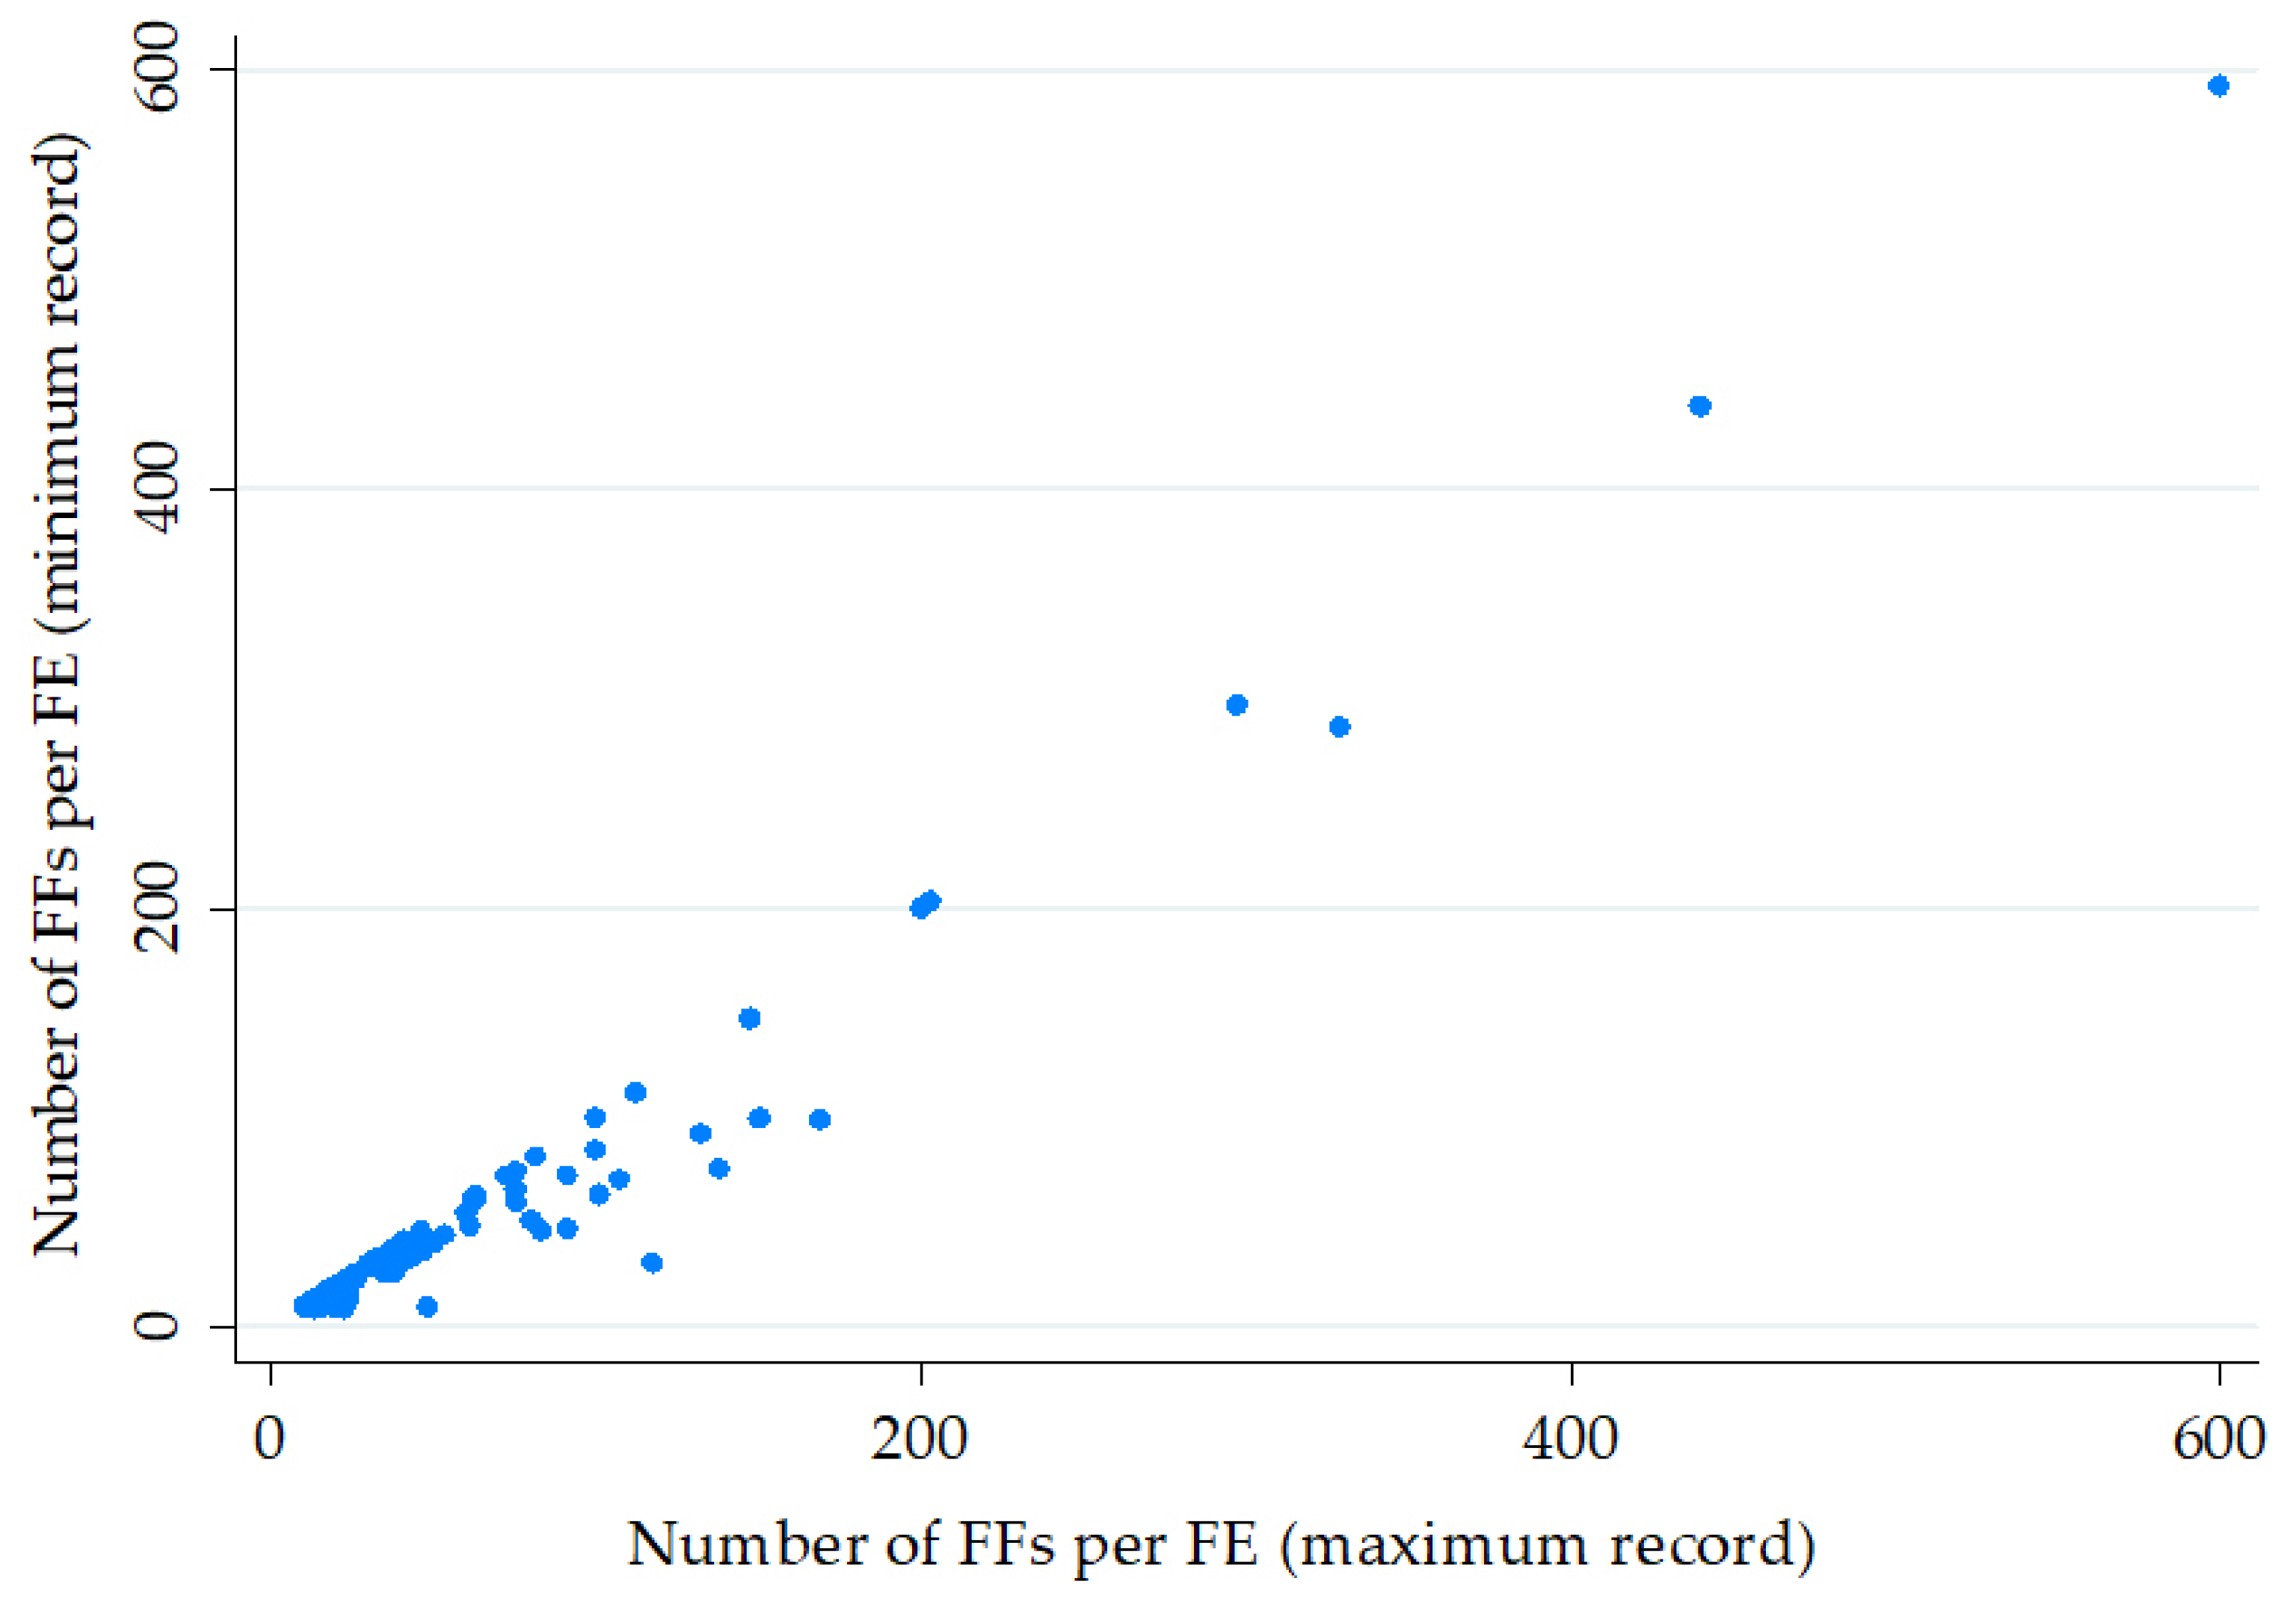
The database entry for each event corresponds to one flood event (FE), recording its date, the country and specific areas affected, and the number of flood fatalities recorded in each data source. For example, the three variables complement each FE further, specifically the minimum, the maximum, and the average number of flood fatalities (FFs) from the corresponding sources. The deviations between the min and max values are slight, so the average number is used in the analyses. As shown in Figure 2, the min and max values are highly correlated (Spearman’s rho, 0.93), while they do not deviate in 54% of the FE observations.
In addition, to facilitate the interpretation of the analysis, we produced a 3-level index of the flood impact magnitude (FΙ) by classifying FEs based on the number of FFs. Specifically, we defined the low (FI1), moderate (FI2), and high (FI3) impact magnitude classes based on two critical values of the number of FFs corresponding to the 50th and 85th percentiles of their frequency of occurrence. Additionally, these thresholds have been widely used in flood risk and impact analyses [82,83] as an easily interpretable index that is suitable to serve as a meaningful classification index, indicating a distinct classification of events according to the associated severity.
Subsequently, we performed a statistical analysis of the temporal distribution of FFs as a total and per impact magnitude category to examine their trends and frequencies over the last 140 years. In order, to estimate the return period of flash flood events causing ten or more fatalities in the study area, we calculated the following equation based on Weibull’s [84] distribution:
T = (n + 1)/m,
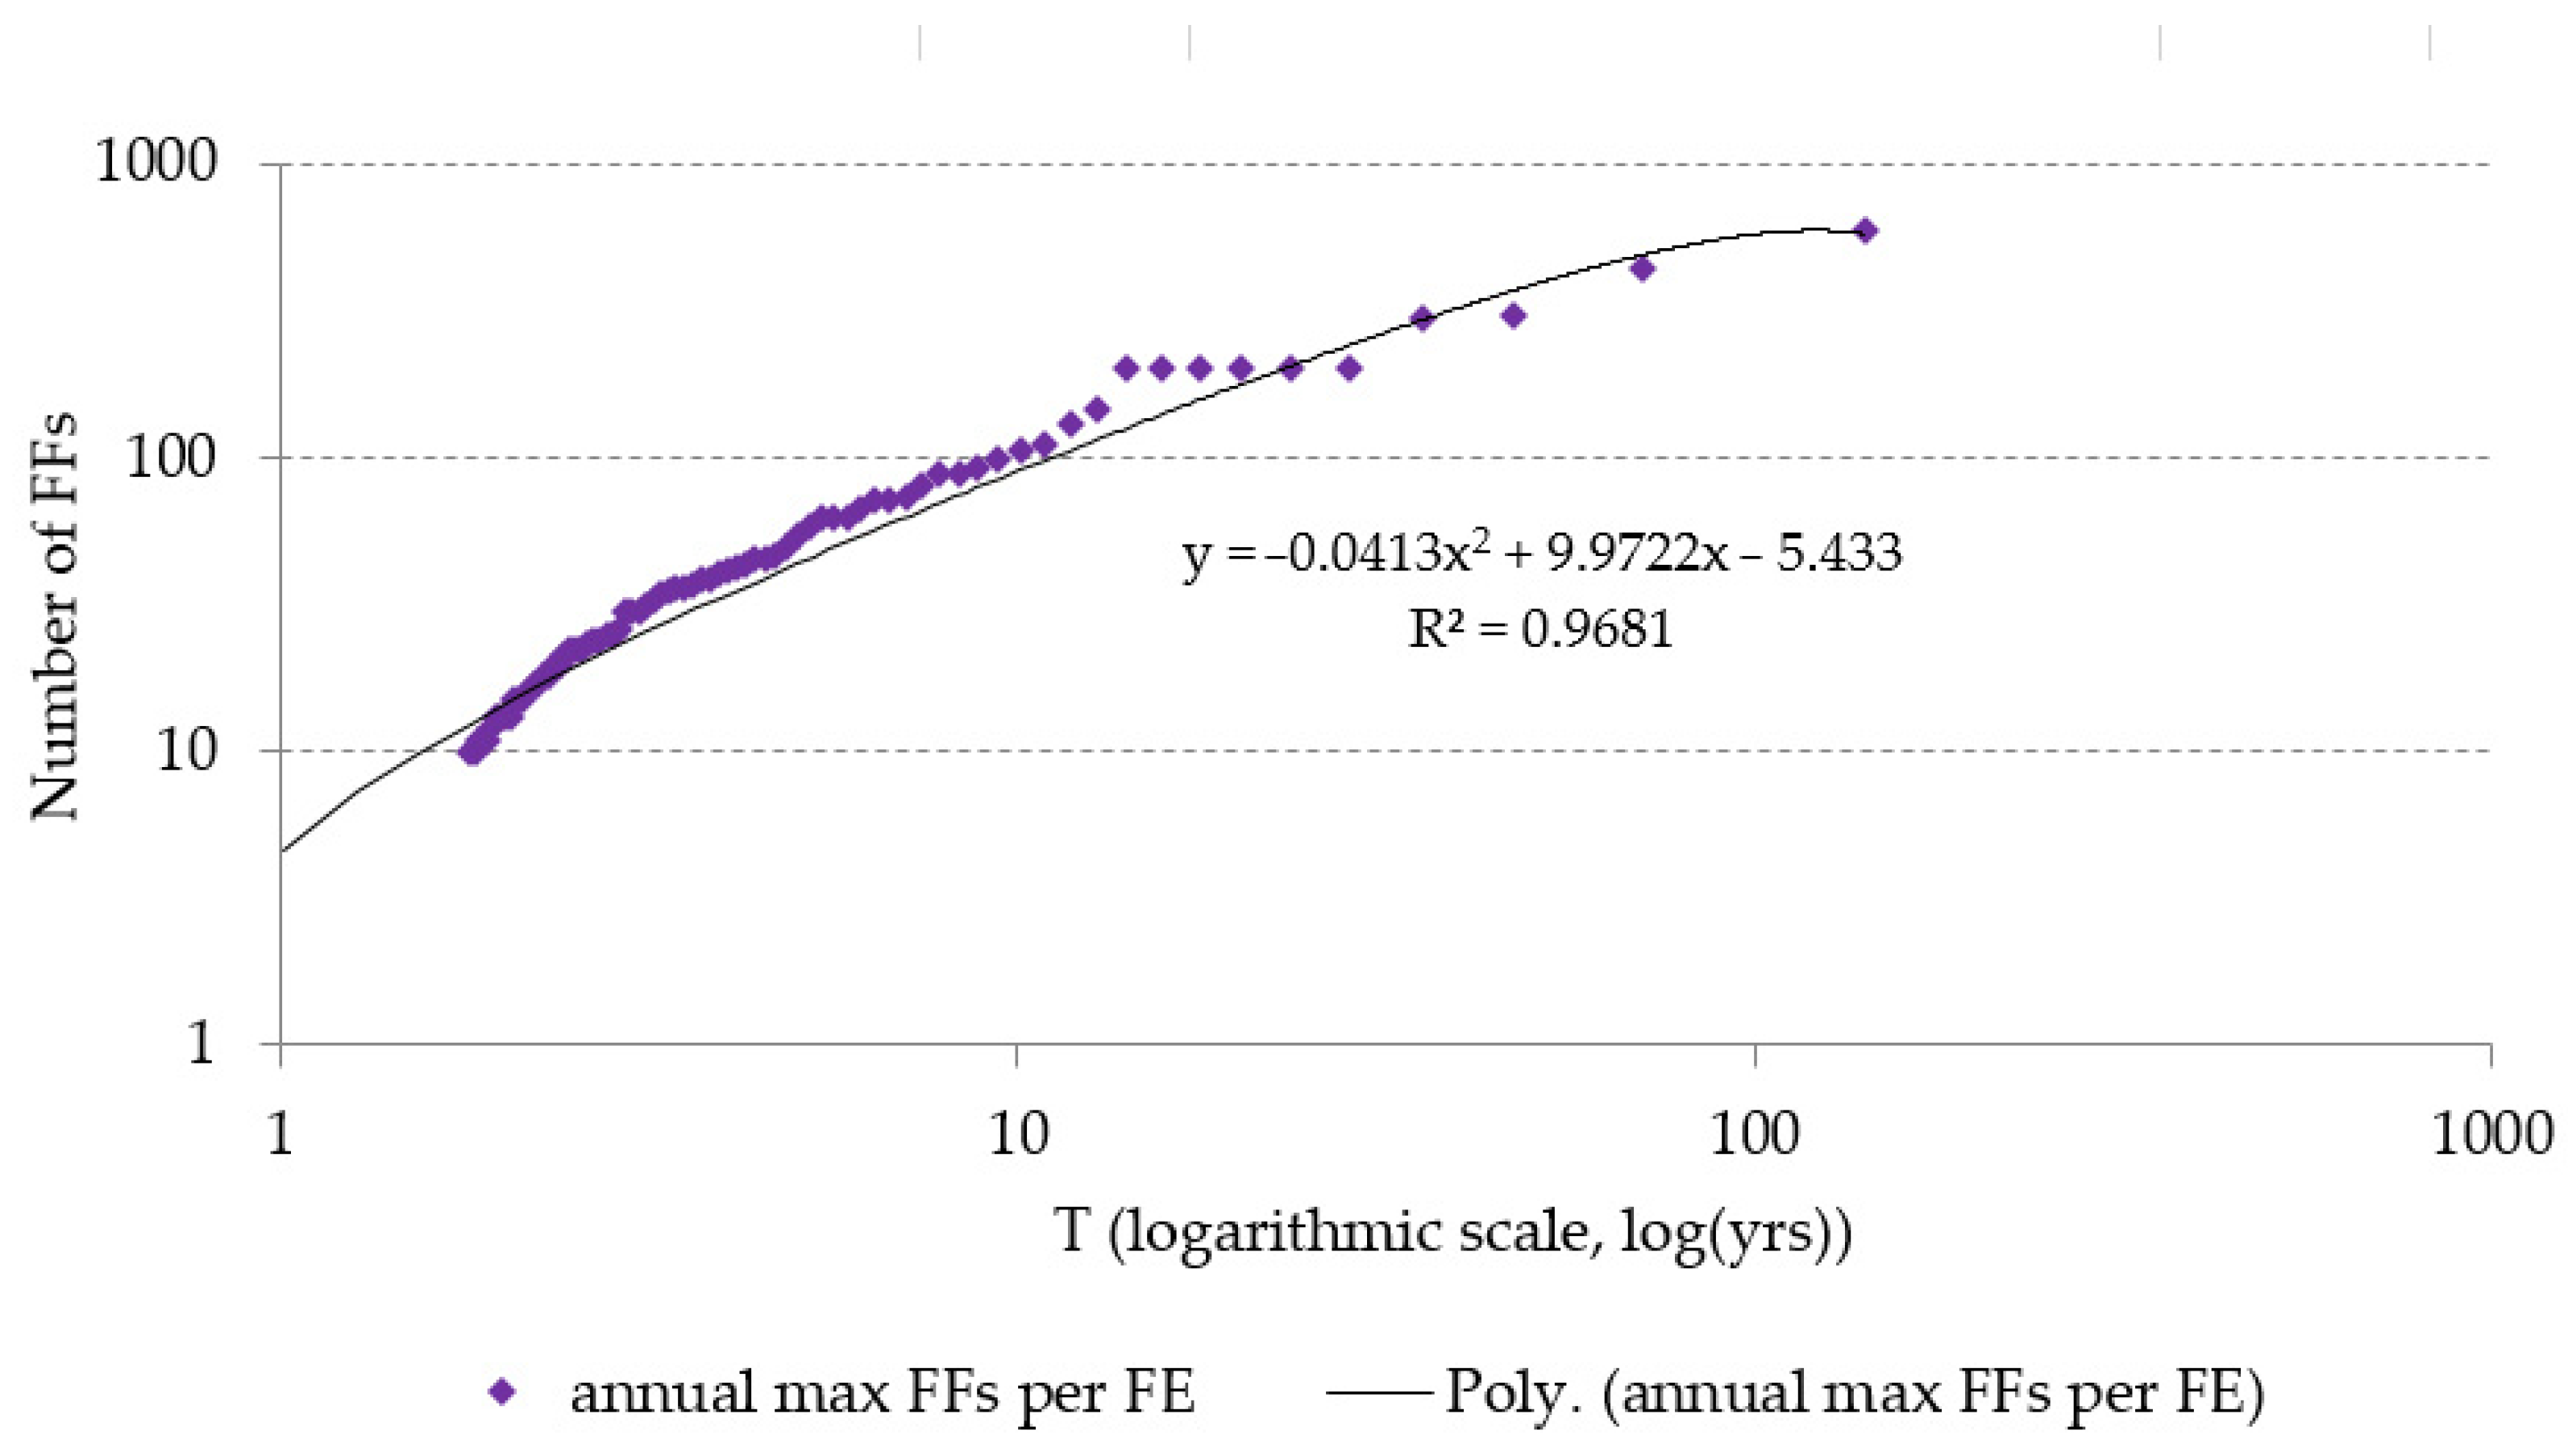
in which the return period, T, is the reciprocal of the expected frequency of the event whose magnitude is equal to or above a specified magnitude; n is the number of years on record; and m is the rank of the annual observation when arranged in descending order. The maximum yearly number of FFs in the study area was modelled to fit the following polynomial function and estimate the expected FFs magnitude of an event as a function of the return period.
y = ax2 + bx + c
where y is the expected number of FFs and x is the return period T in years.
Finally, the spatial analysis of FEs and FFs was made at the country level. The monthly and seasonal distributions for various geographical zones were analyzed to identify possible climatological factors.

3. Results

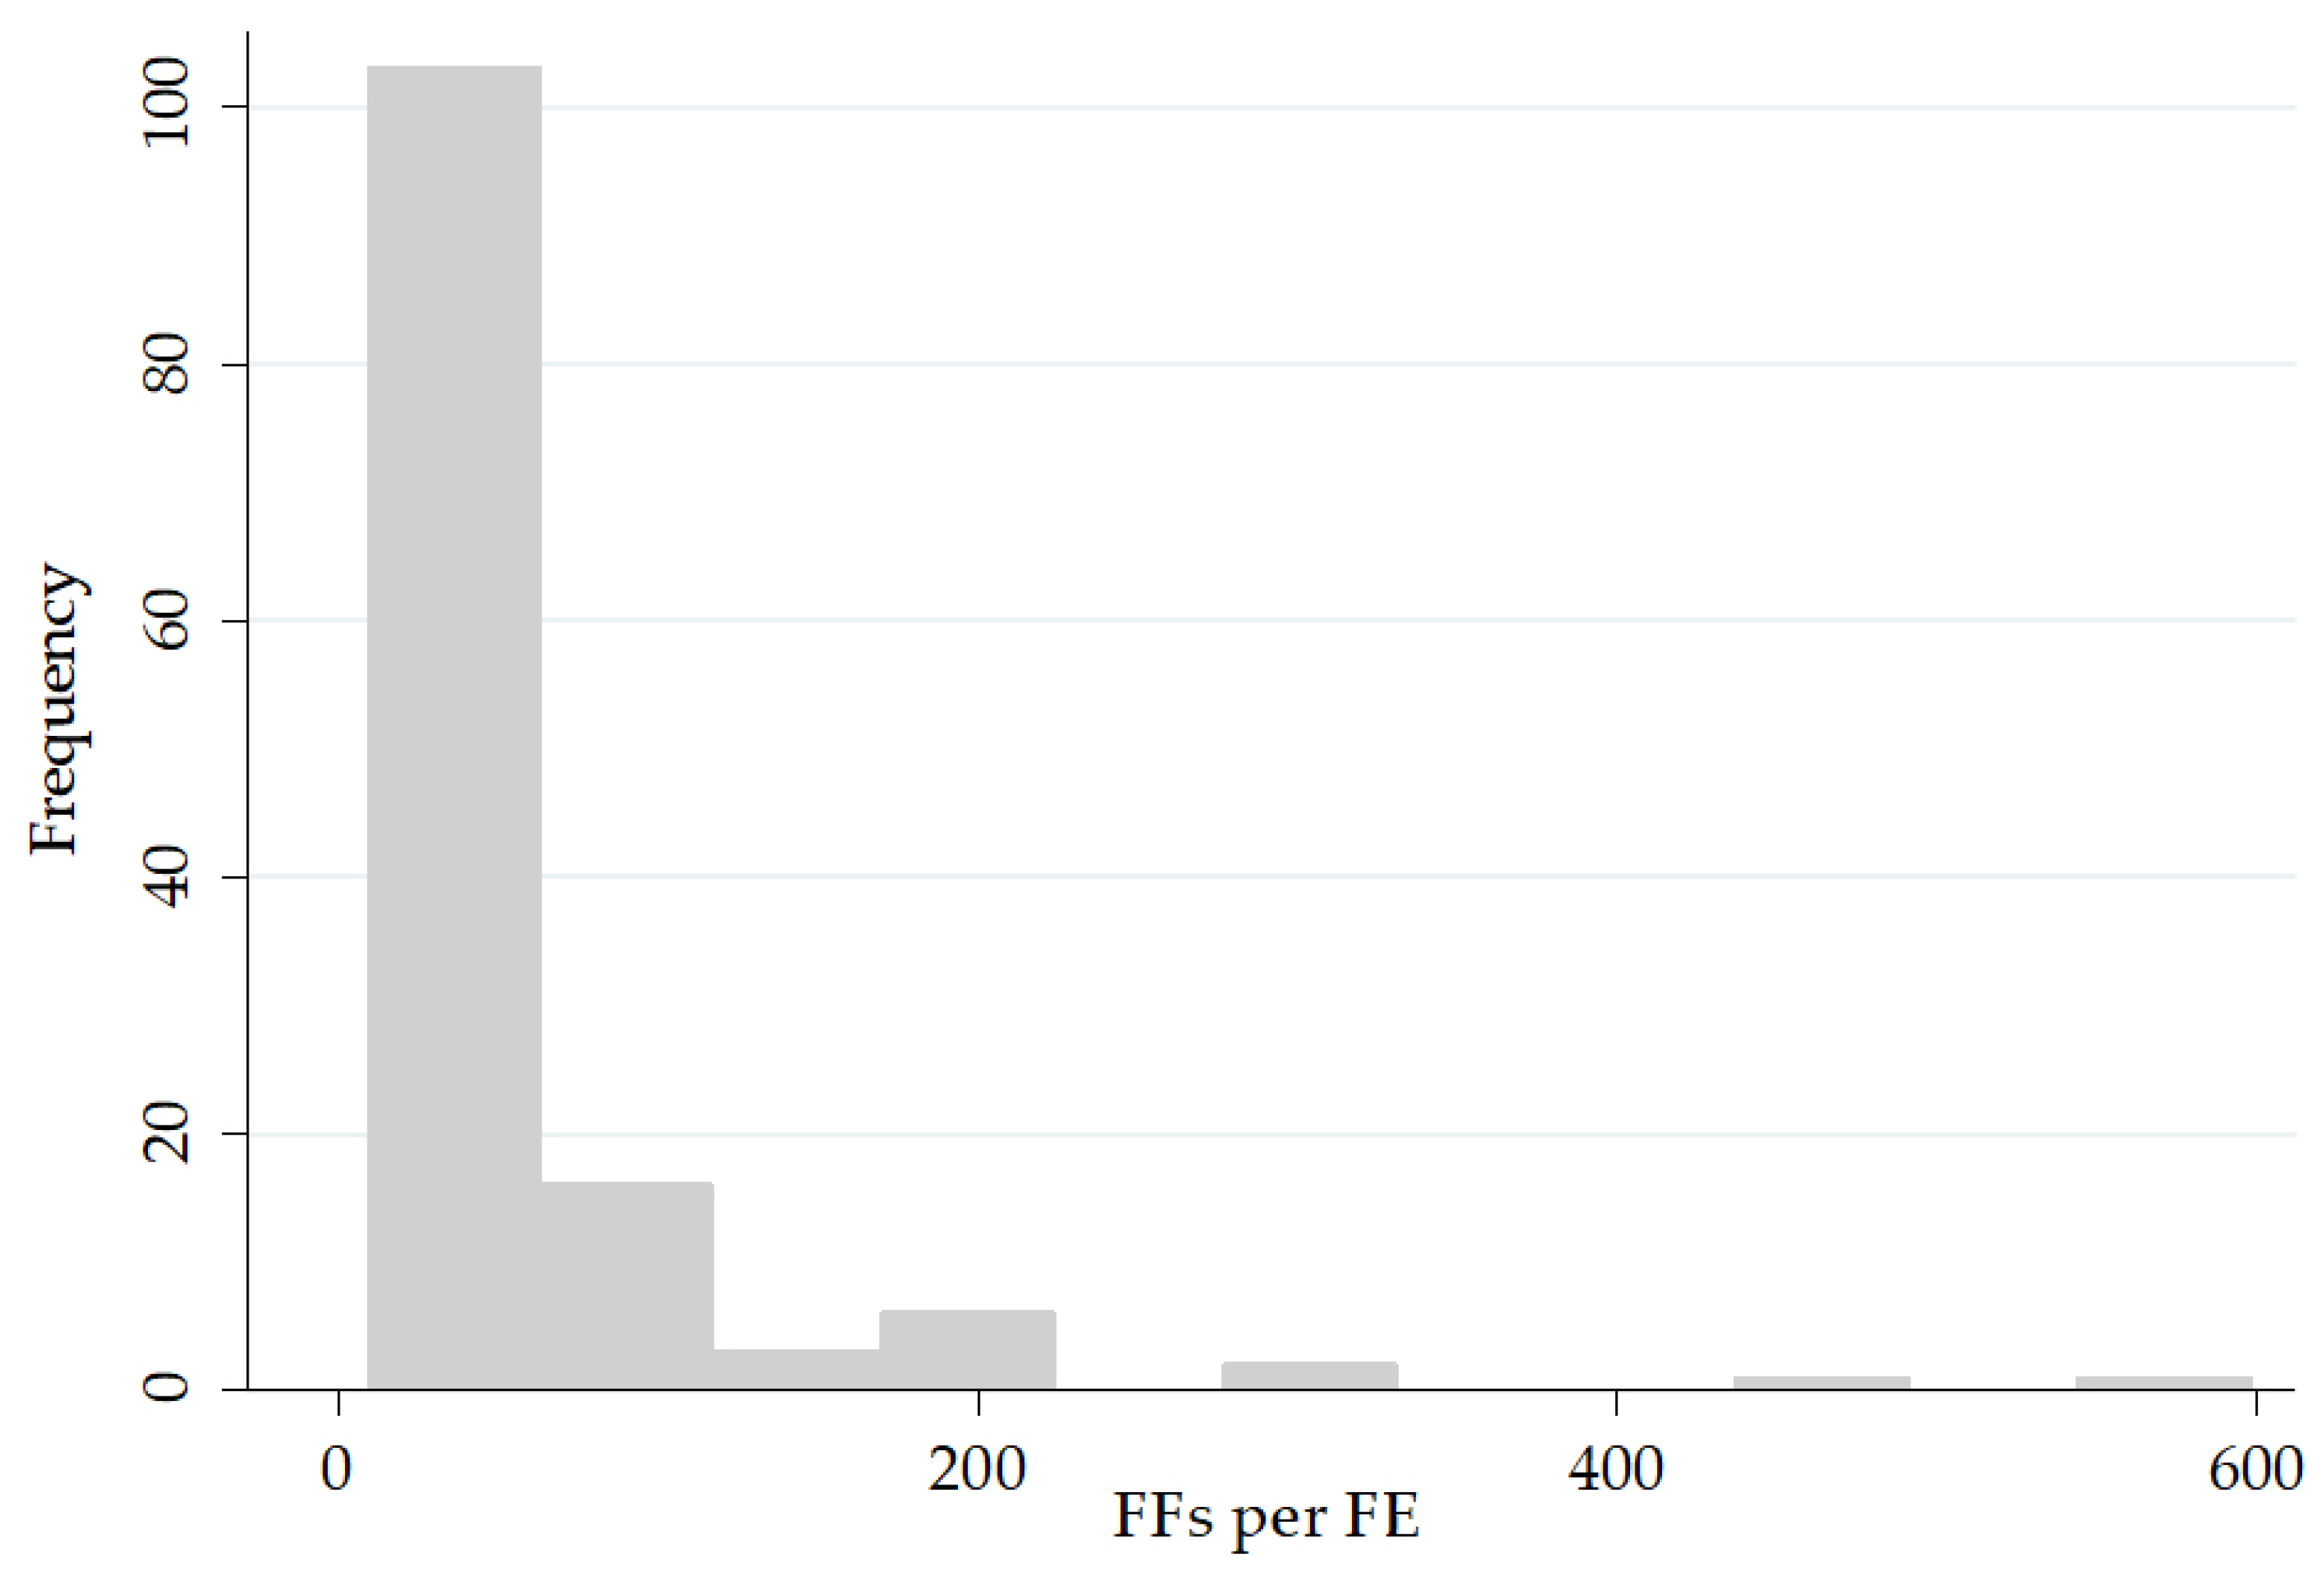
Overall, 132 FEs caused 6974 FFs in the study area from 1882 to 2021. The FFs per FE ranged from 10 to 598 (M = 53, SD = 80.7). Figure 3 shows the frequency distribution (histogram) of FFs observations. However, according to the distribution, 50% of observations were associated with up to 22 FFs. Table 3 shows the specifications for classifying FEs in the three flood impact magnitude classes. Specifically, FEs were classified as FI1 (low impact) for FFs between 10 and 22, FI2 (moderate impact) for FFs between 23 and 82, and FI3 (high impact) for FFs above 82.

3.1. Temporal Evolution

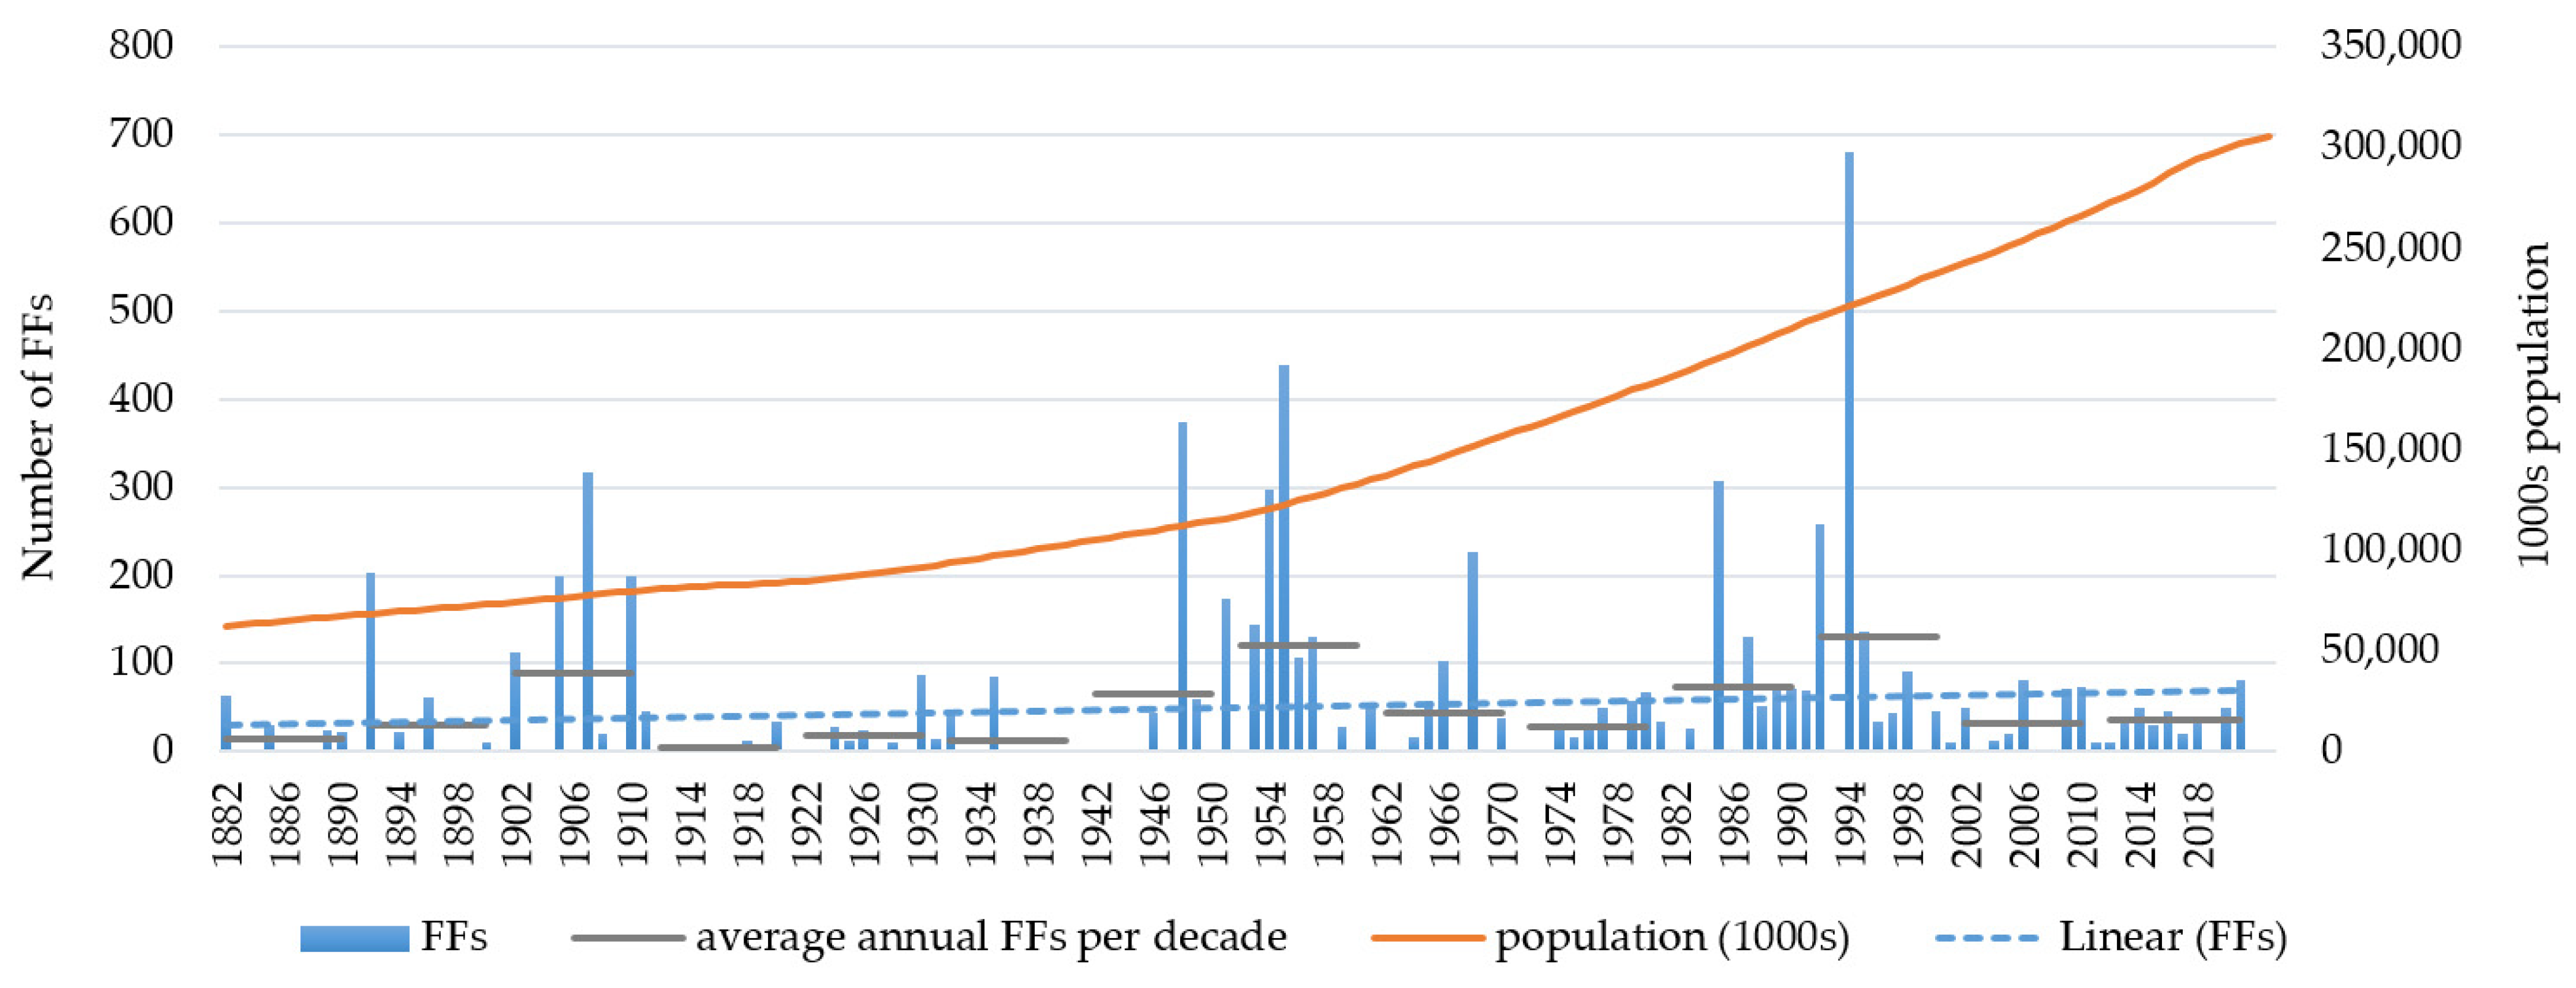
Figure 4 depicts the annual distribution of total FFs, which show a slight but statistically significant increase (Poisson coef. = 0.01, p < 0.001). Overall, the interannual variability is considerable. The three highest amounts of annual FFs occurred in the latest decades. Specifically, 681 total FFs occurred in 1994, 440 in 1955, and 308 in 1985. Additionally, the highest average annual number of FFs per decade, 130 FFs, is attributed to the 1992–2001 decade. The population of the study area has increased by a factor of 4.8 since 1882.
The impact magnitude of FFs caused by FI1 and FI2 events showed a slight statistically significant yearly increase (Poisson coef. = 0.02 and 0.01, respectively; p < 0.001), while the trend of FFs caused by FI3 events was not found to be statistically significant.
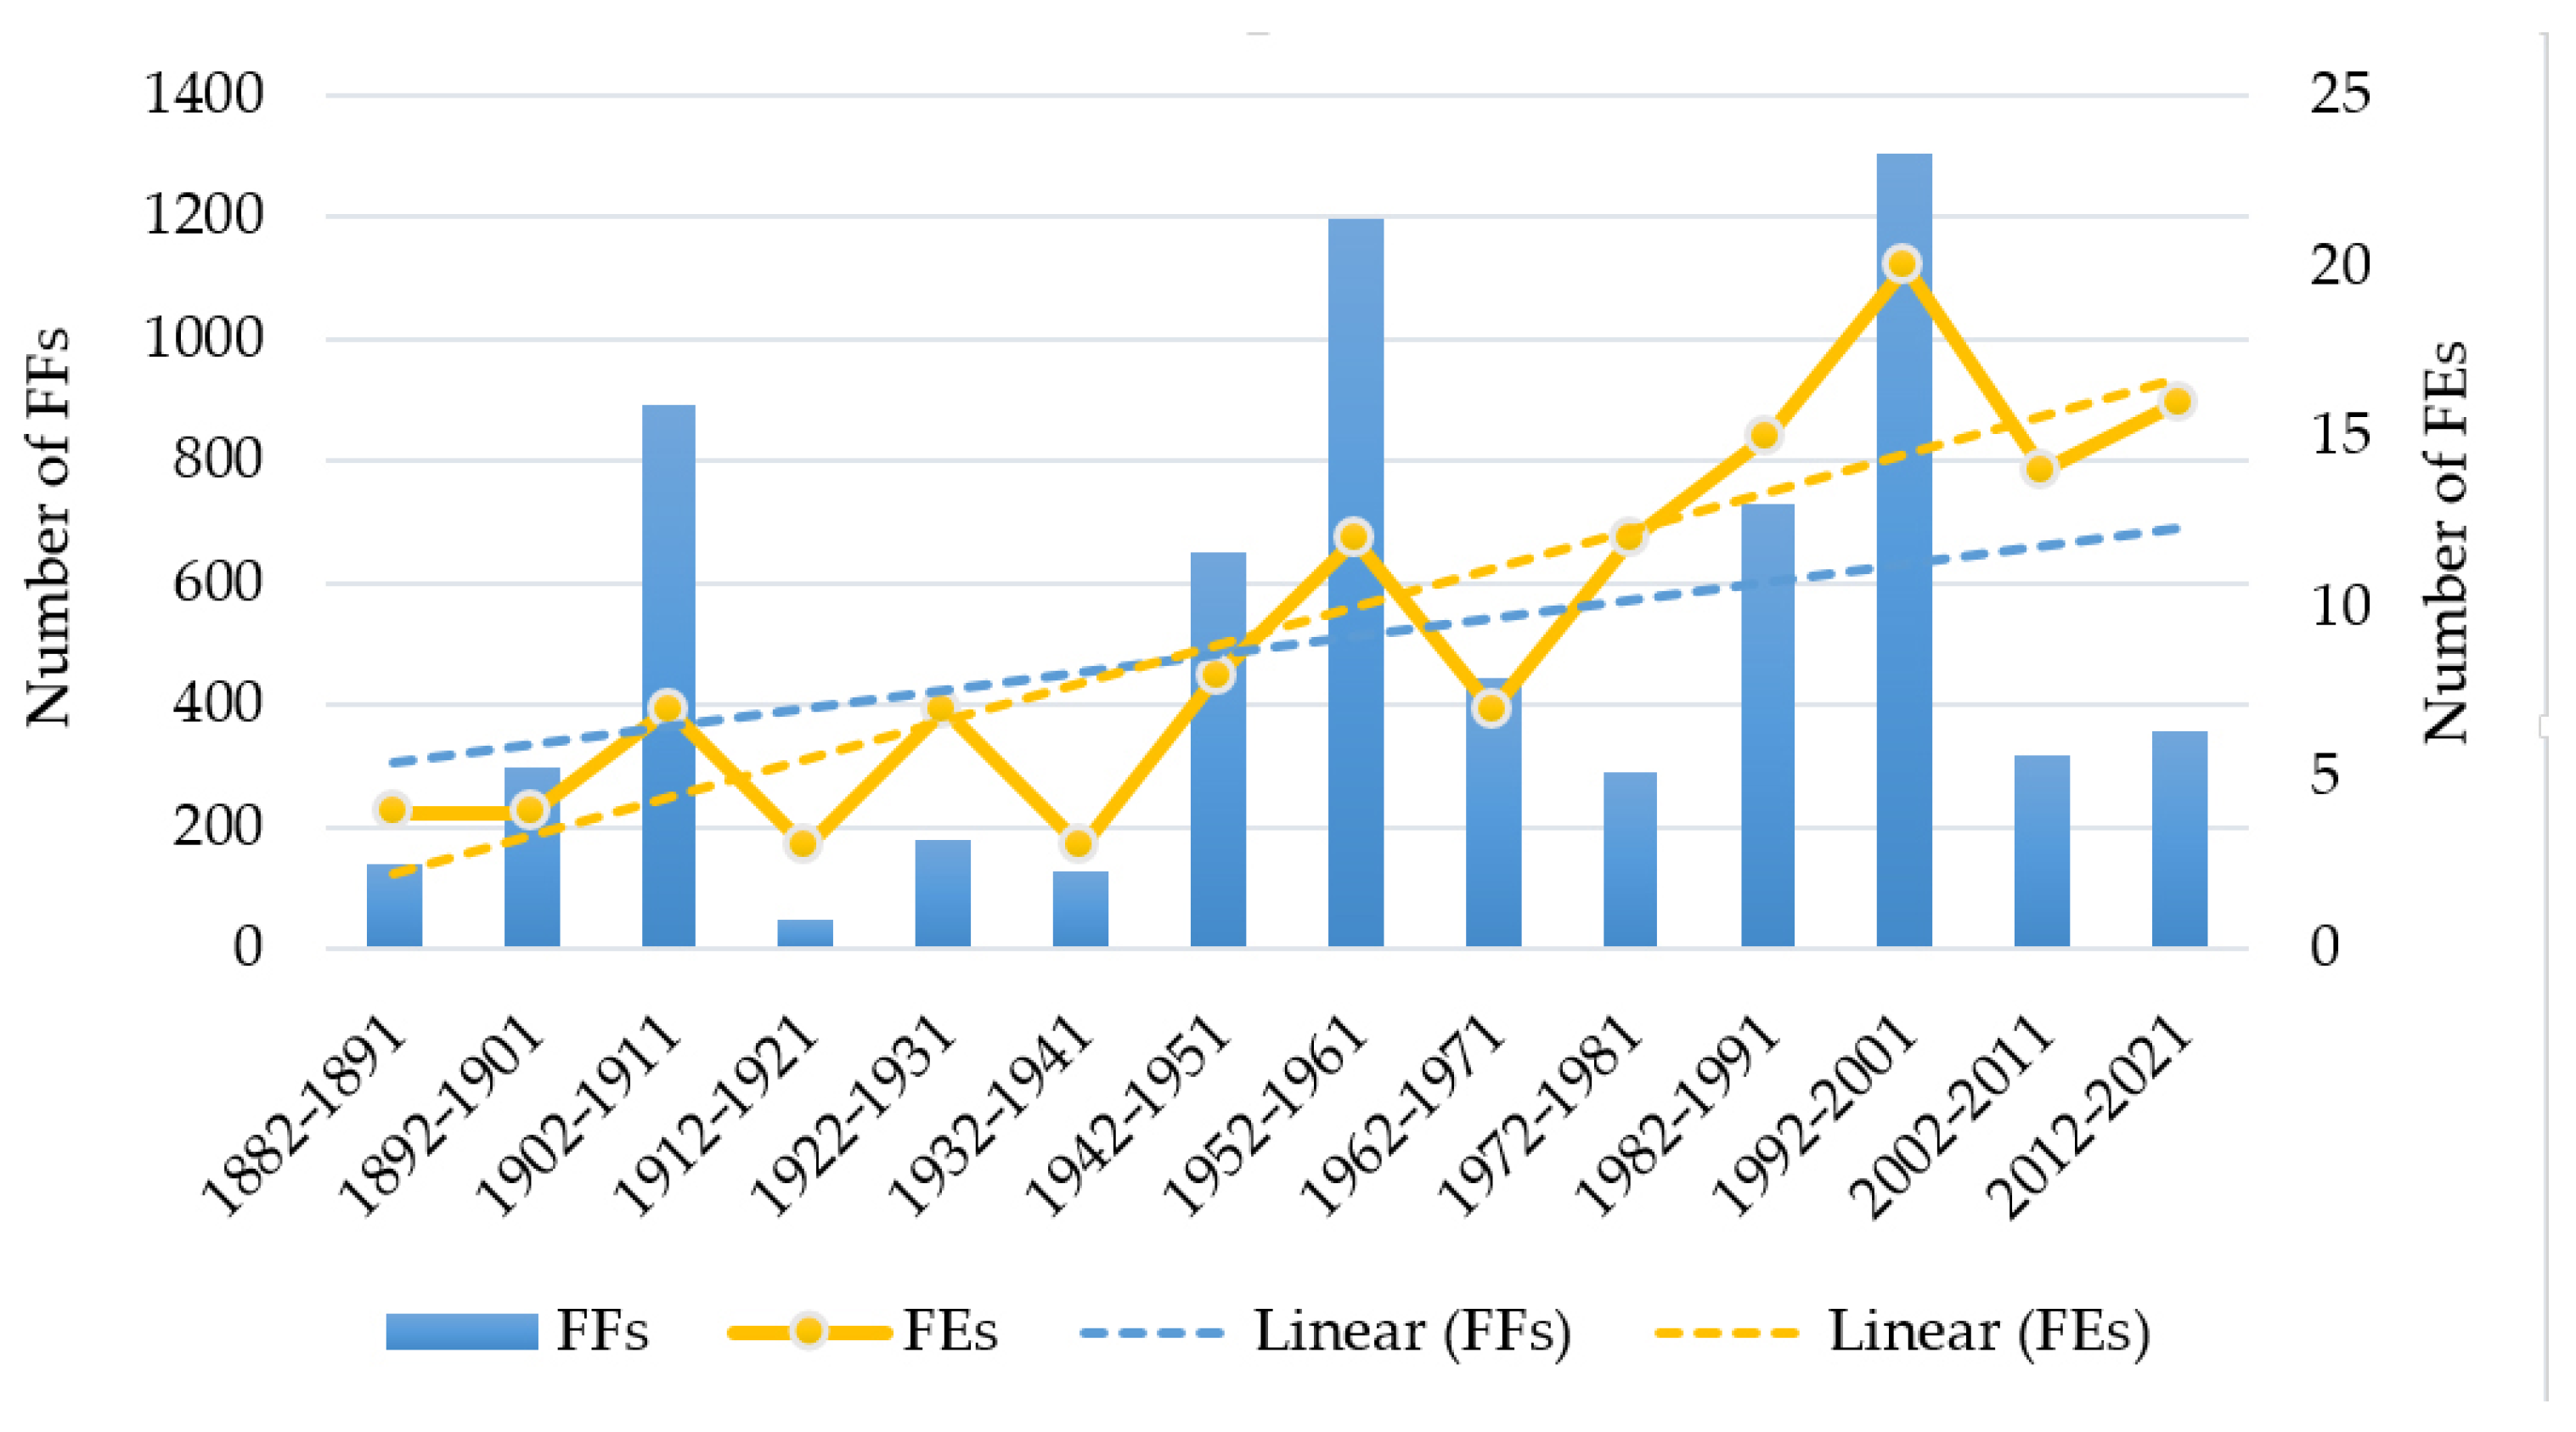
A temporal analysis at the 10-year level was also performed to account for the high interannual variability of the FEs number. As Figure 5 shows, we observe an upward trend in the 10-year aggregated FFs and FEs. Specifically, there is a statistically significant increase in the 10-year FFs (Poisson coef. = 0.06, p < 0.001) and FEs (Poisson coef. = 0.12, p < 0.001). In addition, the trends reveal a growing disentanglement (Figure 5) of the FFs trend from the FEs trend after the 1942–1951 decade. Namely, the 10-year FFs increase at a slower pace.
Figure 6 shows the 10-year distribution of FEs and FFs per FI. According to the statistical analyses, the 10-year FI1 FEs show a strong and statistically significant increase (Poisson coef. = 0.18, p < 0.001), and the FI2 FEs exhibit a weaker but statistically significant increase (Poisson coef. = 0.13, p < 0.01). At the same time, the change in the FI3 FEs at the 10-year level is not statistically significant. The number of 10-year FI1 and FI2-related FFs also exhibits strong and statistically significant increases (Poisson coef. = 0.17, p < 0.001, and Poisson coef. = 0.13, p < 0.001, respectively). Finally, the change in the FI3-related FFs is not statistically significant.

3.2. Return Period of Flash Flood Events with Ten or More Fatalities

The annual maximum number of FFs per FE was ranked to estimate their probability of occurrence and the respective return period in years. Figure 7 presents the fitted polynomial function graph between the FFs variable and the return period (logarithmic scale). The return period of FEs with ten or more FFs in the study area was estimated at 1.56 years. In other words, there is a 64.1% probability of exceeding the threshold of 10 FFs per FE in a given year in the region. In addition, Table 4 presents the return period and probability of occurrence for different categories of events regarding the flood impact magnitude (FI index).
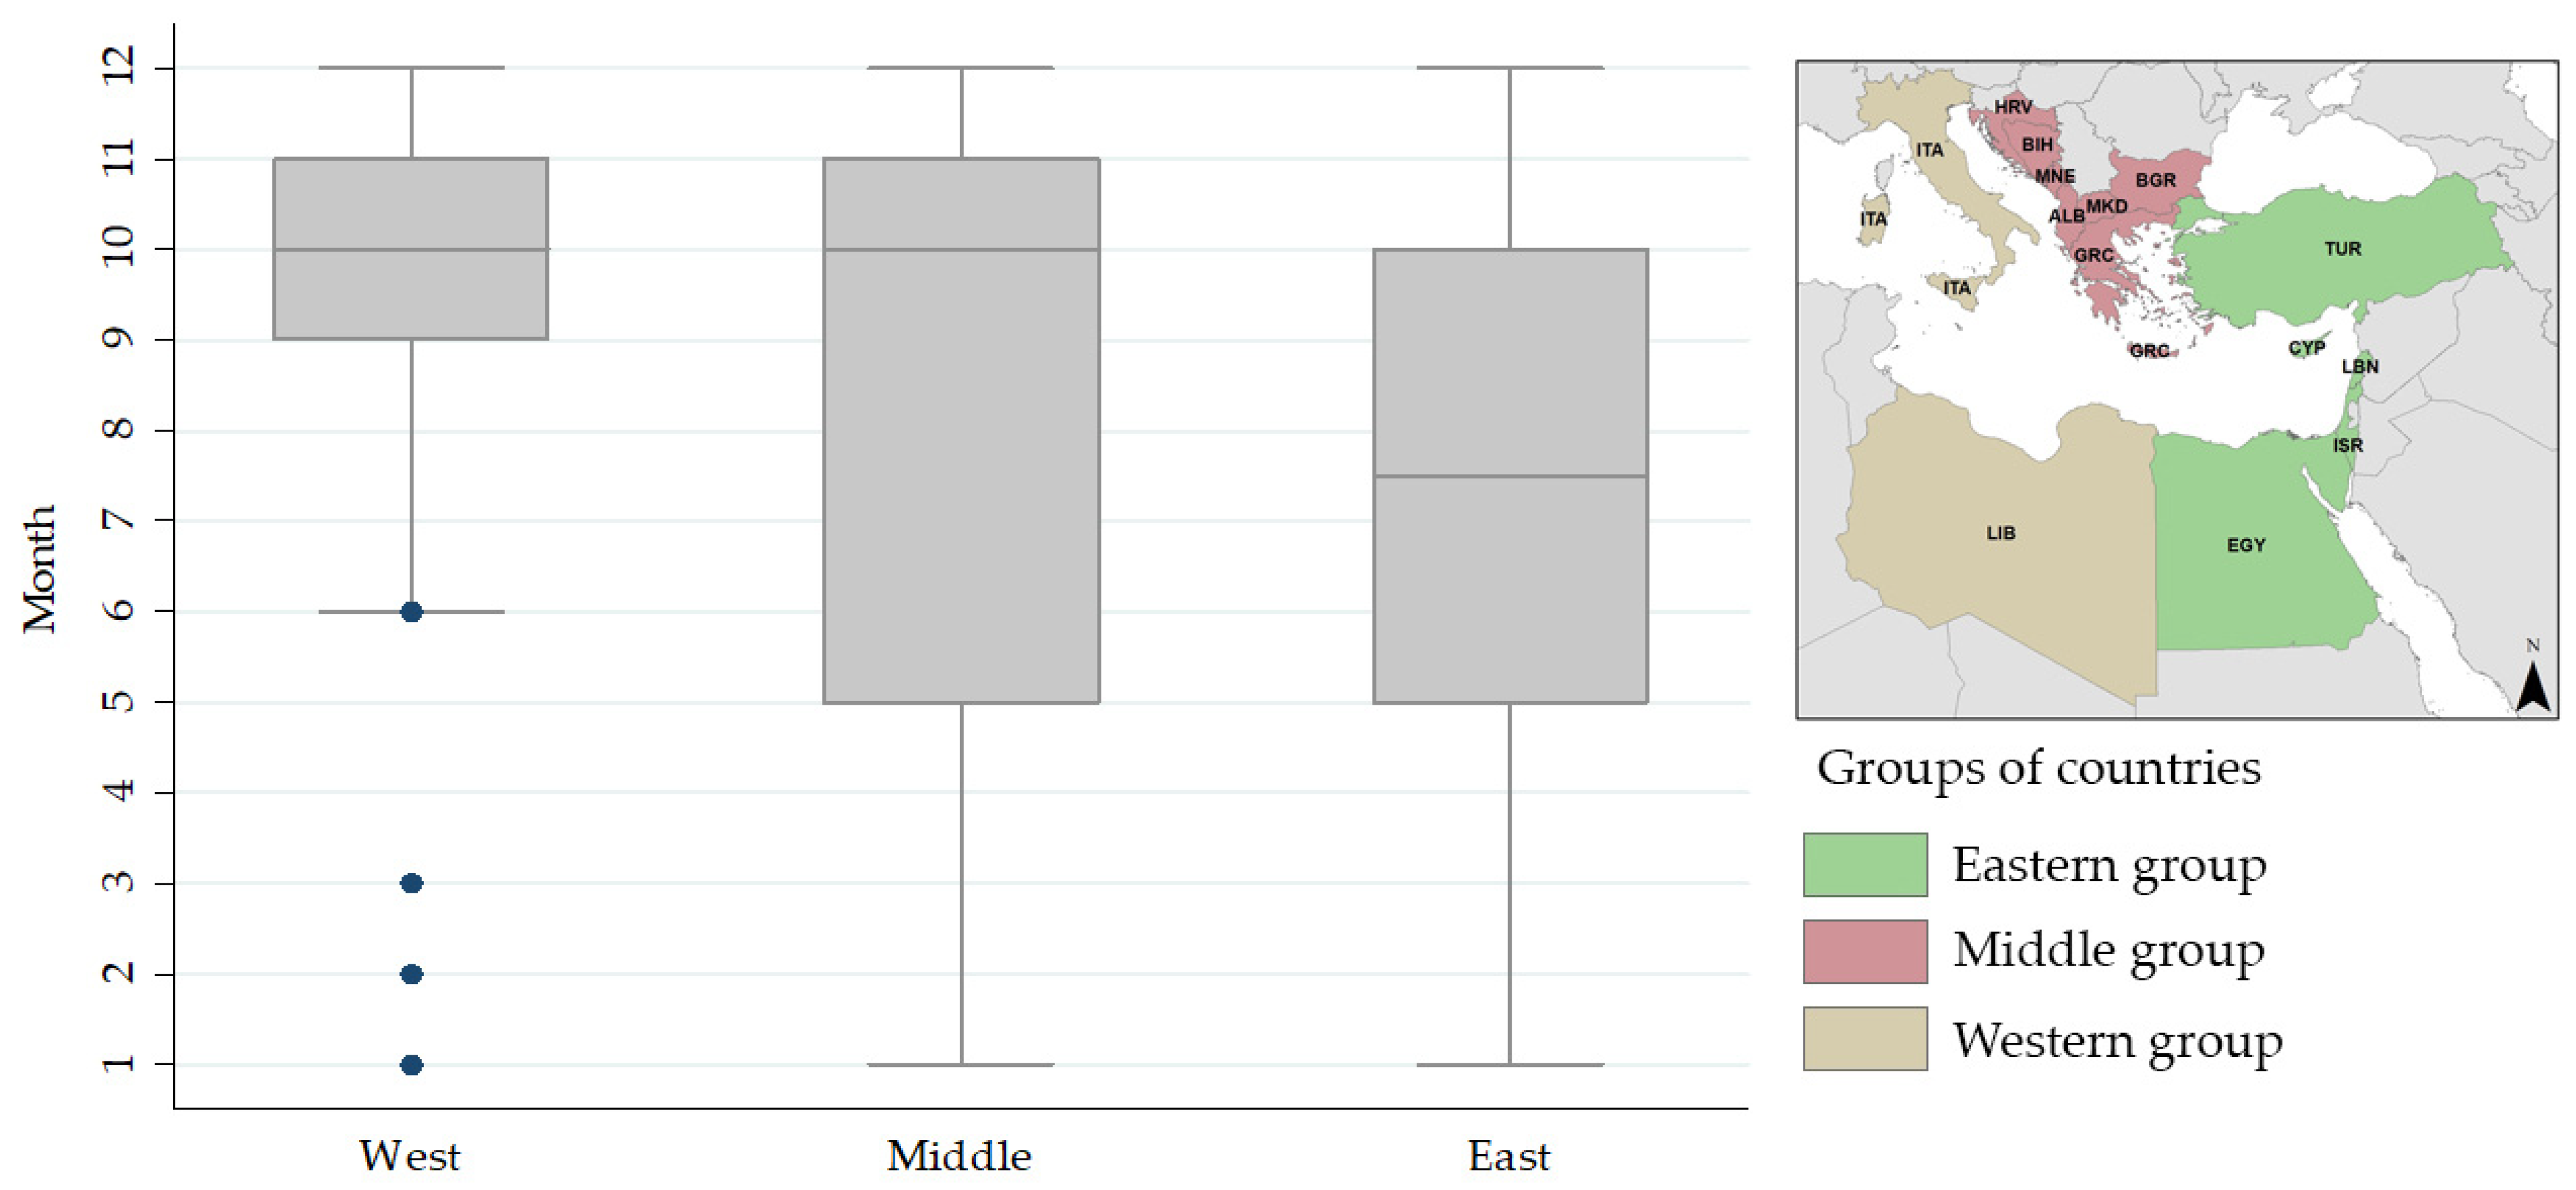
The possible variation in the return periods of FEs in different parts of the study area were examined by grouping the countries into three geographical regions: the western part of the study area (ITA, LBY: 52 FEs), the middle (ALB, BIH, BGR, GRC, MKD, HRV, MNE: 24 FEs), and the eastern part (CYP, EGY, ISR, LBN, TUR: 57 FEs). Table 5 presents the return periods of different categories of events (FI index) for each of the three geographical areas.
The adjusted R-squared was calculated at 0.98, 0.93, and 0.98 for the western, middle, and eastern areas, respectively. The results show that eastern and western regions have roughly similar return periods. However, the middle area, which includes the Balkan countries, shows higher return periods in all FI classes. Especially regarding FI3 events, we expect such FEs to occur with a return period of about 40 years, which is considerably higher than the approximately 15 to 16 years recorded in the western and eastern regions.

3.3. Seasonal Distribution

The monthly distributions (Figure 8) show that both the occurrence of FEs and the number of FFs are maximized in the fall, especially in November and October. The month of February shows the highest share of high-impact (FI3) FEs (29%), while the month of December has the highest share of high-impact (FI3) FFs (83%). No FI3 FEs were recorded in January, April, or May. An event with 200 FFs in Albania in 1905 was excluded from the seasonal analysis due to a lack of sources about its date.
The possible variations in the seasonal distribution of FEs between different parts of the study area were examined by the analysis over the different geographical entities defined in Section 3.2. According to the boxplot results (Figure 9), FEs in the western area were concentrated around October (50% between September and November). In the middle area, FEs mainly occurred in November, but monthly variability is high, with 50% of FEs spreading between June and November. However, in the eastern area, the degree of variability is also significant, with 50% of FEs occurring between May and October.
In splitting the study area into northern (ITA, ALB, BIH, BGR, GRC, MKD, HRV, MNE, TUR) and southern (CYP, EGY, ISR, LBN, LBY) provinces, a stronger seasonality in the south is observed, with the majority of events occurring between October and December, while there are no FEs between May and September (Figure 10). The north shows an abundance of events between October and November; however, there is a noteworthy number of summer flash floods.

4. Discussion

This research develops a database of high-mortality extreme flash flood events (10 or more FFs) in the Eastern Mediterranean region and explores their temporal and seasonal patterns. Overall, 132 events were identified in a 140-year period (1882–2021) in 13 countries bordering the eastern part of the Mediterranean Sea. The highest number of events were recorded in Italy (51), Turkey (35), Egypt (14), and Greece (12), whereas most of the rest recorded one to three events in the whole period. However, all countries had at least one event of 10 or more fatalities in the examined period.
Overall, the study provides answers to broader questions regarding how common such high-mortality events are in the Eastern Mediterranean region and whether their frequency changes over the period examined. In addition, it records various patterns concerning seasonality and probability of occurrence for such catastrophic events.
The study finds that high-mortality flash flood events are not uncommon in the region, with a return period of approximately 1.5 years in the whole study area. As expected, smaller events, in terms of mortality, are more frequent than high-impact ones. Events in the lower magnitude category (FI1, with less than 22 fatalities) record an annual probability of occurrence equal to 0.64. On the other hand, events in the upper magnitude category (FI3, with more than 82 fatalities) present an annual probability of occurrence equal to 0.11 and are approximately six times less frequent than the FI1 group.
The regional differences were also identified, with the Balkans exhibiting a lower frequency of extreme events, with approximately double values in the return periods of FI1 and FI2 magnitude floods and more than double values in the FI3 group.
These observations indicate the presence of fewer extreme events in the Balkans compared to Italy and Turkey. This spatial pattern presents a rather complete picture of the distribution of high-magnitude flash flood events occurring in the region, which has not been acknowledged before in the relevant literature (to the best of the authors’ knowledge). Previous works [71,85] have described in the past either the west or the east as more prone to catastrophic events, but they do not present the whole pattern and thus are only partly in agreement with the present findings.
In considering the magnitude categories, it can be noted that the magnitude group thresholds reflect percentiles used commonly in the literature and are selected to develop a meaningful, easily interpretable scale rather than represent a specific natural boundary. The selection of other threshold values in future research cannot be considered inappropriate, as we expect that it would not change substantially the trends identified in the present study.
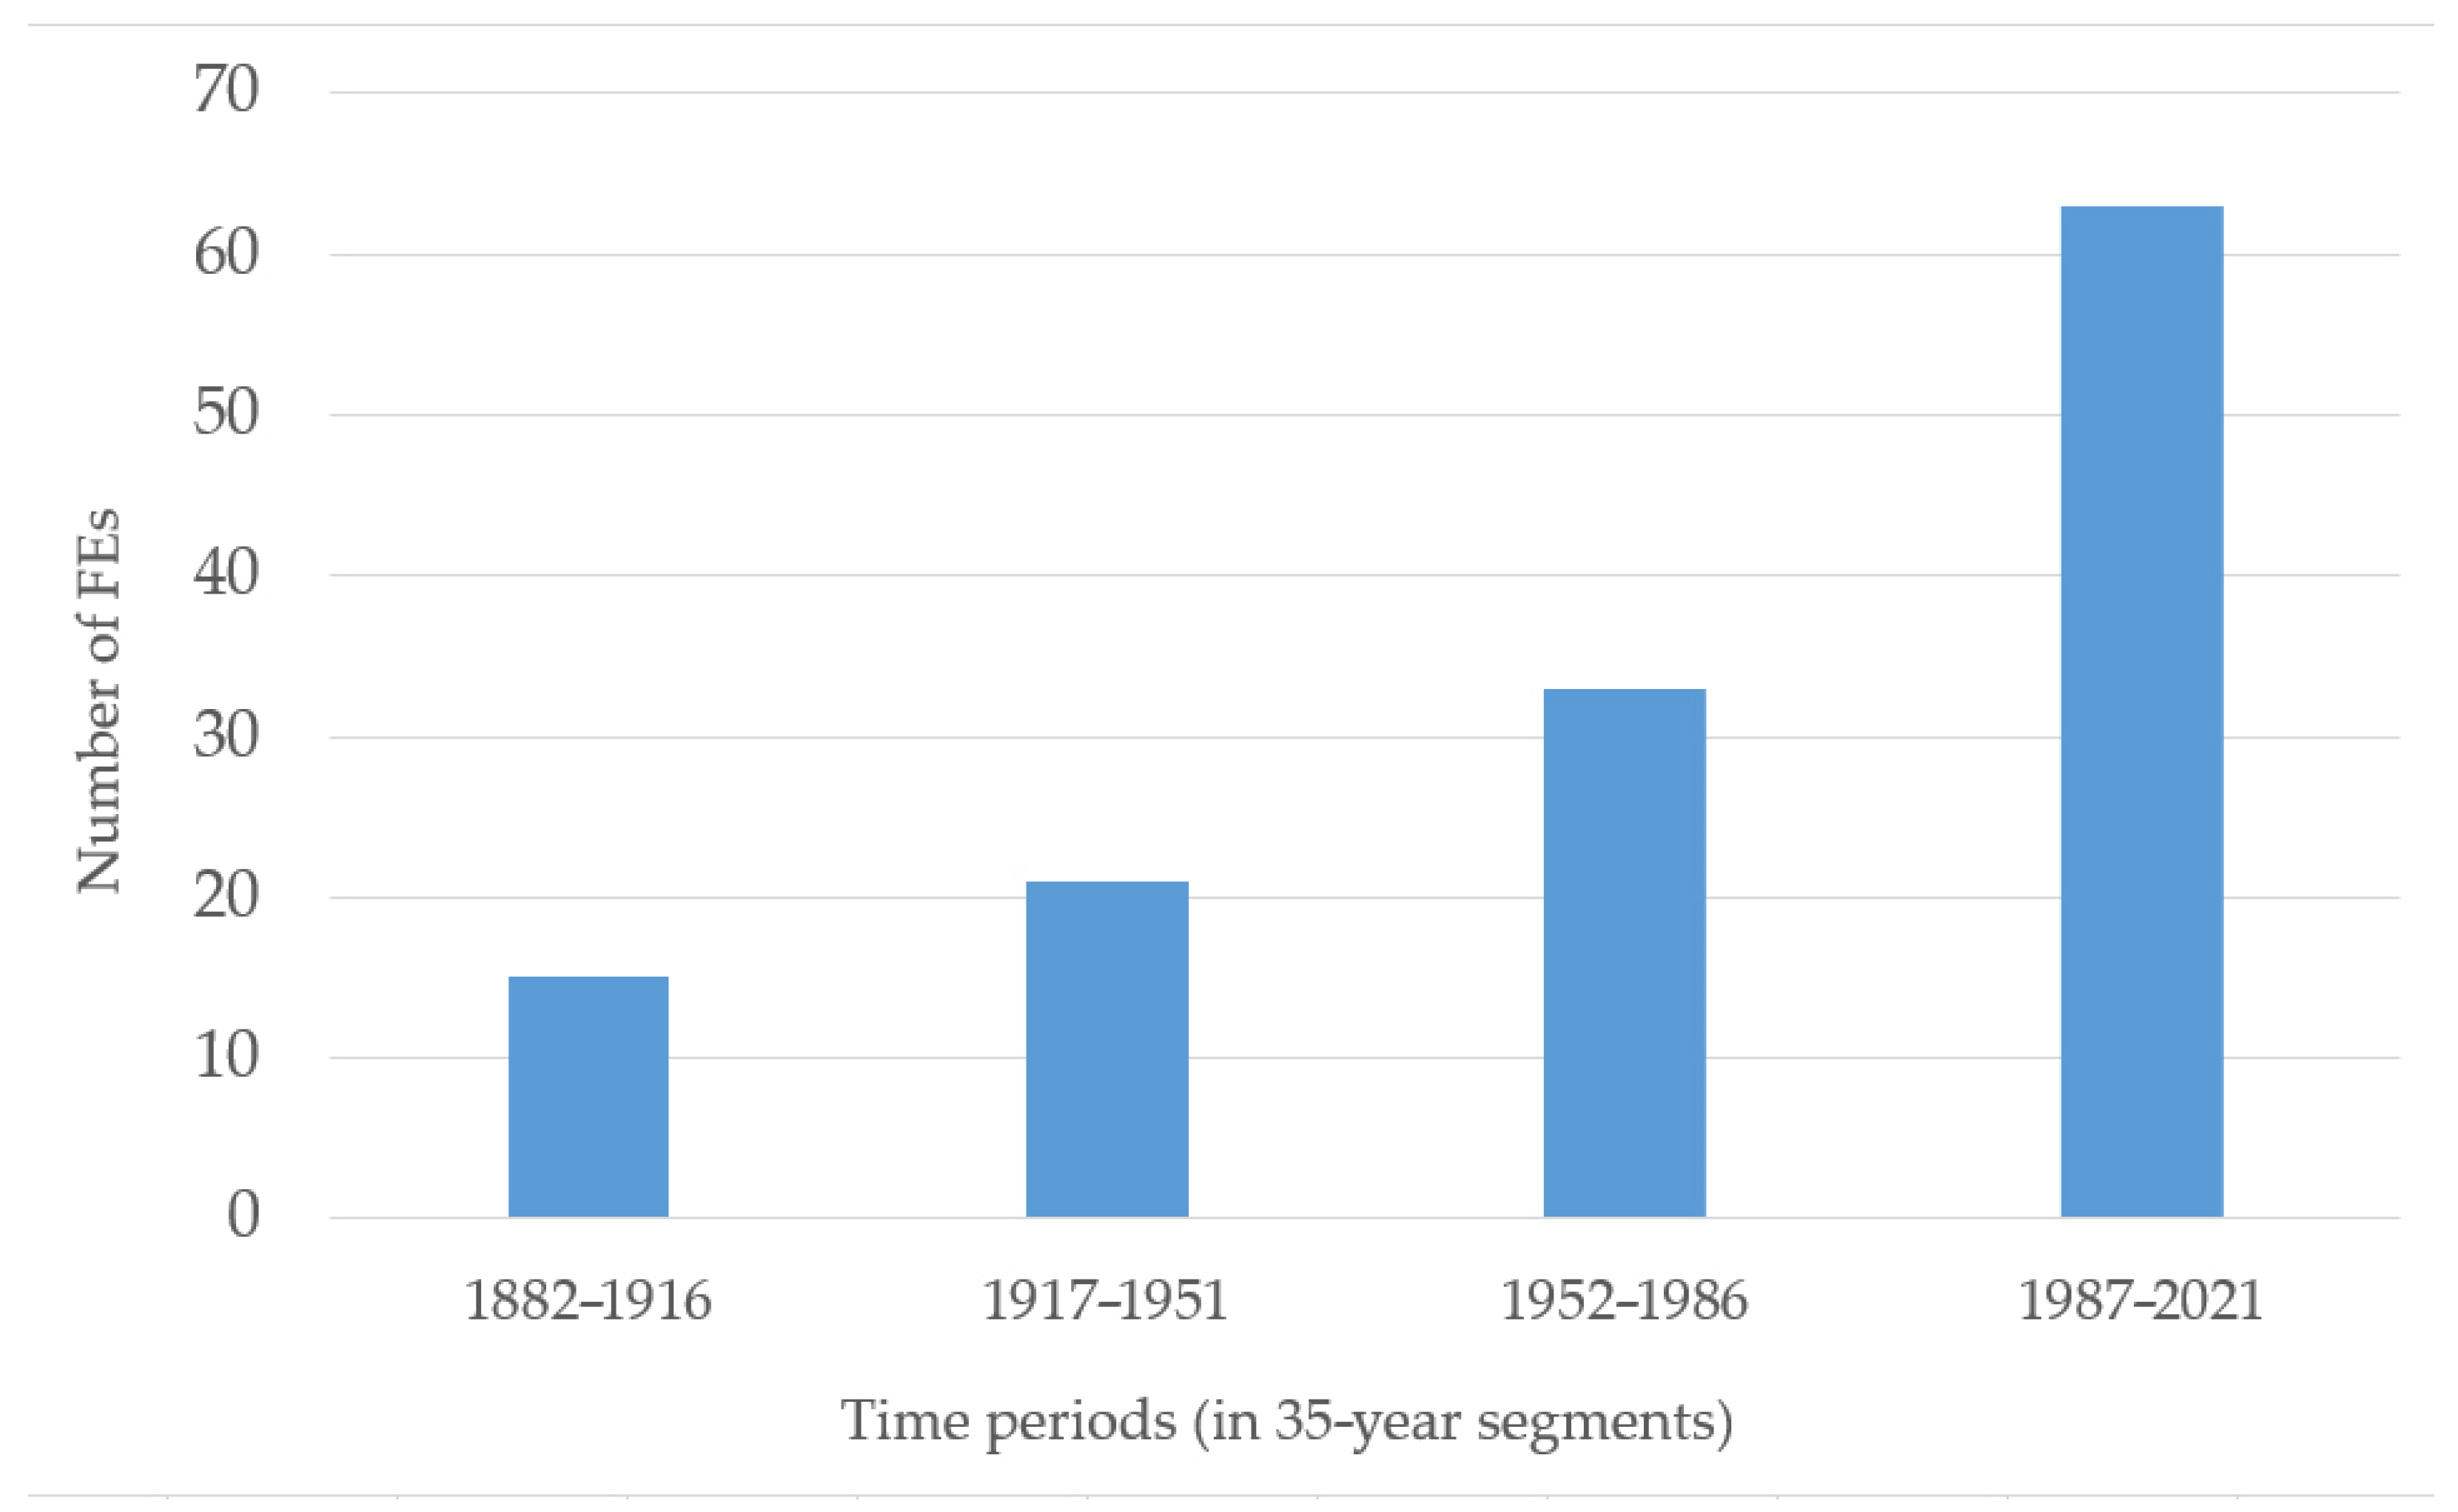
Additionally, the frequency and probability values are liable to change under nonstationarity [86] and thus could be different in the future. In fact, the FE frequency varies even within the study period. Apart from the statistically significant increasing trends in the number of fatalities (FFs) and the number of high-mortality events (FEs), there is a noteworthy rise in the number of events in the more recent decades, clearly shown in Figure 11 when the study period is split into four equal segments. Moreover, the frequency of FEs was found to be rising for lower impact events (groups FI1 and FI2), whereas for higher intensity ones (FI3), the trend did not show statistically significant changes and can be considered inconclusive. The latter could indicate actual stability in terms of the average rate of occurrence. However, one could not exclude the possibility of a gradual change over different temporal extents that can only be observed by studying even broader time periods that are not available in the present study. Nevertheless, the rise of FI1 and FI2 level events indicates that such events could be more frequent in the future.
In observing seasonality, we found a strong pattern with high percentages of October and November occurrences of FEs. For example, the period between September and December hosts more than 50% of the events, although only October and November stand out from the rest of the months (with approximately 40% of the total).
Additionally, in different parts of the study area, we found that the Western region (mostly Italy) has a strong seasonality, with fall being the season with the vast majority of occurrences. However, the middle (Balkans) and eastern regions exhibit a weaker seasonality, with a significant percentage of events occurring in the summer months and a high degree of variability.
The examination of patterns in seasonality between the north and south parts of the study area shows that the most prominent difference is the lack of events from May to September (i.e., no summer events) in the south, contrary to the significant percentage (approximately 40%) of FEs recorded in the north in the same months. The results in this aspect are in line with previous findings in the region [36,87].
The distribution recorded could be attributed to local seasonal storm-intensity patterns, which in turn follow the characteristics of broader systems in the region, including, for instance, the particular climatic attributes of the Southern Levant (i.e., the Cyprus Lows [88]), the Hadley cell [89] and others [90], as expressed, for example, with the higher number of days of extreme rainfall in autumn in Greece [91,92] or the seasonal distribution of precipitation recorded by the Global Historical Climatology Network (GHCN) [93]. It was observed that no noteworthy differences occurred between the seasonal distribution and the different groups of events (i.e., FI1, FI2, FI3).
The division between parts of the study area was for purposes of comparative analysis of the seasonality distribution and for the probability of occurrence of the flash flood events under study. In addition, the different country groups were selected in a way to represent broad geographical entities (e.g., the Balkans or the area of the Levant and North Africa) that, in turn, reflect coarsely different geographical and climatological characteristics as described above. In future research, focus can be placed on the patterns identified to explore correlations between specific regional characteristics and the occurrence of extreme events.
Although specific data are not currently available, the disentangling of trends between FFs and FEs and population could be an indication that the population in the region is better protected, as despite the occurrence of events and the rising population density, fatalities do not follow the same pace. In the future, research should be directed toward exploring the role of population density and temporal trends of flood mortality in the region in depth. In addition, although there is currently a lack of systematic data on flood impacts, future steps in research should enhance efforts to incorporate flood damage indicators into temporal evolution analysis.
In terms of practical implications, this study provides a foundation for understanding how common catastrophic flash flood events with multiple fatalities are, a particularly important measure for civil protection authorities, risk professionals, policymakers, engineers involved in flood protection measure development, and the insurance industry.
In addition, it is an important stepping stone towards a complete understanding of how extreme floods have changed in the last century or will change in the near future, affected by climatic changes or other factors (e.g., land use changes). The uniqueness of the present study lies in the fact that it examines these extreme events over a long period, i.e., 140 years, which is necessary to obtain a more reliable assessment of the frequency of such rare events.
Although flood fatalities can occur at any time of the year, these high percentages have value from a civil protection standpoint, as authorities and the general public in the region could use this information as a stepping stone to assess and reconsider their levels of preparedness against flooding and maybe set mechanisms or initiatives (e.g., awareness campaigns) to increase it.
In future research, there could be an expansion to other metrics of extreme floods, such as impacts on the natural or built environment, and even a reassessment the occurrence of FEs in the coming decades in the context of continuous monitoring of changes in their frequency. The spatial patterns identified could be attributed to population density-, infrastructure-, climatic-, geomorphology-, and land use-related reasons. It would be useful for future research to explore further the spatial dimension of the occurrence of extreme flood events and the factors associated with them.
The limitations to be noted are that the probability of events missing from the database cannot be entirely excluded. However, we consider this probability to be at a minimum level, given the fact that we have used multiple independent sources of data, including event-specific reports, country-level databases, and scientific publications. Further, catastrophic events attract scientific and social attention and are rarely missed by the press or any other publications. Thus, the overall estimated return periods and the trends identified in this study are not expected to change even in the case of missing events.
Moreover, to exclude or include a flood event in the database, this study followed the classification of flood types found in the relevant sources or classified events as flash floods based on the evidence presented in them. However, especially in the early stages of the study period, a source of uncertainty is associated with unclassified events or events with vague or ambiguous descriptions. In these cases, we used documentary evidence and included only the events with characteristics that matched those of flash floods.
With regard to return period estimation, the use of polynomial functions for developing the best fit line (following previous works [94]) was preferred over logarithmic in representing the data series (Figure 7) due to a significantly better fit (Adj. R2 was in the area of 0.98). It should be noted that if other distributions were used, results on return periods could be slightly different. For example, the logarithmic function leads to an overestimation of the frequency of extreme events (FI3 group) and a systematic underestimation of the frequency of low-magnitude ones (FI1 group). Nevertheless, it should be noted that there is uncertainty regarding the extreme values, as their return period may be larger than the study period examined.
It has to be stressed that the reported events do not reflect the whole of the flood mortality in the area, as literature shows that a large number of low-mortality events can be an important portion of the total number of fatalities [95,96].

5. Conclusions

In this study, a flood event database was developed and exploited to estimate how common high-mortality flood disasters are in the Eastern Mediterranean region and explore their seasonal, temporal, and regional patterns. To this end, we examine flash floods that have caused 10 or more fatalities in 13 countries in the region in the period 1882–2021, collecting data from five international databases and multiple country- or event-specific reports and databases.
A total of 132 events that have caused multiple fatalities (ranging from 10 to 598 deaths) in various locations in the region were identified. Although significant variations were found throughout the study period, the findings clearly show that high-mortality events are not uncommon, appearing with a return period of 1.56 years (events with >10 fatalities), 2.78 years (events with >22 fatalities), and 9.1 years (events with >82 fatalities), showing a relatively high probability of occurrence in any given year. Additionally, the findings indicate a significant increase, especially in the last quarter of the study period, which is confined to events of lower magnitude in terms of mortality. The most extreme and rare events in this dataset (15%) did not show changes in terms of frequency within the study period. The seasonal patterns were also identified, with events located in the southeastern part of the study area recording fewer summer occurrences in comparison with those identified in the north and northwest.

Author Contributions

Conceptualization, M.D. and M.F.; methodology, K.P., M.D. and M.F.; validation, K.P., M.D. and M.F.; formal analysis, K.P., M.D. and M.F.; investigation, K.P., M.D. and M.F.; data curation, K.P. and M.D.; writing—original draft preparation, K.P. and M.D.; writing—reviewing and editing, K.P. and M.D.; visualization, K.P. and M.D. All authors have read and agreed to the published version of the manuscript.

Funding

This research received no external funding.

Data Availability Statement

The data presented in this study are available on request from the corresponding author.

Conflicts of Interest

The authors declare no conflict of interest.

References

  1. Morrison, A.; Westbrook, C.J.; Noble, B.F. A review of the flood risk management governance and resilience literature. J. Flood Risk Manag. 2018, 11, 291–304. [Google Scholar] [CrossRef] [Green Version]
  2. Dordi, T.; Henstra, D.; Thistlethwaite, J. Flood risk management and governance: A bibliometric review of the literature. J. Flood Risk Manag. 2022, 15, e12797. [Google Scholar] [CrossRef]
  3. O’Donnell, E.C.; Thorne, C.R. Drivers of future urban flood risk. Philos. Trans. R. Soc. A Math. Phys. Eng. Sci. 2020, 378, 20190216. [Google Scholar] [CrossRef] [Green Version]
  4. Arduino, G.; Reggiani, P.; Todini, E. Recent advances in flood forecasting and flood risk assessment. Hydrol. Earth Syst. Sci. 2005, 9, 280–284. [Google Scholar] [CrossRef] [Green Version]
  5. Zanchetta, A.D.L.; Coulibaly, P. Recent Advances in Real-Time Pluvial Flash. Water 2020, 12, 570. [Google Scholar] [CrossRef] [Green Version]
  6. Delrieu, G.; Ducrocq, V.; Gaume, E.; Nicol, J.; Payrastre, O.; Yates, E.; Kirstetter, P.E.; Andrieu, H.; Ayral, P.A.; Bouvier, C.; et al. The catastrophic flash-flood event of 8–9 September 2002 in the Gard Region, France: A first case study for the Cévennes-Vivarais Mediterranean Hydrometeorological Observatory. J. Hydrometeorol. 2005, 6, 34–52. [Google Scholar] [CrossRef] [Green Version]
  7. Gaume, E.; Livet, M.; Desbordes, M.; Villeneuve, J.P. Hydrological analysis of the river Aude, France, flash flood on 12 and 13 November 1999. J. Hydrol. 2004, 286, 135–154. [Google Scholar] [CrossRef]
  8. Haynes, K.; Coates, L.; van den Honert, R.; Gissing, A.; Bird, D.; Dimer de Oliveira, F.; D’Arcy, R.; Smith, C.; Radford, D. Exploring the circumstances surrounding flood fatalities in Australia—1900–2015 and the implications for policy and practice. Environ. Sci. Policy 2017, 76, 165–176. [Google Scholar] [CrossRef]
  9. Diakakis, M.; Andreadakis, E.; Nikolopoulos, E.I.; Spyrou, N.I.; Gogou, M.E.; Deligiannakis, G.; Katsetsiadou, N.K.; Antoniadis, Z.; Melaki, M.; Georgakopoulos, A.; et al. An integrated approach of ground and aerial observations in flash flood disaster investigations. The case of the 2017 Mandra flash flood in Greece. Int. J. Disaster Risk Reduct. 2019, 33, 290–309. [Google Scholar] [CrossRef]
  10. Vinet, F.; Lumbroso, D.; Defossez, S.; Boissier, L. A comparative analysis of the loss of life during two recent floods in France: The sea surge caused by the storm Xynthia and the flash flood in Var. Nat. Hazards 2012, 61, 1179–1201. [Google Scholar] [CrossRef]
  11. Cornwall, W. Europe’s deadly floods leave scientists stunned. Sciene 2021, 373, 372–373. [Google Scholar] [CrossRef] [PubMed]
  12. Fekete, A.; Sandholz, S. Here comes the flood, but not failure? Lessons to learn after the heavy rain and pluvial floods in germany 2021. Water 2021, 13, 3016. [Google Scholar] [CrossRef]
  13. Petrucci, O.; Aceto, L.; Bianchi, C.; Brázdil, R.; Diakakis, M.; Inbar, M.; Kahraman, A.; Kılıç, O.; Krahn, A.; Kreibich, H.; et al. FFEM-DB “Database of Flood Fatalities from the Euro-Mediterranean region”. Sci. Data 2021, 9, 166. [Google Scholar]
  14. Petrucci, O.; Aceto, L.; Bianchi, C.; Bigot, V.; Br, R.; Pereira, S.; Kahraman, A.; Kılıç, Ö.; Kotroni, V.; Llasat, M.C.; et al. Flood Fatalities in Europe, 1980–2018: Variability, Features, and Lessons to Learn. Water 2019, 11, 1682. [Google Scholar] [CrossRef] [Green Version]
  15. Vinet, F.; Cherel, J.P.; Weiss, K.; Lewandowski, M.; Boissier, L. La mortalité liée aux inondations en région méditerranéenne française (1980–2020). LHB Hydrosci. J. 2022, 108, 2097022. [Google Scholar] [CrossRef]
  16. Gruntfest, E. Long term social and economic impacts of extreme floods. In US-Italy Research Workshop on the Hydrometeorology, Impacts, and Management of Extreme Floods, Perugia, Italy; Colorado State University: Fort Collins, CO, USA, 1995; p. 14. [Google Scholar]
  17. Skouloudis, A.; Tsalis, T.; Nikolaou, I.; Evangelinos, K.; Filho, W.L. Small & medium-sized enterprises, organizational resilience capacity and flash floods: Insights from a literature review. Sustainability 2020, 12, 7437. [Google Scholar] [CrossRef]
  18. Zhong, S.; Yang, L.; Toloo, S.; Wang, Z.; Tong, S.; Sun, X.; Crompton, D.; FitzGerald, G.; Huang, C. The long-term physical and psychological health impacts of flooding: A systematic mapping. Sci. Total Environ. 2018, 626, 165–194. [Google Scholar] [CrossRef]
  19. Krichene, H.; Geiger, T.; Frieler, K.; Willner, S.N.; Sauer, I.; Otto, C. Long-term impacts of tropical cyclones and fluvial floods on economic growth–Empirical evidence on transmission channels at different levels of development. World Dev. 2021, 144, 105475. [Google Scholar] [CrossRef]
  20. Houston, D.; Werritty, A.; Ball, T.; Black, A. Environmental vulnerability and resilience: Social differentiation in short- and long-term flood impacts. Trans. Inst. Br. Geogr. 2020, 46, 102–119. [Google Scholar] [CrossRef]
  21. Nordbeck, R.; Löschner, L.; Pelaez Jara, M.; Pregernig, M. Exploring Science–Policy Interactions in a Technical. Water 2019, 11, 1675. [Google Scholar] [CrossRef] [Green Version]
  22. Kahraman, A.; Kendon, E.J.; Chan, S.C.; Fowler, H.J. Quasi-Stationary Intense Rainstorms Spread Across Europe Under Climate. Geophys. Res. Lett. 2021, 48, e2020GL092361. [Google Scholar] [CrossRef]
  23. Schwartz, J. What Makes a Catastrophic Flood? And Is Climate Change Causing More of Them? New York Times, 22 March 2019; p. 13. [Google Scholar]
  24. Zittis, G.; Almazroui, M.; Alpert, P.; Ciais, P.; Cramer, W.; Dahdal, Y.; Fnais, M.; Francis, D.; Hadjinicolaou, P.; Howari, F.; et al. Climate Change and Weather Extremes in the Eastern Mediterranean and Middle East. Rev. Geophys. 2022, 60, e2021RG000762. [Google Scholar] [CrossRef]
  25. IPCC. Climate Change 2013: The Physical Science Basis. Contribution of Working Group I to the Fifth Assessment Report of the Intergovernmental Panel on Climate Change; Cambridge University Press: Cambridge, UK; New York, NY, USA, 2013. [Google Scholar]
  26. Romero, R.; Emanuel, K. Climate change and hurricane-like extratropical cyclones: Projections for North Atlantic polar lows and medicanes based on CMIP5 models. J. Clim. 2017, 30, 279–299. [Google Scholar] [CrossRef] [Green Version]
  27. González-Alemán, J.J.; Pascale, S.; Gutierrez-Fernandez, J.; Murakami, H.; Gaertner, M.A.; Vecchi, G.A. Potential Increase in Hazard From Mediterranean Hurricane Activity With Global Warming. Geophys. Res. Lett. 2019, 46, 1754–1764. [Google Scholar] [CrossRef]
  28. Ashley, S.T.; Ashley, W.S. Flood fatalities in the United States. J. Appl. Meteorol. Climatol. 2008, 47, 805–818. [Google Scholar] [CrossRef]
  29. Jonkman, S.N.; Kelman, I. An analysis of the causes and circumstances of flood disaster deaths. Disasters 2005, 29, 75–97. [Google Scholar] [CrossRef]
  30. Terti, G.; Ruin, I.; Anquetin, S.; Gourley, J.J. A situation-based analysis of flash flood fatalities in the United States. Bull. Am. Meteorol. Soc. 2017, 98, 333–345. [Google Scholar] [CrossRef]
  31. Pereira, S.; Diakakis, M.; Deligiannakis, G.; Zêzere, J.L. Comparing flood mortality in Portugal and Greece (Western and Eastern Mediterranean). Int. J. Disaster Risk Reduct. 2017, 22, 147–157. [Google Scholar] [CrossRef]
  32. Pereira, S.; Zêzere, J.L.; Quaresma, I.; Santos, P.P.; Santos, M. Mortality Patterns of Hydro-Geomorphologic Disasters. Risk Anal. 2016, 36, 1188–1210. [Google Scholar] [CrossRef]
  33. Brázdil, R.; Chroma, K.; Dolák, L.; Řehoř, J.; Rezníchova, L.; Zahradníček, P.; Dobrovolný, P. Fatalities associated with the severe weather conditions in the Czech Republic, 2000–2019. Nat. Hazards Earth Syst. Sci. 2021, 21, 1355–1382. [Google Scholar] [CrossRef]
  34. Hamilton, K.; Demant, D.; Peden, A.E.; Hagger, M.S. A systematic review of human behaviour in and around floodwater. Int. J. Disaster Risk Reduct. 2020, 47, 101561. [Google Scholar] [CrossRef]
  35. Marchi, L.; Borga, M.; Preciso, E.; Gaume, E. Characterisation of selected extreme flash floods in Europe and implications for flood risk management. J. Hydrol. 2010, 394, 118–133. [Google Scholar] [CrossRef]
  36. Tarolli, P.; Borga, M.; Morin, E.; Delrieu, G. Analysis of flash flood regimes in the North-Western and South-Eastern Mediterranean regions. Nat. Hazards Earth Syst. Sci. 2012, 12, 1255–1265. [Google Scholar] [CrossRef] [Green Version]
  37. Diakakis, M.; Deligiannakis, G.; Andreadakis, E.; Katsetsiadou, K.N.; Spyrou, N.I.; Gogou, M.E. How different surrounding environments influence the characteristics of flash flood-mortality: The case of the 2017 extreme flood in Mandra, Greece. J. Flood Risk Manag. 2020, 13, e12613. [Google Scholar] [CrossRef]
  38. Guha-Sapir, D.; Below, R.; Hoyois, P. EM-DAT: The CRED/OFDA International Disaster Database; Brussels, Belgium. 2021. Available online: https://www.carismand.eu/resources/em-dat-the-credofda-international-disaster-database.html (accessed on 20 November 2022).
  39. Brakenridge, G.R. Global Active Archive of Large Flood Events; Boulder, CO, USA. 2021. Available online: https://floodobservatory.colorado.edu/Archives/index.html (accessed on 20 November 2022).
  40. Paprotny, D.; Morales-nápoles, O.; Jonkman, S.N. HANZE: A pan-European database of exposure to natural hazards and damaging historical floods since 1870. Earth Syst. Sci. Data 2018, 10, 565–581. [Google Scholar] [CrossRef] [Green Version]
  41. European Environment Agency. Flood Phenomena. European Past Floods; European Environment Agency: Brussels, Belgium, 2015. [Google Scholar]
  42. Toto, E.; Massabo, M. Historical Collection of Disaster Loss Data in Albania; Savona, Italy. 2014. Available online: https://www.undrr.org/publication/historical-collection-disaster-loss-data-albania (accessed on 20 November 2022).
  43. Bogdani, M.; Selenica, A. Catastrophic floods and their risk in the rivers of Albania. In Destructive Water: Water Caused Natural Disasters, Their Abatement and Control; Leavesley, G., Lins, H., Nobilis, F., Parker, R., Schneider, V., Ven de Van, F., Eds.; IAHS Publications: Wallingford, UK, 1997; pp. 83–85. [Google Scholar]
  44. GIZ. Preliminary Flood Risk Assessment for the Drin/Drim-Buna/Bojana River Basin; Deutsche Gesellschaft für Internationale Zusammenarbeit: Bonn, Germany, 2018. [Google Scholar]
  45. ACAPS. Floods in Serbia, Bosnia and Herzegovina; ACAPS: Geneva, Switzerland, 2014. [Google Scholar]
  46. FloodList Floodlist Website. Available online: https://floodlist.com (accessed on 20 November 2022).
  47. Kundzewicz, Z.W. Changes in Flood Risk in Europe, 1st ed.; Kundzewicz, Z.W., Ed.; Taylor and Francis: London, UK, 2012; ISBN 9780203098097. [Google Scholar]
  48. Vidmar, A.; Globevnik, L.; Koprivšek, M.; Sečnik, M.; Zabret, K.; Durović, B.; Anzeljc, D.; Kastelic, J.; Kobold, M.; Sušnik, M.; et al. The Bosna River floods in May 2014. Nat. Hazards Earth Syst. Sci. 2016, 16, 2235–2246. [Google Scholar] [CrossRef] [Green Version]
  49. EU ECHO. Floods-Spring and Summer 2005. Available online: https://ec.europa.eu/echo/files/civil_protection/floods_2005.htm (accessed on 9 November 2022).
  50. Bonacci, O.; Ljubenkov, I. Changes in flow conveyance and implication for flood protection, Sava River, Zagreb. Hydrol. Process. 2008, 22, 1189–1196. [Google Scholar] [CrossRef]
  51. Kovačić, T. Analysis of Short-Term Rainfall Characteristics Related to the Pluvial Floods in the City of Zagreb; University of Zagreb: Zagreb, Croatia, 2020. [Google Scholar]
  52. Polignosi Floods. Available online: http://www.polignosi.com/cgibin/hweb?-A=9171&-V=limmata (accessed on 9 November 2022).
  53. WDD. Preliminary Flood Risk Assessment Final Report; WDD: Lefkosia, Cyprus, 2011; Volume 70. [Google Scholar]
  54. Abdel-Fattah, M.; Kantoush, S.A.; Sumi, T. Integrated Management of Flash Flood in Wadi System of Egypt: Disaster Prevention and Water Harvesting. Annu. Disaster Prev. Res. Inst. Kyoto Univ. 2015, 58, 485–496. [Google Scholar]
  55. El Afandi, G.; Morsy, M. Developing an early warning system for flash flood in Egypt: Case study Sinai Peninsula. In Flash Floods in Egypt; Negm, A.M., Ed.; Springer: Cham, Switzerland, 2020; pp. 45–60. [Google Scholar]
  56. El Gohary, R. Environmental Flash Flood Management in Egypt. In Flash Floods in Egypt; Negm, A.M., Ed.; Springer: Cham, Switzerland, 2020; pp. 85–105. [Google Scholar]
  57. IFRC. Emergency Plan of Action (EPoA), Egypt: Flash Floods; Mena. 2020. Available online: https://reliefweb.int/report/egypt/egypt-flash-floods-emergency-plan-action-epoa-final-report-dref-n-mdreg015 (accessed on 20 November 2022).
  58. Negm, A.M. Flash Floods in Egypt; Negm, A.M., Ed.; Springer: Cham, Switzerland, 2020; ISBN 9783030296346. [Google Scholar]
  59. The New York Times Article Archive. New York Times. 2022, p. 1. Available online: https://archive.nytimes.com/www.nytimes.com/ref/membercenter/nytarchive.html (accessed on 20 November 2022).
  60. Omran, E.S.E. Egypt’s Sinai desert cries: Flash flood hazard, vulnerability, and mitigation. In Flash Floods in Egypt; Negm, A.M., Ed.; Springer: Cham, Switzerland, 2020; pp. 215–236. [Google Scholar]
  61. UN DHA. Egypt-Floods Nov 1994, UNDHA Situation Reports 1–4; UN DHA: Geneva, Switzerland, 1994. [Google Scholar]
  62. Saber, M.; Abdrabo, K.I.; Habiba, O.M.; Kantosh, S.A.; Sumi, T. Impacts of triple factors on flash flood vulnerability in Egypt: Urban growth, extreme climate, and mismanagement. Geoscience 2020, 10, 24. [Google Scholar] [CrossRef] [Green Version]
  63. Papagiannaki, K.; Lagouvardos, K.; Kotroni, V. A database of high-impact weather events in Greece: A descriptive Atmospheric impact analysis for the period 2001–2011. Nat. Hazards Earth Syst. Sci. 2013, 13, 727–736. [Google Scholar] [CrossRef]
  64. Diakakis, M.; Deligiannakis, G. Flood fatalities in Greece: 1970–2010. J. Flood Risk Manag. 2017, 10, 115–123. [Google Scholar] [CrossRef]
  65. Diakakis, M. An inventory of flood events in Athens, Greece, during the last 130 years. Seasonality and spatial distribution. J. Flood Risk Manag. 2014, 7, 332–343. [Google Scholar] [CrossRef]
  66. Inbar, M. Natural Hazards in Israel, 1948–2004: A Temporal and Spatial Analysis Author (s): Moshe Inbar Contemporary Israeli Geopraphy/תננמז תב תילארשי היפרגואג & lrm; ( 2004-ד " סשת ). In Contemporary Israeli Geography; Maos, J.O., Inbar, M., Shmueli, D.F., Eds.; Natural Hazards: Haifa, Israel, 2004; pp. 139–146. Available online: https://www.jstor.org/stable/23712691 (accessed on 20 November 2022).
  67. APAT. Annuario Dei Dati Ambientali 2004; APAT: Roma, Italy, 2004. [Google Scholar]
  68. Aronica, G.T.; Brigandi, G.; Morey, N. Flash floods and debris flow in the city area of Messina, north-east part of Sicily, Italy in October 2009: The case of the Giampilieri catchment. Nat. Hazards Earth Syst. Sci. 2012, 12, 1295–1309. [Google Scholar] [CrossRef]
  69. Faccini, F.; Paliaga, G.; Piana, P.; Sacchini, A.; Watkins, C. The Bisagno stream catchment (Genoa, Italy) and its major floods: Geomorphic and land use variations in the last three centuries. Geomorphology 2016, 273, 14–27. [Google Scholar] [CrossRef]
  70. Petrucci, O.; Pasqua, A.A. Historical climatology of storm events in the mediterranean: A case study of damaging hydrological events in Calabria, Southern Italy. In Advances in Natural and Technological Hazards Research; Diodato, N., Bellocchi, G., Eds.; Springer: Berlin/Heidelberg, Germany, 2014; Volume 39, pp. 249–268. ISBN 9789400779488. [Google Scholar]
  71. Gaume, E.; Borga, M.; Llasat, M.C.; Maouche, S.; Lang, M.; Diakakis, M. Mediterranean extreme floods and flash floods. In The Mediterranean Region under Climate Change: A Scientific Update; Sabrié, M.-L., Gibert-Brunet, E., Mourier, T., Eds.; IRD Editions: Marseille, France, 2016; pp. 133–145. [Google Scholar]
  72. Suwaydan, M.T. Abu Ali River Floods and Their Control in Tripoli, Lebanon; American University of Beirut: Tripoli, Libya, 1957. [Google Scholar]
  73. UNISDR. South Eastern Europe Disaster Risk Mitigation and Adaptation Initiative; UNISDR: New York, NY, USA, 2008. [Google Scholar]
  74. Malevski, I. Natural Hazards in the Republic of Macedonia with Special Emphasis on Flood and Earthquake in Skopje in 2016. Геoграфски Разгледи 2017, 50, 53–69. [Google Scholar]
  75. Yüksek, Ö.; Kankal, M.; Üçüncü, O. Assessment of big floods in the Eastern Black Sea Basin of Turkey. Environ. Monit. Assess. 2013, 185, 797–814. [Google Scholar] [CrossRef] [PubMed]
  76. Haltas, I.; Yildirim, E.; Oztas, F.; Demir, I. A comprehensive flood event specification and inventory: 1930–2020 Turkey case study. Int. J. Disaster Risk Reduct. 2021, 56, 102086. [Google Scholar] [CrossRef]
  77. Uluatam, S.S. Risk reduction of environmental pollution and water resources problem for sustainable development. In Risk reduction: Chemicals and energy into the 21st Century; Richardson, M., Ed.; CRC Press: London, UK, 1996; p. 612. [Google Scholar]
  78. Koç, G.; Petrow, T.; Thieken, A.H. Analysis of the most severe flood events in Turkey (1960-2014): Which triggering mechanisms and aggravating pathways can be identified? Water 2020, 12, 1562. [Google Scholar] [CrossRef]
  79. Kaymaz, I. The Lost Streams of Ankara: A Case Study of Bentderesi. IOP Conf. Ser. Mater. Sci. Eng. 2019, 603. [Google Scholar] [CrossRef] [Green Version]
  80. Ballar, Z. Stormwater Management in Cities as a Climate Change Adaptation Strategy: Case of Halkapınar District. Master’s Thesis, Izmir Institute of Technology, Izmir, Turkey, 2019. Available online: https://gcris.iyte.edu.tr/bitstream/11147/9668/1/10308479.pdf (accessed on 20 November 2022).
  81. Gürer, I. Flood Disasters and Preventative Measures in Turkey. J. Nat. Disaster Sci. 1998, 20, 1–9. [Google Scholar]
  82. Burn, D.H. Evaluation of regional flood frequency analysis with a region of influence approach. Water Resour. Res. 1990, 26, 2257–2265. [Google Scholar] [CrossRef]
  83. Lavers, D.A.; Villarini, G. Atmospheric rivers and flooding over the central United States. J. Clim. 2013, 26, 7829–7836. [Google Scholar] [CrossRef]
  84. Weibull, W. A Statistical Distribution Function of Wide Applicability. J. Appl. Mech. 1951, 1, 5. [Google Scholar] [CrossRef]
  85. Vinet, F.; Bigot, V.; Petrucci, O.; Papagiannaki, K.; Llasat, M.C.; Kotroni, V.; Boissier, L.; Aceto, L.; Grimalt, M.; Pasqua, A.A.; et al. Mapping Flood-Related Mortality in the Mediterranean Basin. Results from the MEFF v2.0 DB. Water 2019, 11, 2196. [Google Scholar] [CrossRef]
  86. Read, L.K.; Vogel, R.M. Reliability, return periods, and risk under nonstationarity. Water Resour. Res. 2015, 51, 6381–6398. [Google Scholar] [CrossRef]
  87. Diakakis, M. Flood seasonality in Greece and its comparison to seasonal distribution of flooding in selected areas across southern Europe. J. Flood Risk Manag. 2017, 10, 30–41. [Google Scholar] [CrossRef]
  88. Ziv, B.; Dayan, U.; Kushnir, Y.; Roth, C.; Enzel, Y. Regional and global atmospheric patterns governing rainfall in the southern Levant. Int. J. Climatol. 2006, 26, 55–73. [Google Scholar] [CrossRef]
  89. Dima, I.M.; Wallace, J.M. On the seasonality of the Hadley Cell. J. Atmos. Sci. 2003, 60, 1522–1527. [Google Scholar] [CrossRef]
  90. Lionello, P. (Ed.) The Climate of the Mediteerranean Region. From the Past to the Future; Elsevier: Amsterdam, The Netherlands, 2012; ISBN 9780124160422. [Google Scholar]
  91. Nastos, P.T.; Zerefos, C.S. Decadal changes in extreme daily precipitation in Greece. Adv. Geosci. 2008, 16, 55–62. [Google Scholar] [CrossRef] [Green Version]
  92. Koutroulis, A.G.; Tsanis, I.K.; Daliakopoulos, I.N. Seasonality of floods and their hydrometeorologic characteristics in the island of Crete. J. Hydrol. 2010, 394, 90–100. [Google Scholar] [CrossRef]
  93. Fernández, J.; Sáenz, J.; Zorita, E. Analysis of wintertime atmospheric moisture transport and its variability over southern Europe in the NCEP reanalyses. Clim. Res. 2003, 23, 195–215. [Google Scholar] [CrossRef]
  94. Ostertagová, E. Modelling using polynomial regression. Procedia Eng. 2012, 48, 500–506. [Google Scholar] [CrossRef] [Green Version]
  95. Hoyois, P.; Guha-sapir, D. Three Decades of Floods in Europe: A Preliminary Analysis of EMDAT Data; Centre for Research on the Epidimiology of Disasters: Brussels, Belgium, 2003. [Google Scholar]
  96. Diakakis, M. Have flood mortality qualitative characteristics changed during the last decades? The case study of Greece. Environ. Hazards 2016, 15, 148–159. [Google Scholar] [CrossRef]
Figure 1. Map of the countries included in the database. Note the abbreviations: ALB: Albania, BIH: Bosnia and Herzegovina, BGR: Bulgaria, HRV: Croatia, CYP: Cyprus, EGY: Egypt, GRC: Greece, ISR: Israel, ITA: Italy, LBN: Lebanon, LBY: Libya, MNE: Montenegro, MKD: North Macedonia, TUR: Turkey.
Water 15 00119 g001
Figure 2. Relationship between the minimum and maximum number of FFs, as reported by the various sources for each FE. Each dot in the diagram corresponds to a flash flood event indicating the respective combination of minimum and maximum number of FFs recorded for this event.
Water 15 00119 g002
Figure 3. Frequency distribution (histogram) of flood fatalities (FFs) per flood event (FE) in the study period 1882–2021.
Water 15 00119 g003
Figure 4. Annual number of flood fatalities (FFs) for the period 1882–2021.
Water 15 00119 g004
Figure 5. Number of events, FEs, and associated fatalities, FFs, per 10-year period
Water 15 00119 g005
Figure 6. Number of 10-year events, FEs (a), and associated fatalities, FFs (b), per flood impact magnitude class, FI.
Water 15 00119 g006
Figure 7. Yearly maximum number of flood fatalities (FFs) per flood event (FE) against their return period (T) in years
Water 15 00119 g007
Figure 8. Monthly distribution of flood events FEs (left), and flood fatalities FFs (right), over the flood impact magnitude classes (FI).
Water 15 00119 g008
Figure 9. Distribution (boxplot) of monthly occurrences over three geographical regions of the study area: west (ITA, LBY), middle (ALB, BIH, BGR, GRC, MKD, HRV, MNE), and east (CYP, EGY, ISR, LBN, TUR), along with a map illustrating the separation of regions. Blue dots represent outlier events.
Water 15 00119 g009
Figure 10. Distribution (boxplot) of monthly occurrences over two geographical regions of the study area: northern (ITA, ALB, BIH, BGR, GRC, MKD, HRV, MNE, TUR) and southern (CYP, EGY, ISR, LBN, LBY), along with a map illustrating the separation of regions. Blue dots represent outlier events.
Water 15 00119 g010
Figure 11. Graph showing the number of flood events (FEs) in four 35-year segments of the study period (1882–2021).
Water 15 00119 g011
Table 1. Details on the data sources used for each country that is included in the database and the number of flash flood events found.
Country *International DatabasesOther SourcesNumber of Fes ** with >10FFs ***
EM-DATDFOFFEM-DBHANZE-EEPF
ALB Toto and Massabo [42] a
Bogdani and Selenica [43] c
GIZ [44] b
2
BIH ACAPS [45] f
Floodlist.com [46] f
Kundzewicz [47] d
Vidmar [48] c
3
BGR EU ECHO [49] d
Floodlist.com [46] f
3
HRV Bonacci & Ljubenkov [50] c
Kovačić, T. [51] c
1
CYPPolignosi [52] b
WDD [53] a
2
EGY Abdel-Fattah et al. [54] c
El Afandi & Morsy [55] c
El Gohary [56] c
IFRC [57] d
Negm [58] c
New York Times [59] e
Omran [60] c
UN DHA [61] f
Saber et al. [62] c
14
GRCIERSD/NOA catalogs a
Papagiannaki et al. [63] c
Diakakis and Deligiannakis [64] c
Diakakis [65] c
floodlist.com [46] f
12
ISR Inbar [66] a
floodlist.com [46] f
3
ITAAPAT [67] b
Aronica et al. [68] c
floodlist.com [46] f
Faccini et al. [69] c
New York Times [59] e
Petrucci & Pasqua [70] c
51
LBN Gaume [71] c
New York Times [59] e
Suwaydan [72] c
2
LBY Floodlist.com [46] f
New York Times [59]
1
MNE Floodlist.com [46] f
UN/ISDR [73] d
1
MKD Floodlist.com [46] f
Malevski [74] c
2
TUR EBSB [75] a
Haltas et al. [76] c
Uluatam [77] c
TAAB Database (Koç et al. [78]) a
New York Times [59] e
Kaymaz [79] c
Ballar [80] c
Gürer [81] c
35
Total events (1882–2021) = 132
Notes: * Country abbreviations: ALB: Albania, BIH: Bosnia and Herzegovina, BGR: Bulgaria, HRV: Croatia, CYP: Cyprus, EGY: Egypt, GRC: Greece, ISR: Israel, ITA: Italy, LBN: Lebanon, LBY: Libya, MKD: North Macedonia, TUR: Turkey, ** FE = flood event; *** FF = Flood Fatality, a country-level database; b country-level report; c country-specific scientific publication; d an international disaster report/database; e a press digital archive; f an international media organization.
Table 2. Comparison of the number of flash flood events per event magnitude of the current study against other international databases. It should be mentioned that the thresholds of event magnitudes were selected arbitrarily for illustrative purposes. Only flash flood events and flash flood-related fatalities are considered. Other flood types are excluded.
Event MagnitudeNumber of EventsThis StudyDifference (%)
DFO a10 fatalities416456%
≥20 fatalities192953%
≥50 fatalities71157%
≥100 fatalities330%
EM-DAT b≥10 fatalities7012579%
≥20 fatalities396772%
≥50 fatalities223350%
≥100 fatalities101660%
EPF c≥10 fatalities364628%
≥20 fatalities192216%
≥50 fatalities8913%
≥100 fatalities110%
FFEM-DB d≥10 fatalities384621%
≥20 fatalities121958%
≥50 fatalities48100%
≥100 fatalities01-
HANZE-E e≥10 fatalities596612%
≥20 fatalities303930%
≥50 fatalities141829%
≥100 fatalities8 *7 *−13% *
Notes: a refers to the common time period: 1985–2021/Countries: All; b refers to the common time period: 1900–2021/Countries: All. c Refers to the common time period: 1980–2015/Countries: ALB, BIH, BGR, HRV, CYP, GRC, ITA, MKD, TUR. d refers to the common time period: 1980–2020/Countries: GRE, ISR, ITA, TUR, CYP. e refers to the common time period: 1882–2016/Countries: BGR, HRV, CYP, GRC, ITA. * All 8 events included in the HANZE-E database are included in the present study. However, one of them (the FE of 1951) has been assigned to a different category since taking into account event-specific records that presented the number of FFs as being smaller than 100.
Table 3. Specifications for the classification of FEs according to flood impact magnitude (FI index)
ClassFFs NumberCorresponding PercentilesNumber of Observations
FI1—Low10–22Minimum—50th67
FI2—Moderate23–8250th–85th45
FI3—High>82>85th20
Table 4. Return periods of different categories of events in terms of flood impact magnitude (FI index) across the whole study area
Flood Impact Magnitude Class (FI Index)Return PeriodProbability of Occurrence
in a Single Year
FI11 event in 1.56 years0.641
FI21 event in 2.78 years0.360
FI31 event in 9.11 years0.110
Table 5. Return periods of different categories of events (FI index) for three geographical areas.
Flood Impact Magnitude Class (FI Index)Study Area Segmentation Return PeriodProbability of Occurrence in a Year
FI1Western1 event in 3.38 years0.296
Middle1 event in 6.61 years0.151
Eastern1 event in 3.5 years0.286
FI2Western1 event in 5.44 years0.184
Middle1 event in 11.81 years0.085
Eastern1 event in 5.43 years0.184
FI3Western1 event in 16.39 years0.061
Middle1 event in 40.38 years0.025
Eastern1 event in 15.31 years0.065
Disclaimer/Publisher’s Note: The statements, opinions and data contained in all publications are solely those of the individual author(s) and contributor(s) and not of MDPI and/or the editor(s). MDPI and/or the editor(s) disclaim responsibility for any injury to people or property resulting from any ideas, methods, instructions or products referred to in the content.