Topographic Effects on Stratiform Precipitation Observed by Vertically Pointing Micro Rain Radars at Ridge and Valley Sites in the Liupan Mountains Area, Northwest China
Abstract
:1. Introduction
2. Overview of the Liupan Mountains Area
3. Observations and Methods
4. Analysis and Results
4.1. Stratiform Precipitation Statistic Differences
4.2. Vertical Structures Comparisons
4.3. Solid Hydrometeors Frequency Discrepancies
4.4. Melting Layer Characteristics Comparisons
4.5. RSD below the BB Comparisons
5. Summary and Conclusions
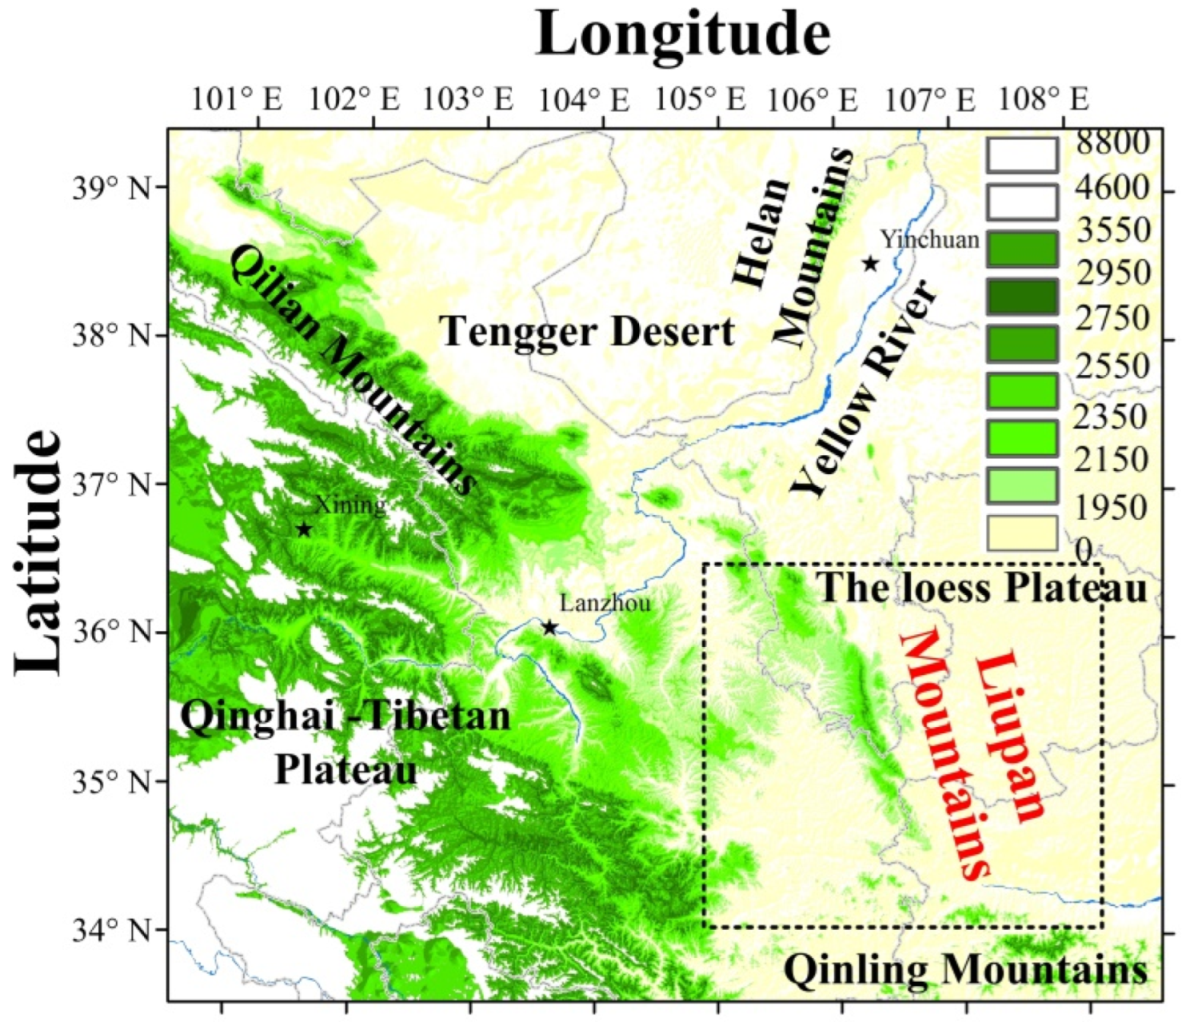
- The main weather systems causing precipitation in the Liupan Mountains area include 500 hPa westerly troughs and 700 hPa shear or low vortices, of which 500 hPa trough and 700 hPa shear systems account for 72% of all precipitation events, and 500 hPa trough and 700 hPa low vortex systems account for 17.1%. The movement of precipitating clouds in the Liupan Mountains area is mainly from southwest to northeast, accounting for 51.8% of the total, followed by northwest to southeast, accounting for 23.6%.
- Compared to the rainfall characteristics of two valley sites LD and DW, although the ridge site LPS has a lower percentage of stratiform rainfall, it has a larger percentage of convective and shallow rainfall as well as a larger proportion of the precipitation contribution and average precipitation intensity. The percentages of stratiform and convective precipitation were as large at LD as at DW, but the proportion of the precipitation amount and the average precipitation intensity at DW were slightly larger than those at LD.
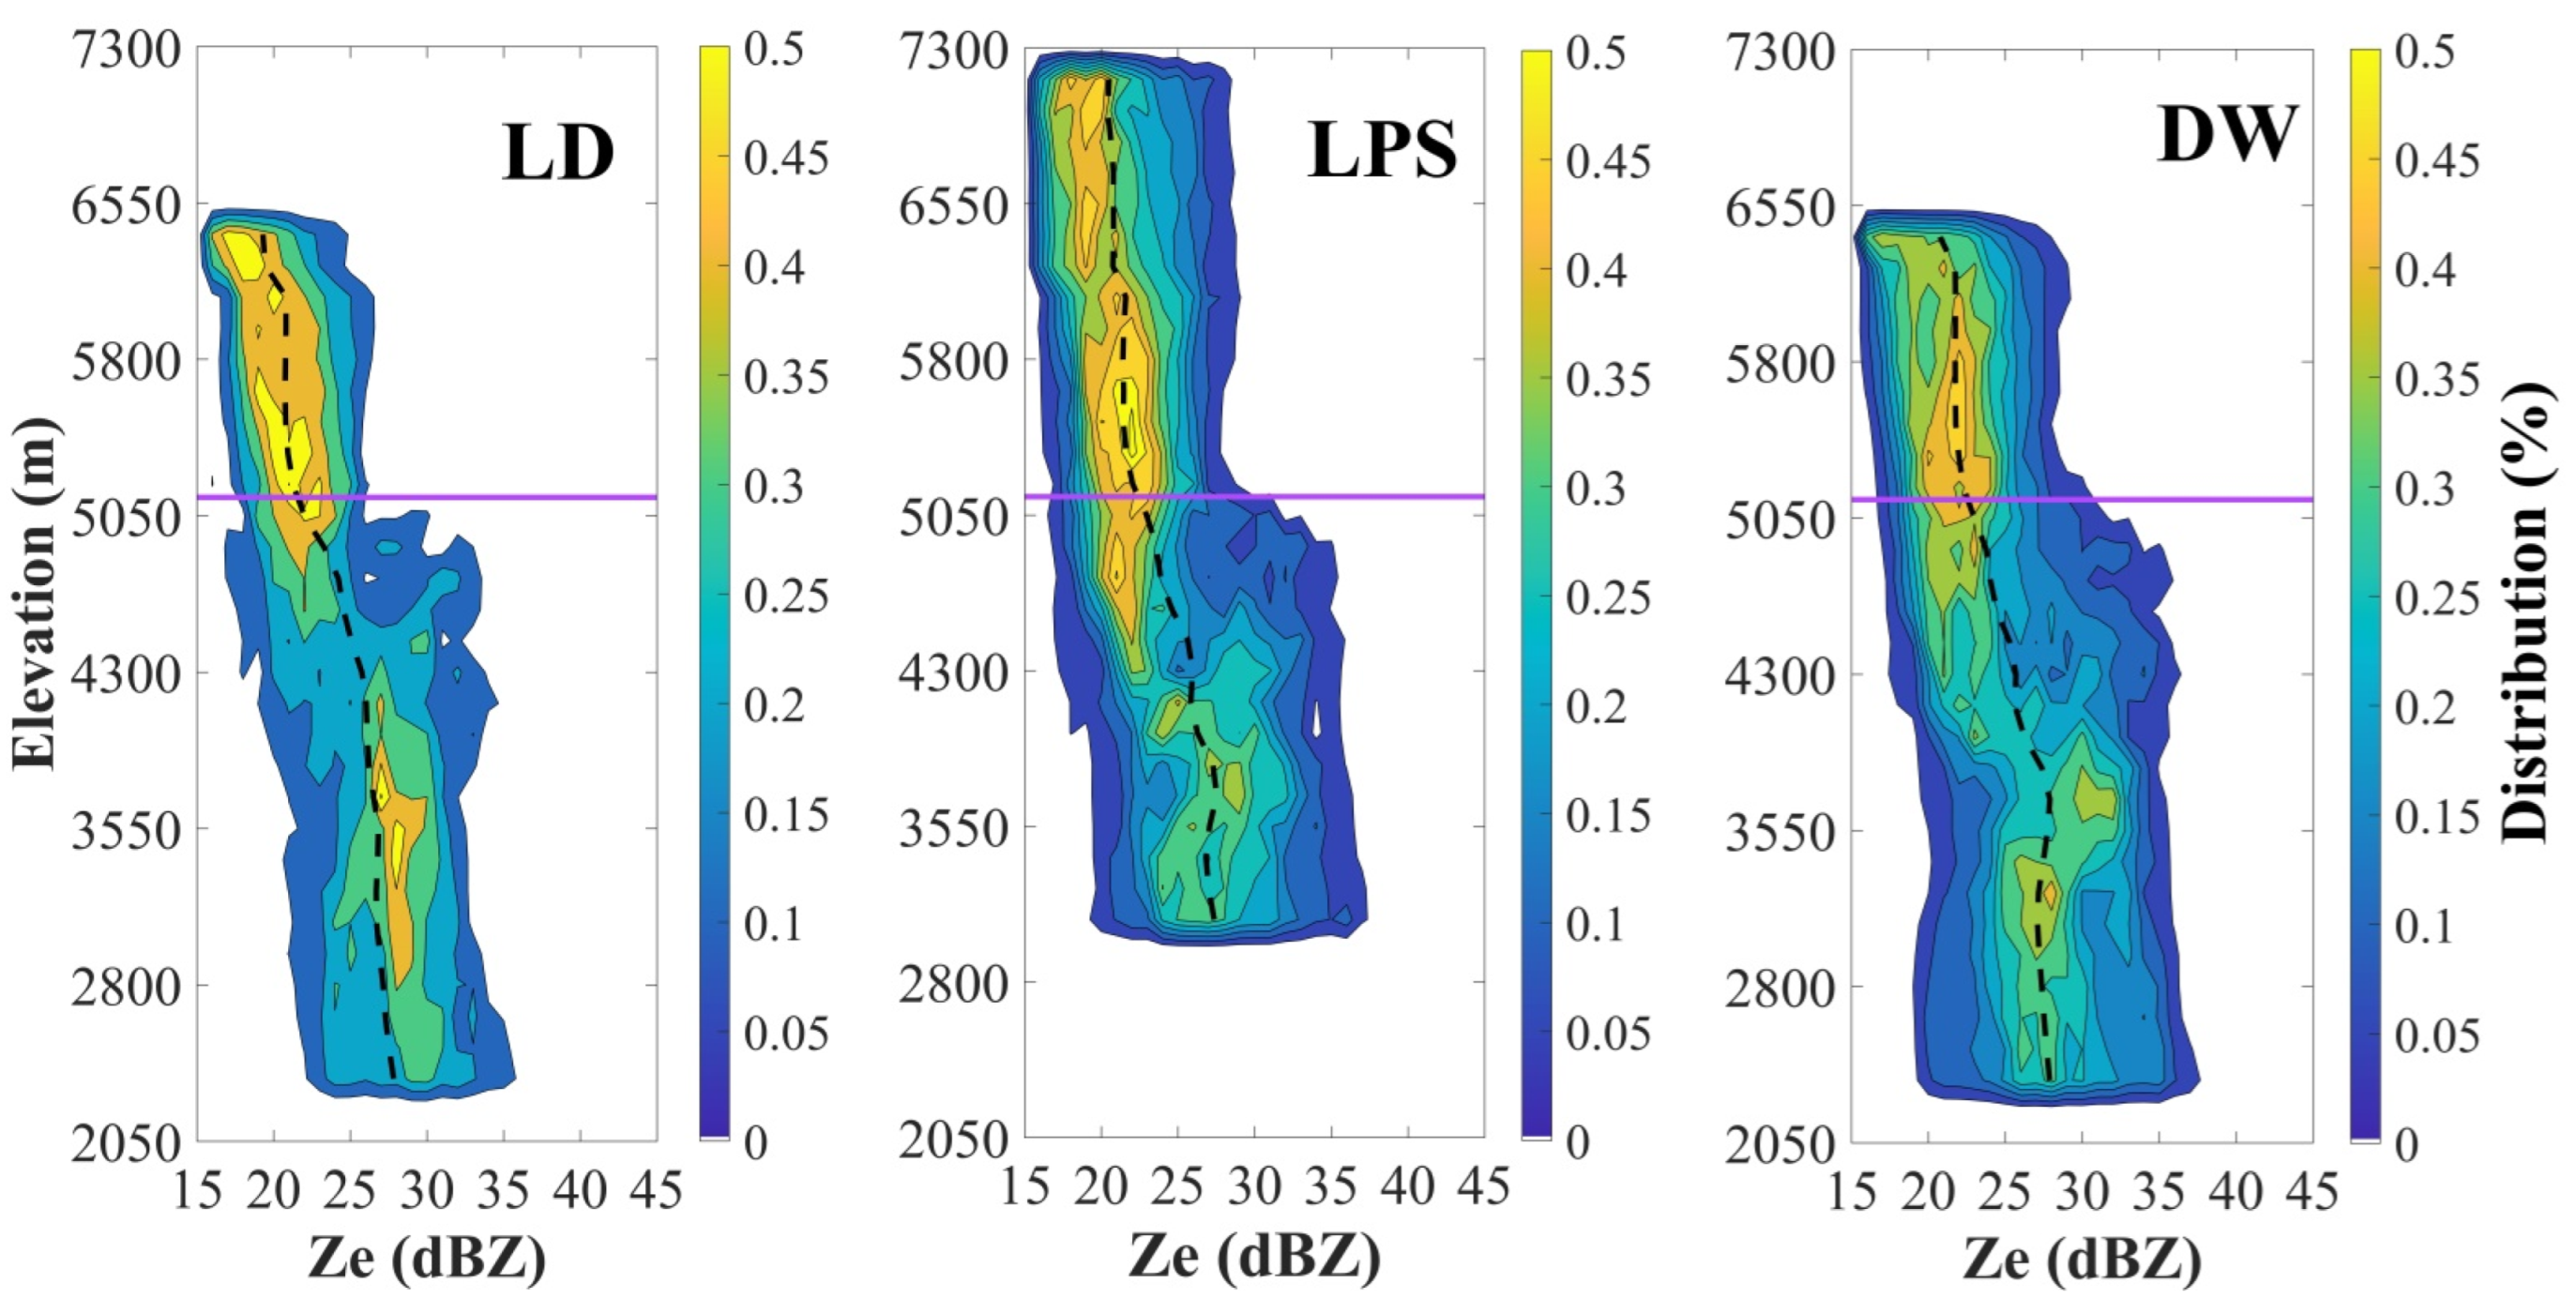
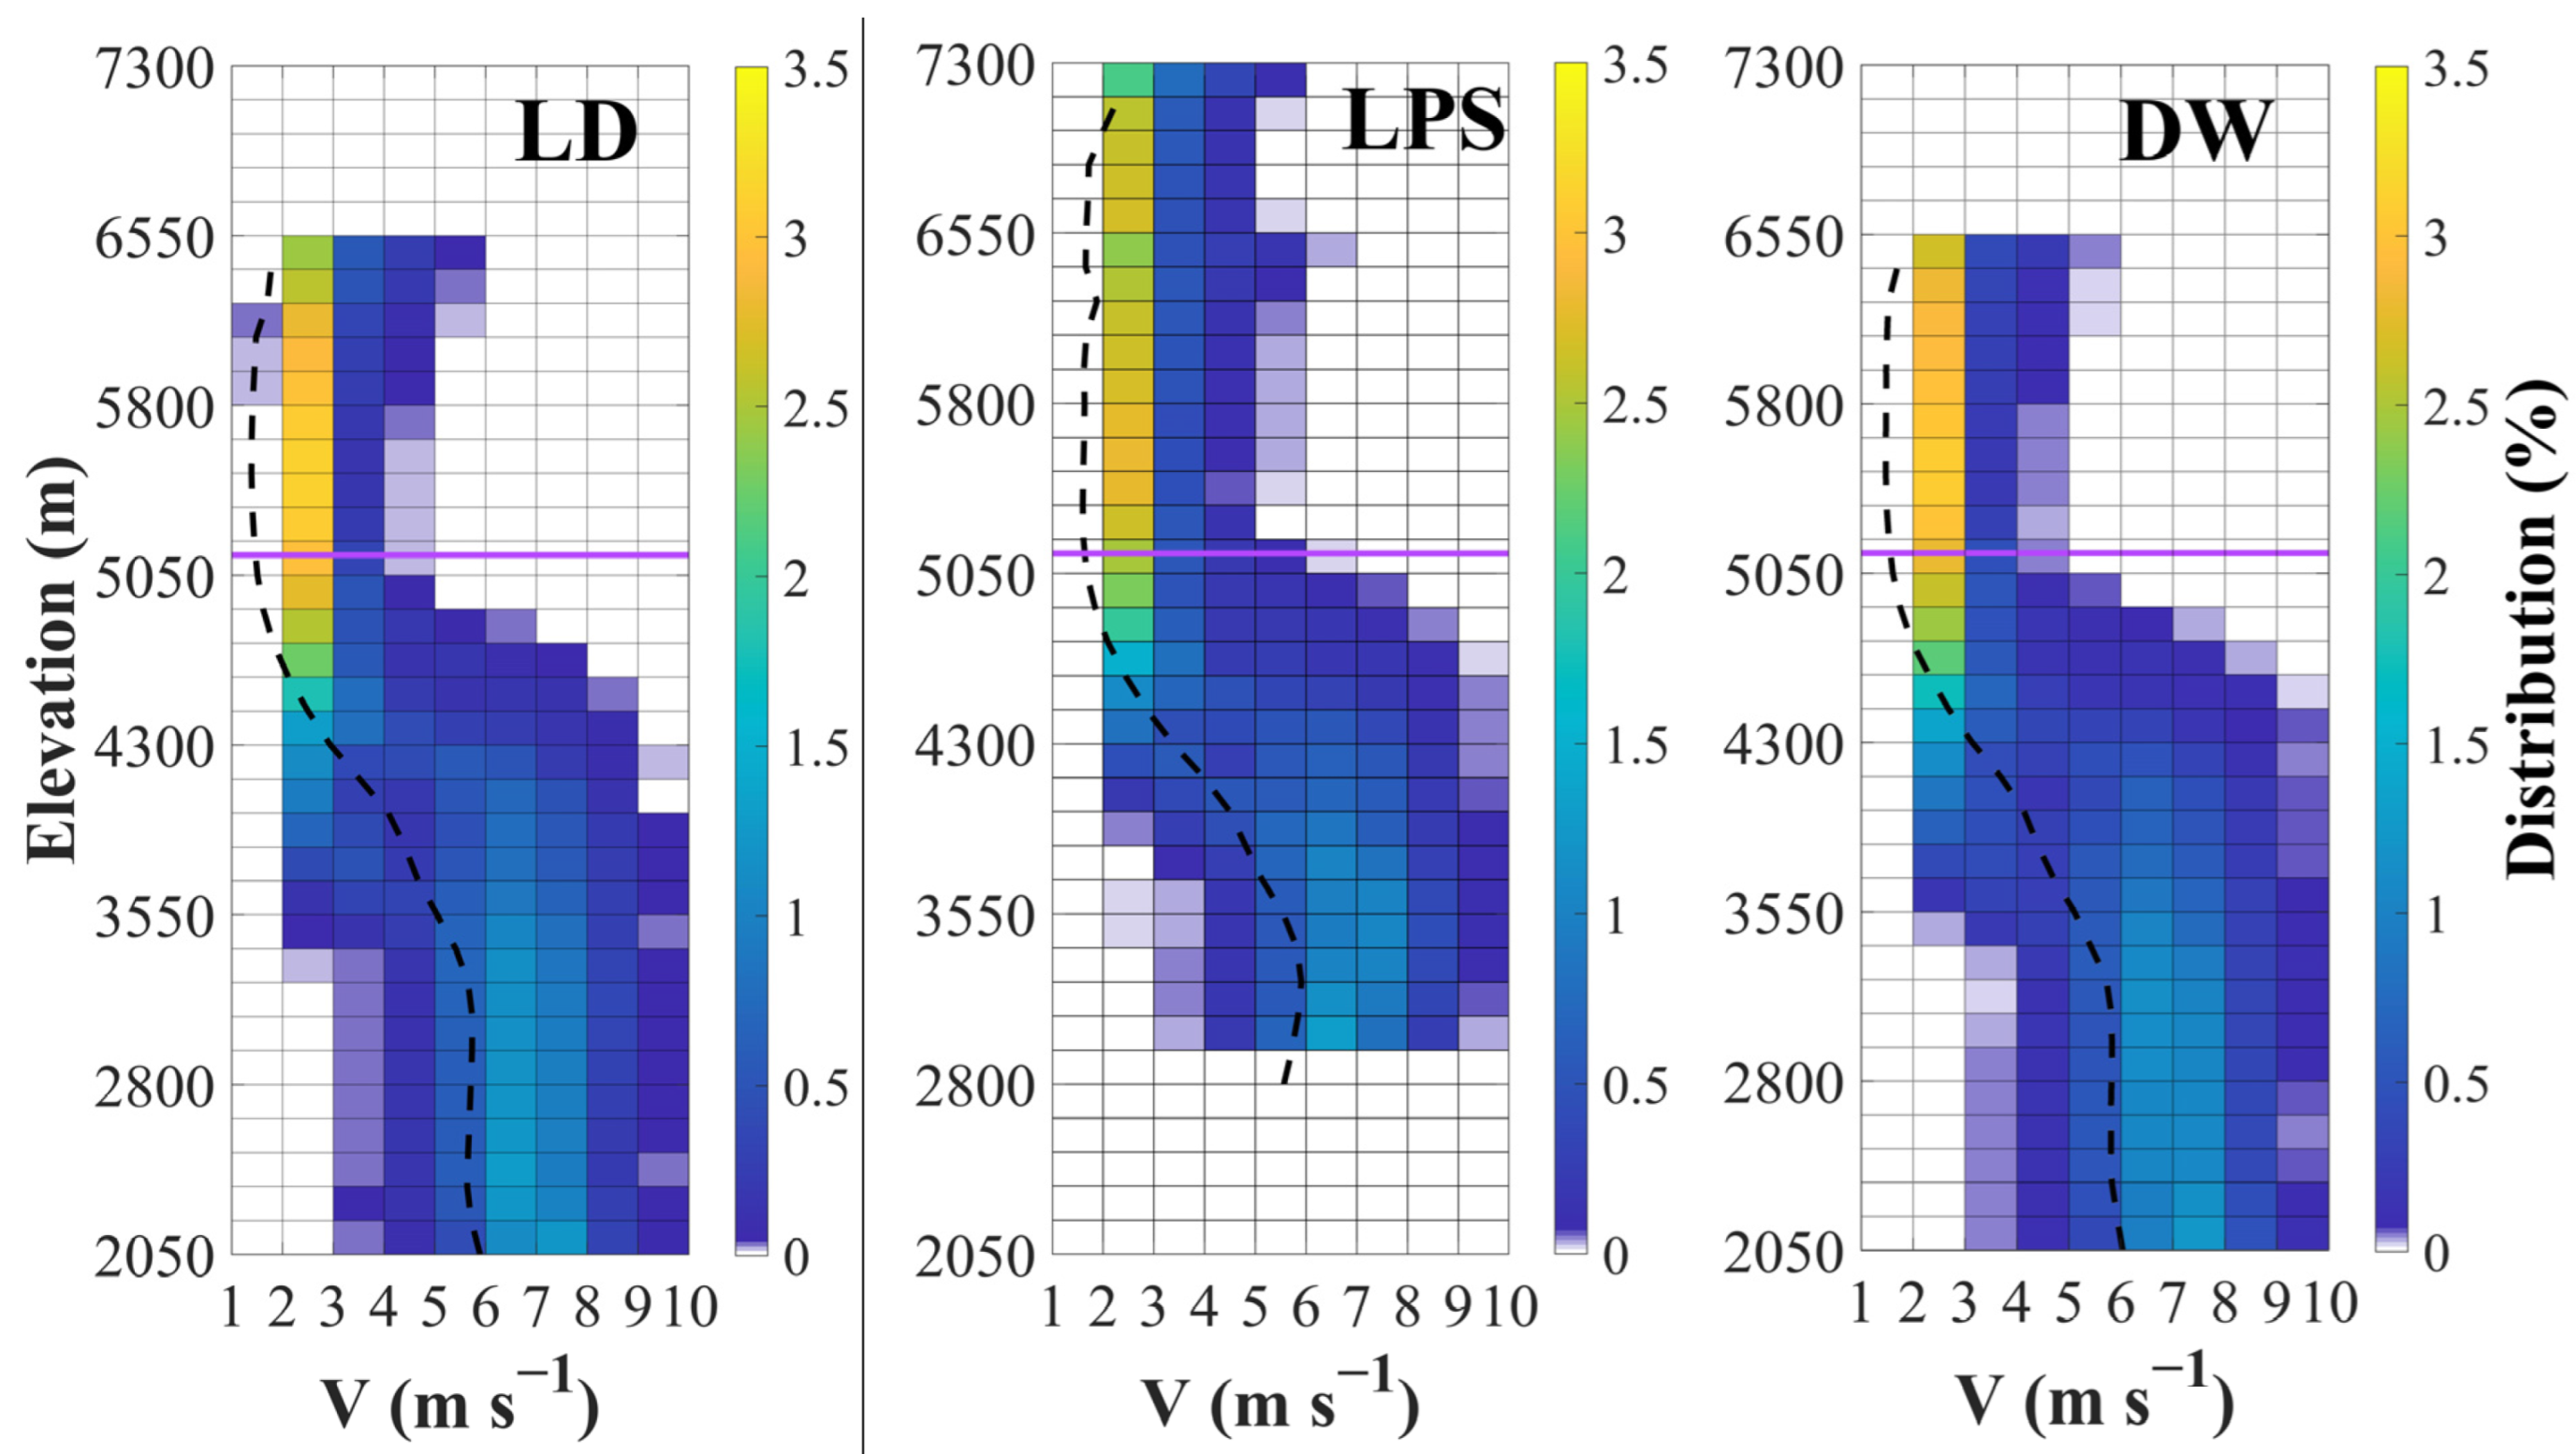
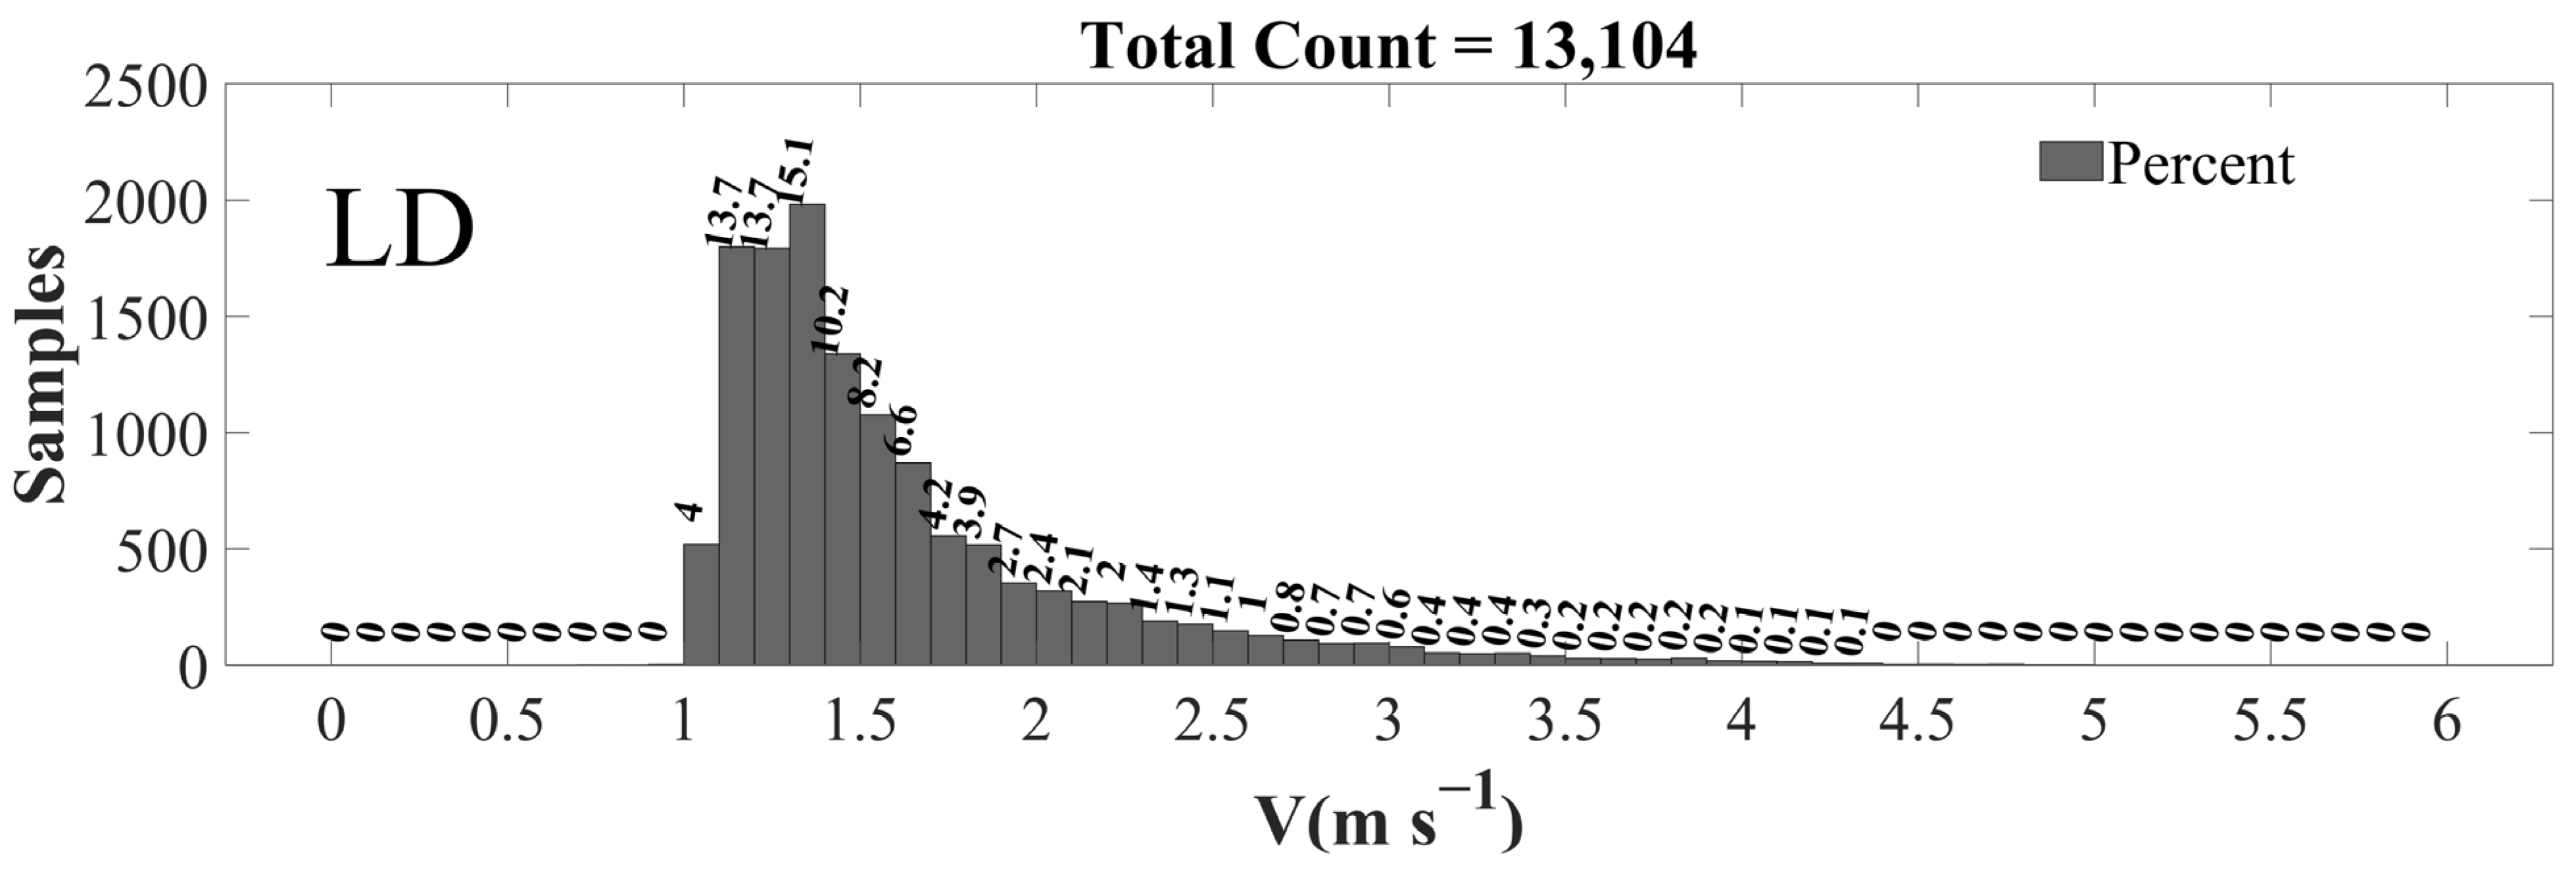
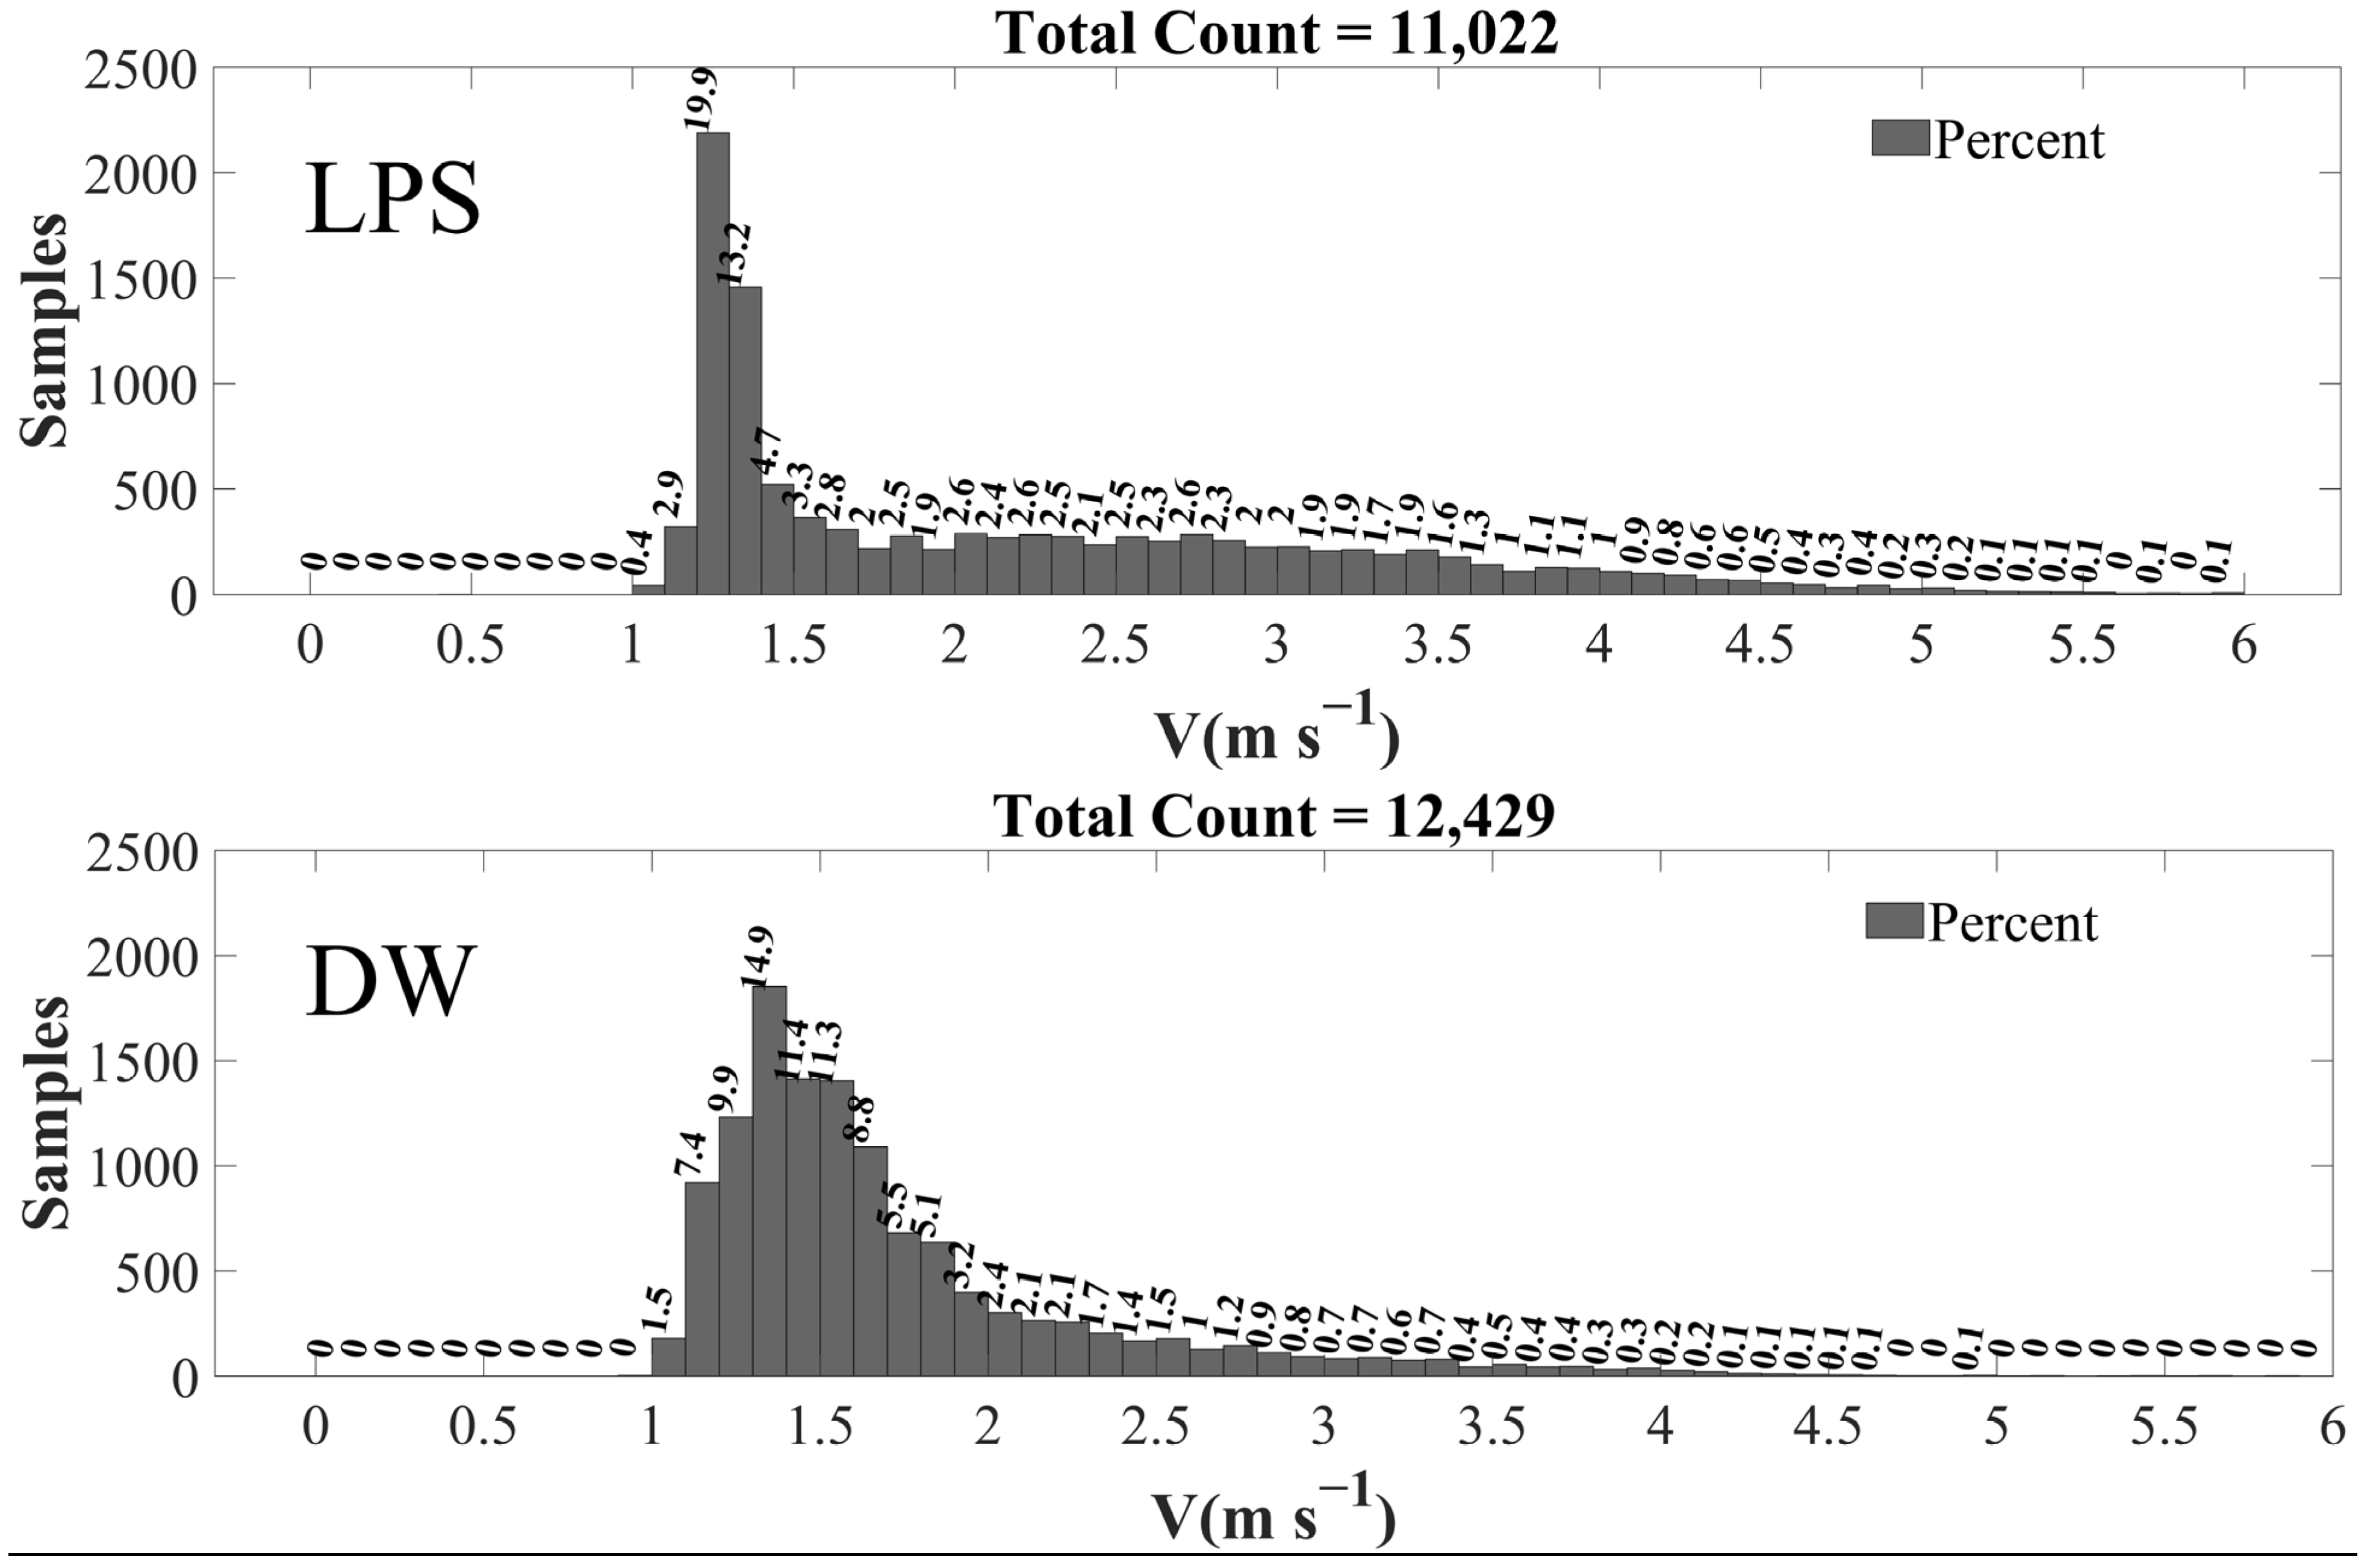
- At sub-0 °C, the average MRR-2 Ze at LD, LPS, and DW was 18.96 dBZ, 20.68 dBZ, and 20.86 dBZ, respectively. These circumstances were similar to those inside the melting layer, where the Ze(peak) at the west valley site was 29.8 dBZ, whilst it was 32.4 dBZ and 31.95 dBZ at the ridge east valley sites, respectively. This is because the cooling of saturated air and the resulting condensation by melting snow caused a rise in hydrometeor mass of 6% and, hence, an increase in reflectivity. On the other hand, the Vsnow and Vpeak at all three sites were about 1.68 m s−1 and 5.60 m s−1, but the Vrain at the ridge site (7.15 m s−1) was approximately 19% greater than at the two valley sites. A possible reason might be the deposition and aggregation efficiency and the degree of riming at the ridge and east valley sites were greater than at the west valley site.
- The solid hydrometeors above the sub-0 °C height were mainly snow particles and graupel, and the diameter and density of snow particles and graupel at the ridge and east valley sites were slightly larger than those at the west valley site; plus, there was also a higher occurrence frequency of larger graupel at the ridge site. The key factor causing these differences at the ridge site was the forced uplifting of cloudy air over the mountain area around the ridge site, which might have resulted in a topographic supercooling effect that led to enhanced riming of supercooled liquid water, implying the precipitation often comes from rather more “compact ice”.
- As a whole, the BB was thicker and the sharpness slightly weaker at the ridge site compared to those at the valley sites. The peak reflectivity itself was stronger at the ridge and east valley sites than at the west valley site. Specifically, the variability of these values was obviously larger at the valley sites than at the ridge site. The key factor causing these differences is supposed to be the discrepancies in snow particle densities at the three sites, which are related to, among others, the degree of riming [28]. Based on these results, it was found that the precipitable water vapor is relatively abundant at the ridge and east valley sites. Therefore, the cloud microphysical processes at the west valley site varied significantly from unrimed snow growth, which produced lower density and dimension solid particles, on the contrary, snow particle growth at the ridge and east valley sites tended to be affected by the riming process and the high-density snow particles. Another key factor is that the forced uplifting of cloudy air over the mountain area around the ridge site may play a part in the topographic supercooling that leads to enhanced riming of supercooled liquid water.
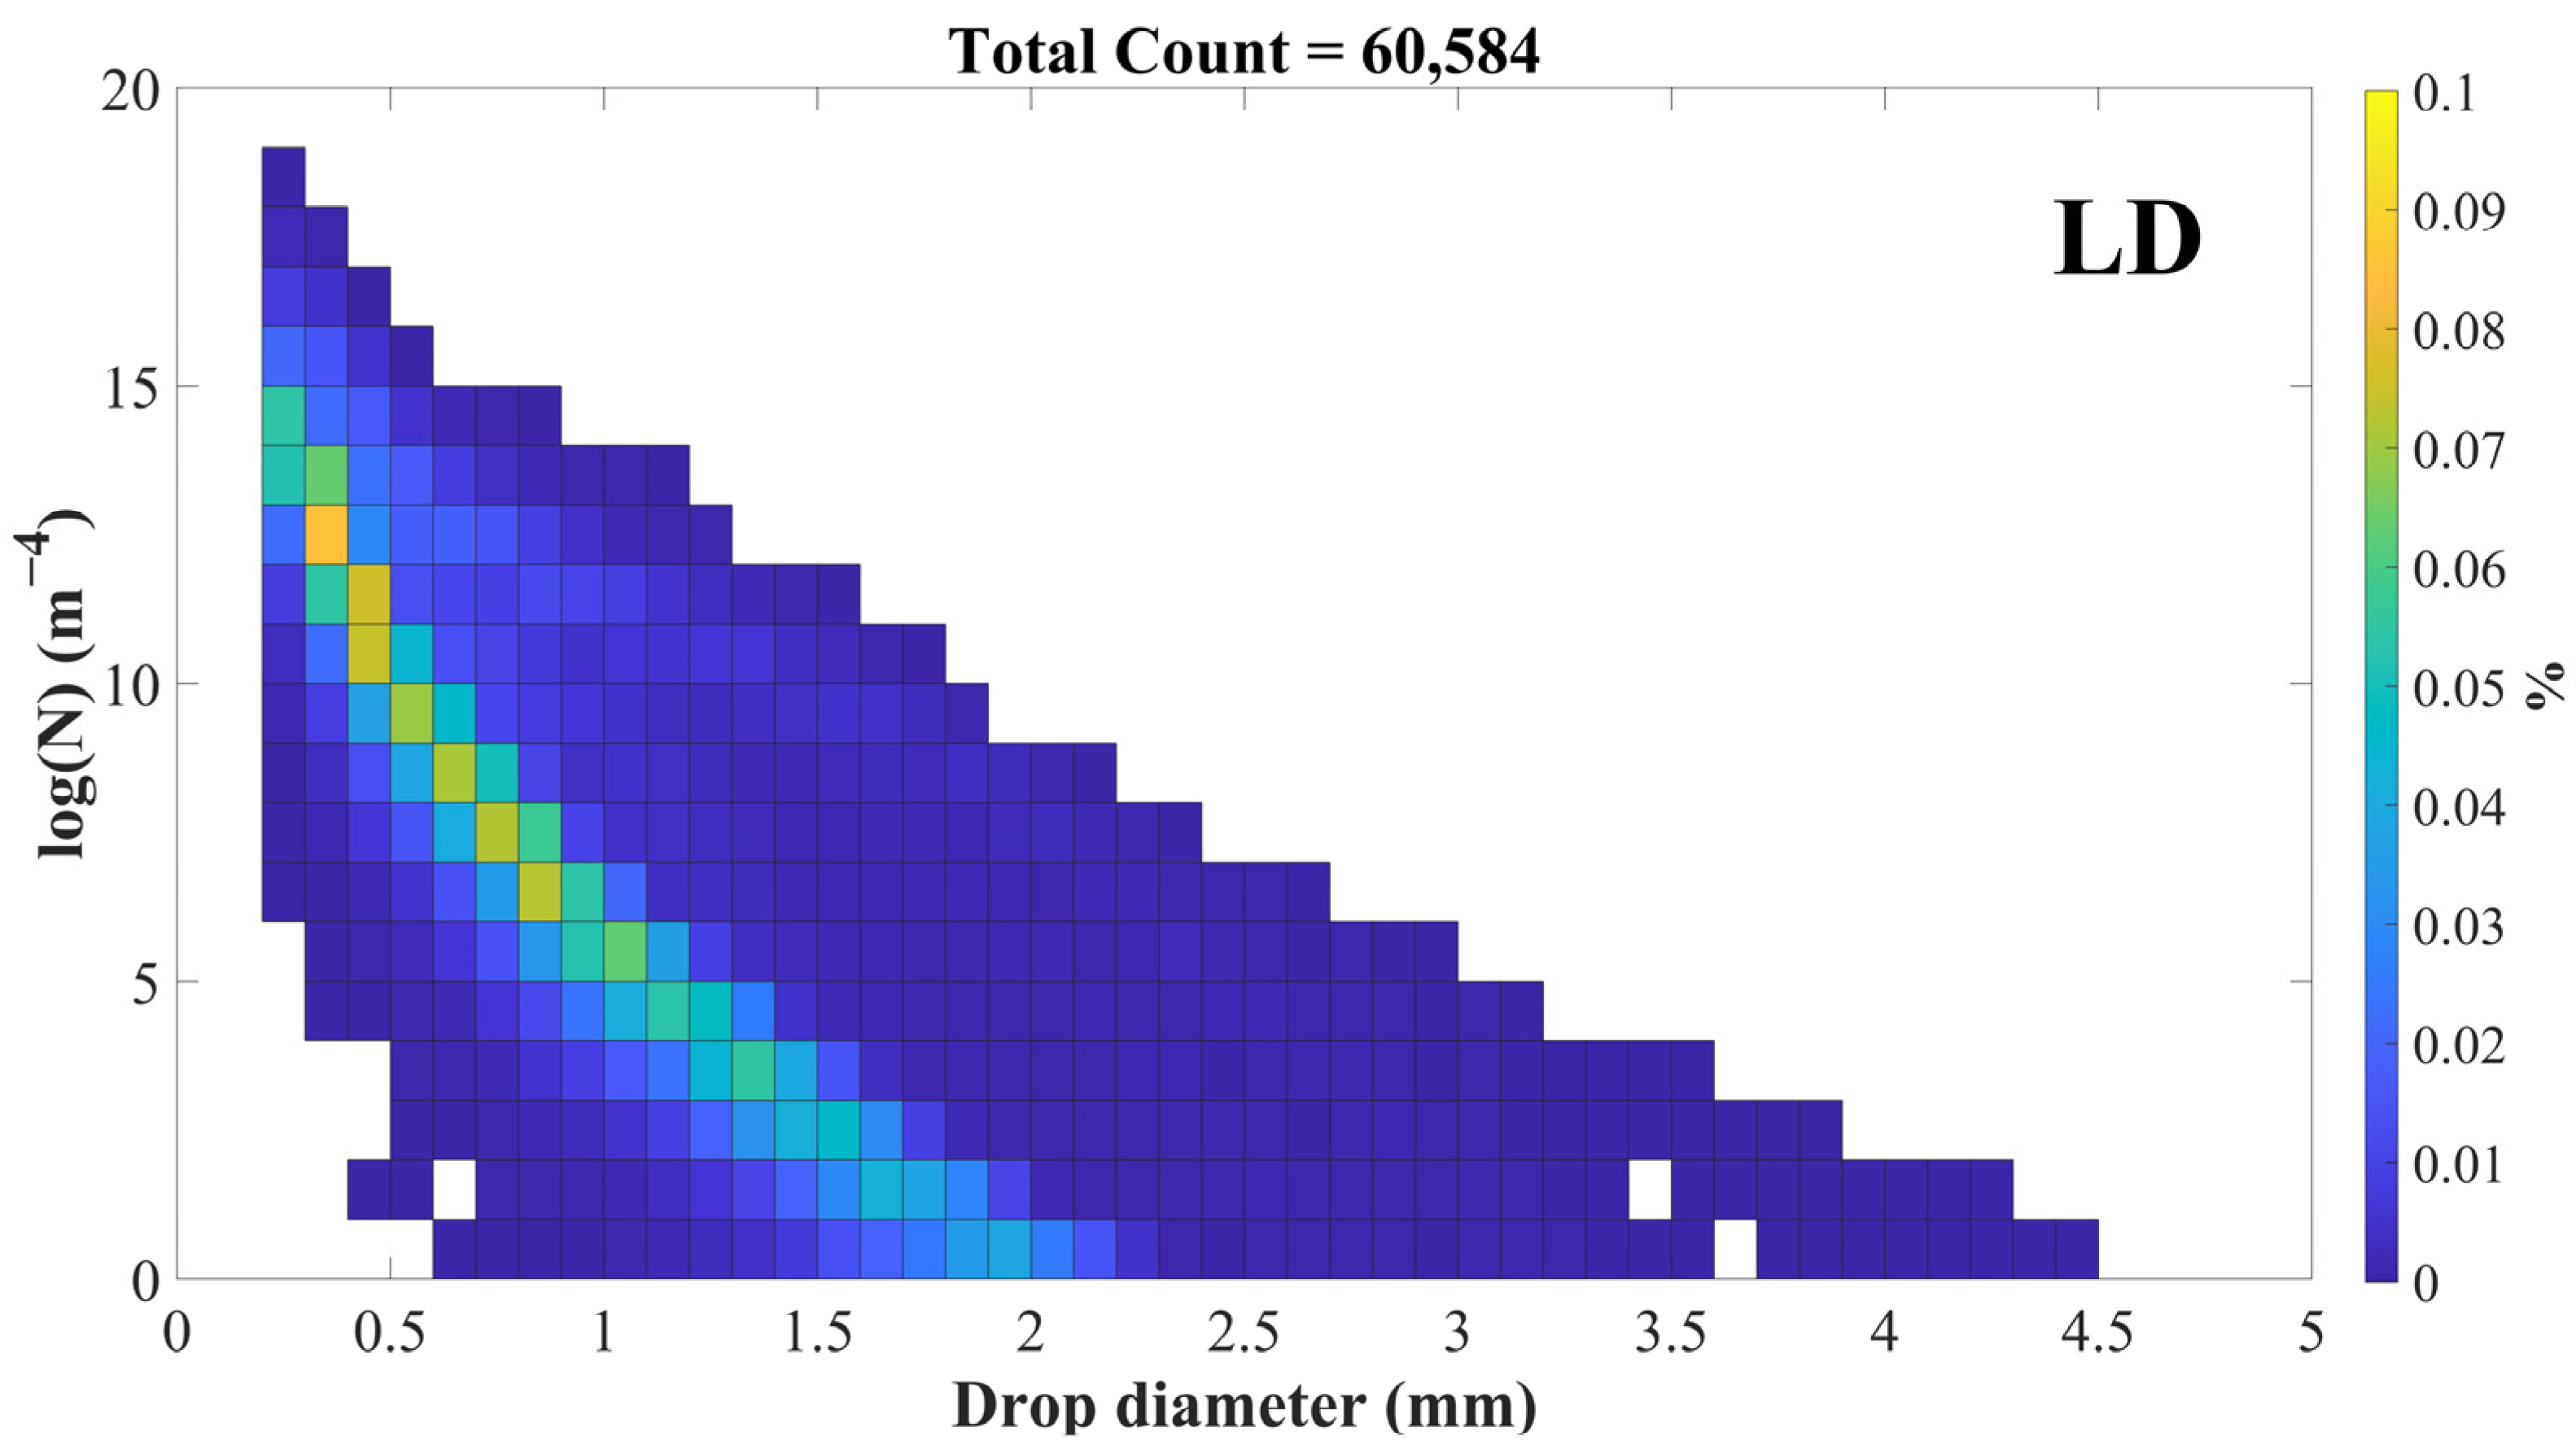
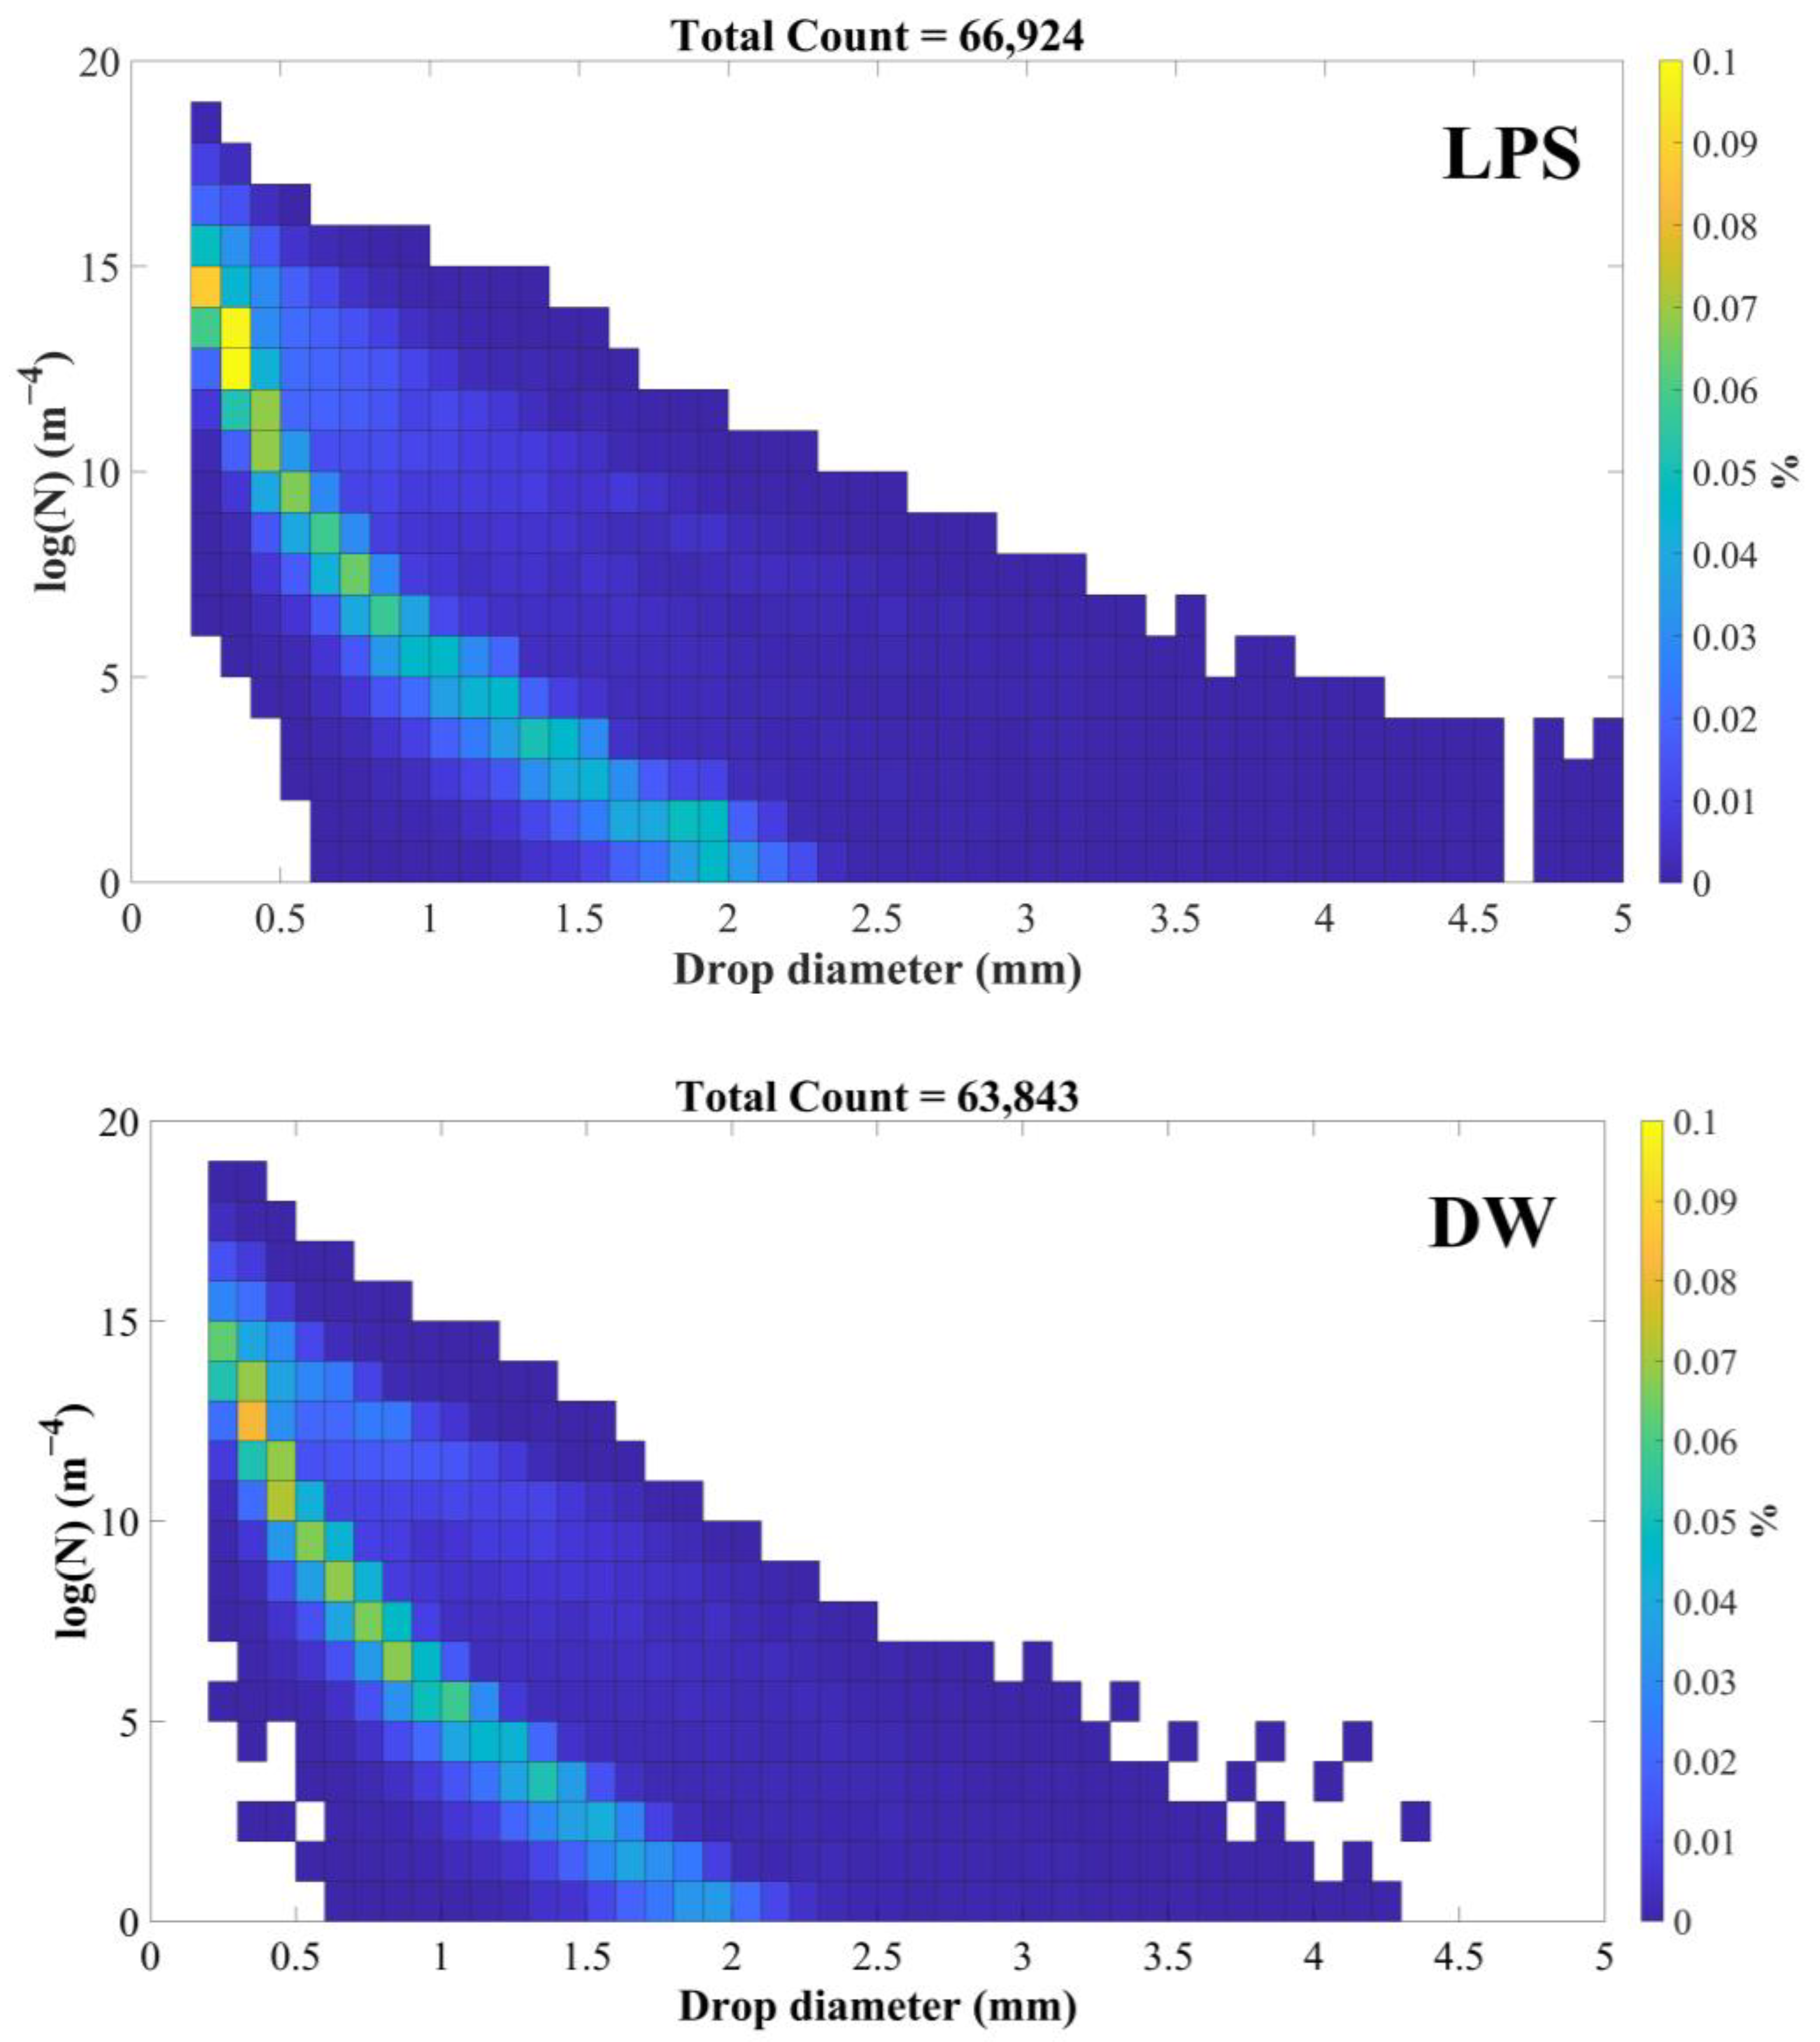
- For stratiform precipitation, the values of rainfall diameter below 2.5 mm were dominant, while the maximum value of log (N) reached 19. Compared with the two valley sites, the rainfall diameter was above 4.5 mm at the ridge site and showed relatively larger droplet sizes and log (N) values, which could reach 5.0 mm and 5, respectively.
Author Contributions
Funding
Institutional Review Board Statement
Informed Consent Statement
Data Availability Statement
Acknowledgments
Conflicts of Interest
References
- Houze, R.A., Jr. Orographic effects on precipitating clouds. Rev. Geophys. 2012, 50, RG1001. [Google Scholar] [CrossRef]
- Roe, G.H. Orographic precipitation. Annu. Rev. Earth Planet. Sci. 2005, 33, 645–671. [Google Scholar] [CrossRef]
- Colle, B.A.; Mass, C.F. High-Resolution Observations and Numerical Simulations of Easterly Gap Flow through the Strait of Juan de Fuca on 9–10 December 1995. Mon. Wea. Rev. 2000, 128, 2398–2422. [Google Scholar] [CrossRef]
- Wallace, J.M.; Peter, V. Hobbs. Atmospheric Science: An Introductory Survey. Bull. Am. Meteorol. Soc. 2016, 88, 504. [Google Scholar]
- Lundquist, J.D.; Minder, J.R.; Neiman, P.J.; Sukovich, E. Relationships between Barrier Jet Heights, Orographic Precipitation Gradients, and Streamflow in the Northern Sierra Nevada. J. Hydrometeorol. 2010, 11, 1141–1156. [Google Scholar] [CrossRef] [Green Version]
- Minder, J.R.; Durran, D.R.; Roe, G.H. Mesoscale Controls on the Mountainside Snow Line. J. Atmos. Sci. 2011, 68, 2107–2127. [Google Scholar] [CrossRef]
- Unterstrasser, S.; Zängl, G. Cooling by melting precipitation in Alpine valleys: An idealized numerical modelling study. Q. J. R. Meteorol. Soc. 2006, 132, 1489–1508. [Google Scholar] [CrossRef] [Green Version]
- Fabry, F.; Zawadzki, I. Long-term radar observations of the melting layer of precipitation and their interpretation. J. Atmos. Sci. 1995, 52, 838–851. [Google Scholar] [CrossRef]
- Cha, J.-W.; Chang, K.-H.; Yum, S.S.; Choi, Y.-J. Comparison of the bright band characteristics measured by Micro Rain Radar (MRR) at a mountain and a coastal site in South Korea. Adv. Atmos. Sci. 2009, 26, 211–221. [Google Scholar] [CrossRef]
- Wexler, R. An Evaluation of the Physical Effects in the Melting Layer. In Proceedings of the Fifth Weather Radar Conference, Fort Monmouth, NJ, USA; American Meteor Society: Geneseo, NY, USA, 1955; pp. 329–334. [Google Scholar]
- Smith, R.B. 100 Years of Progress on Mountain Meteorology Research. Meteorol. Monogr. 2019, 59. [Google Scholar] [CrossRef]
- Fabry, F. Radar Meteorology: Principles and Practice; Cambridge University Press: Cambridge, UK, 2015; pp. 66–68. [Google Scholar]
- Deng, P.; Sang, J.; Yang, M.; Mu, J.; Chang, Z.; Cao, N.; Yang, M. Analysis on the Difference Characteristics of Precipitation and Air Water Vapor Conditions on the East and West Slopes of Liupan Mountain in Recent 30 Years. Meteorol. Sci. Technol. 2021, 21, 77–85. (In Chinese) [Google Scholar]
- Peters, G.; Fischer, B.; Andersson, T. Rain observations with a vertically looking Micro Rain Radar (MRR). Boreal Environ. Res. 2002, 7, 353–362. [Google Scholar]
- Houze, R.A., Jr. Stratiform precipitation in regions of convection: A meteorological paradox? Bull. Am. Meteor. Soc. 1997, 78, 2179–2196. [Google Scholar] [CrossRef]
- Peters, G.; Fischer, B. Profiles of raindrop size distribution as retrieved by Micro rain Radars. Appl. Meteor. 2005, 44, 1930–1949. [Google Scholar] [CrossRef]
- Klaassen, W. Radar observations and simulations of the melting layer of precipitation. Atmos. Sci. 1988, 45, 3741–3753. [Google Scholar] [CrossRef]
- Wen, L.; Zhao, K.; Zhang, G.; Xue, M.; Zhou, B.; Liu, S.; Chen, X. Statistical characteristics of raindrop size distributions observed in East China during the Asian summer monsoon season using 2-D video disdrometer and Micro Rain Radar data. J. Geophys. Res. Atmos. 2016, 121, 2265–2282. [Google Scholar] [CrossRef] [Green Version]
- Tsai, C.-L.; Yu, C.-K. Inter comparison analysis for micro rain radar observations. Atmos. Sci. 2012, 40, 109–134. (In Chinese) [Google Scholar]
- Yuter, S.E.; Houze, R.A., Jr. Three-dimensional kinematic and microphysical evolution of Florida cumulonimbus. Part II: Frequency distributions of vertical velocity, reflectivity, and differential reflectivity. Mon. Weather Rev. 1995, 123, 1941–1963. [Google Scholar] [CrossRef]
- White, A.B.; Gottas, D.J.; Strem, E.T.; Ralph, F.M.; Neiman, P.J. An automated bright band height detection algorithm for use with Doppler radar spectral moments. J. Atmos. Ocean. Technol. 2002, 19, 687–697. [Google Scholar] [CrossRef]
- White, A.B.; Neiman, P.J.; Ralph, F.M.; Kingsmill, D.E.; Persson, P.G. Coastal orographic rainfall processes observed by radar during the California land-falling jets experiment. J. Hydrometeorol. 2003, 4, 264–282. [Google Scholar] [CrossRef]
- Strauch, R.G. Theory and Application of the FM-CW Doppler Radar. Ph.D. Dissertation, Electrical Engineering, University of Colorado, Denver, CO, USA, 1976; p. 97. [Google Scholar]
- Kneifel, S.; Maahn, M.; Peters, G.; Simmer, C. Observation of snowfall with a low-power FM-CW K-band radar (Micro Rain Radar). Meteorol. Atmos. Phys. 2011, 113, 75–87. [Google Scholar] [CrossRef] [Green Version]
- Maahn, M.; Kollias, P. Improved Micro Rain Radar snow measurements using Doppler spectra post-processing. Atmos. Meas. Tech. 2012, 5, 2661–2673. [Google Scholar] [CrossRef] [Green Version]
- Thurai, M.; Hanado, H. Melting layer model evaluation using fall velocity. IEE Proc. Microw. Antennas Propag. 2004, 151, 465–472. [Google Scholar] [CrossRef]
- Nakaya, U.; Terada, T., Jr. Simultaneous observations of the mass, falling velocity and form of individual snow crystals. J. Fac. Sci. Hokkaido Imp. Univ. Ser. 2 Phys. 1935, 1, 191–200. [Google Scholar]
- Zawadzki, I.; Szyrmer, W.; Bell, C.; Fabry, F. Modeling of the melting layer. Part III: The density effect. J. Atmos. Sci. 2005, 62, 3705–3723. [Google Scholar] [CrossRef]
- Chen, Y.; An, J.; Liu, H.; Duan, J. An observational study on vertical raindrop size distributions during stratiform rain in a semiarid plateau climate zone. Atmos. Ocean. Sci. Lett. 2016, 9, 178–184. [Google Scholar] [CrossRef] [Green Version]
- Chen, Y.; Duan, J.; An, J.; Liu, H. Raindrop Size Distribution Characteristics for Tropical Cyclones and Meiyu-Baiu Fronts Impacting Tokyo, Japan. Atmosphere 2019, 10, 391. [Google Scholar] [CrossRef] [Green Version]
- Wang, H.; Wang, W.; Wang, J.; Gong, D.; Zhang, D.; Zhang, L.; Zhang, Q. Rainfall microphysical properties of landfalling Typhoon Yagi (201814) based on the observations of micro rain radar and cloud radar in Shandong, China. Adv. Atmos. Sci. 2021, 38, 994–1011. [Google Scholar] [CrossRef]
- Garcia-Benadi, A.; Bech, J.; Gonzalez, S.; Udina, M.; Codina, B.; Georgis, J.-F. Precipitation Type Classification of Micro Rain Radar Data Using an Improved Doppler Spectral Processing Methodology. Remote Sens. 2020, 12, 4113. [Google Scholar] [CrossRef]

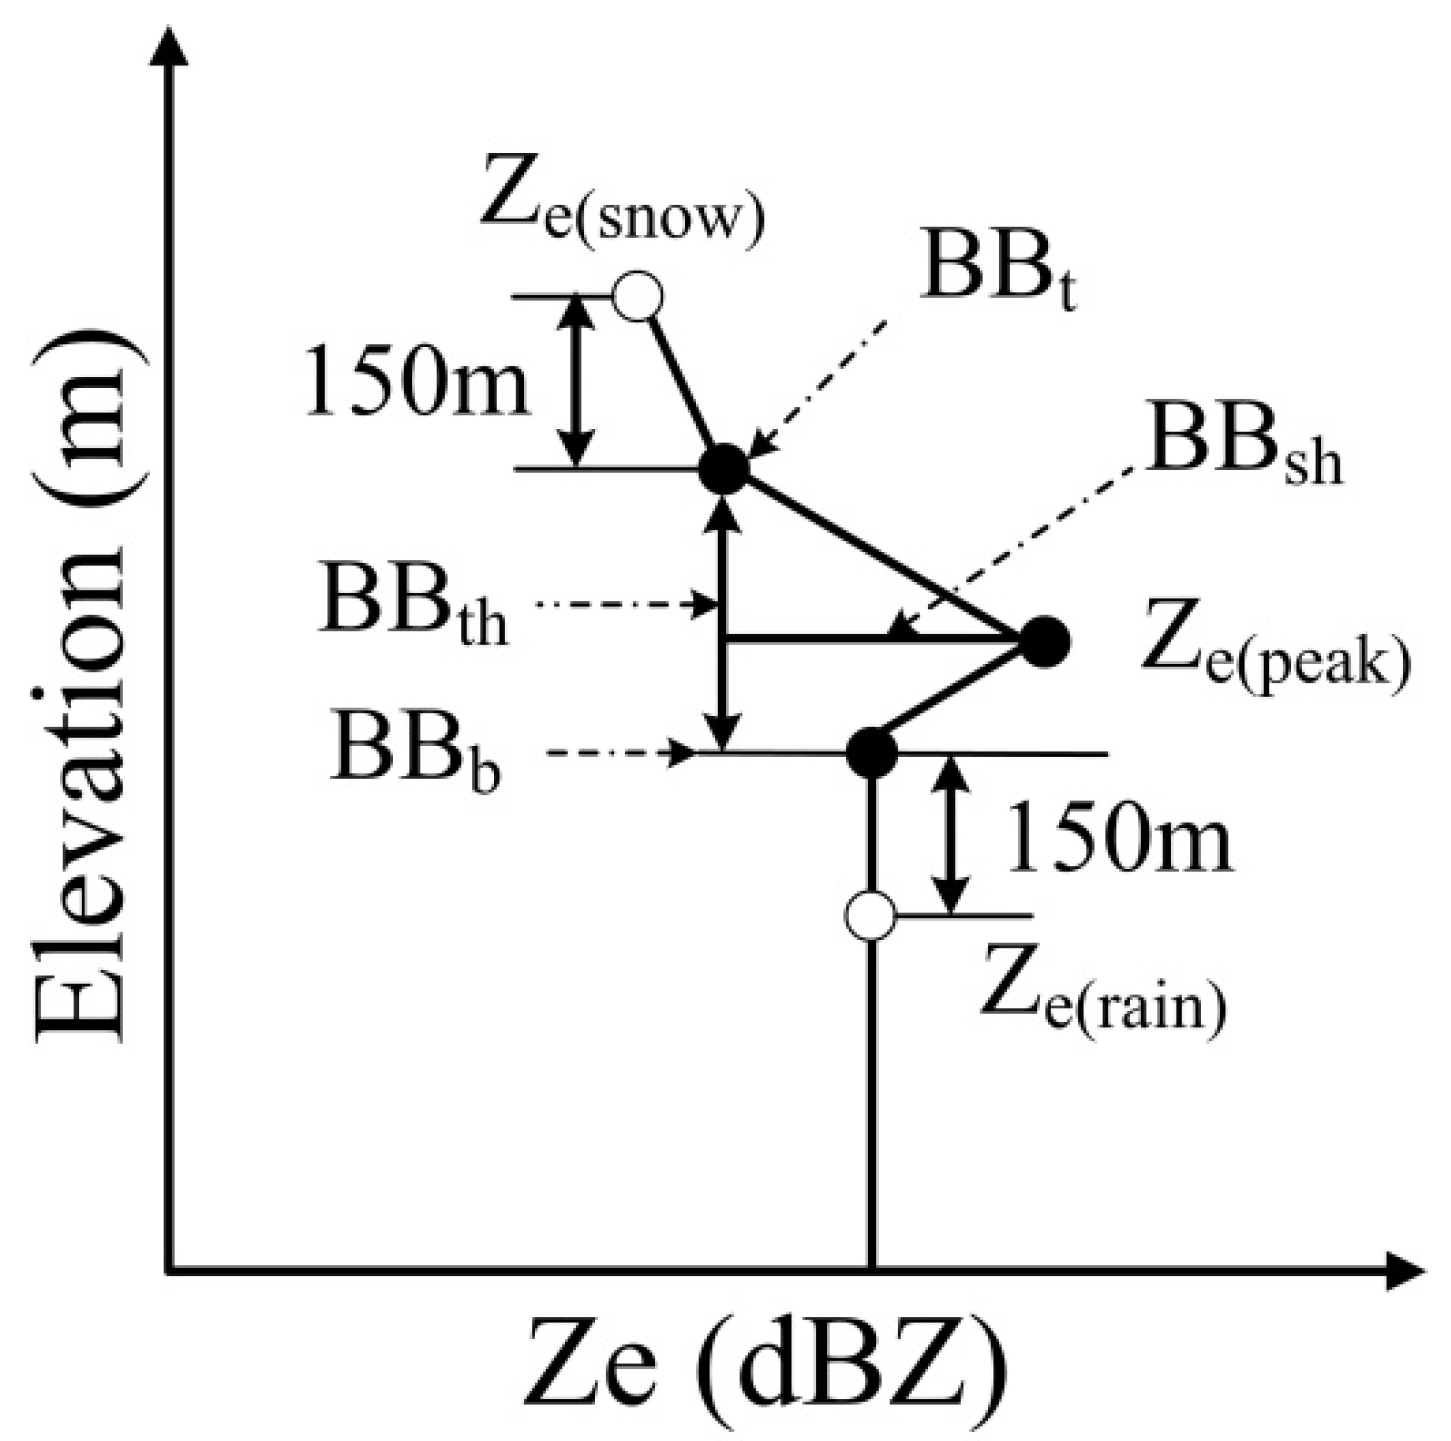


| Station | BBt * | BBb * | Ze(snow) | Ze(peak) | Ze(rain) | Rpeak | BBsh | BBth | Vsnow | Vrain | Vpeak | Vsnow/Vrain |
|---|---|---|---|---|---|---|---|---|---|---|---|---|
| LD | 4628 | 4108 | 19.60 | 29.28 | 25.18 | 0.53 | 2.790 | 520.5 | 1.68 | 5.92 | 5.41 | 0.30 |
| LPS | 4548 | 4018 | 21.35 | 32.41 | 30.43 | 0.54 | 2.645 | 529.8 | 1.63 | 7.15 | 5.59 | 0.22 |
| DW | 4680 | 4142 | 23.96 | 31.95 | 25.88 | 0.54 | 2.662 | 538.4 | 1.68 | 5.83 | 5.65 | 0.38 |
Disclaimer/Publisher’s Note: The statements, opinions and data contained in all publications are solely those of the individual author(s) and contributor(s) and not of MDPI and/or the editor(s). MDPI and/or the editor(s) disclaim responsibility for any injury to people or property resulting from any ideas, methods, instructions or products referred to in the content. |
© 2022 by the authors. Licensee MDPI, Basel, Switzerland. This article is an open access article distributed under the terms and conditions of the Creative Commons Attribution (CC BY) license (https://creativecommons.org/licenses/by/4.0/).
Share and Cite
Cao, N.; Yao, Z.; Shu, Z.; Chang, Z.; Mu, J.; Zhu, H.; Lin, T. Topographic Effects on Stratiform Precipitation Observed by Vertically Pointing Micro Rain Radars at Ridge and Valley Sites in the Liupan Mountains Area, Northwest China. Water 2023, 15, 134. https://doi.org/10.3390/w15010134
Cao N, Yao Z, Shu Z, Chang Z, Mu J, Zhu H, Lin T. Topographic Effects on Stratiform Precipitation Observed by Vertically Pointing Micro Rain Radars at Ridge and Valley Sites in the Liupan Mountains Area, Northwest China. Water. 2023; 15(1):134. https://doi.org/10.3390/w15010134
Chicago/Turabian StyleCao, Ning, Zhanyu Yao, Zhiliang Shu, Zhuolin Chang, Jianhua Mu, Haoran Zhu, and Tong Lin. 2023. "Topographic Effects on Stratiform Precipitation Observed by Vertically Pointing Micro Rain Radars at Ridge and Valley Sites in the Liupan Mountains Area, Northwest China" Water 15, no. 1: 134. https://doi.org/10.3390/w15010134
APA StyleCao, N., Yao, Z., Shu, Z., Chang, Z., Mu, J., Zhu, H., & Lin, T. (2023). Topographic Effects on Stratiform Precipitation Observed by Vertically Pointing Micro Rain Radars at Ridge and Valley Sites in the Liupan Mountains Area, Northwest China. Water, 15(1), 134. https://doi.org/10.3390/w15010134


