Article

Experimental Investigation of the Coupling Effect of Jackup Offshore Platforms, Towers, and Seabed Foundations under Waves of Large Wave Height

1
Beijing Special Engineering Design and Research Institute, Beijing 100028, China
2
College of Engineering and Technology, China University of Geosciences (Beijing), Beijing 100083, China
*
Author to whom correspondence should be addressed.
Water 2023, 15(1), 24; https://doi.org/10.3390/w15010024
Submission received: 22 November 2022 / Revised: 15 December 2022 / Accepted: 16 December 2022 / Published: 21 December 2022

Abstract

:
A large number of jackup offshore platforms with towers are widely applied in ocean engineering. The dynamic response of the platforms to waves of large wave height is critical, as such waves may cause platform accidents, property damage, and casualties. Therefore, it is important to investigate the coupling effect of jackup offshore platform, towers and seabed foundations under waves of large wave height. In this study, the coupling effect of offshore platforms, tower structures, and seabed foundations under the impact of waves of large wave height was studied via a physical flume model test. The experimental results show that the impact of waves of large wave height on the platforms is significant when the wave is blocked by the platform surface as the water body gathers under the platform surface, causing a pile group effect that results in the onshore piles being subjected to larger pressures than the front ones. The combined action of wave impact and pile leg squeezing force leads to an increase in the pore pressure of the foundation bed near the pile leg, and the soil near the pile leg becomes soft, revealing the mechanism of instability of the offshore platform’s pile foundation under waves of large wave height. The acceleration of the longitudinal movement of the platform increases under waves of large wave height, and the vortex-induced vibration of the platform includes the vibration along the direction of the wave and perpendicular to it. A coupled vibration effect between the tower structure and the platform occurs under waves of large wave height, reducing the vibration of the platform itself. Furthermore, damping members are installed on the tower structure, greatly reducing the natural vibration period and the motion response of the tower structure. This study provides significant enlightenment for the design of offshore platforms with towers to protect against waves of large wave height.

1. Introduction

A large number of large-scale offshore structures have been applied in ocean engineering, such as fixed offshore oil platforms, offshore wind turbines, and jackup offshore platforms, which are used in oil drilling, satellite launches, offshore power generation, and other engineering fields [1]. Because of the particularity of the service environment, these structures often have the characteristics of deep water, rapid current, and large wave height in the sea area, posing great challenges for the long-term safe service of jackup offshore platforms. This paper focuses on the pressing issue of the dynamic response of a jackup offshore platform under waves of large wave height of extreme condition during the entire life of the structure.
Past studies have revealed several considerations for the proper design of such offshore structures, such as the generation of both horizontal and uplift loads on elevated structures [2], the generation of significant overturning moment [3], and the concentration of the uplift demand in offshore platforms with towers [4]. Moreover, it was found that the interaction of waves directly with the platform’s structure reduces its strength or stiffness, and that waves change the properties of the seabed soil, weakening the foundation and decreasing the lateral soil resistance [5]. Therefore, in the process of analyzing the response of offshore structures under waves, both the response of the structure and the impact of the seabed soil around the structure on the overall stability of the structure under waves should be considered.
In recent years, many researchers have carried out numerous numerical and experimental studies to analyze the dynamic response of offshore jacket structures. For instance, Sunder and Connor [6] and Mostafa and Naggar [7] used parametric studies to investigate the response of offshore platforms under extreme wave and current loads. Elshafey et al. [8] theoretically and experimentally designed a scale model to investigate the dynamic response of an offshore jacket platform under random wave loads. Golafshani et al. [9] presented a probabilistic incremental wave analysis (PIWA) in order to assess the performance of offshore jacket platforms under extreme waves. Hezarjaribi et al. [10] examined the nonlinear response of jacket-type platforms against extreme waves via sensitivity analyses. Zhang et al. [11] developed a three-dimensional integrated numerical model that included wave and seabed sub-models to investigate the problem of wave–seabed–pile foundation platform system interactions. Zhang et al. [12] used a physical model experiment to study the dynamic characteristics of an offshore electrical platform under the combined actions of wind, waves, and currents. Xie et al. [13] carried out model experiments for single-pile legs and three-pile legs, and they investigated the hydrodynamic characteristics of three truss-type legs of a jackup offshore platform. Liu et al. [14] addressed a general analytical framework of wave run-up on an offshore jacket platform through a numerical wave tank that was designed based on the VOF model, and then they presented and verified the wave elevation level, the wave run-up height, and the wave impact forces.
In addition, many researchers have investigated the vibration control problem for offshore platforms that are subjected to waves. For example, some researchers presented control strategies or damping isolation systems to control the vibration of a steel jacket offshore platform [15,16], while others proposed damper-based methods to reduce the displacement response of the platform [17,18,19]. However, those control strategies or damper-based methods were not optimal in terms of their economic control costs or their effects; hence, more advanced optimization measures are needed for future studies.
In order to reveal the dynamic response law of seabed soil around pile foundations under the action of waves and currents, scholars have conducted a great deal of research on this problem. For example, Li et al. [20] found that the cumulative pore water pressure at the bottom of pile foundations tended to increase, according to numerical analysis. Qi and Gao [21] found that the local scour was correlated with the seabed response to a certain extent, according to the results of an indoor flume experiment, and the upward osmotic force caused by wave flow at the trough position could make seabed soil more prone to local scour. Zhang et al. [11] studied the oscillatory response of seabed soil around pile groups by combining a FLOW3D wave model and a COMSOL seabed model. Lin et al. [22] established a numerical wave-structure elastic seabed interaction model using the OpenFOAM platform by coupling a waves2Foam [23,24] wave model with a minigeotechfoam [25,26,27] seabed model. The transient response around a single pile under nonlinear wave action was studied using this model. It was found that the wave-induced pore water pressure amplitude decreases with the increase in pile depth, but the pore water pressure distribution pattern is similar. Yuan et al. [28] performed flume experiments to study the excess pore pressure distribution around a mat foundation at a scale considering the true load state, by recording wave profiles and pore pressures in a sandy seabed. Ye et al. [29,30] and Jeng et al. [31] proposed another, more advanced numerical coupling model (FSSI-CAS-2D/3D) for FSSI problems. Recently, it evolved into FSSI-CAS [32]. Ye et al. [33,34] developed the coupling model OlaFlow-ABAQUS for fluid–structure–seabed interaction (FSSI) problems, which was used by Ye et al. [35] to explore the dynamic response characteristics of a jackup offshore platform and its seabed foundation. Cui et al. [36] presented a three-dimensional numerical model to analyze the FSSI around a fixed GBS offshore platform, based on the VARANS equations and Biot’s consolidation equations.
Although those investigations on the dynamic response of the jacket platform and the seabed subjected to wave loads have been validated, both physical and numerical models have raised the awareness of approaches to the design of offshore jacket platform structures. However, research on the coupling response and stability control among jackup offshore platforms, towers, and seabed foundations under waves of large wave height has not been reported. In this study, flume model experiments were carried out to investigate the dynamic response of jackup offshore platforms under different levels of wave action, in order to investigate the dynamic responses of offshore platforms, pylons, and their seabeds under the impact of waves. The related understanding from the experiment results could provide significant enlightenment for the design, construction, operation, and assessment of this type of offshore platform; it also provides an important basis for the reliability of numerical simulations of sea launch platforms.

2. Experimental Design

2.1. Experimental Model

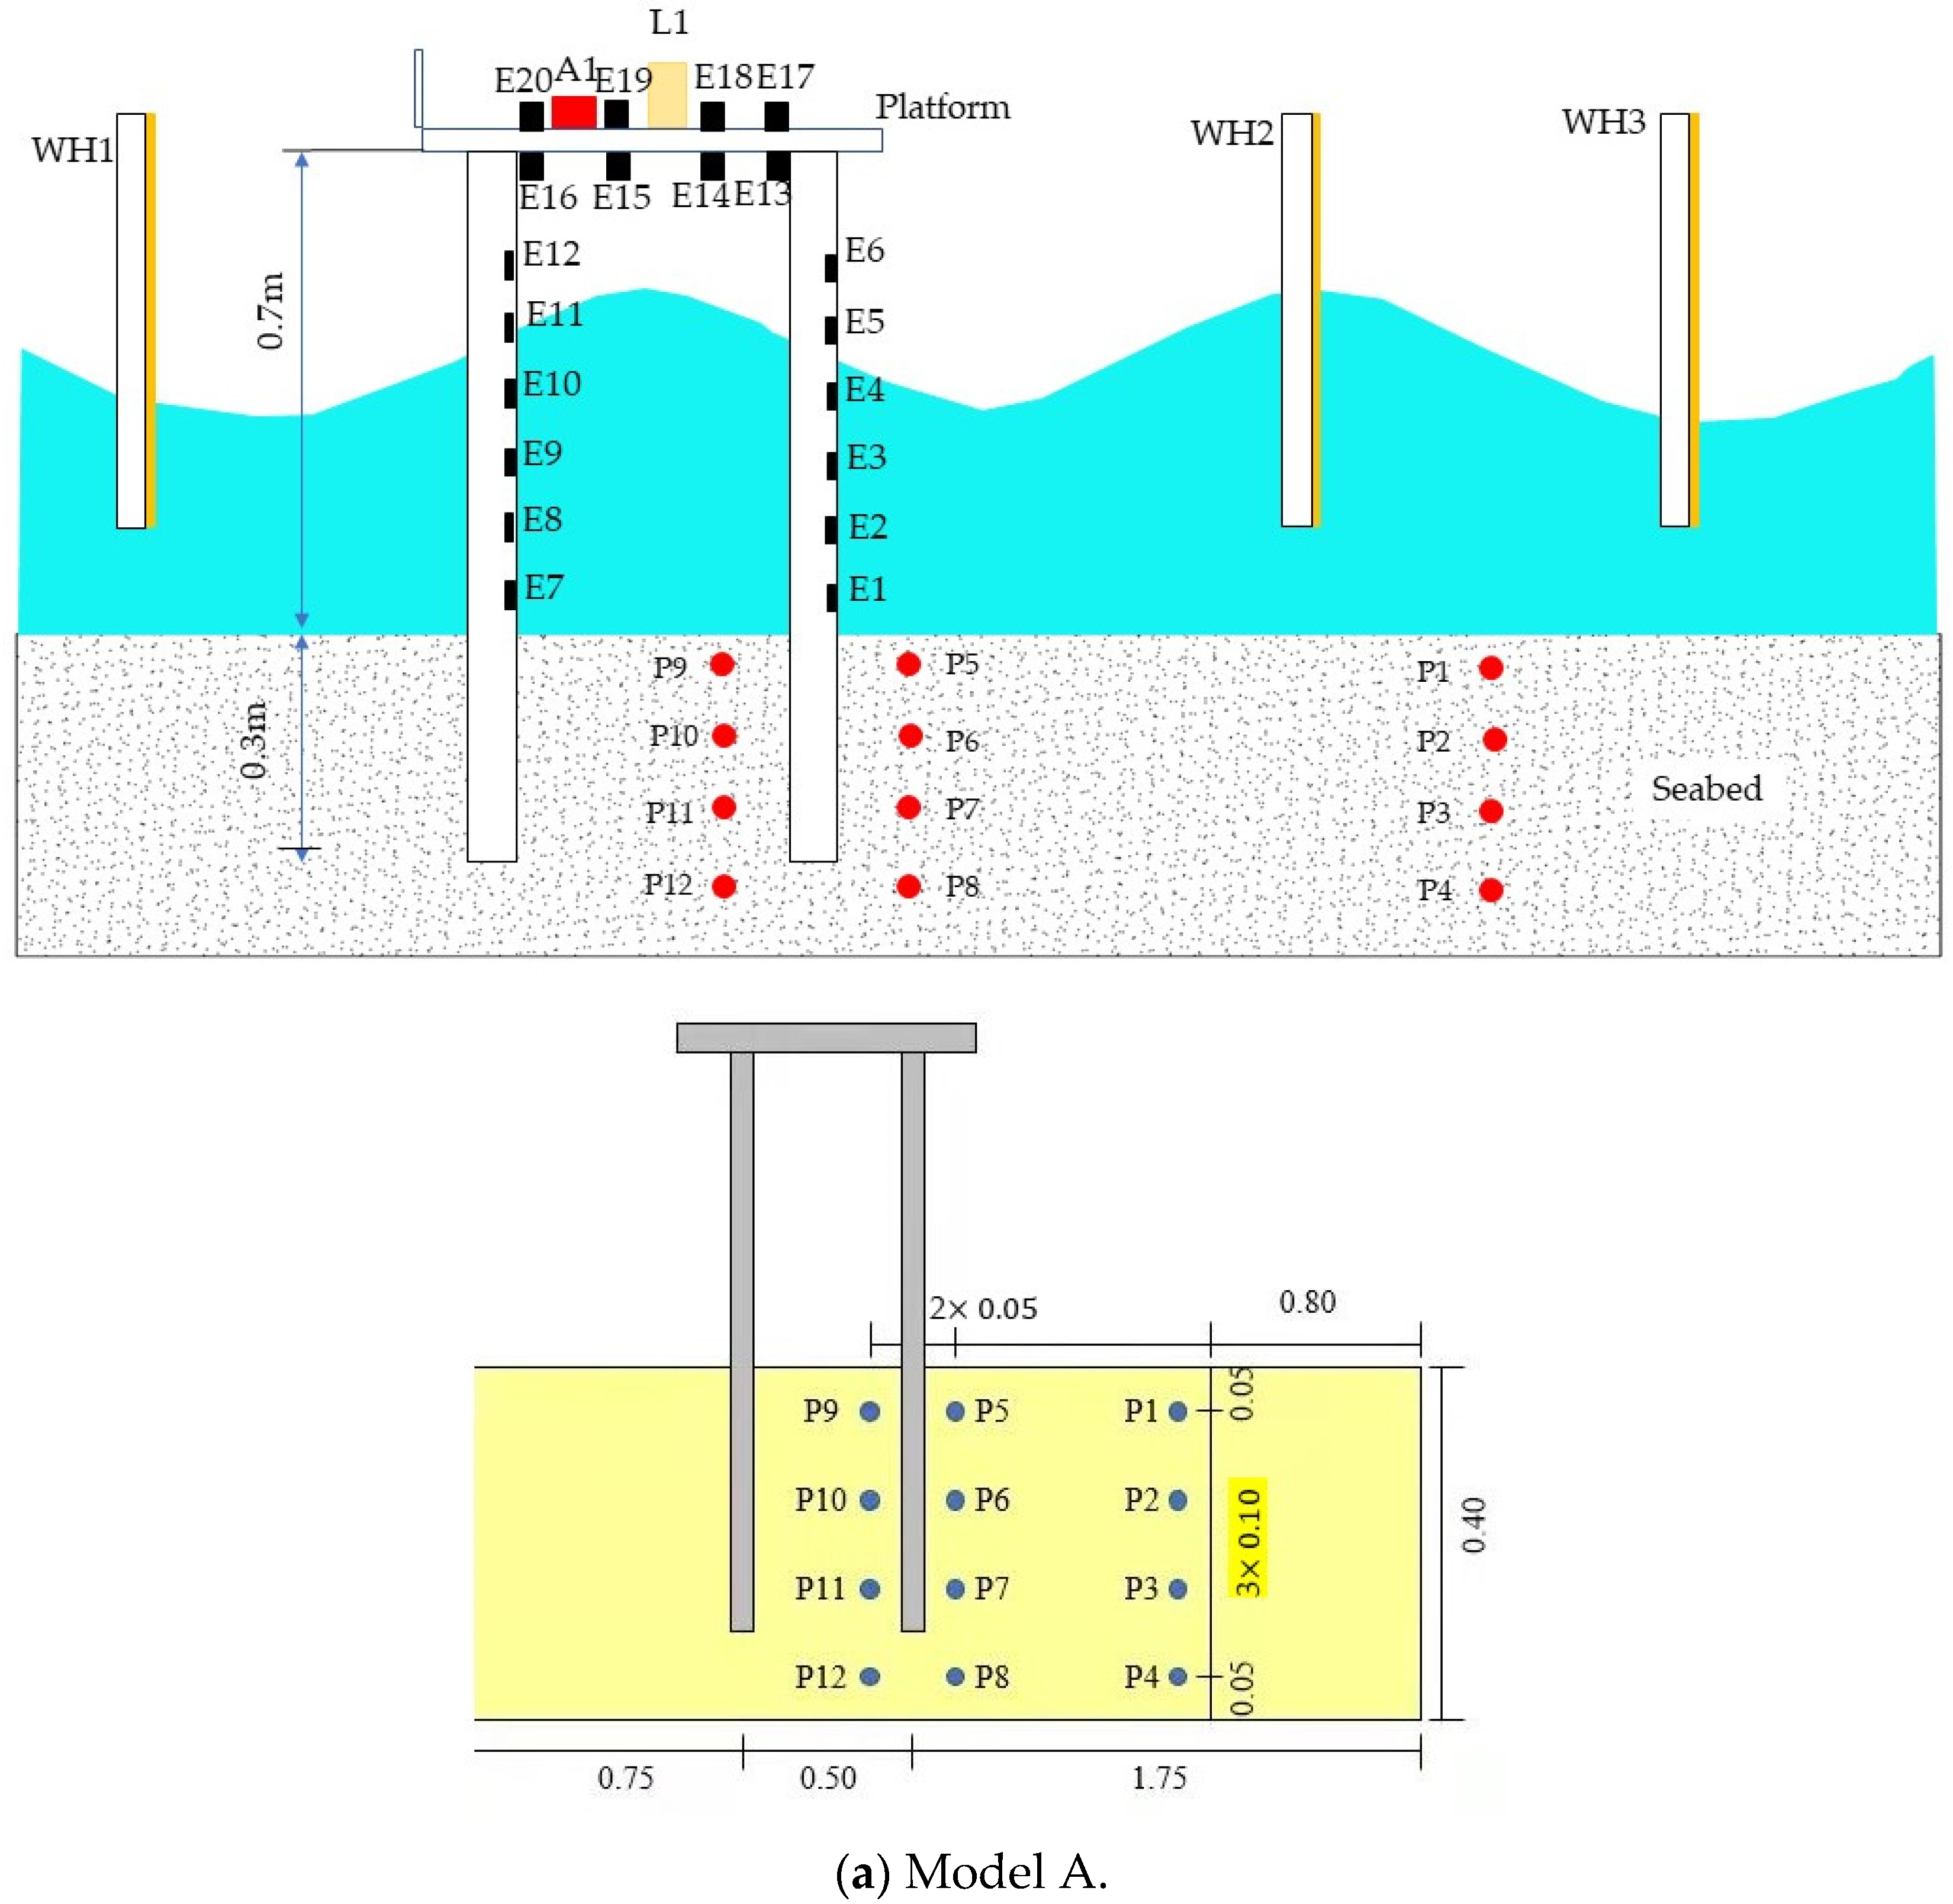
The main purpose of this experiment was to investigate the coupling response and deformation process of platforms and the seabed under waves of large wave height. The experiment was carried out in a wave flume (length = 90 m, width = 1.7 m, depth = 1.5 m, maximum working water depth = 1.2 m) that simulated the dynamic response of offshore platforms under the impact of waves of large wave height. Figure 1 shows the overall layout of the offshore platform structure in the wave flume. A test sandpit was set up at a distance of ~60 m (more than 6 times the wavelength) from the wave maker, with a length of 3.0 m, a width of 1.7 m, and a depth of 0.4 m. The basic physical parameters of the soil used to fill the sandpit are listed in Table 1.
Combined with the better reliability of the experimental method in this paper and the results of previous investigations of flume experiments [28,37], the geometric scale of the model in this test was determined to be l = 1:24. According to the gravity similarity principle, the corresponding parameters between the prototype and the experimental model are presented in Table 2.
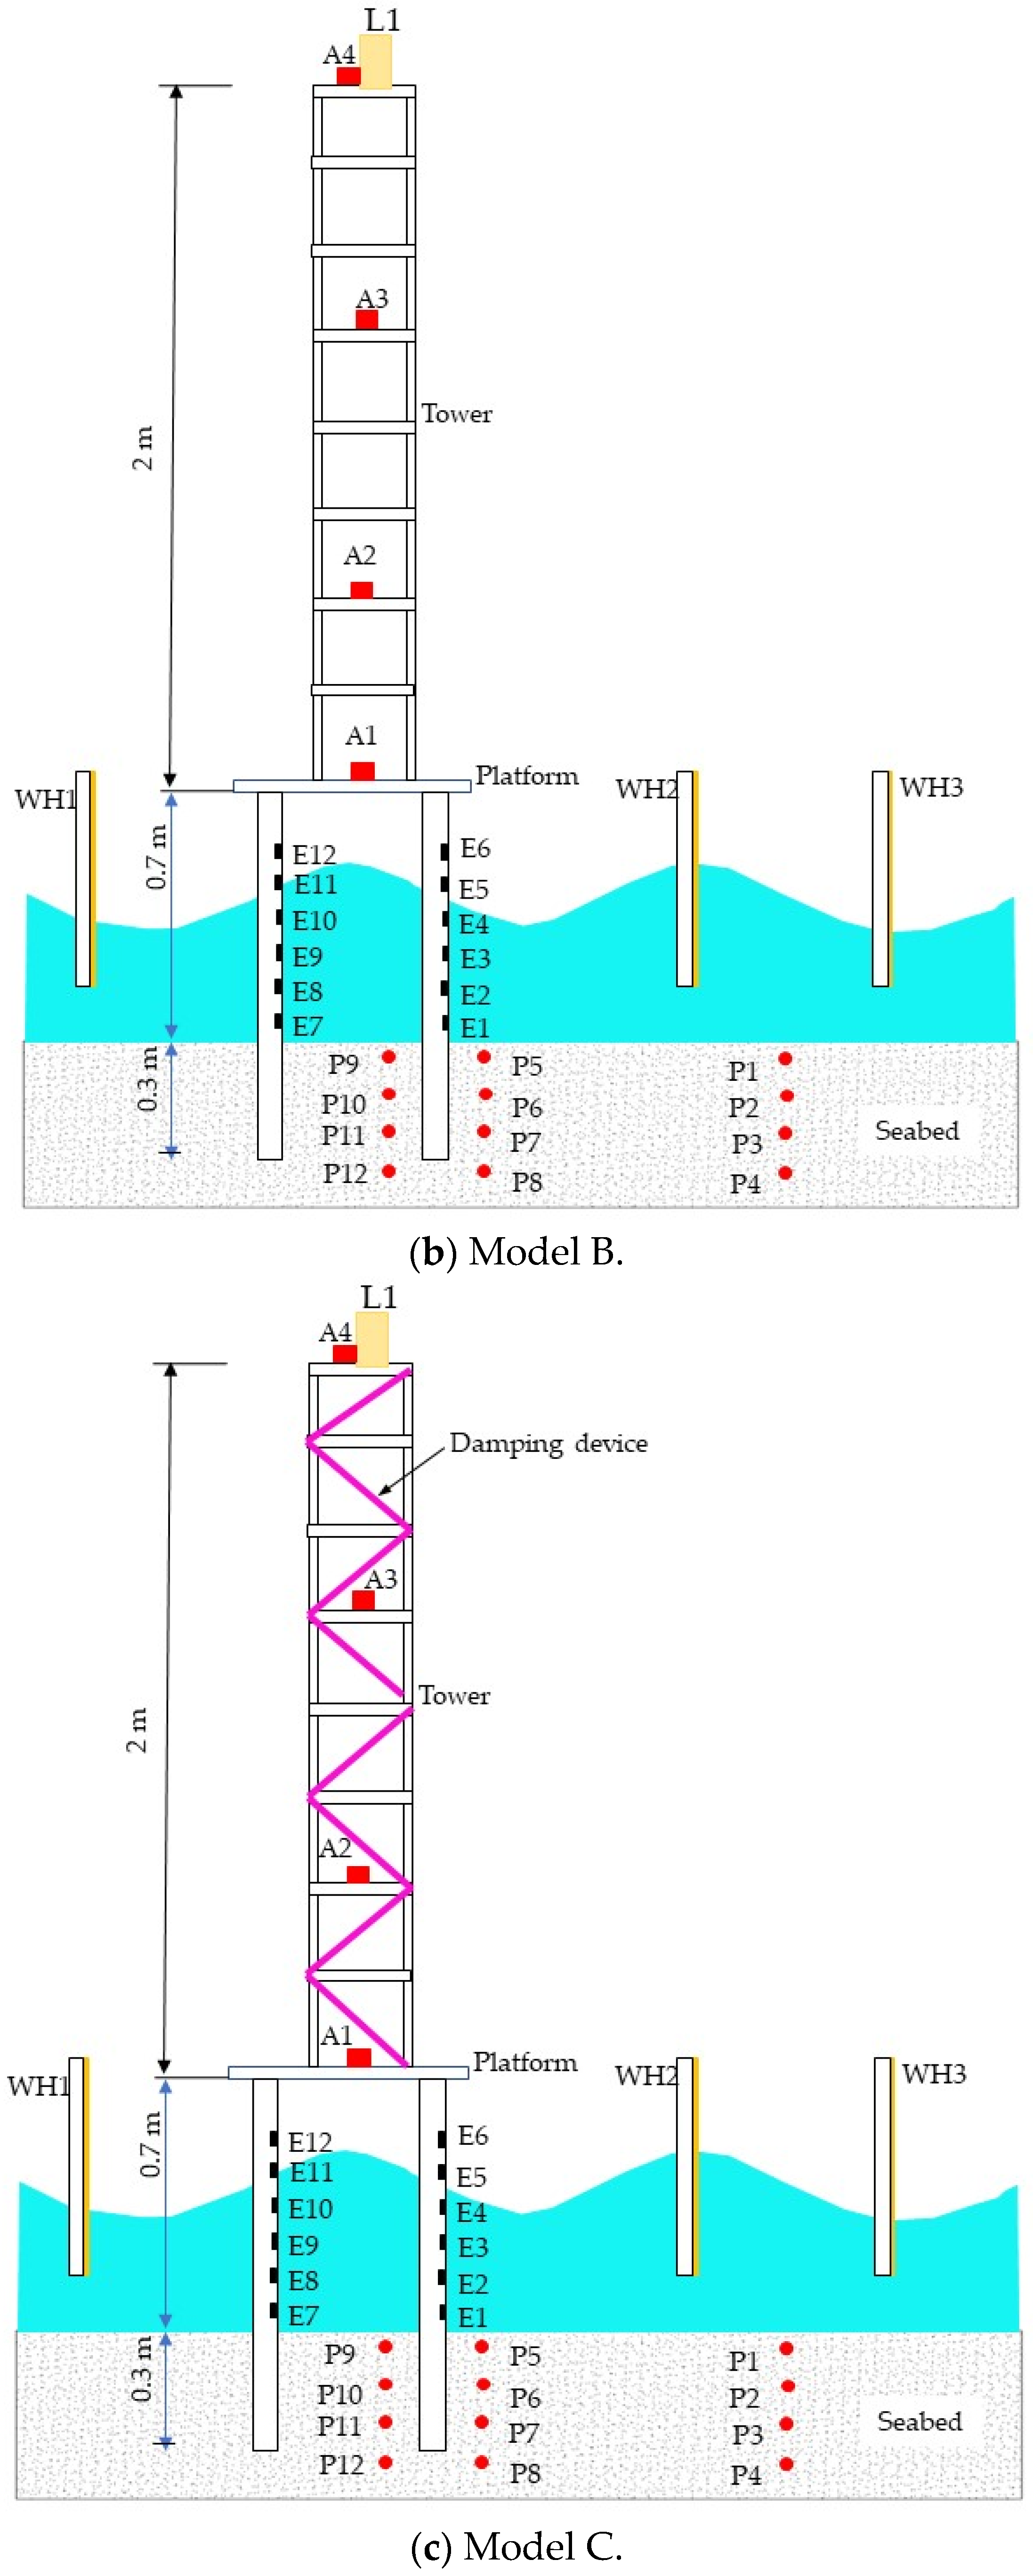
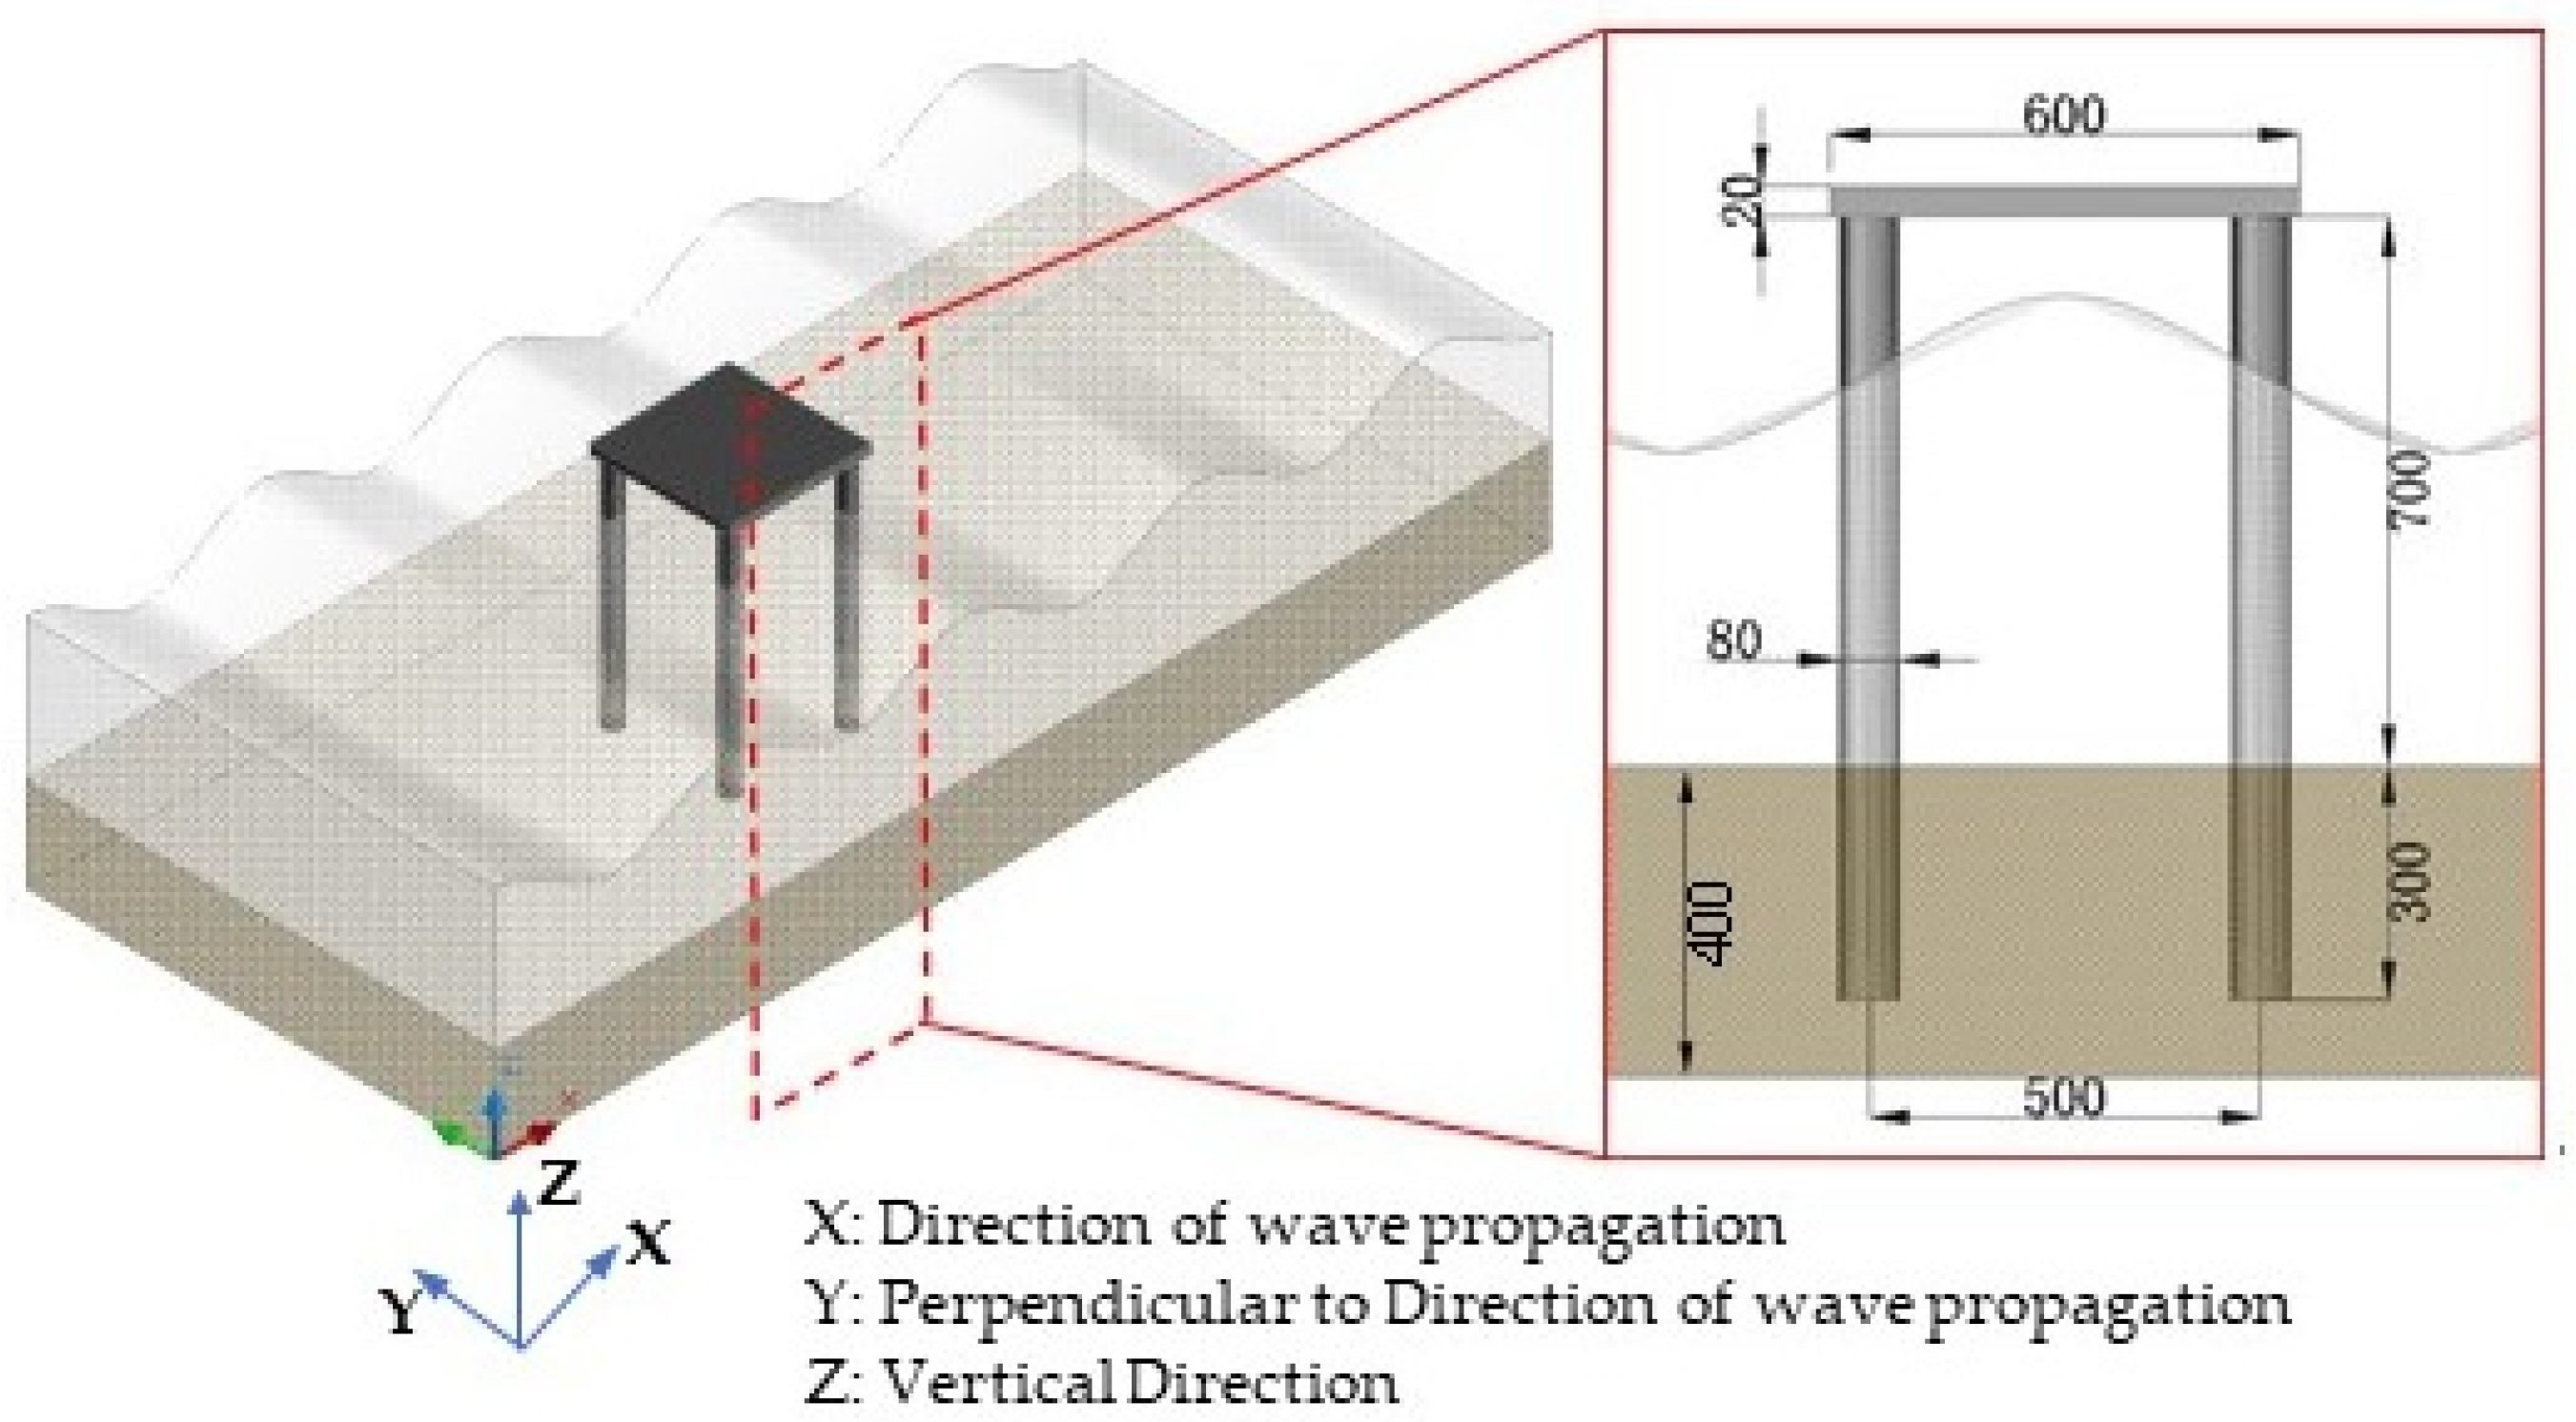
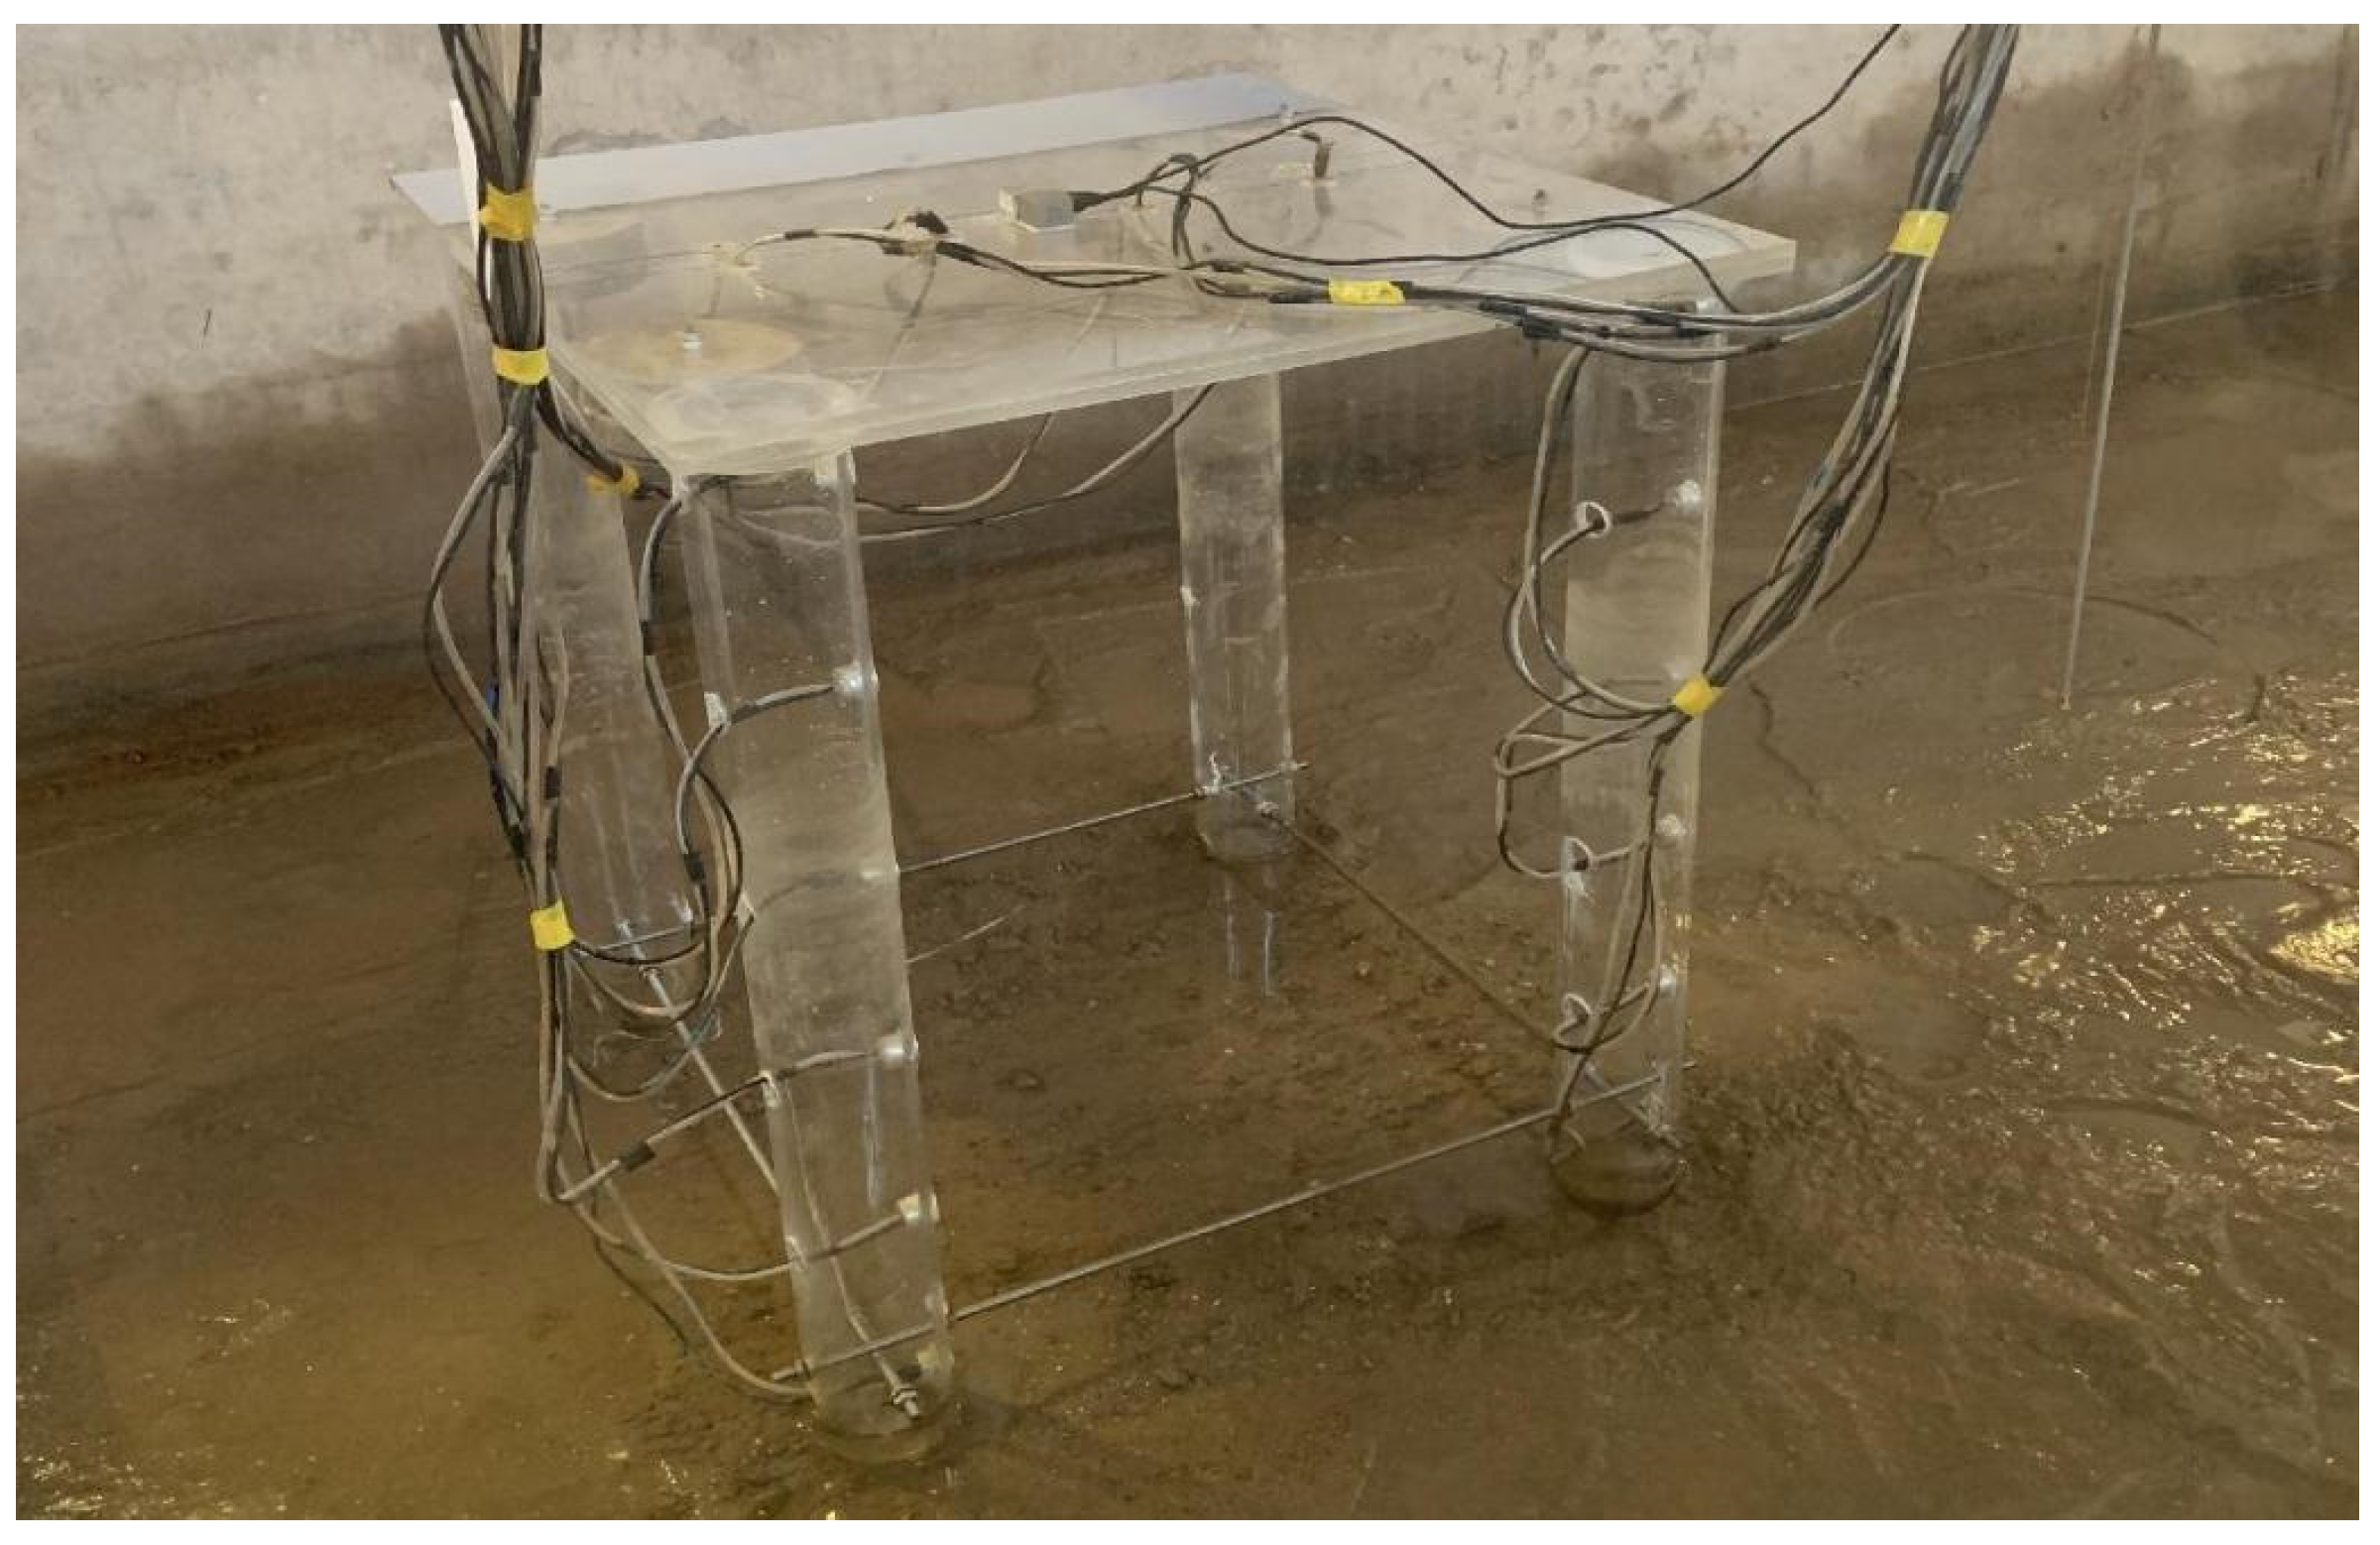
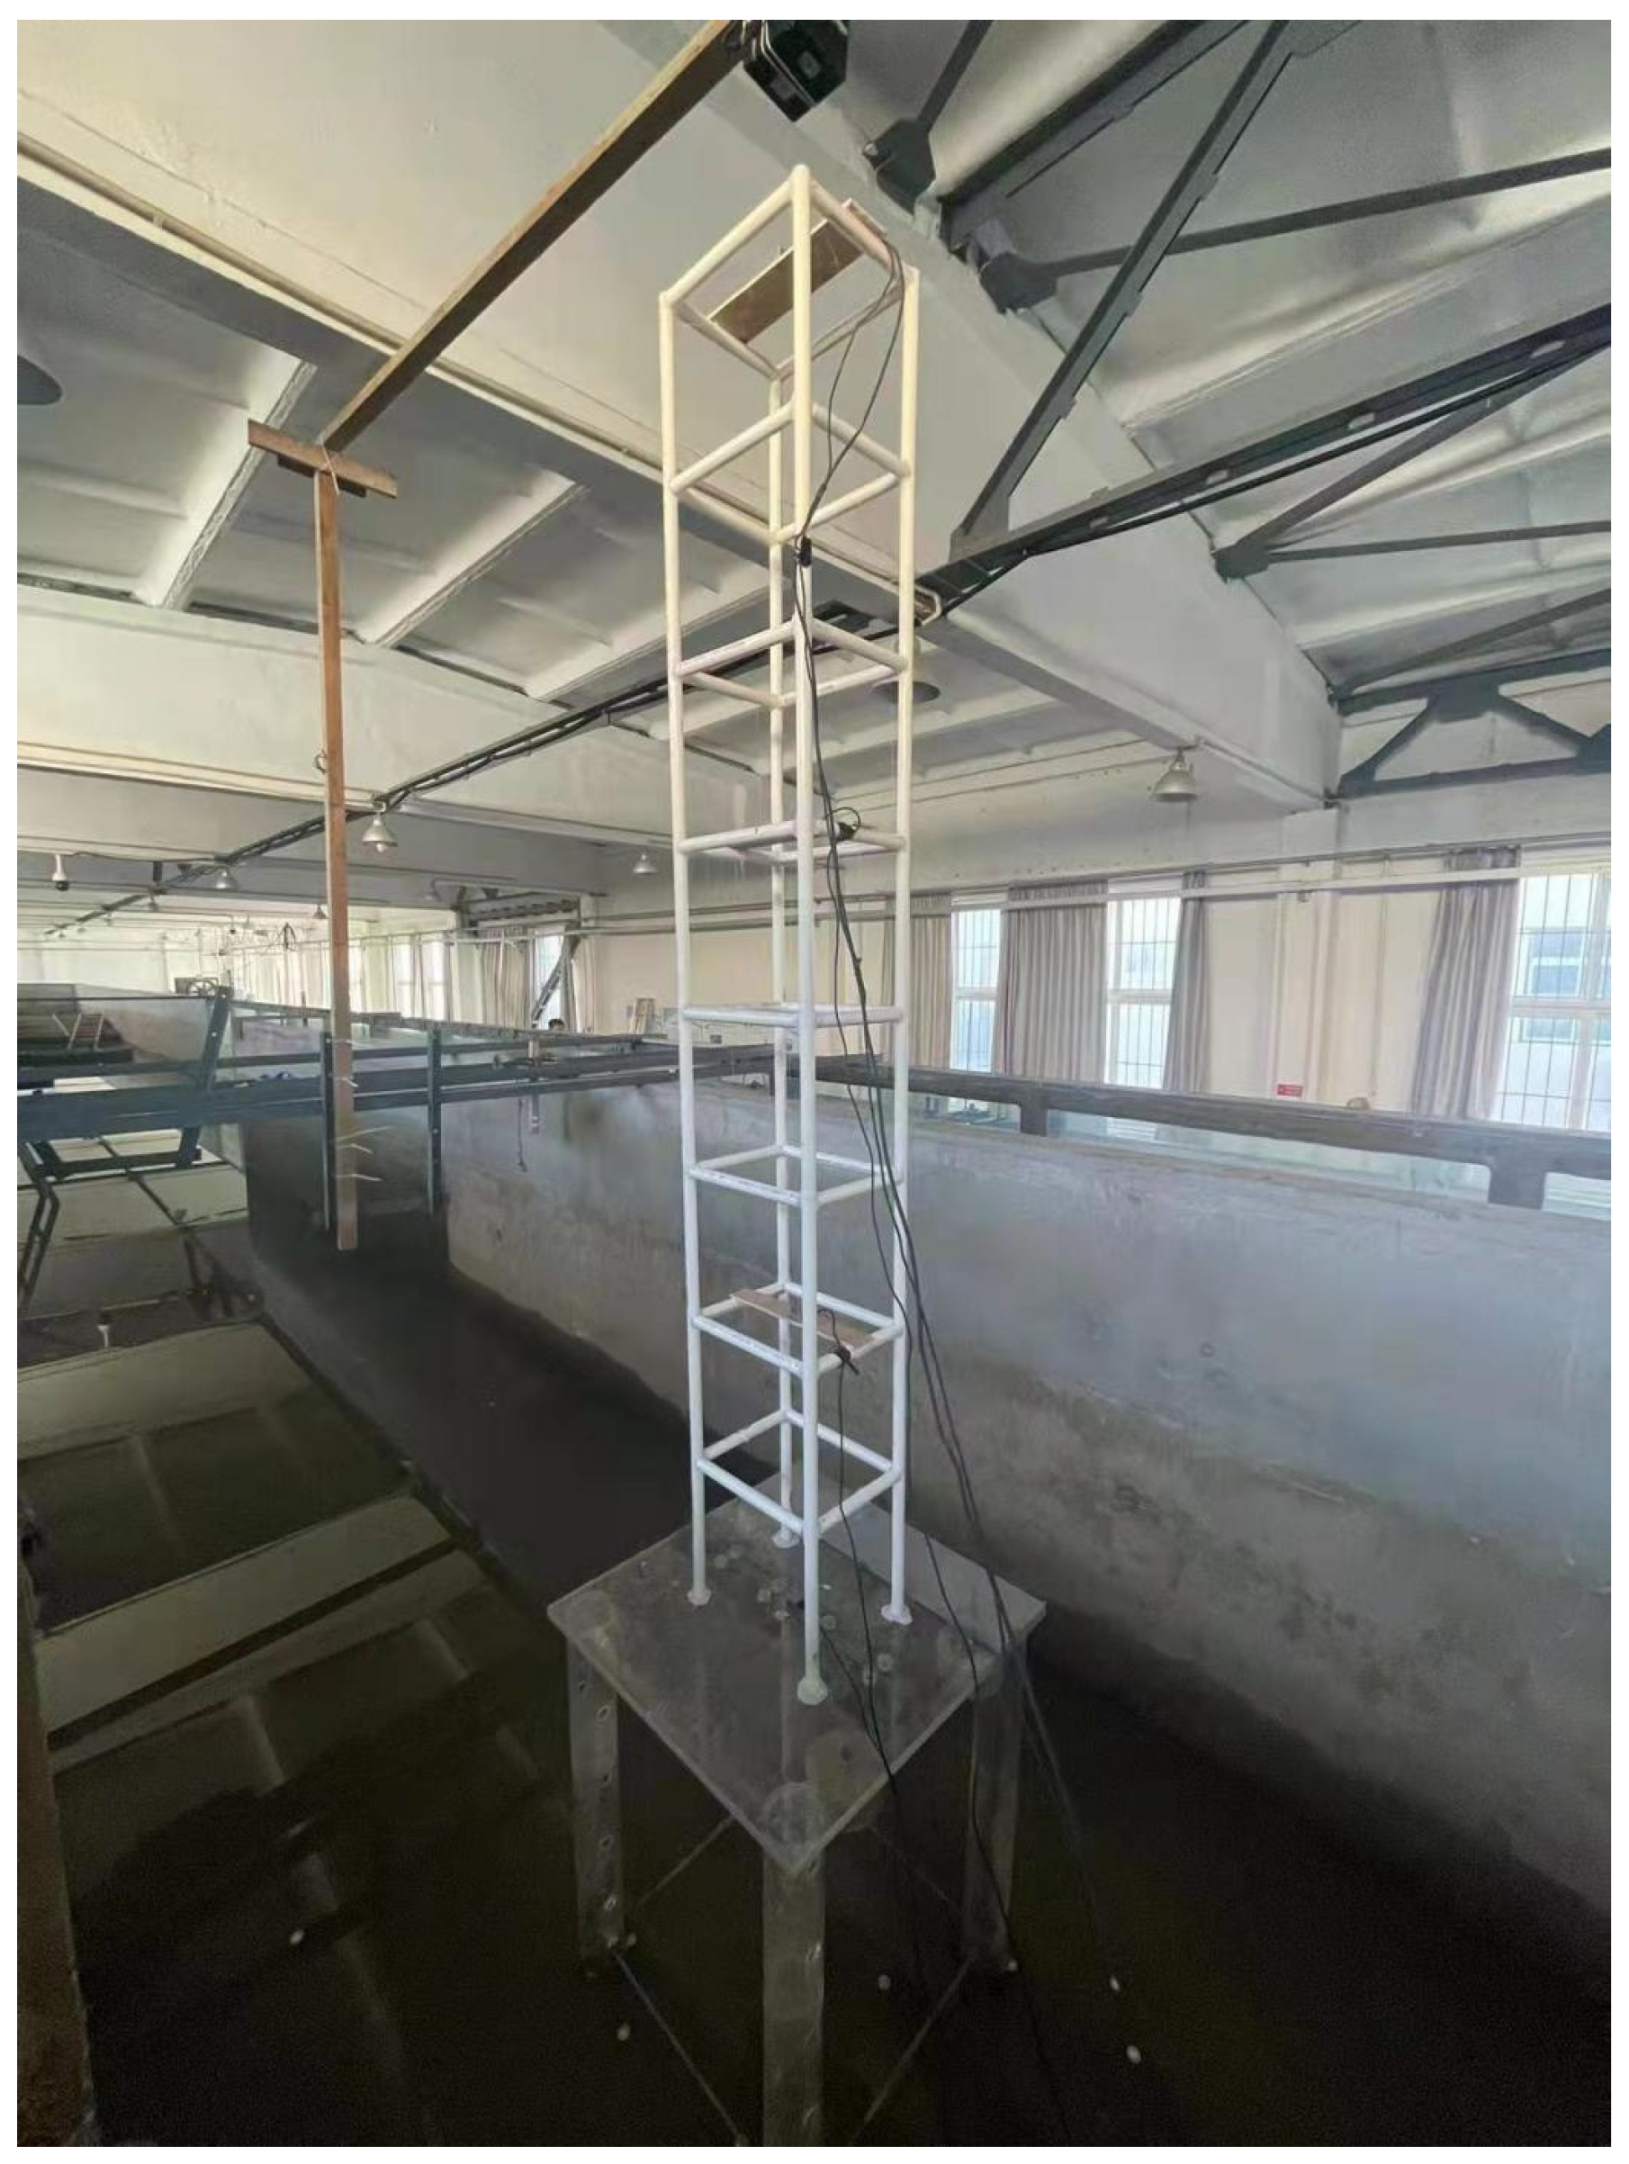
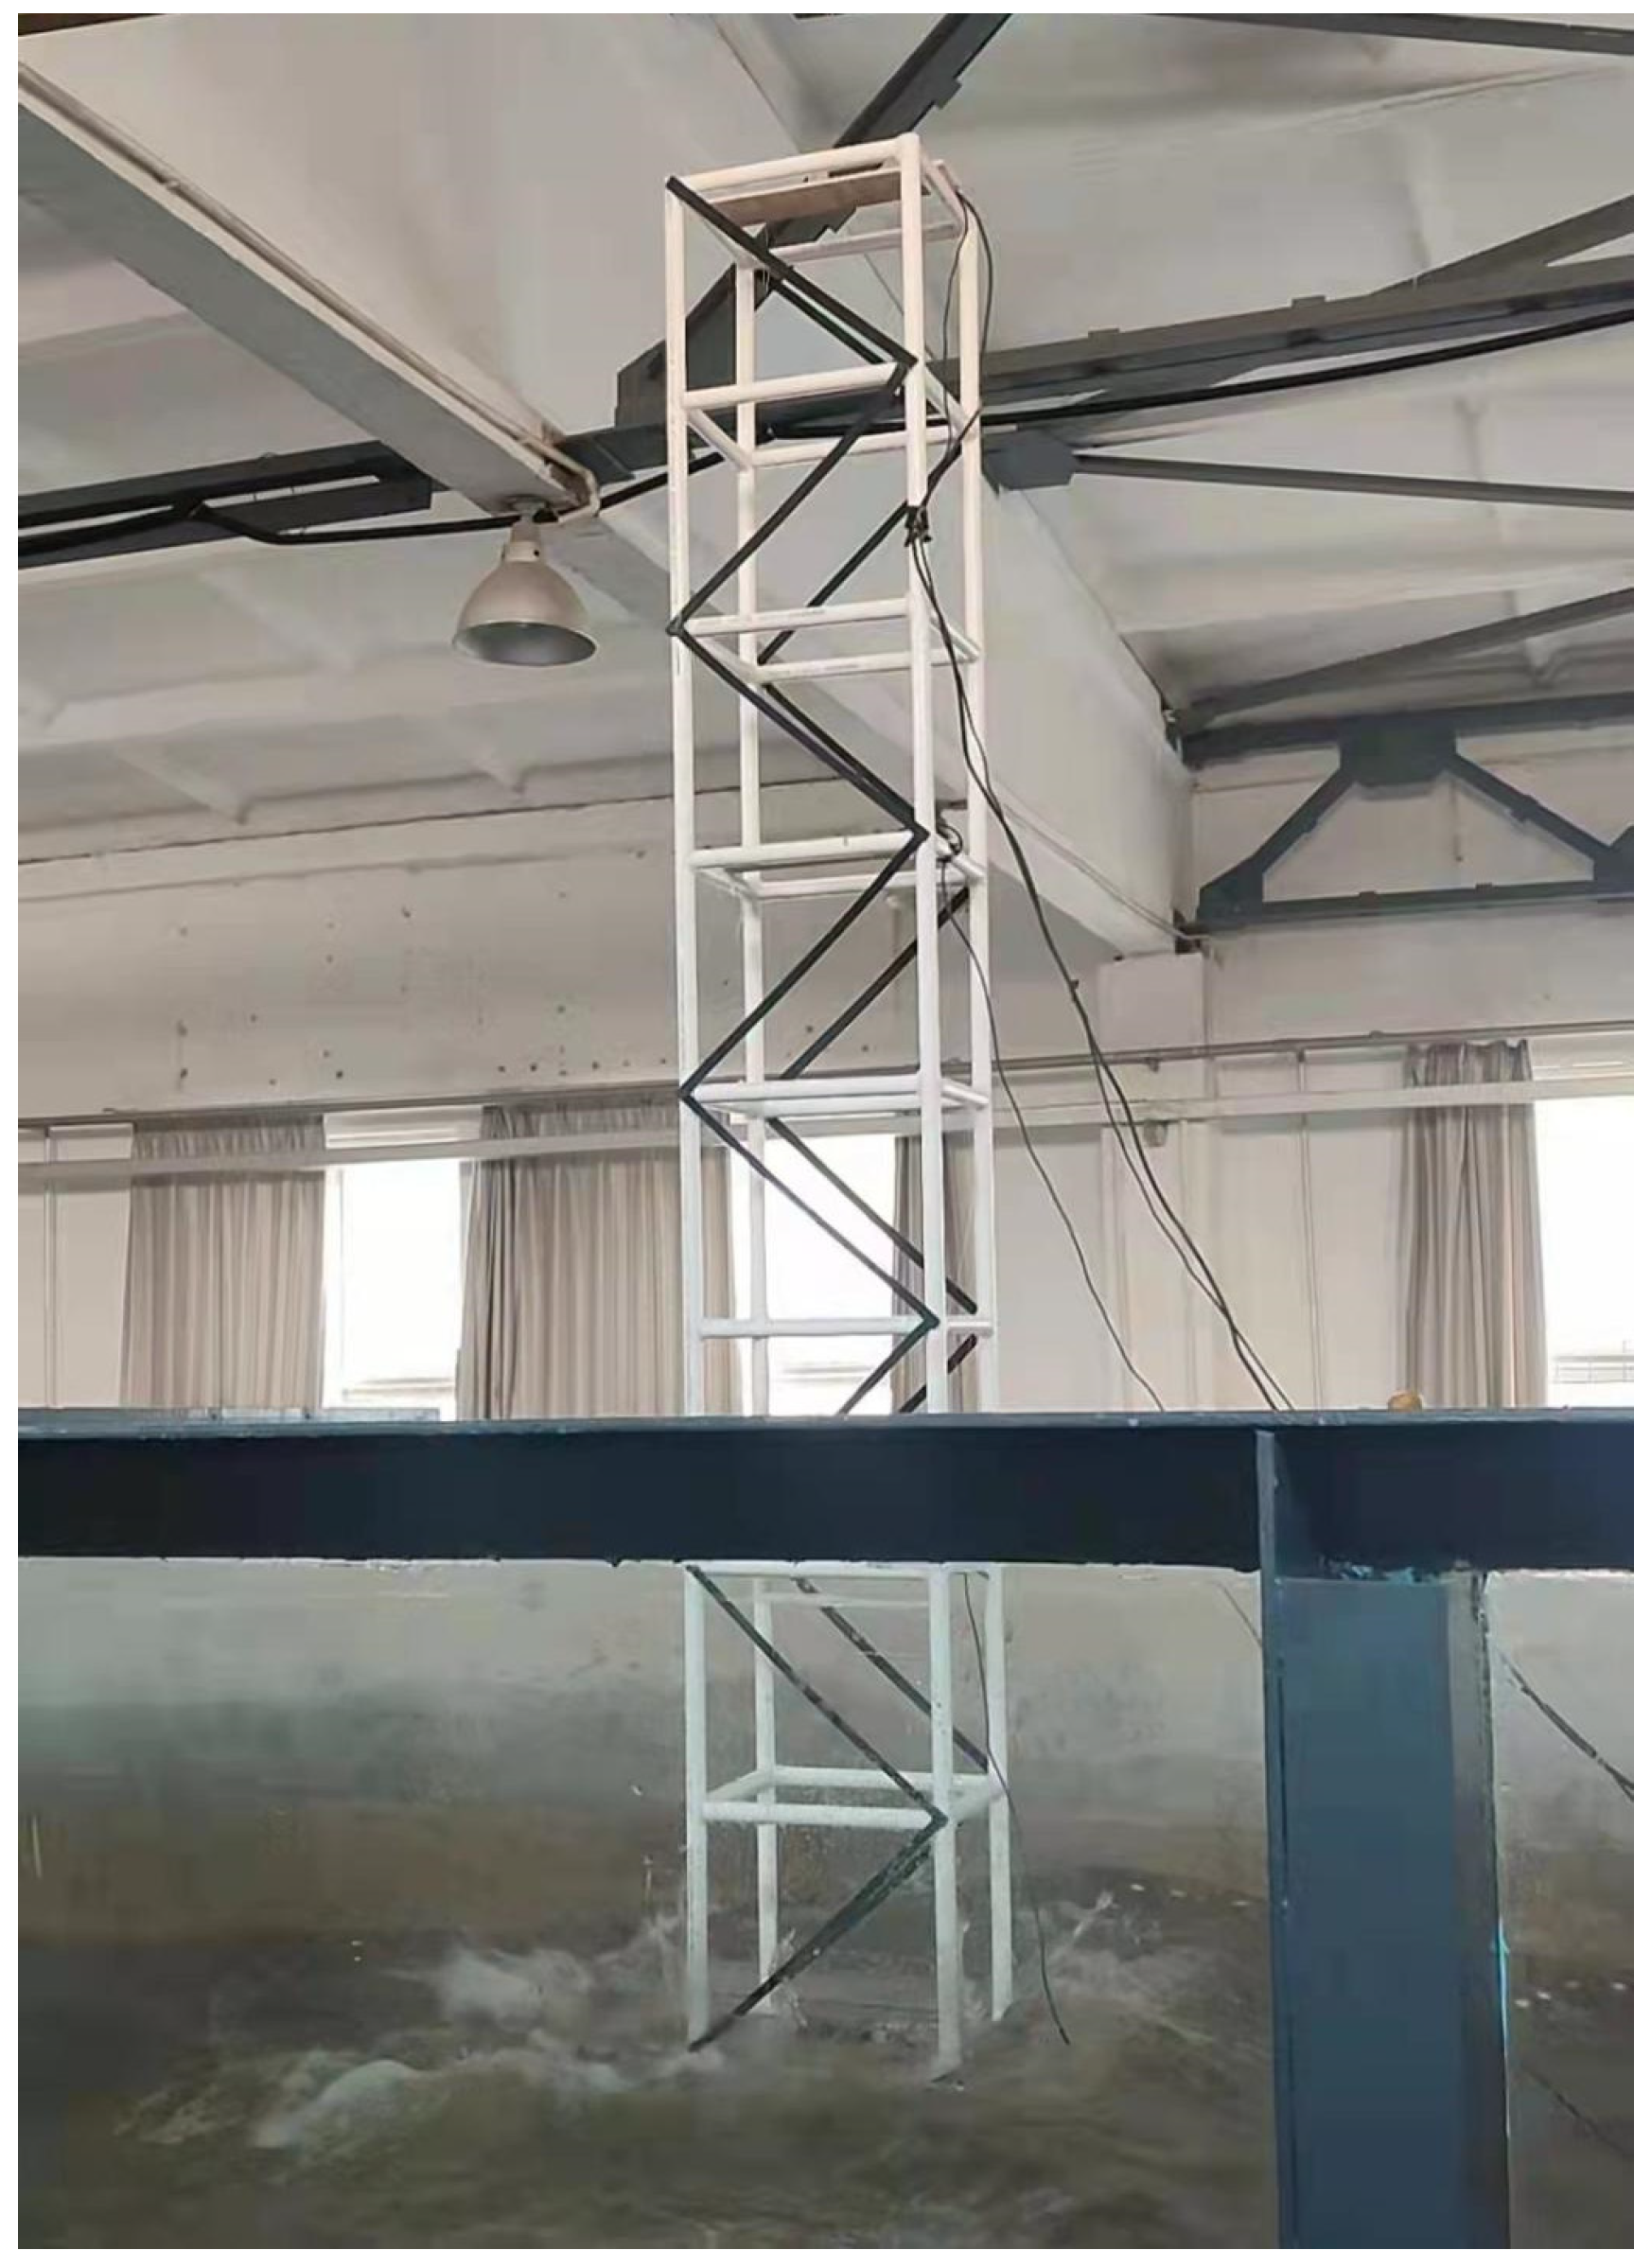
Three models were constructed for this experiment (as shown in Figure 2). The first model (A) was used to test the dynamic response of the jackup offshore platform under waves, and the second model (B) involved installing a tower model on the platform of model A, which was used to investigate the coupling between the jackup offshore platform, the tower, and the seabed foundation under wave impacts. The third model (C) involved installing a damping device (i.e., diagonal bracing using rubber rods) on model B, which was used to compare the tower on the platform with and without the damping device. Figure 3 shows the offshore platform model in the sandpit of the flume. The depth of the pile legs embedded in the seabed foundation was 0.3 m, while the part above the mud surface was 0.7 m. The four pile legs were arranged at the four vertices of the platform in a square shape at the bottom of the platform, with a spacing of 0.5 m. Based on the previous results of physical model tests, the offshore platform and pile legs were made of Plexiglas in this model test [38], which ensured that the actual scale of the elastic modulus was close to the designed scale in order to get reasonable dynamic response results of the jackup platform under waves. The density of the Plexiglas material used for the model tests was 1780 kg/m3, and the tensile modulus, flexural modulus, and shear modulus were 25 GPa, 9.3 GPa, and 7 GPa, respectively.
The wave profile was measured using a DS30 multipoint high-water-level wave measuring system (measurement range: 0.60 m; accuracy: ± 1 mm; sampling frequency: 500 Hz), and the wave pressure was measured using a DS30 64-channel wave pressure sensor acquisition system (measurement range: 10 kPa; accuracy: ± 0.01 kPa; sampling frequency: 500 Hz), both of which were manufactured by the Beijing Academy of Water Sciences, China. The motion state of the platform was measured using a non-contact FASTRAK motion tracking and positioning system (measurement range: 0.30 m, accuracy ± 0.1 mm; sampling frequency: 500 Hz). The acceleration of the platform was measured using an accelerometer (three-axis acceleration; measurement range: 1 g; lateral sensitivity: ≤ ± 5%; sampling frequency: 400 Hz) manufactured by Keyang Co. LTD. (Yangzhou, China). Pore pressure was measured using a DMKY high-precision pore pressure sensor (measurement range: 100 kPa; accuracy: ± 0.01 kPa; sampling frequency: 100 Hz). The diameter of the pore pressure sensor was 13 mm, and its height was 12 mm, so it had no obvious influence on the flow field around the seabed foundation or the seabed structure.
The locations of all of the aforementioned measuring instruments are presented in Figure 2. In this experiment, a total of 18 pressure sensors were used to monitor the wave impact pressure on the pile legs and the upper and lower surfaces of the working platform under various wave conditions. Six pressure sensors each were installed on the wave-facing sides of the front pile (E1–E6) and the back pile (E7–E12) of the platform, and four pressure sensors each were installed on the lower surface (E13–E16) and upper surface (E17–E20) of the platform. Two acceleration sensors were installed on the upper surface (A1, A2) of the working platform to monitor the acceleration response of the platform structure. A 6-DOF motion displacement measuring instrument was installed on the side surface (L1) of the working platform to monitor the horizontal displacement, vertical settlement, and failure and instability processes of the platform. Five wave-height sensors were installed at several typical positions before and after the wave flume test model to measure the wave surface change processes inside the flume (WH1–WH5). A total of 12 pore-pressure sensors were arranged to measure the change process of pore pressure around the pile leg—three rows of pore-pressure sensors were installed at 0.05 m on the front (P5–P8) and back (P9–P12) sides of the pile leg of the model and 0.8 m in front of the model (P1–P4). A total of four acceleration sensors were installed at four typical positions along the height of the tower to monitor the acceleration response of the tower (A1–A4). A 6-DOF motion displacement measuring instrument was installed on the top of the tower (L2) to monitor the displacement of a single pile leg at the top of the tower.

2.2. Experimental Procedure

The experimental procedure in this study was carried out as described in previous literature [28], and the steps are briefly described below:
(1)
Rinse the flume and the soil box with water before the experiment.
(2)
The soil foundation model is made layer by layer, for a total of four layers, each of which is 10 cm high. The platform structure is placed and the pore-pressure sensor is buried according to the design.
(3)
All kinds of sensor acquisition devices are connected, and correct debugging is carried out (Figure 4, Figure 5 and Figure 6).
(4)
Water is added to the tank to the prescribed water level for saturation. Considering the poor permeability of the foundation soil, the saturation time of the model’s foundation should be more than 24 h to make the foundation fully saturated.
(5)
A preliminary experiment for calibrating the wave parameters is carried out; a total of five wave-height meters are placed at the center of the model and at 1 m intervals before and after it to measure the wave surface process, comparing the test spectrum and the theoretical spectrum.
(6)
The experiment of Model A commences, according to the experimental conditions shown in Table 3.
(7)
Repeat steps 5–6 for the next wave condition after model A’s testing is completed, and steps 3–6 when model A is changed to model B.
(8)
Repeat steps 5–6 for the next wave condition after model B’s testing is completed, and steps 3–6 when model B is changed to model C.

2.3. Experimental Conditions

Several experimental conditions for investigating the coupling between the platform, the tower, and the seabed foundation under waves are summarized in Table 3. Three models are presented in Figure 2. In all cases, the wave length ( λ ) and the wave celerity ( C ) were calculated, as shown in Equations (1) and (2), respectively:
λ = g T 2 2 π tan h ( 2 π λ H w )
C 2 = g λ 2 π tan h ( 2 π λ H w )

3. Experiment Results

3.1. Simulation Results of the Dynamic Response of the Jackup Offshore Platform Structure under Wavess

3.1.1. Wave Pressure

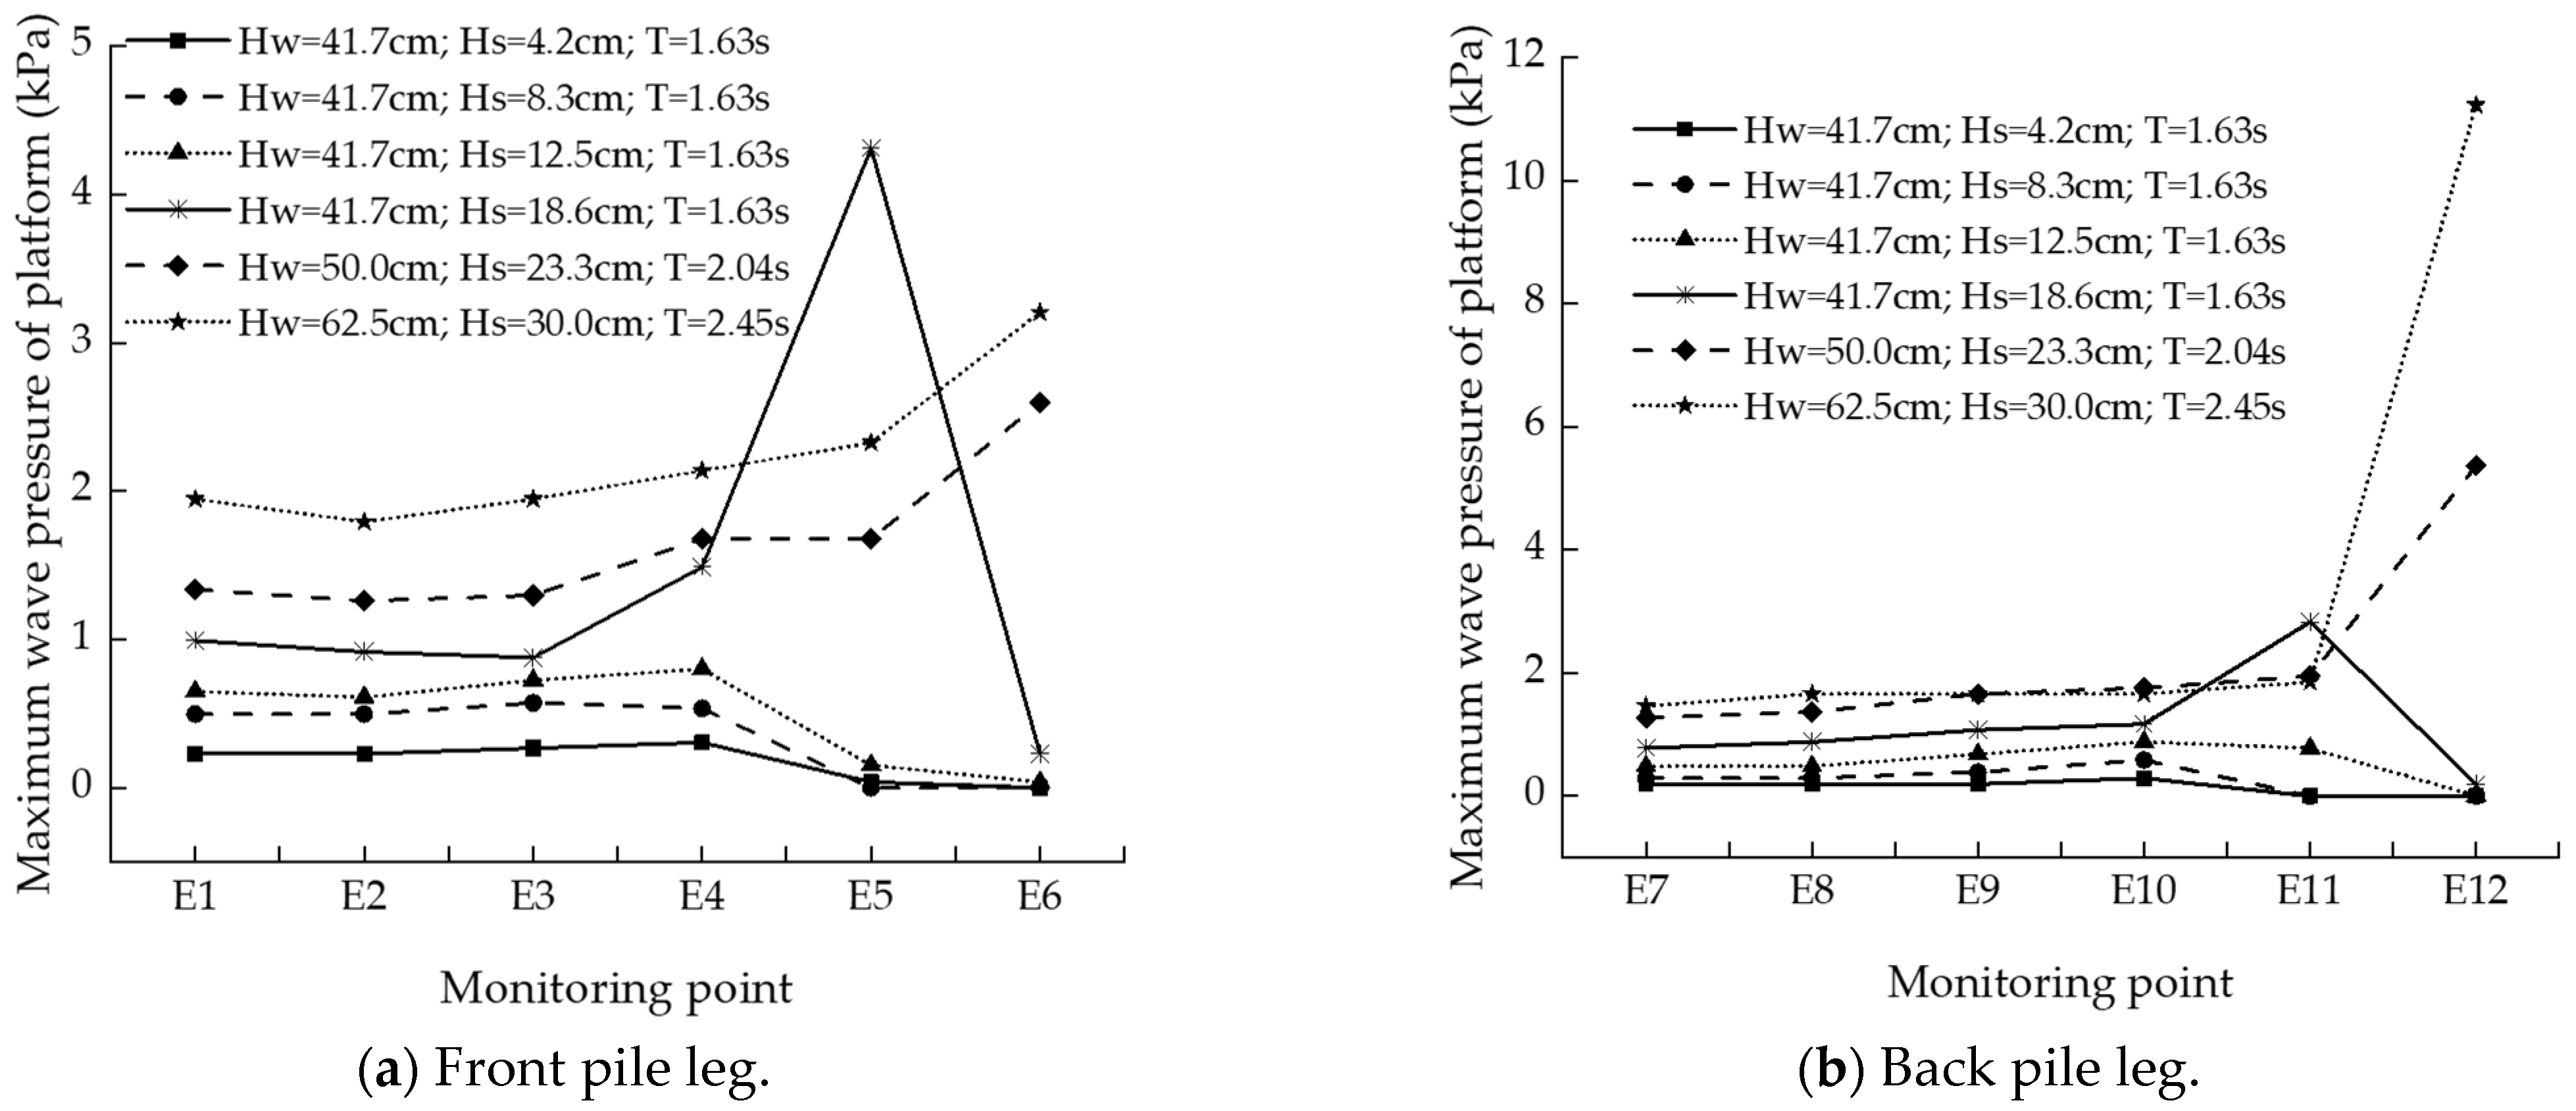
The wave-pressure test results for the dynamic response of the jackup offshore platform structure used in model A under waves are illustrated in Figure 7 and Figure 8. Through analysis and comparison of model A under normal waves and waves of large wave height, we can see the following:
As shown in Figure 7, the wave pressure on the pile leg increases as its position on the pile leg increases. At the same time, the wave pressure on the rear leg of the platform is almost the same as the pressure on the front leg of the platform, and the rear pile is slightly larger than the front pile. In the test process, it can be seen that the wave pressure at different positions of the platform increases with the increase in the effective wave height. When the wave height is large enough, the impact of the waves on the platform is significant, and the platform displays obvious shaking.
The depth of the water has a significant effect on the wave pressure on the platform; when the water depth was less than or equal to 41.7 cm, the wave pressure was only on the leg of the pile, and the wave could not touch the upper and lower sides of the platform. As shown in Figure 8, when testing model A under waves of large wave height, the water depth was 50.0 cm and the waves began to touch the lower side of the platform. When the water’s depth reached 62.5 cm, the wave generated obvious crossing while touching the side of the platform. Under the waves of large wave height, the maximum wave pressure on the platform’s panel structure was at the lower side of the platform panel, and the maximum wave pressure on the pile leg structure was at the upper end of the wave-facing side of the pile leg.
The height of the waves affects the wave pressure on the platform, as shown in Figure 8, where the bottom surface of the platform is significantly impacted by waves under the action of H s = 23.3 cm and 30.0 cm waves, and the wave pressure at the bottom surface is greater than the wave pressure at other positions. The top surface of the platform is impacted by the waves, and the impact of the waves on the platform is mainly at the wave-facing end of the top surface of the platform.
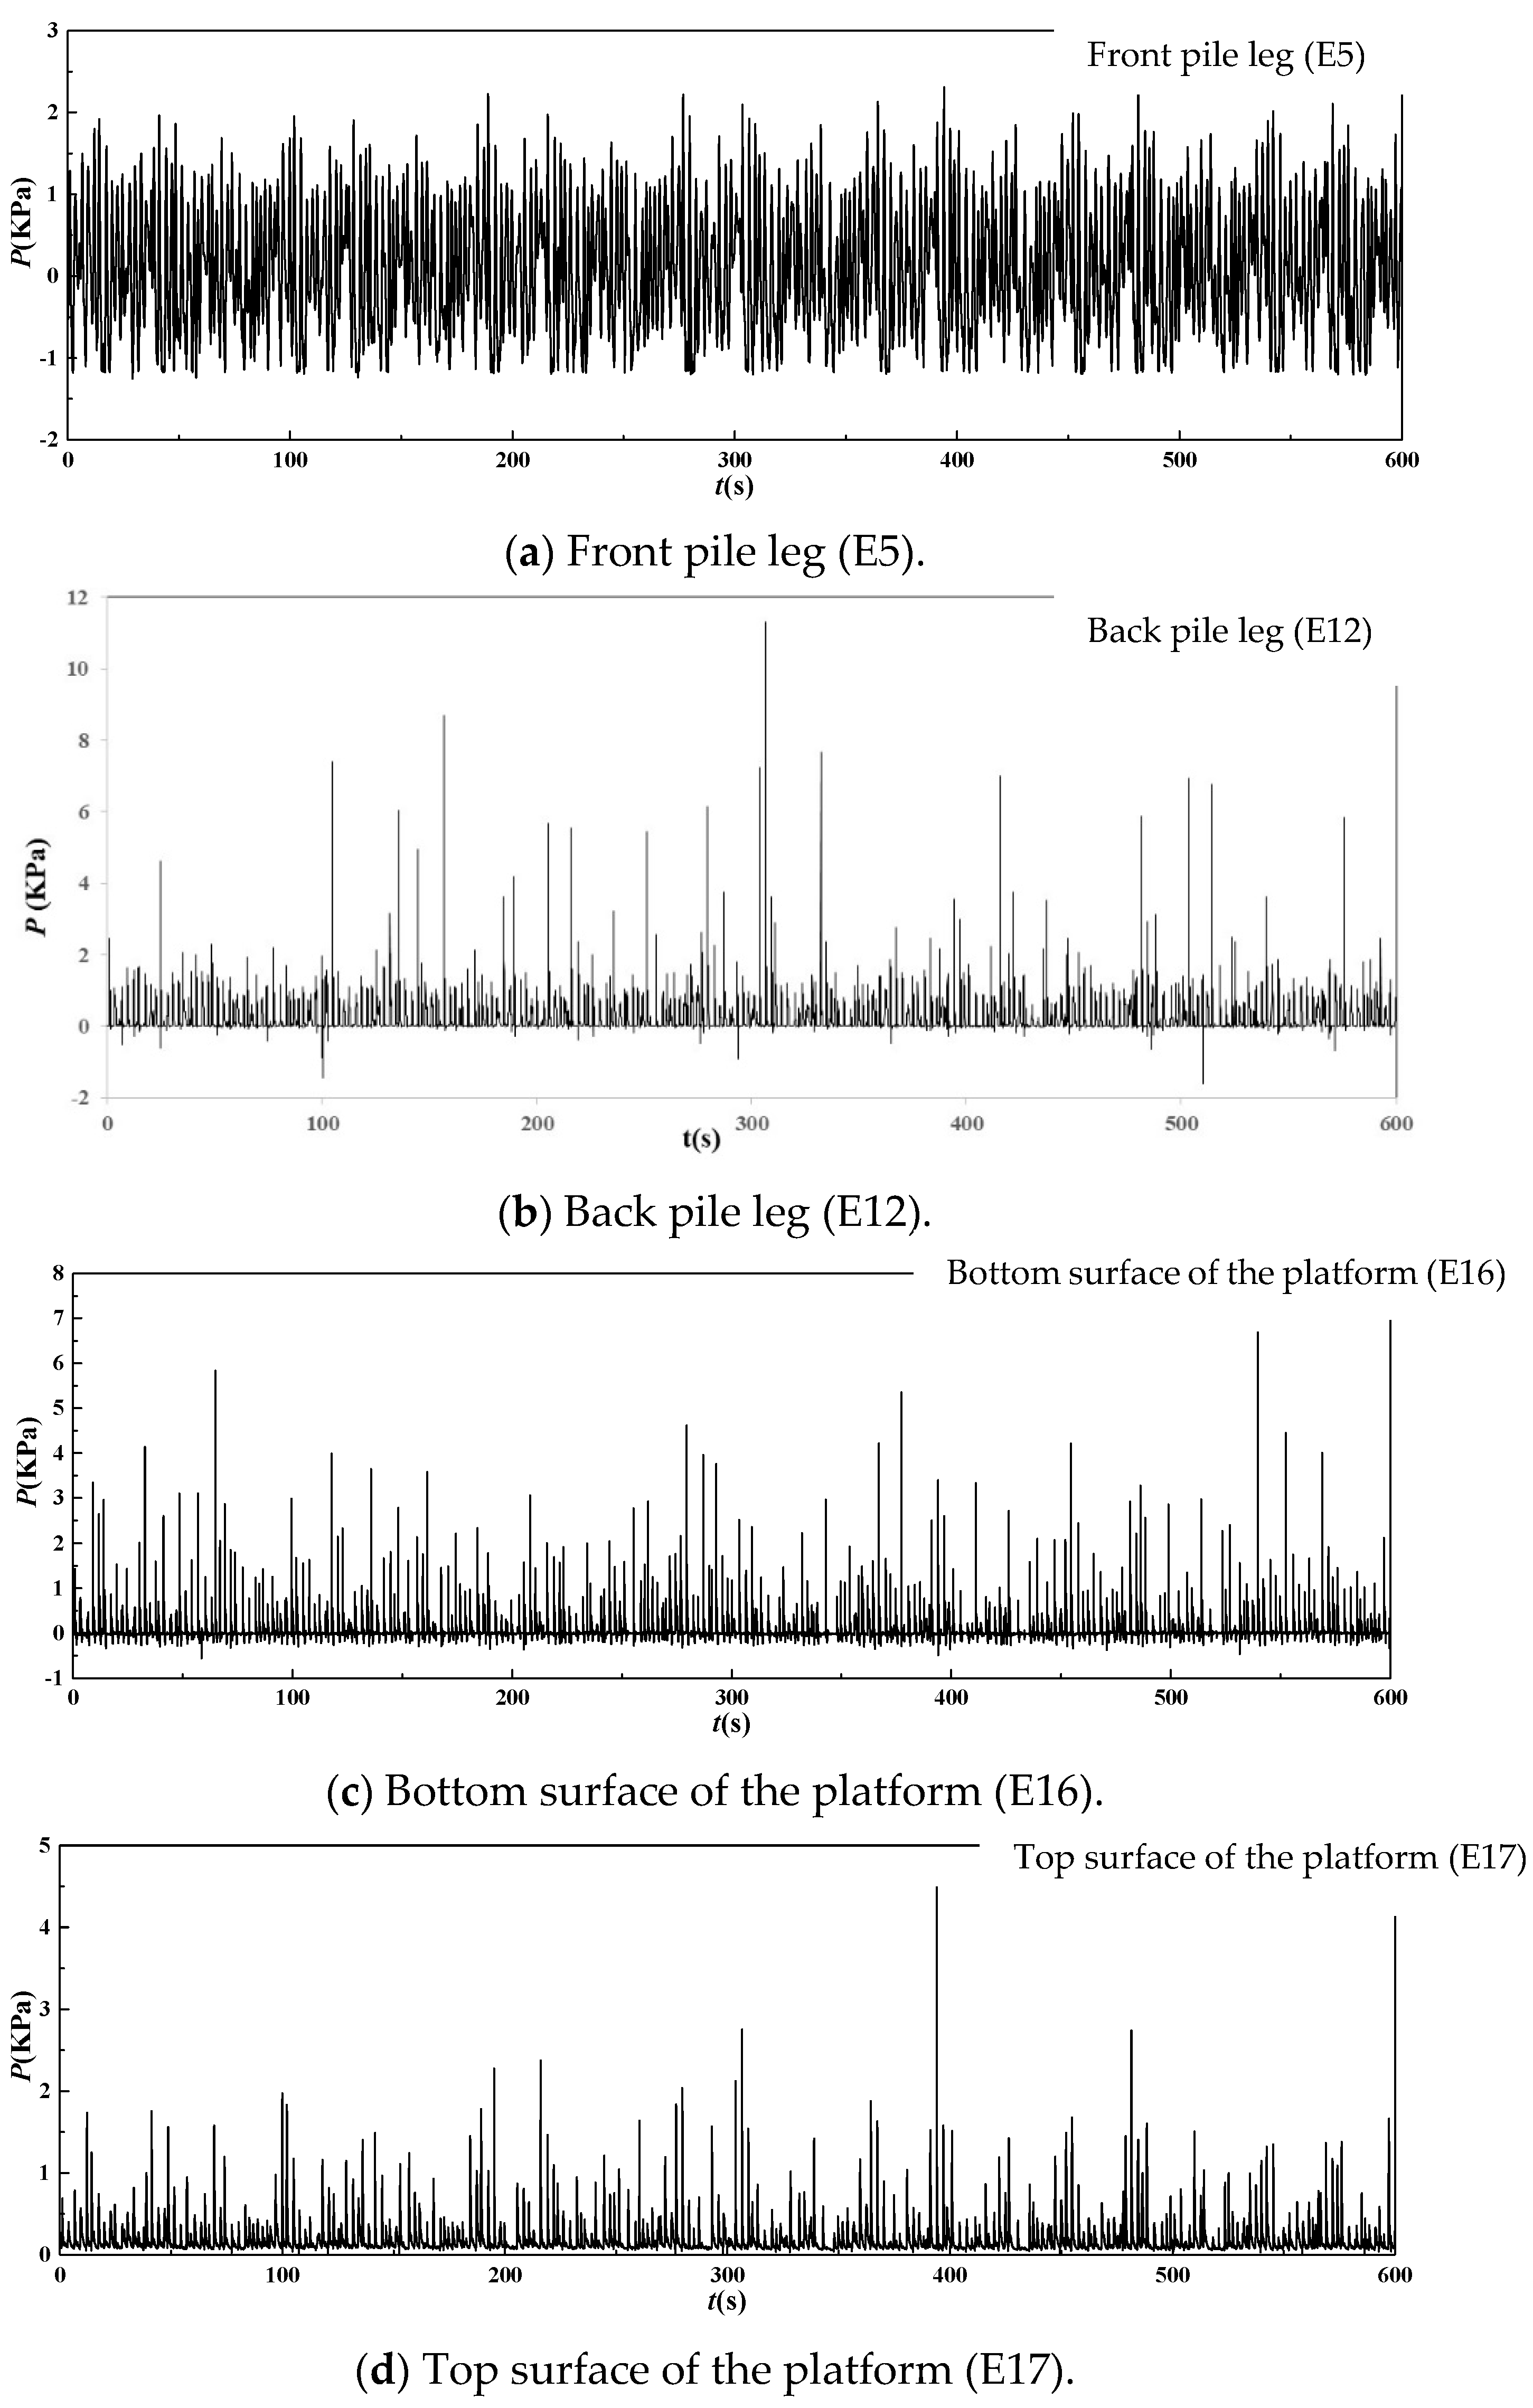
Figure 9 shows the temporal evolution of wave pressures acting on different points of the platform structure under waves ( H w = 62.5 cm, H s = 30.0 cm, T = 2.45 s). The peak wave pressure at point E12 of the rear pile is 11.33 kPa, which is 3.21 kPa greater than the wave pressure at point E5 at the same height of the front pile; at this time, the peak wave pressure at the E16 monitoring point on the lower side of the platform reached 8.04 kPa, and the peak wave pressure at the E17 monitoring point on the upper side of the platform was 4.49 kPa. It can be seen that the time when the peak wave pressure at the front pile leg (E5) appears is the time when the wave crest arrived, and the peak wave pressure is almost equal at different wave peaks. However, the time of peak wave pressure at the back pile leg (E12) and below the platform (E16) lags several wave cycles behind. The peak wave pressure at the top of the platform appeared the latest; a maximum peak value appears every few cycles.

3.1.2. Pore Pressure

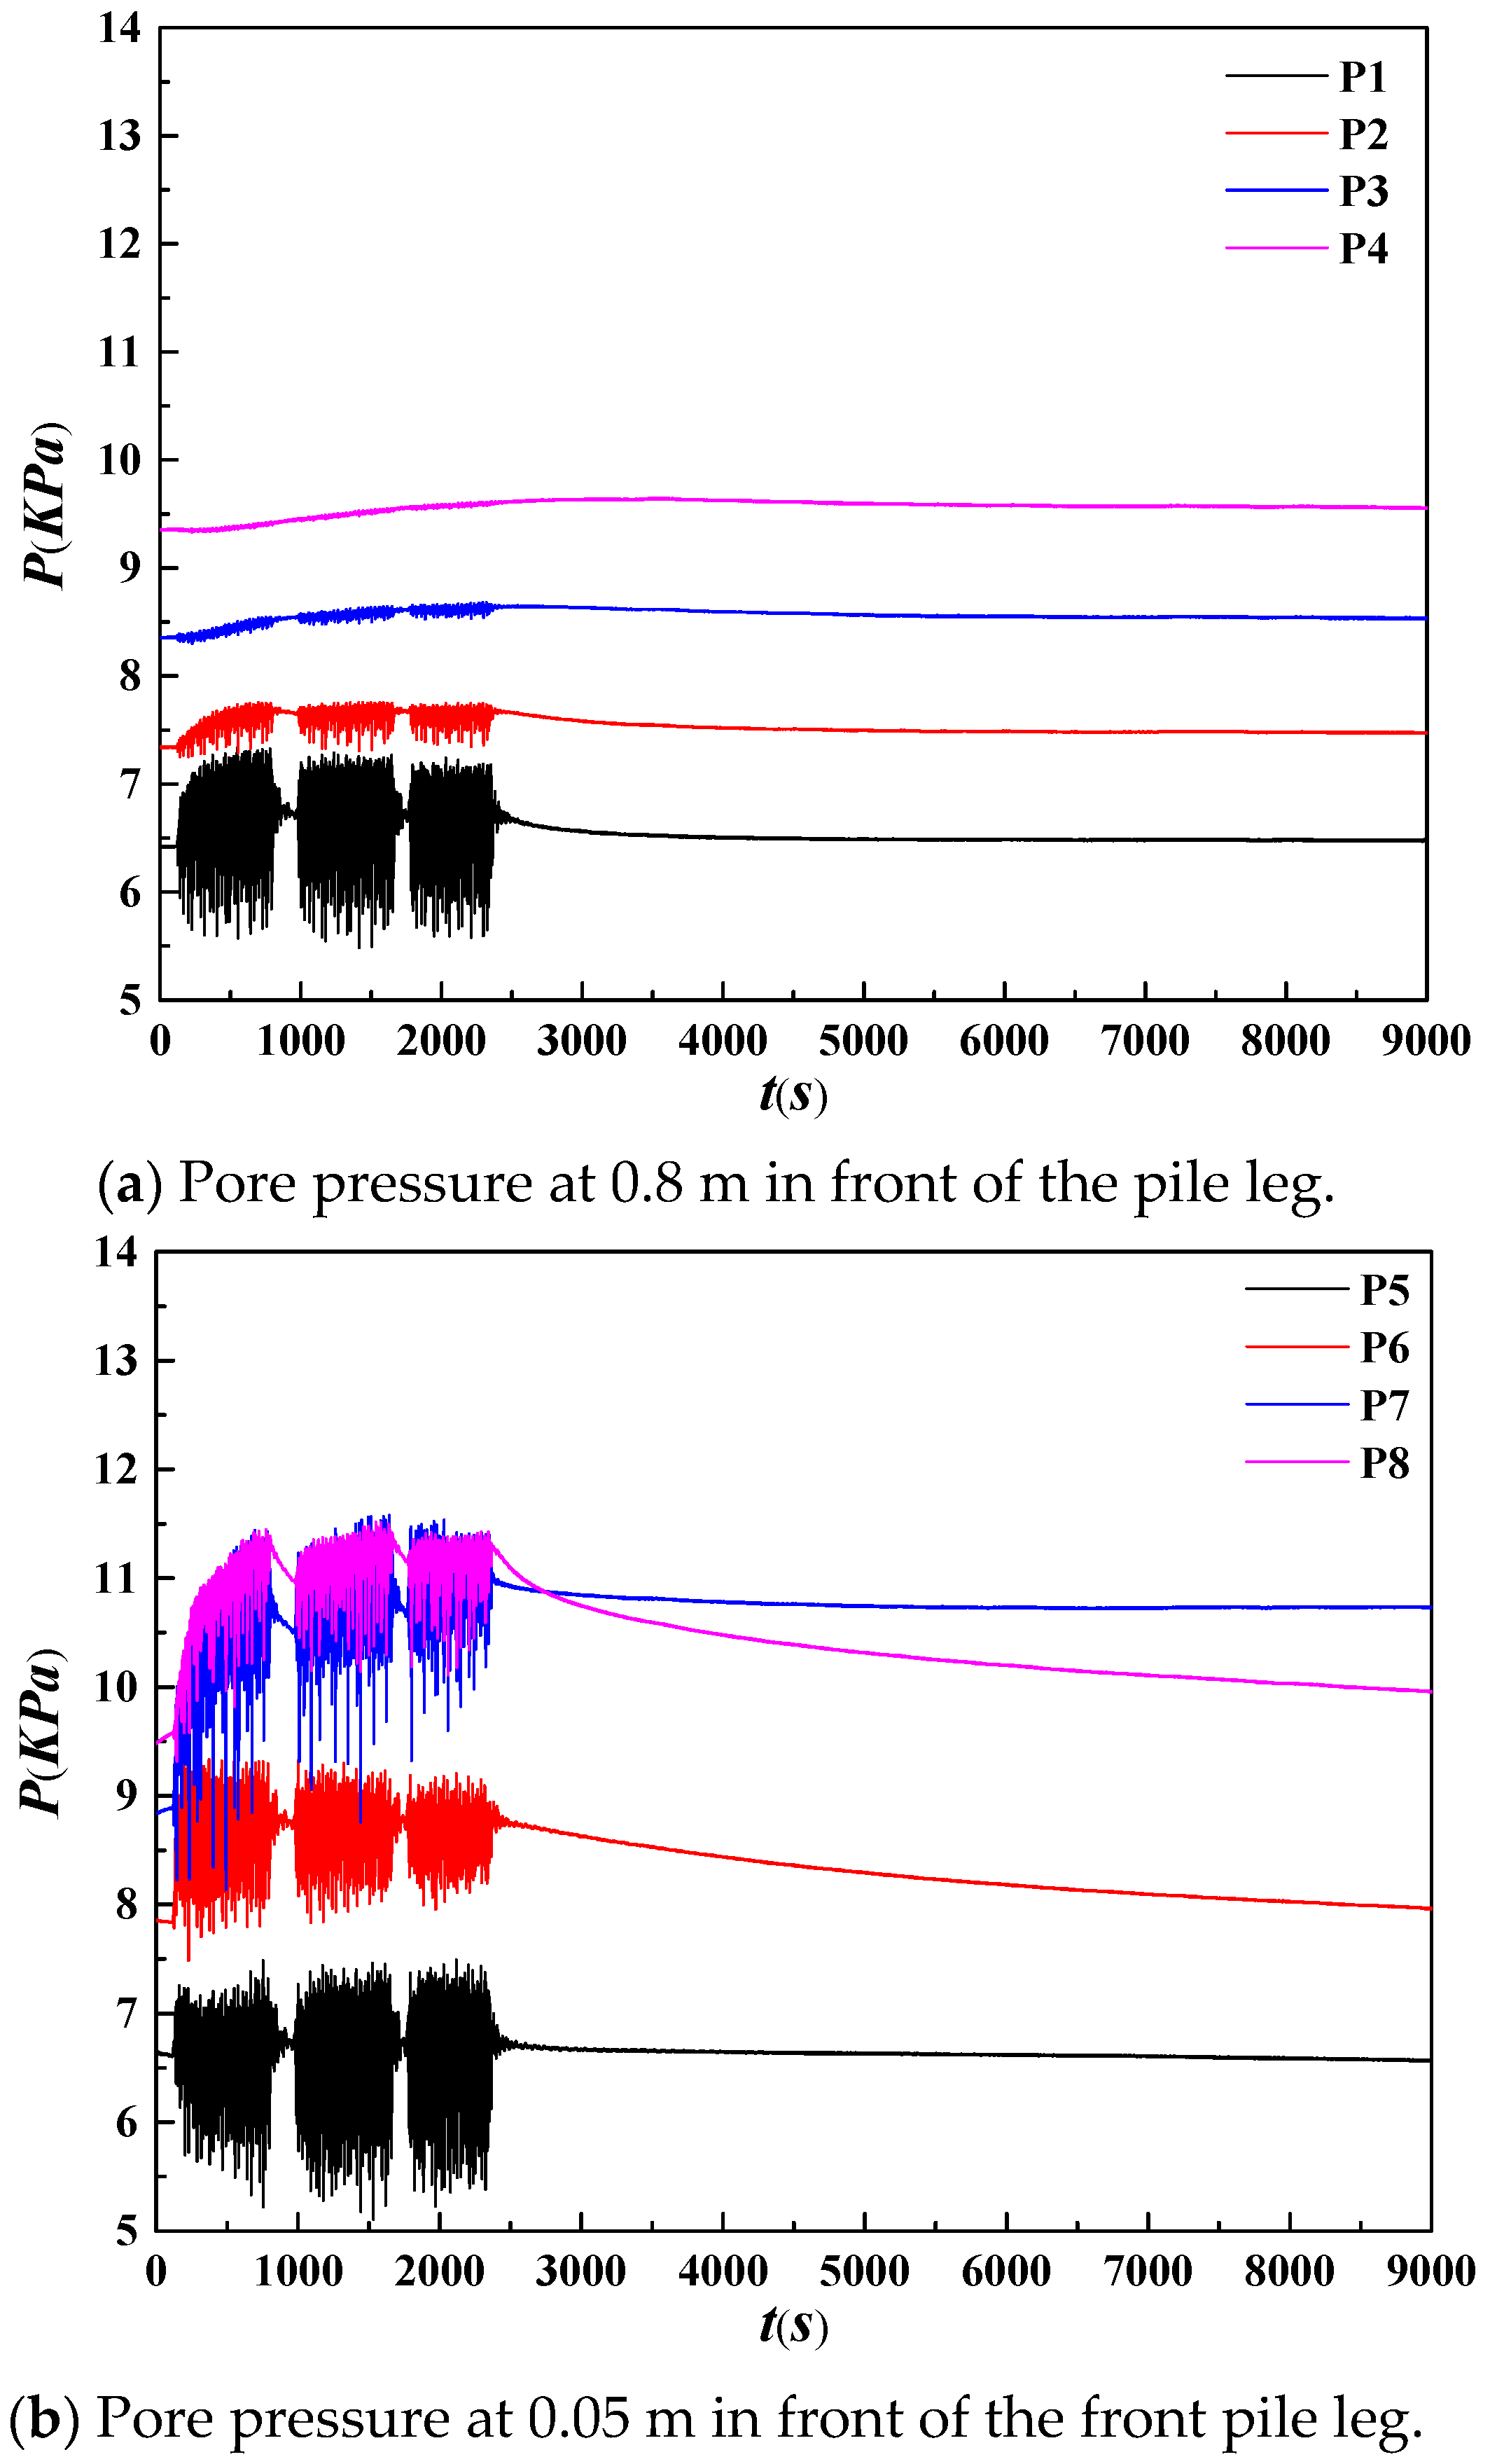
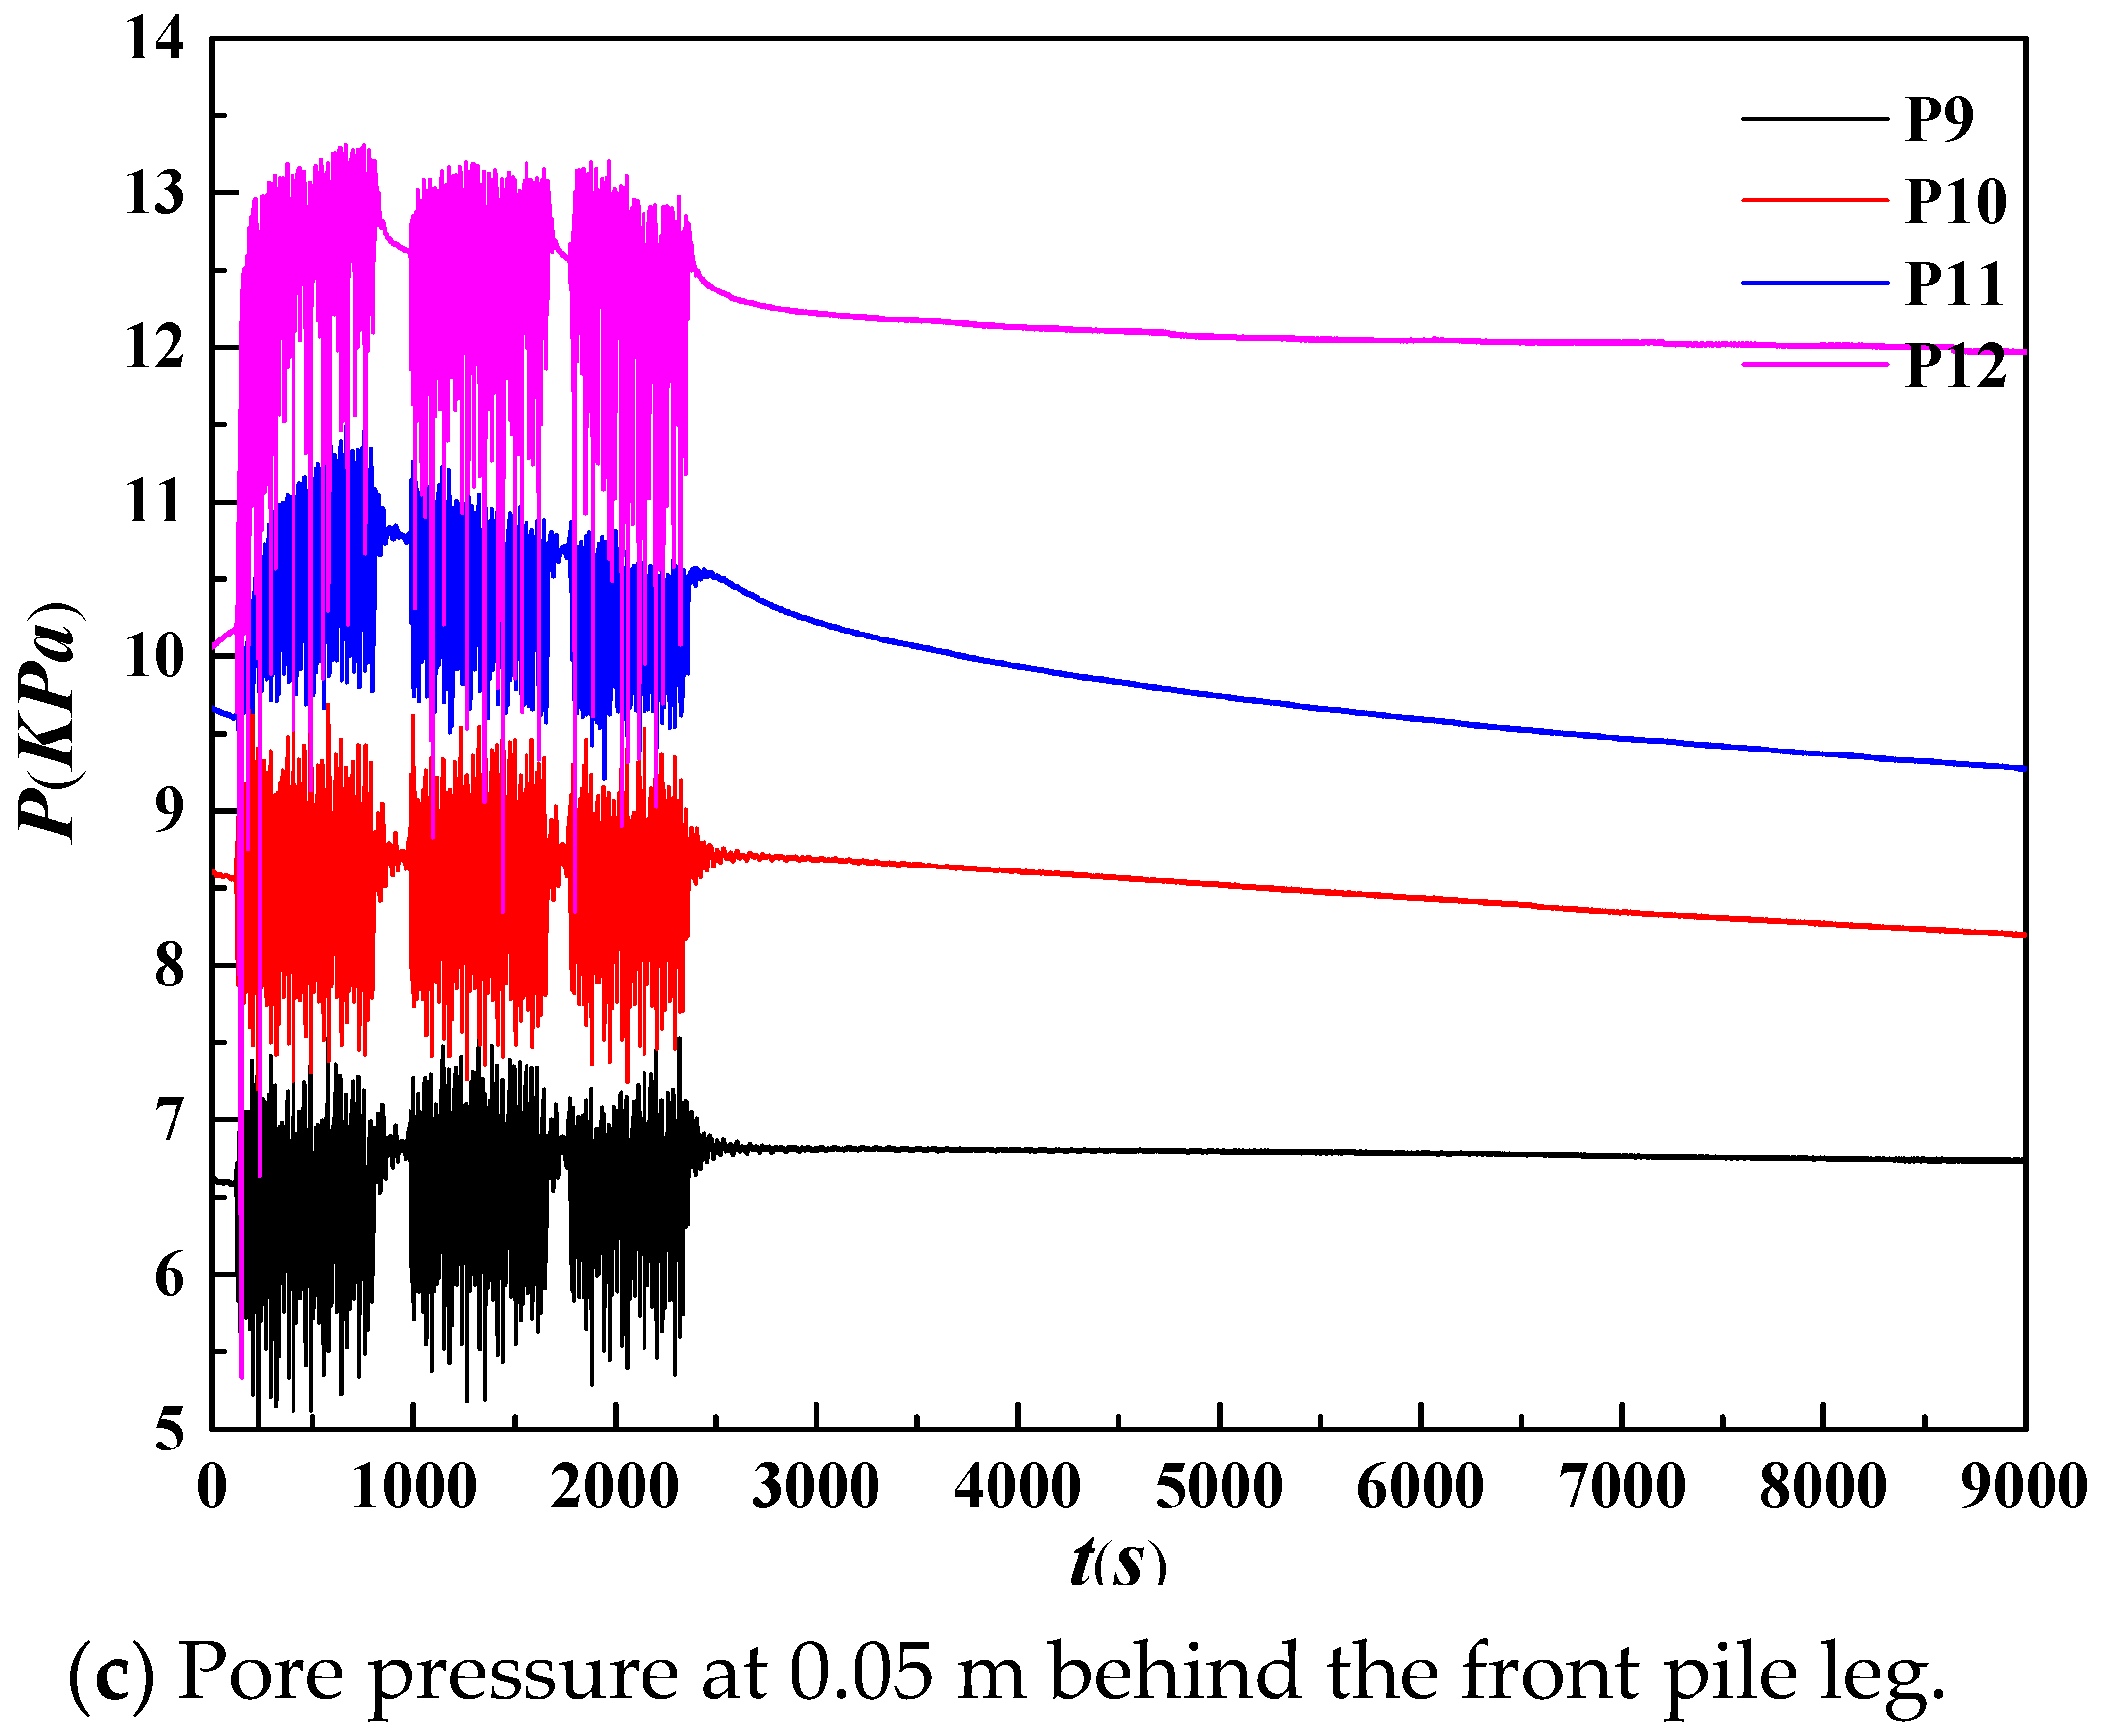
The pore pressure under the impact of waves decreased as the depth increased in model A, but increased as the wave height increased—an effect that has been overestimated in previous literature [25,36]. However, the experiment in this study revealed some interesting findings under waves of large wave height, which need to be further investigated. Figure 10 shows the history curve of the pore pressure in the seabed at different locations under waves ( H w = 62.5 cm, H s = 30.0 cm, T = 2.45 s); it shows the following: (a) At 0.8 m in front of the pile leg, the waves have a certain influence on the pore pressure of the seabed, and the influence gradually decreases with the increase in the depth; (b) At 0.05 m in front of the pile leg, in addition to the effect of the waves on the foundation bed, the platform produces a reciprocating motion under the action of the waves at this time, thereby squeezing the foundation bed in front of and behind the pile leg to a certain extent, which also increases the pore pressure at 0.05 m in front of the pile leg and causes it to be greater than the pore pressure at 0.8 m in front of the pile leg; (c) As for the pore pressure at 0.05 m behind the pile leg, due to the overall backward movement trend of the platform under the impact of waves, the squeezing force on the foundation bed is more significant than that at 0.05 m in front of the pile leg. Therefore, the rising amplitude of pore pressure at 0.05 m behind the pile leg is greater than that at other locations; (d) At 0.05 m and 0.5 m above and below the pile end, respectively, under the superimposed effect of the wave impact and the pile leg squeezing force, the pore pressure at the lower measuring points (i.e., P7, P8, P11, and P12) first increases and then gradually dissipates with time, while the soil near the pile leg becomes soft.

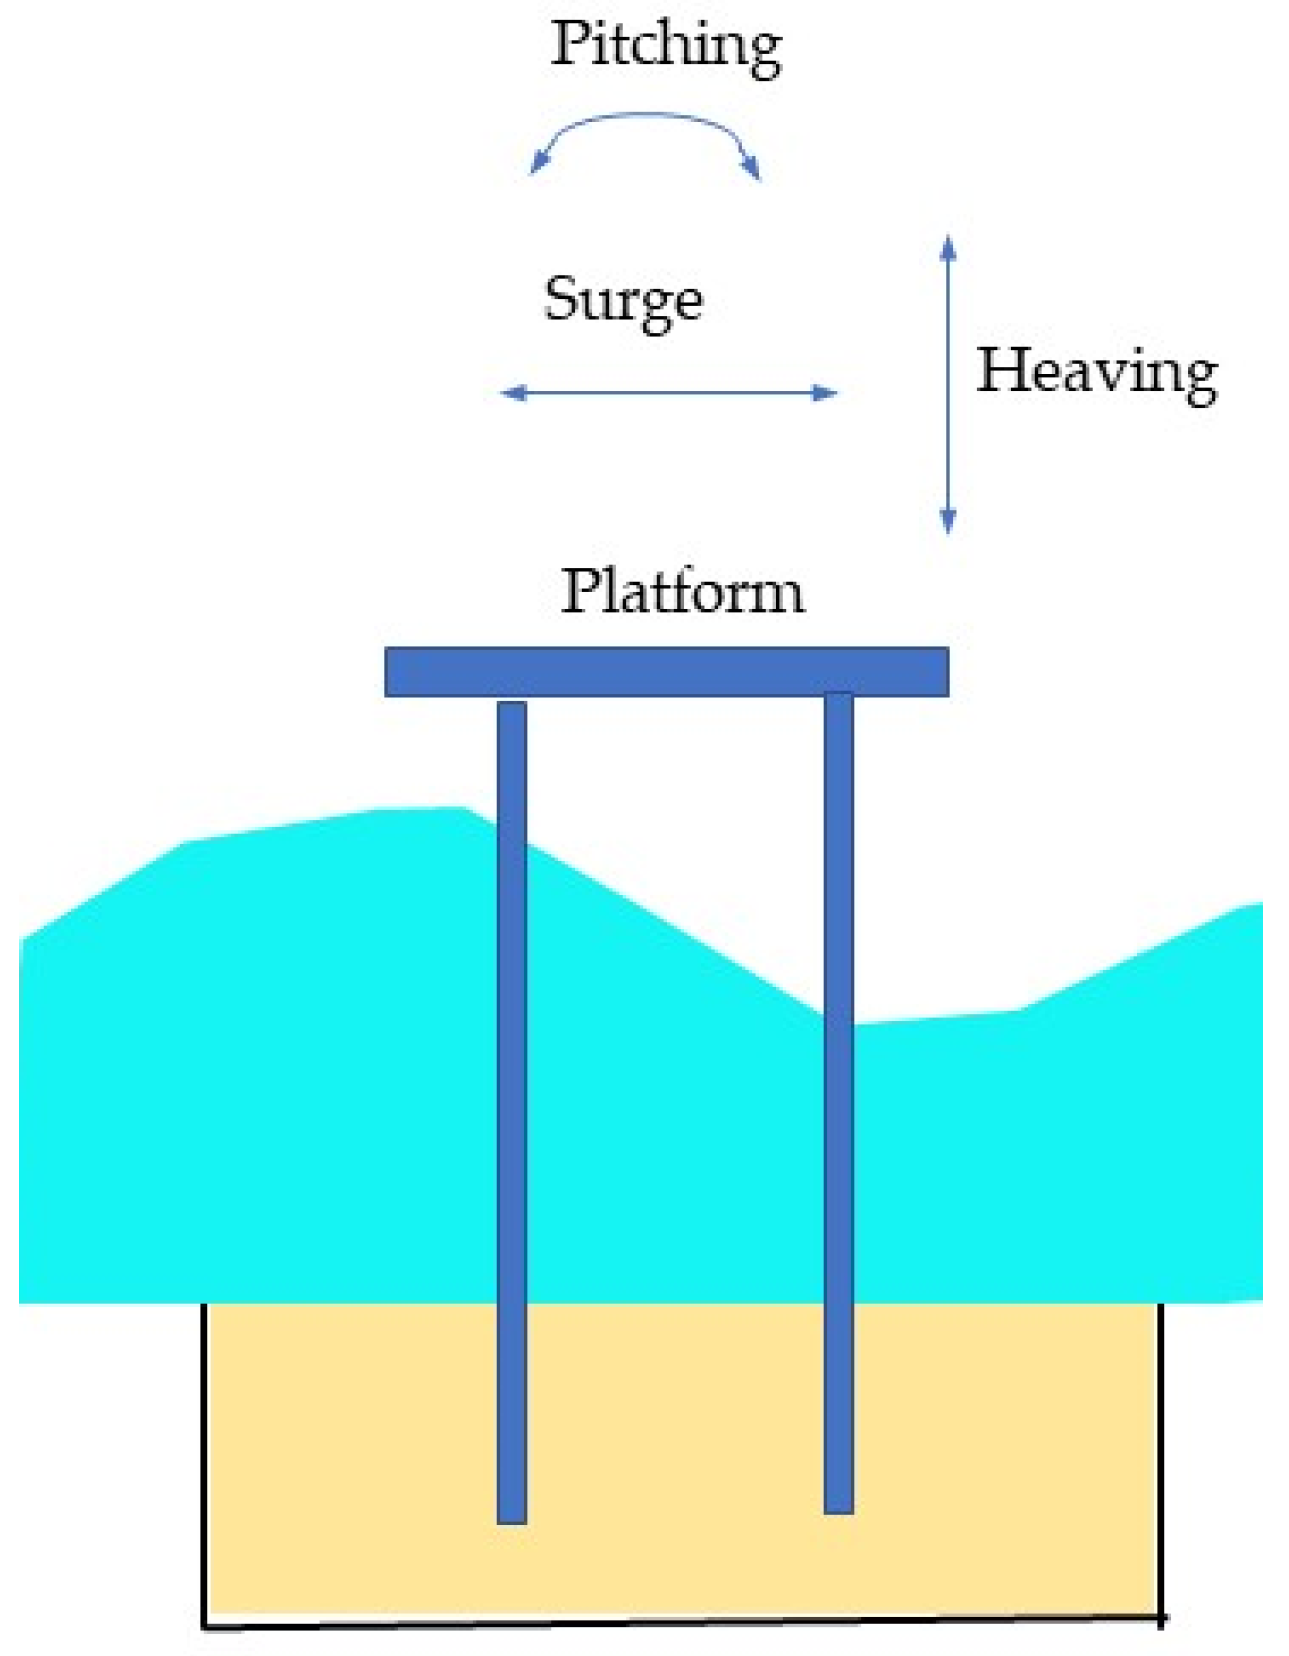
3.1.3. Motion Response

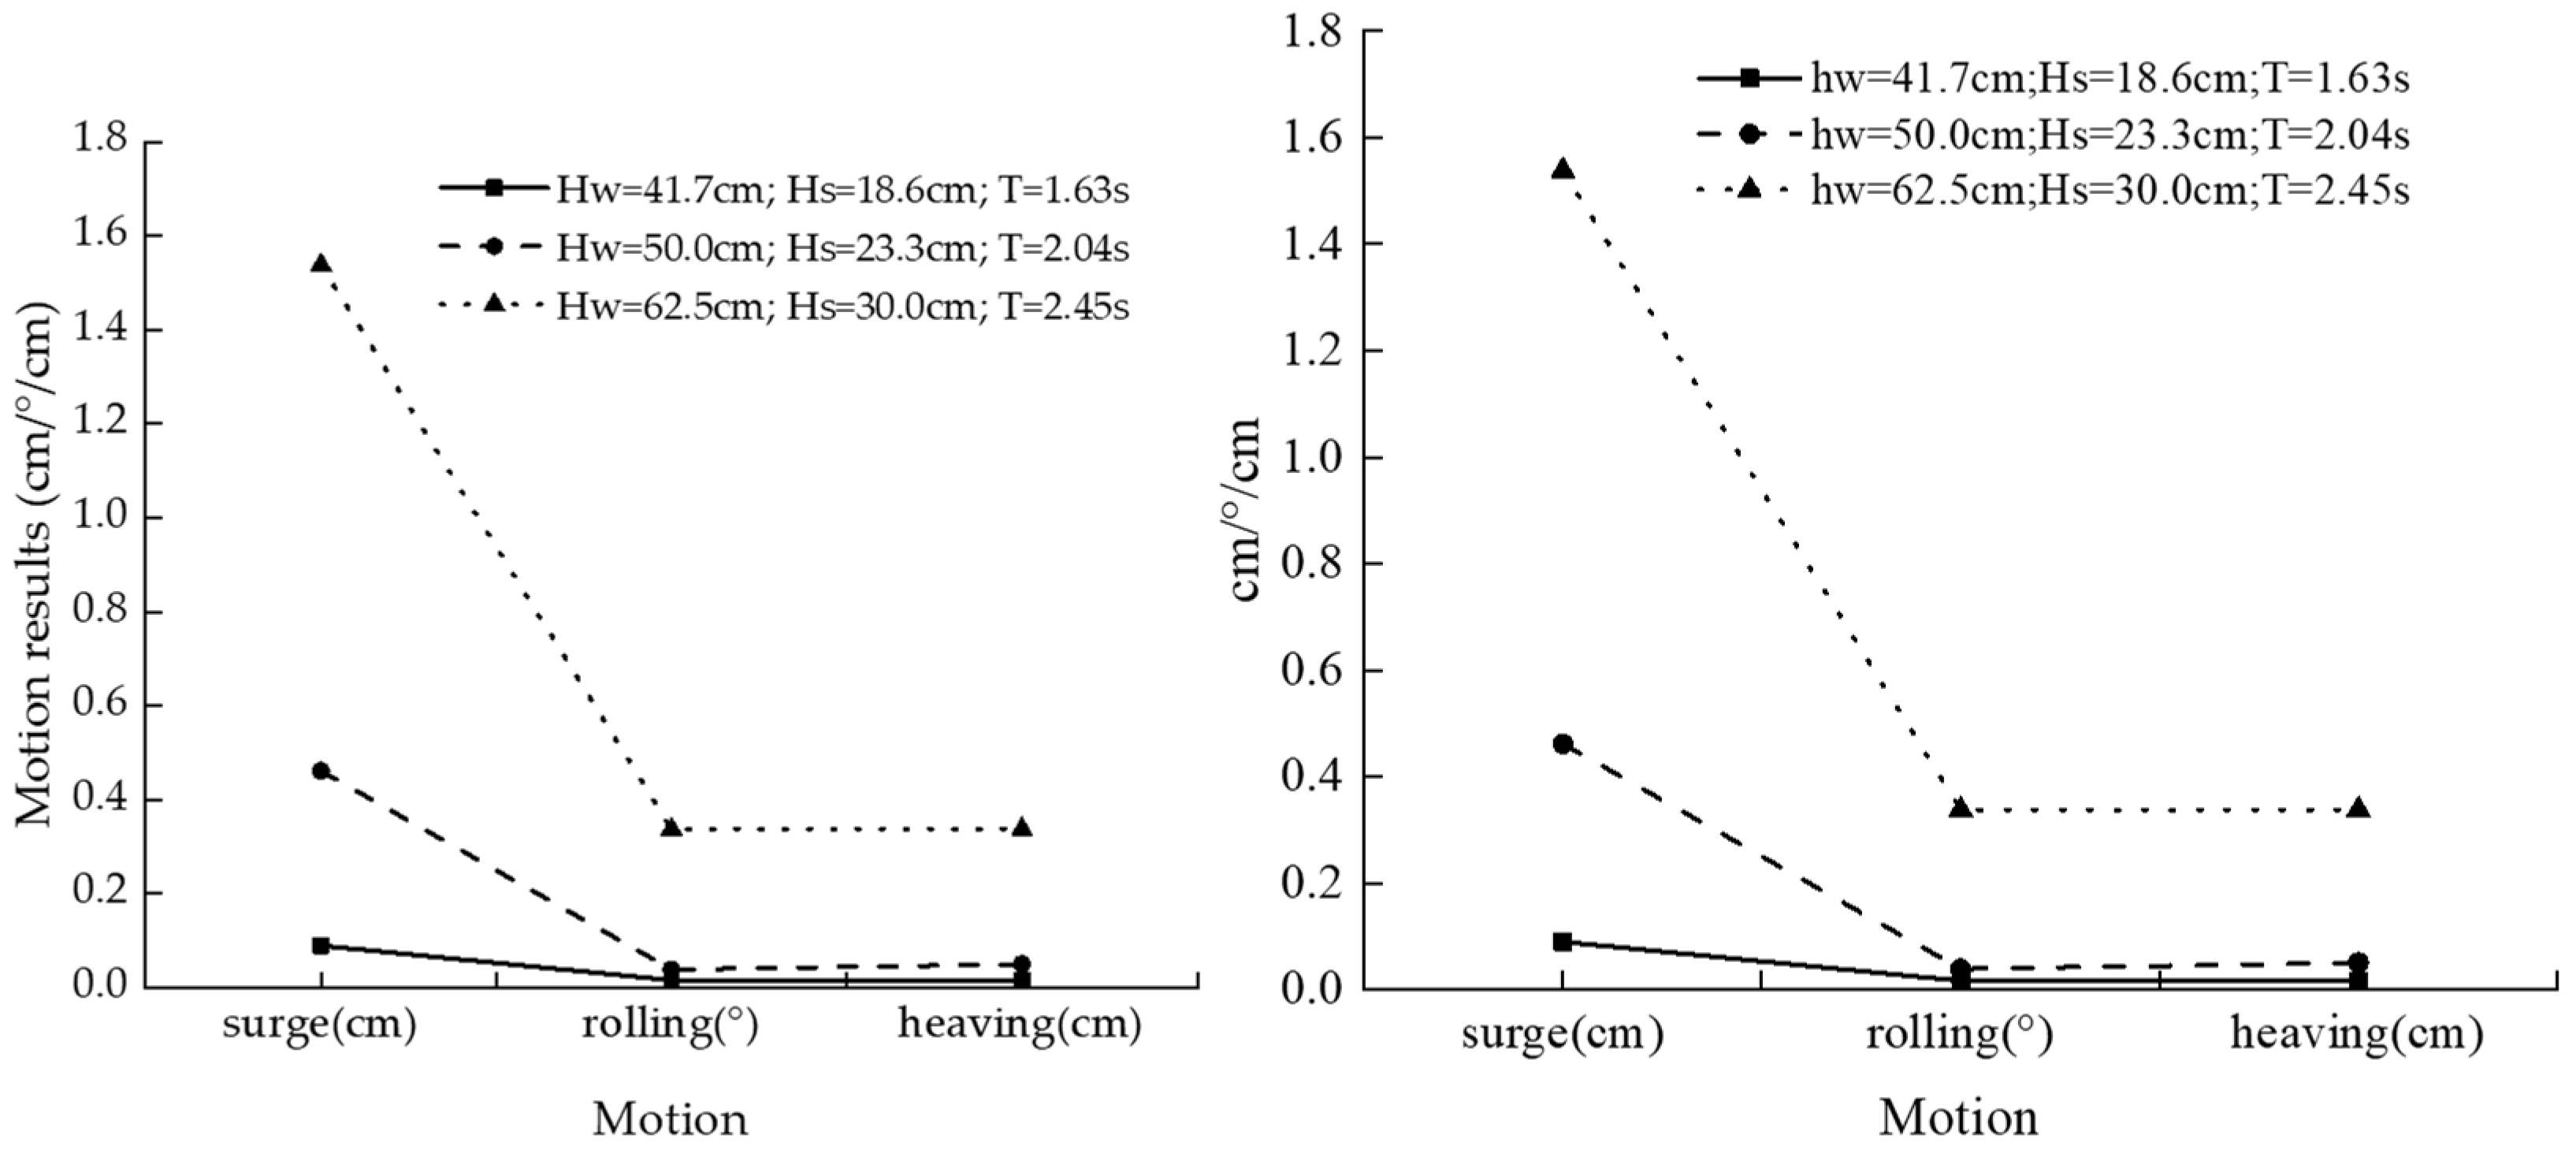
The motion of the jackup offshore platform under waves include rolling, surging, and heaving, as shown in Figure 11, where the rolling is perpendicular to pitching. The results of the movement test in the dynamic response simulation testing of the offshore platform structure under test waves show that when the height of a wave is small ( H s ≤ 18.6 cm), the platform does not produce significant motion under normal operating conditions. As shown in Figure 12, the platform produces significant motion under waves of large wave height: when the height of the input wave increases to 23.3 cm, the platform’s motion is mainly surging (along the propagation direction of the wave); as the height of the input wave increases to 30 cm, the platform not only produces significant longitudinal motion but also produces rolling and heaving. Thus, we can see that the amount of the platform’s motion depends critically on the height of the waves.

3.1.4. Acceleration

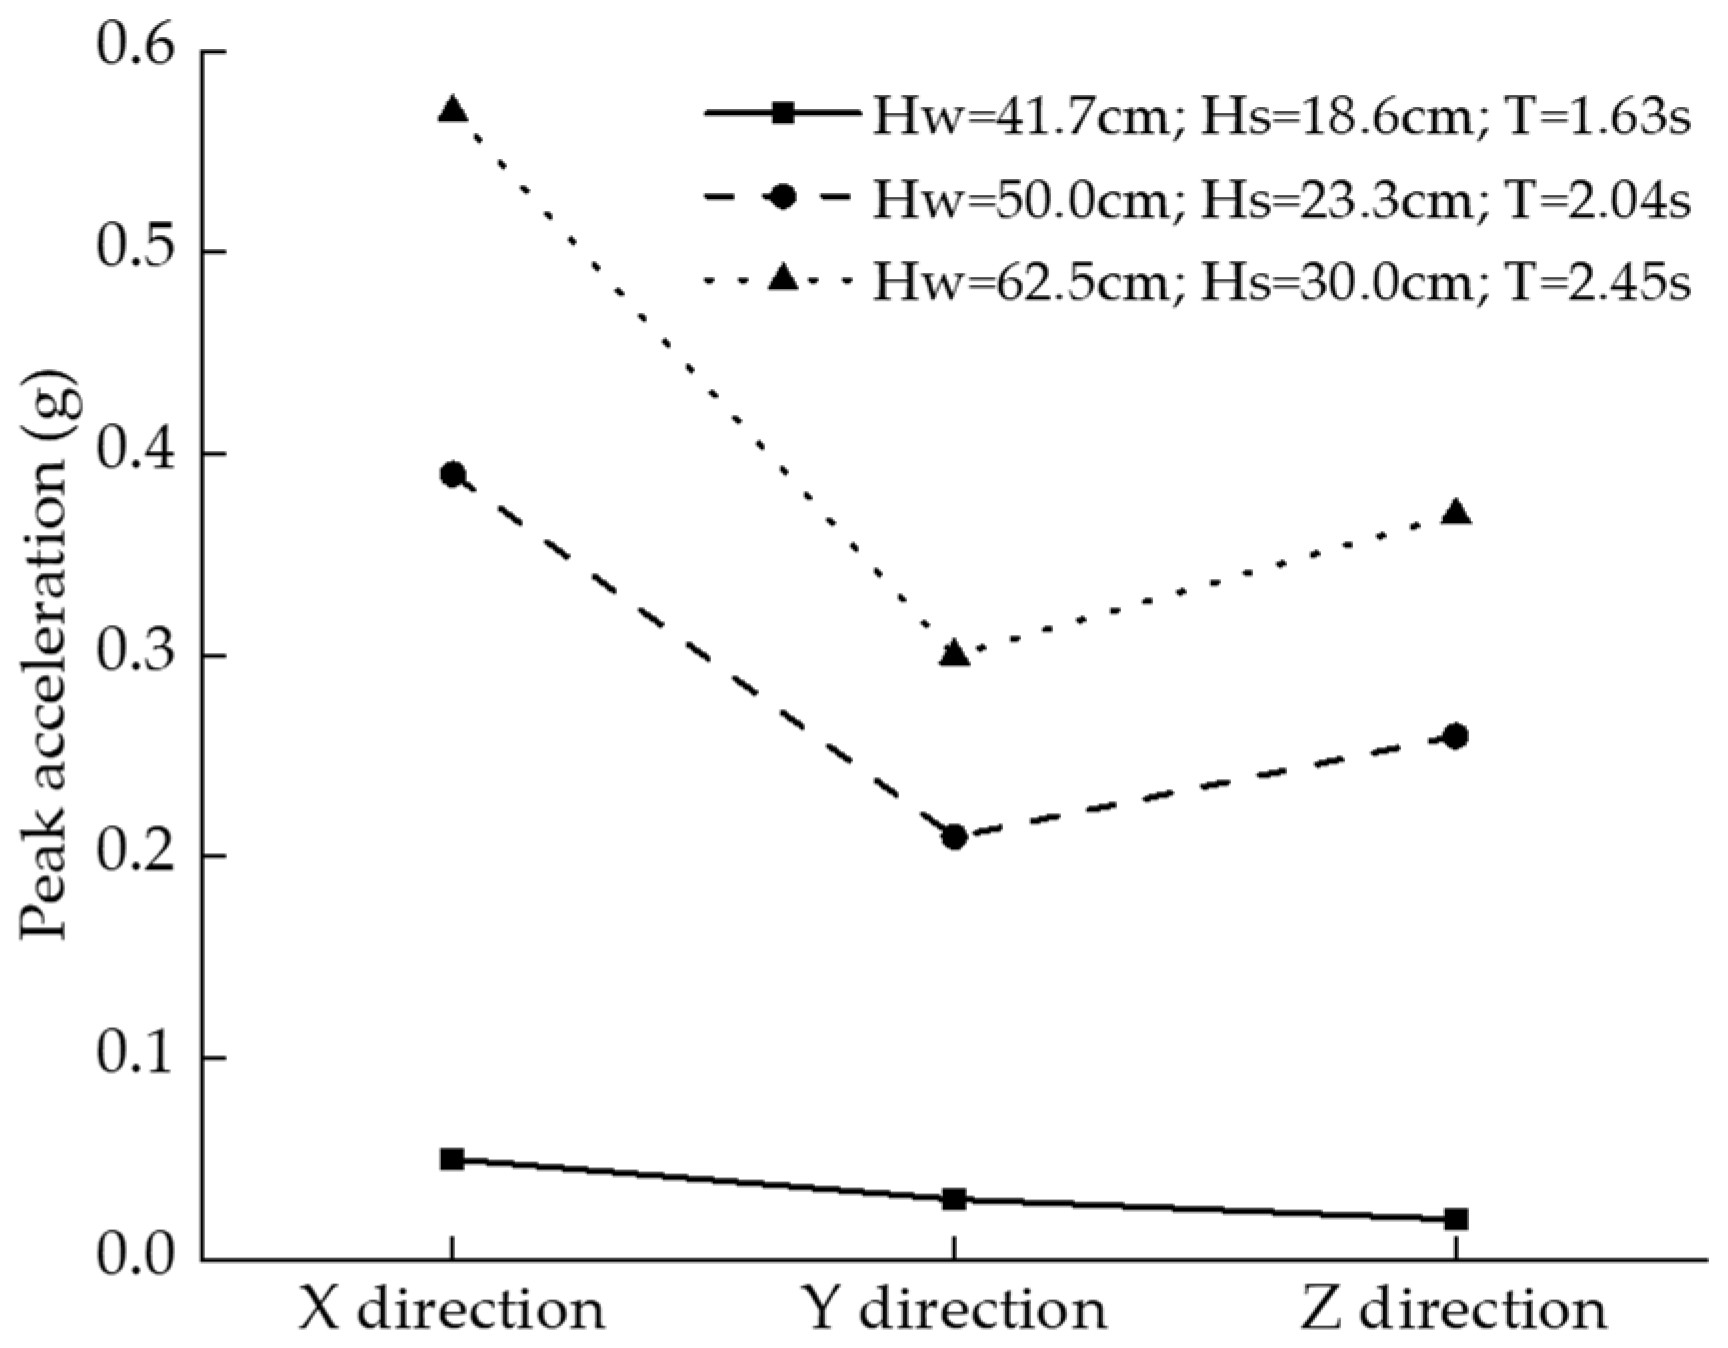
The results of the platform’s acceleration are essentially consistent with the results of the platform motion test. When the height of the input wave is small, the peak acceleration at the monitoring point generated by the platform under the conditional wave action is very small (i.e., effectively negligible), and the vibration direction is mainly in the longitudinal motion direction (i.e., the wave propagation direction). As the input wave changes to waves of large wave height, with the increase in the water’s depth and the height of the wave, the motion and the peak acceleration at the monitoring point on the top of the platform increase gradually. As shown in Figure 13, the maximum longitudinal acceleration is 0.57 g under waves ( H w = 62.5 cm; H s = 30.0 cm; T = 2.45 s). In addition to the longitudinal motion, the structural vibration direction also produces lateral vibration, and the maximum lateral acceleration is 0.3 g, which may be caused by the vortex-induced vibration in the lateral direction of the pile leg.

3.1.5. Analysis of Structural Stationary State

The stationary state of the platform structure was analyzed based on the test results of four parameters of the platform structure: wave pressure, pore pressure, motion amount, and acceleration. The results of the platform stationary state are shown in Table 4. When the height of the wave is small, the platform structure does not move. When the height of the wave is larger, the effect of the wave on the platform is significant, and the platform exhibits obvious shaking. Based on the above test results, it can be seen that when the test water depth is ≤41.7 cm and the wave height is less than 12.5 cm, the platform is generally stationary. In contrast, the platform is moving and shakes under waves of large wave height.

3.2. Simulation Test Results of the Coupling Effect of the Offshore Platform, Tower, and Seabed under Wave Impacts

3.2.1. Dynamic Characteristics of Towers

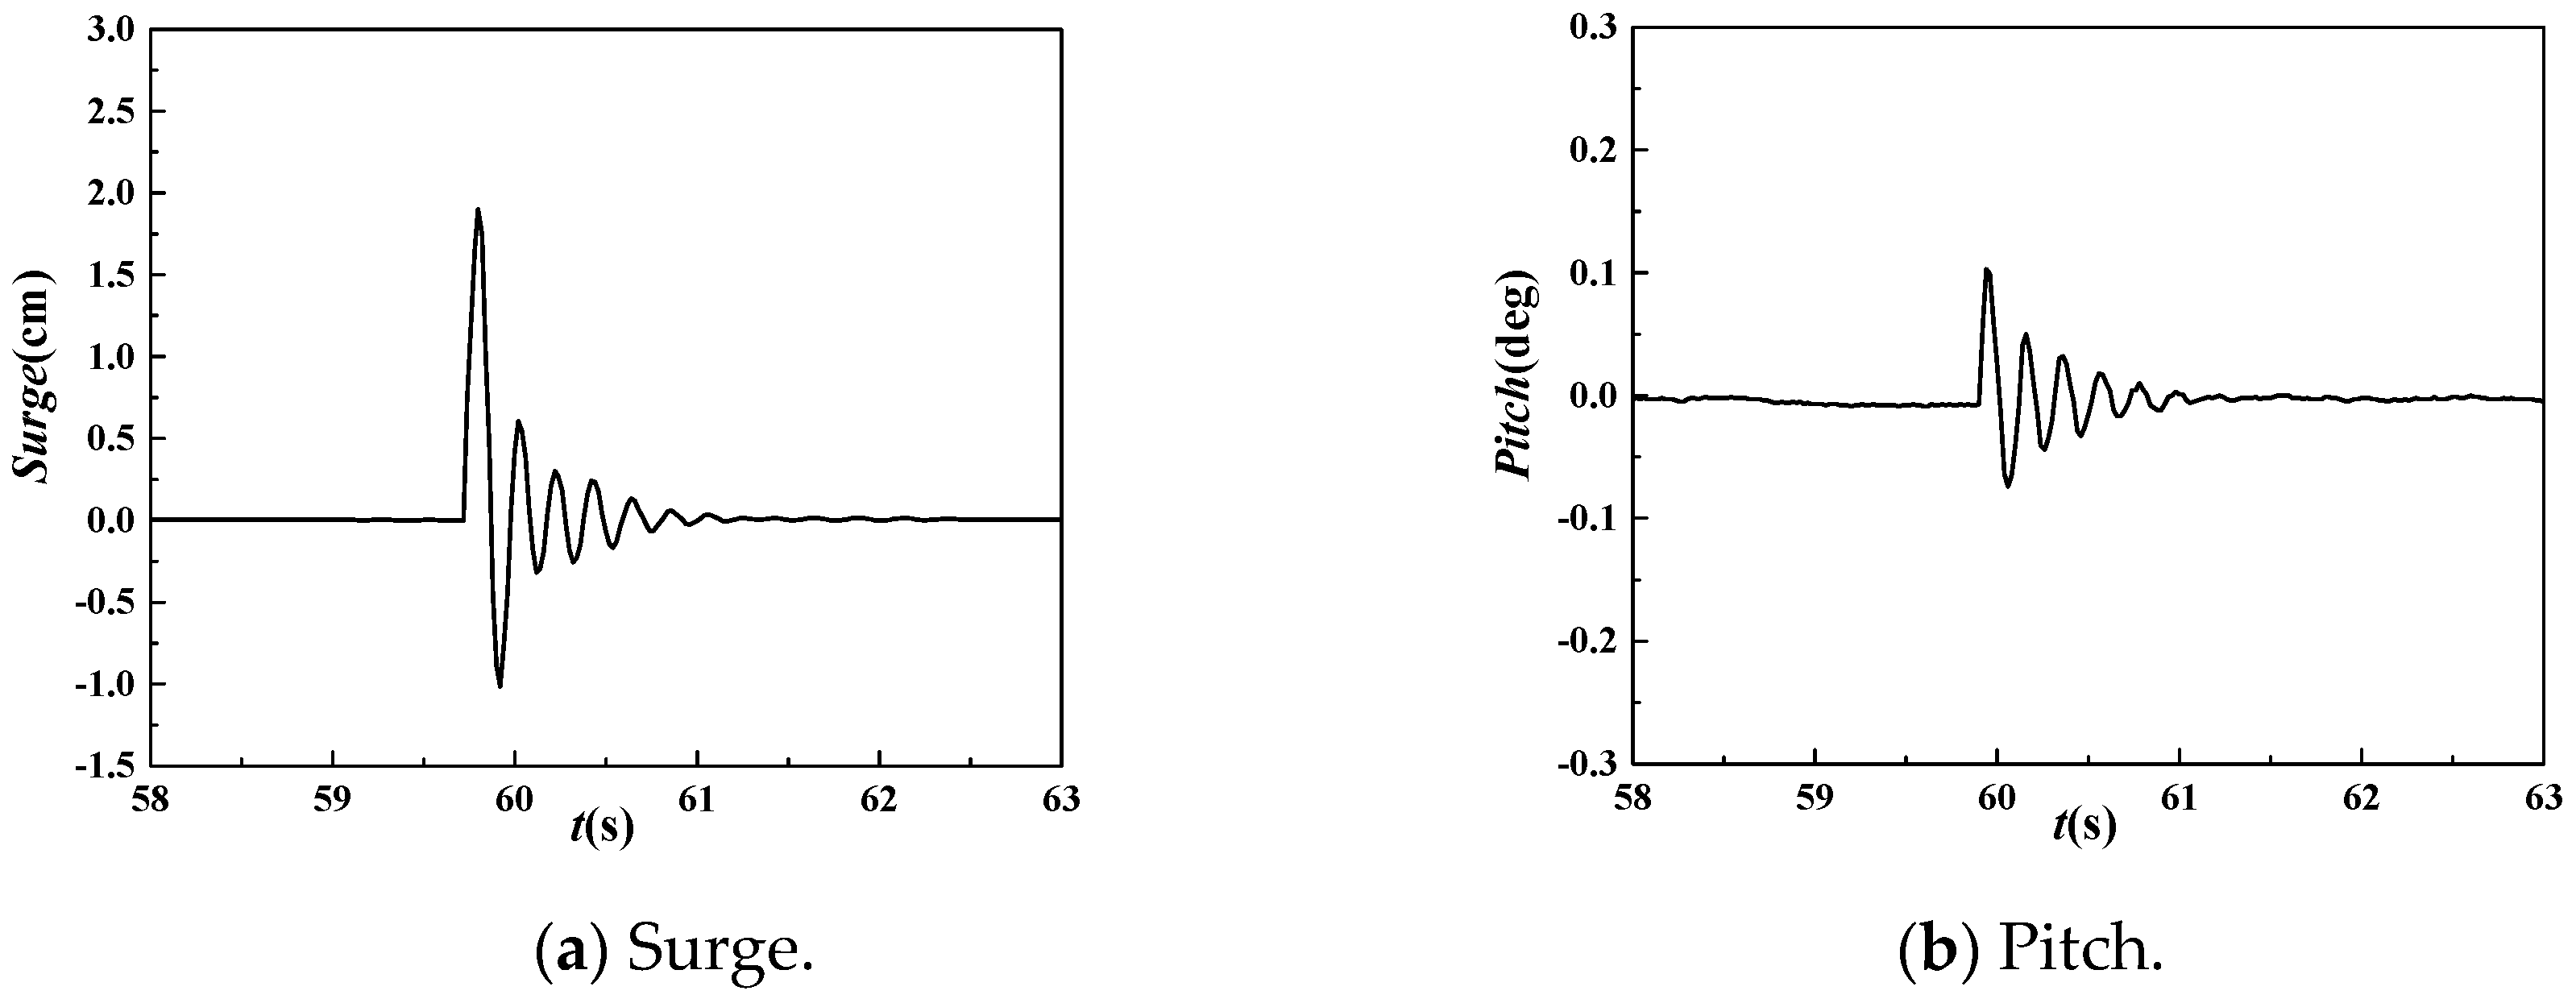
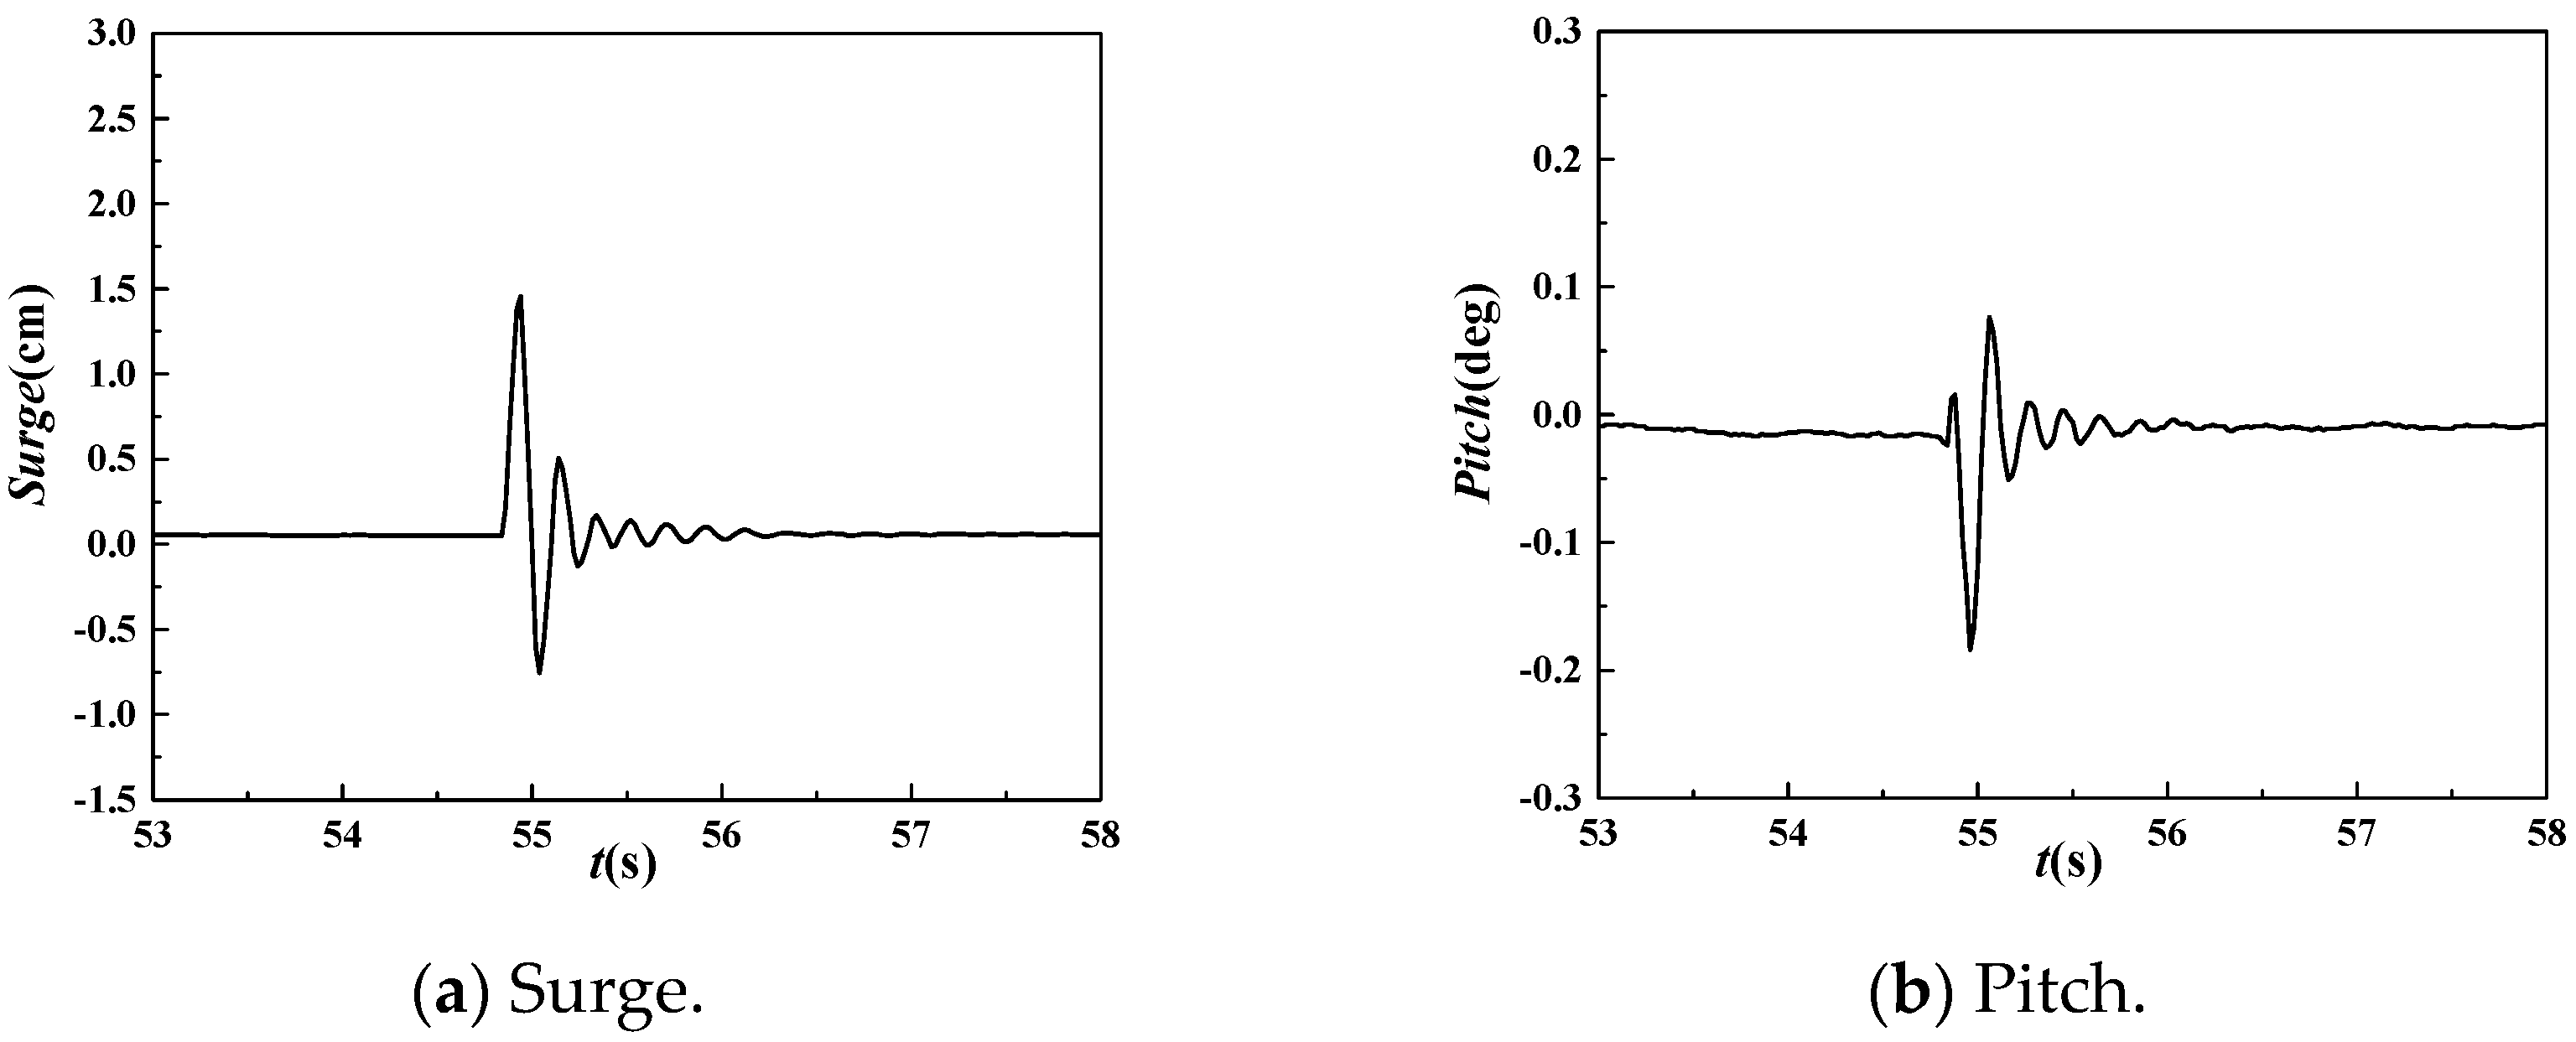
In the simulation test of the coupling action of the jackup offshore platform, tower, and seabed under wave impacts, the tower devices on the platform were divided into two types: undamped tower (model B) and damped tower (model C). The tower models are shown in Figure 2. Before the test of the jackup offshore platform models with towers under the impact of waves, their natural vibration period and equivalent damping were tested. Figure 14 and Figure 15 show the natural vibration curves of the tower structure without a damping device and with a damping device, respectively. The surge and pitch of the tower with the damping device are noticeably smaller than those of the tower without the damping device. Using spectral analysis, the natural vibration period and the equivalent damping of the two structures were derived, as shown in Table 5, which also shows that the damping device has significantly reduced the dynamic characteristics of the towers. The experiment results show that the damping device has an obvious influence on the dynamic characteristics and motion response characteristics of the tower. The natural vibration period of the tower with the damping device is smaller than that of the tower without the damping device, while the relationship between the equivalent damping values is the opposite.

3.2.2. The Motion of the Towers

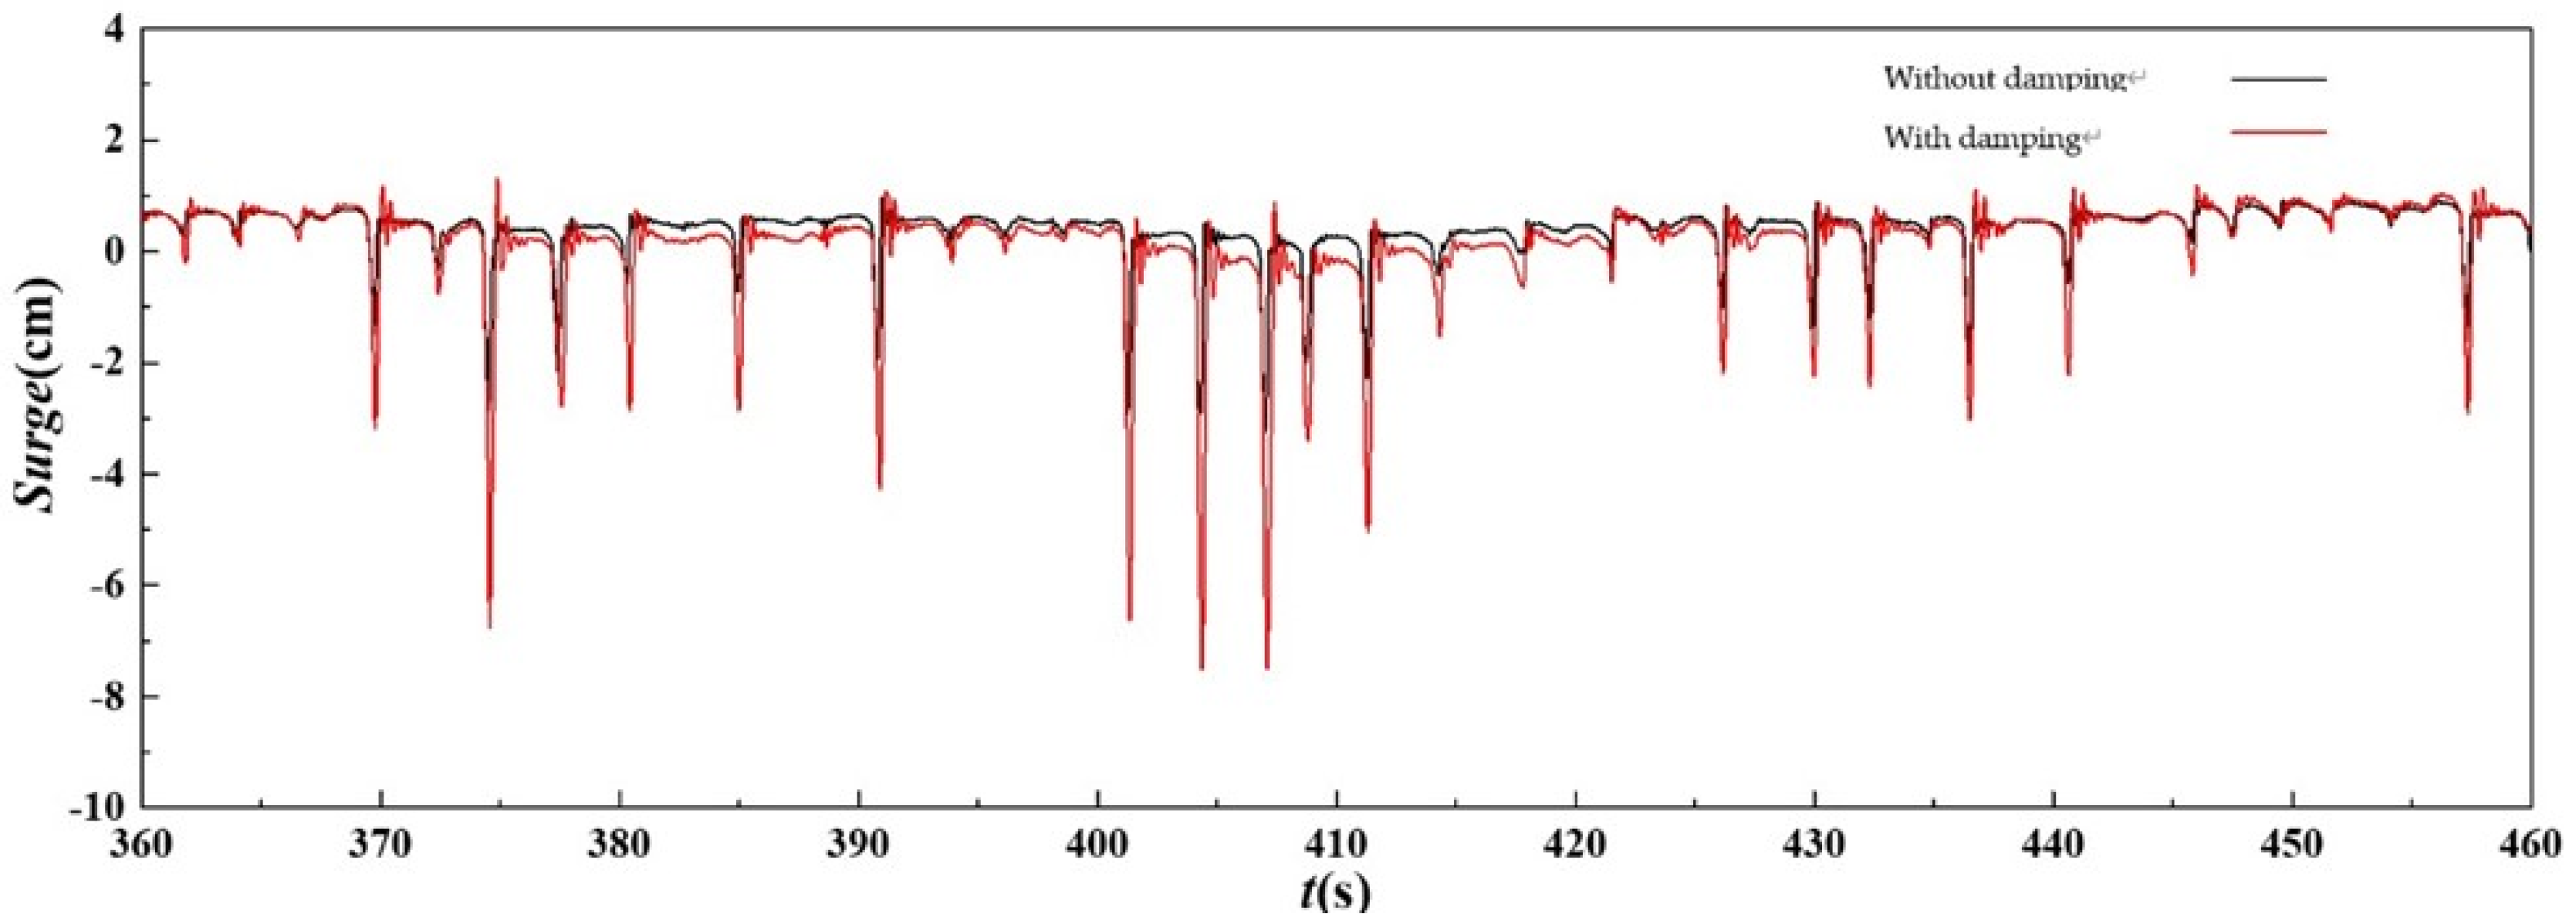
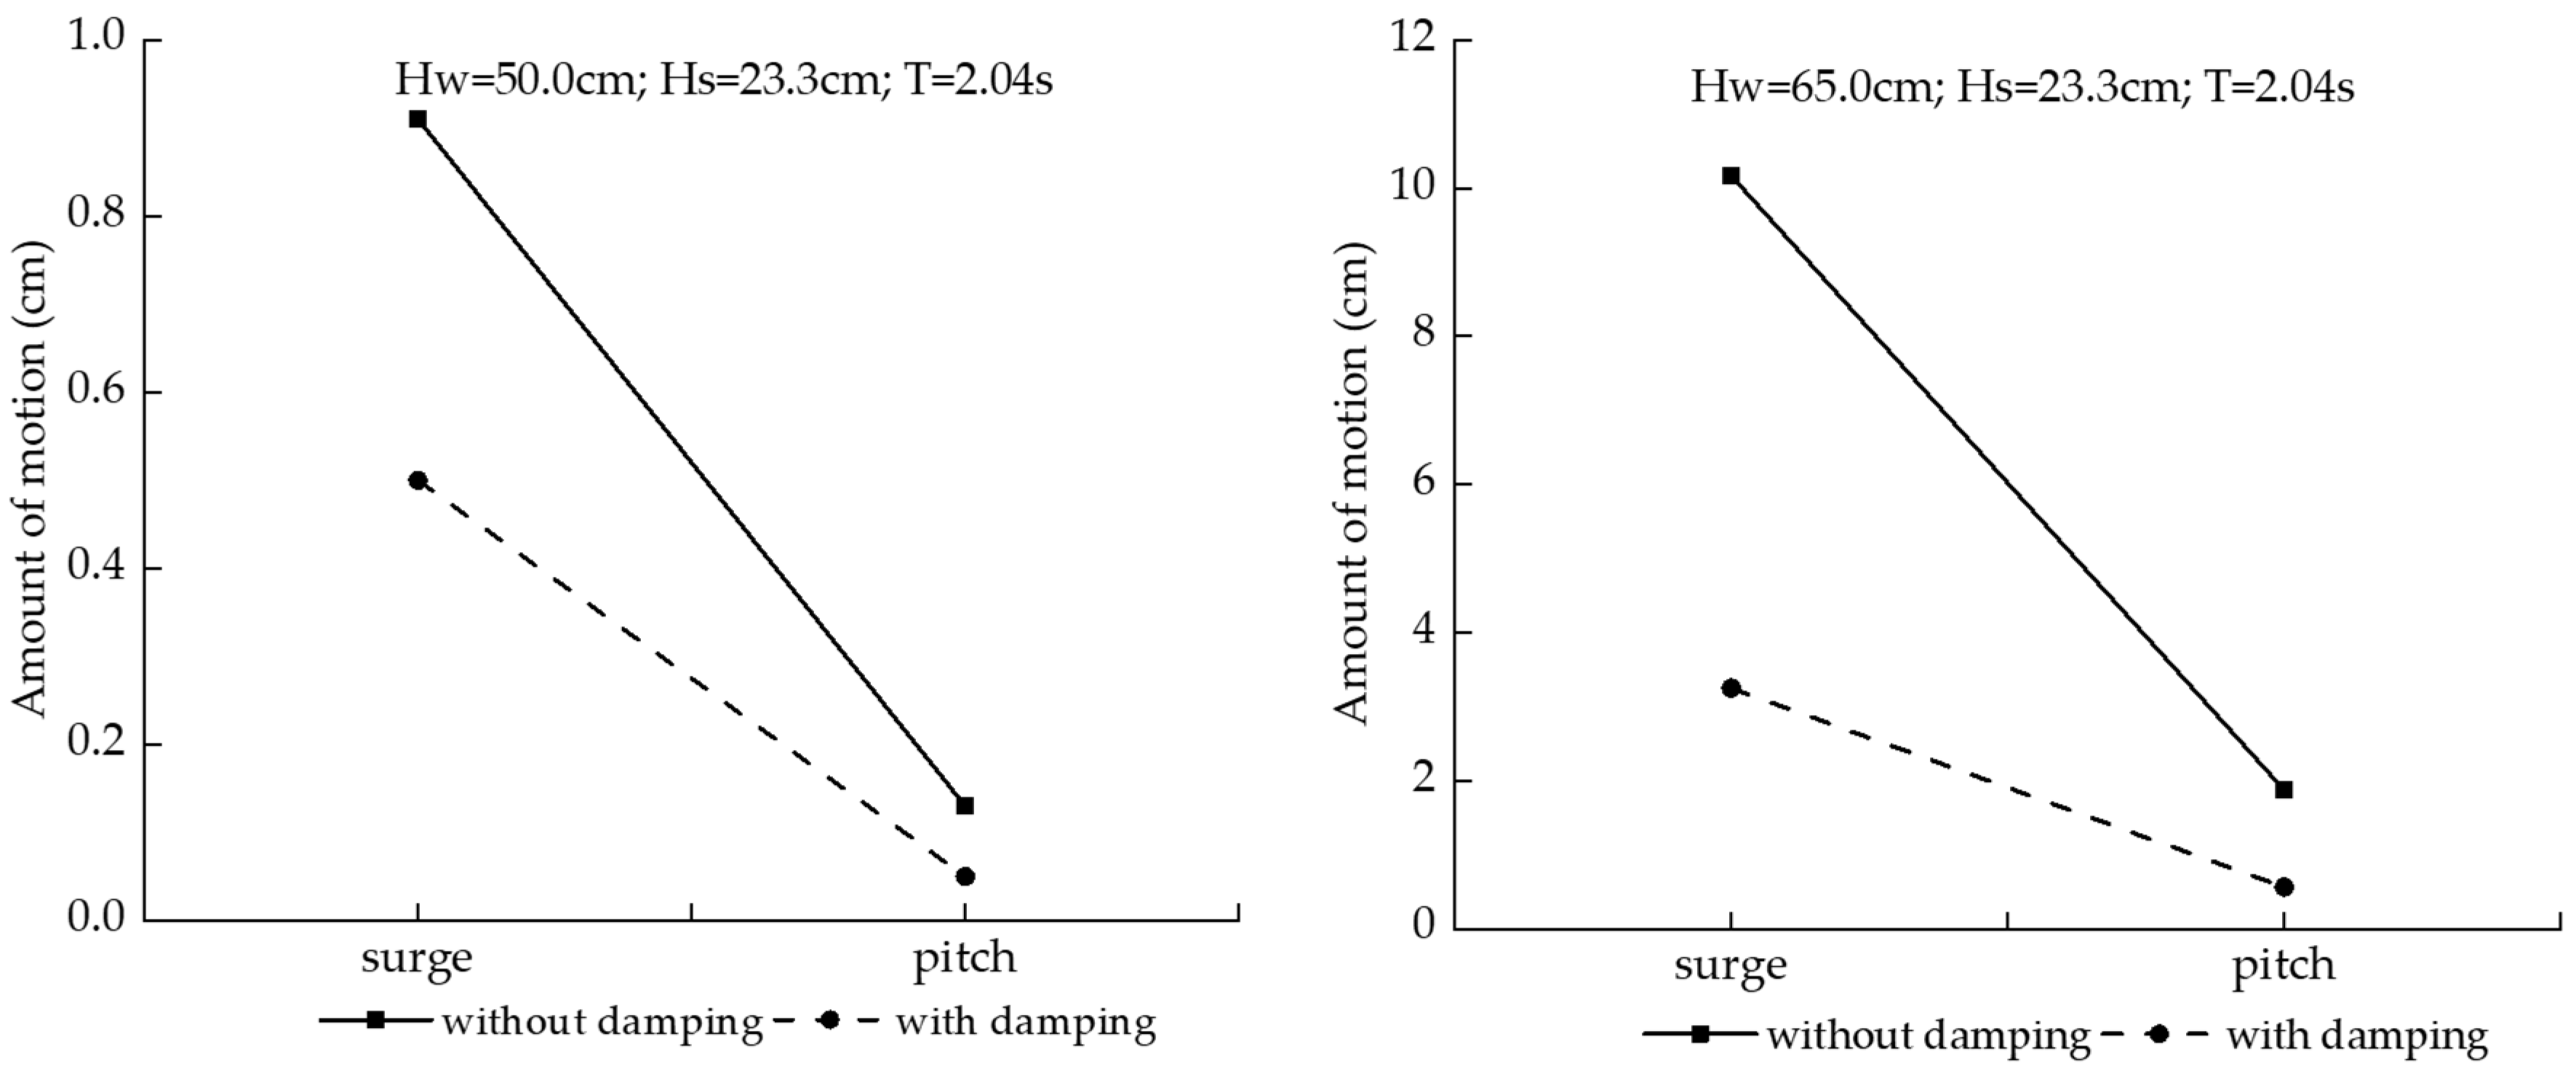
The experimental results show the differences between the tower without the damping device and the tower with the damping device under the same wave action. Taking the motion results of the towers under waves ( H w = 62.5 cm, H s = 30.0 cm, T = 2.45 s), for example, the comparison of the longitudinal motion history of the tower without the damping device and the tower with the damping device is shown in Figure 16. Under the same wave, the motion response of the tower with the damping device is significantly smaller than that without damping device. The longitudinal motion of the tower without the damping device is 3.13 times that of the tower with the damping device, and the pitch motion of the tower without the damping device is 3.34 times that of the tower with the damping device (see Figure 17).

3.2.3. Acceleration of the Towers

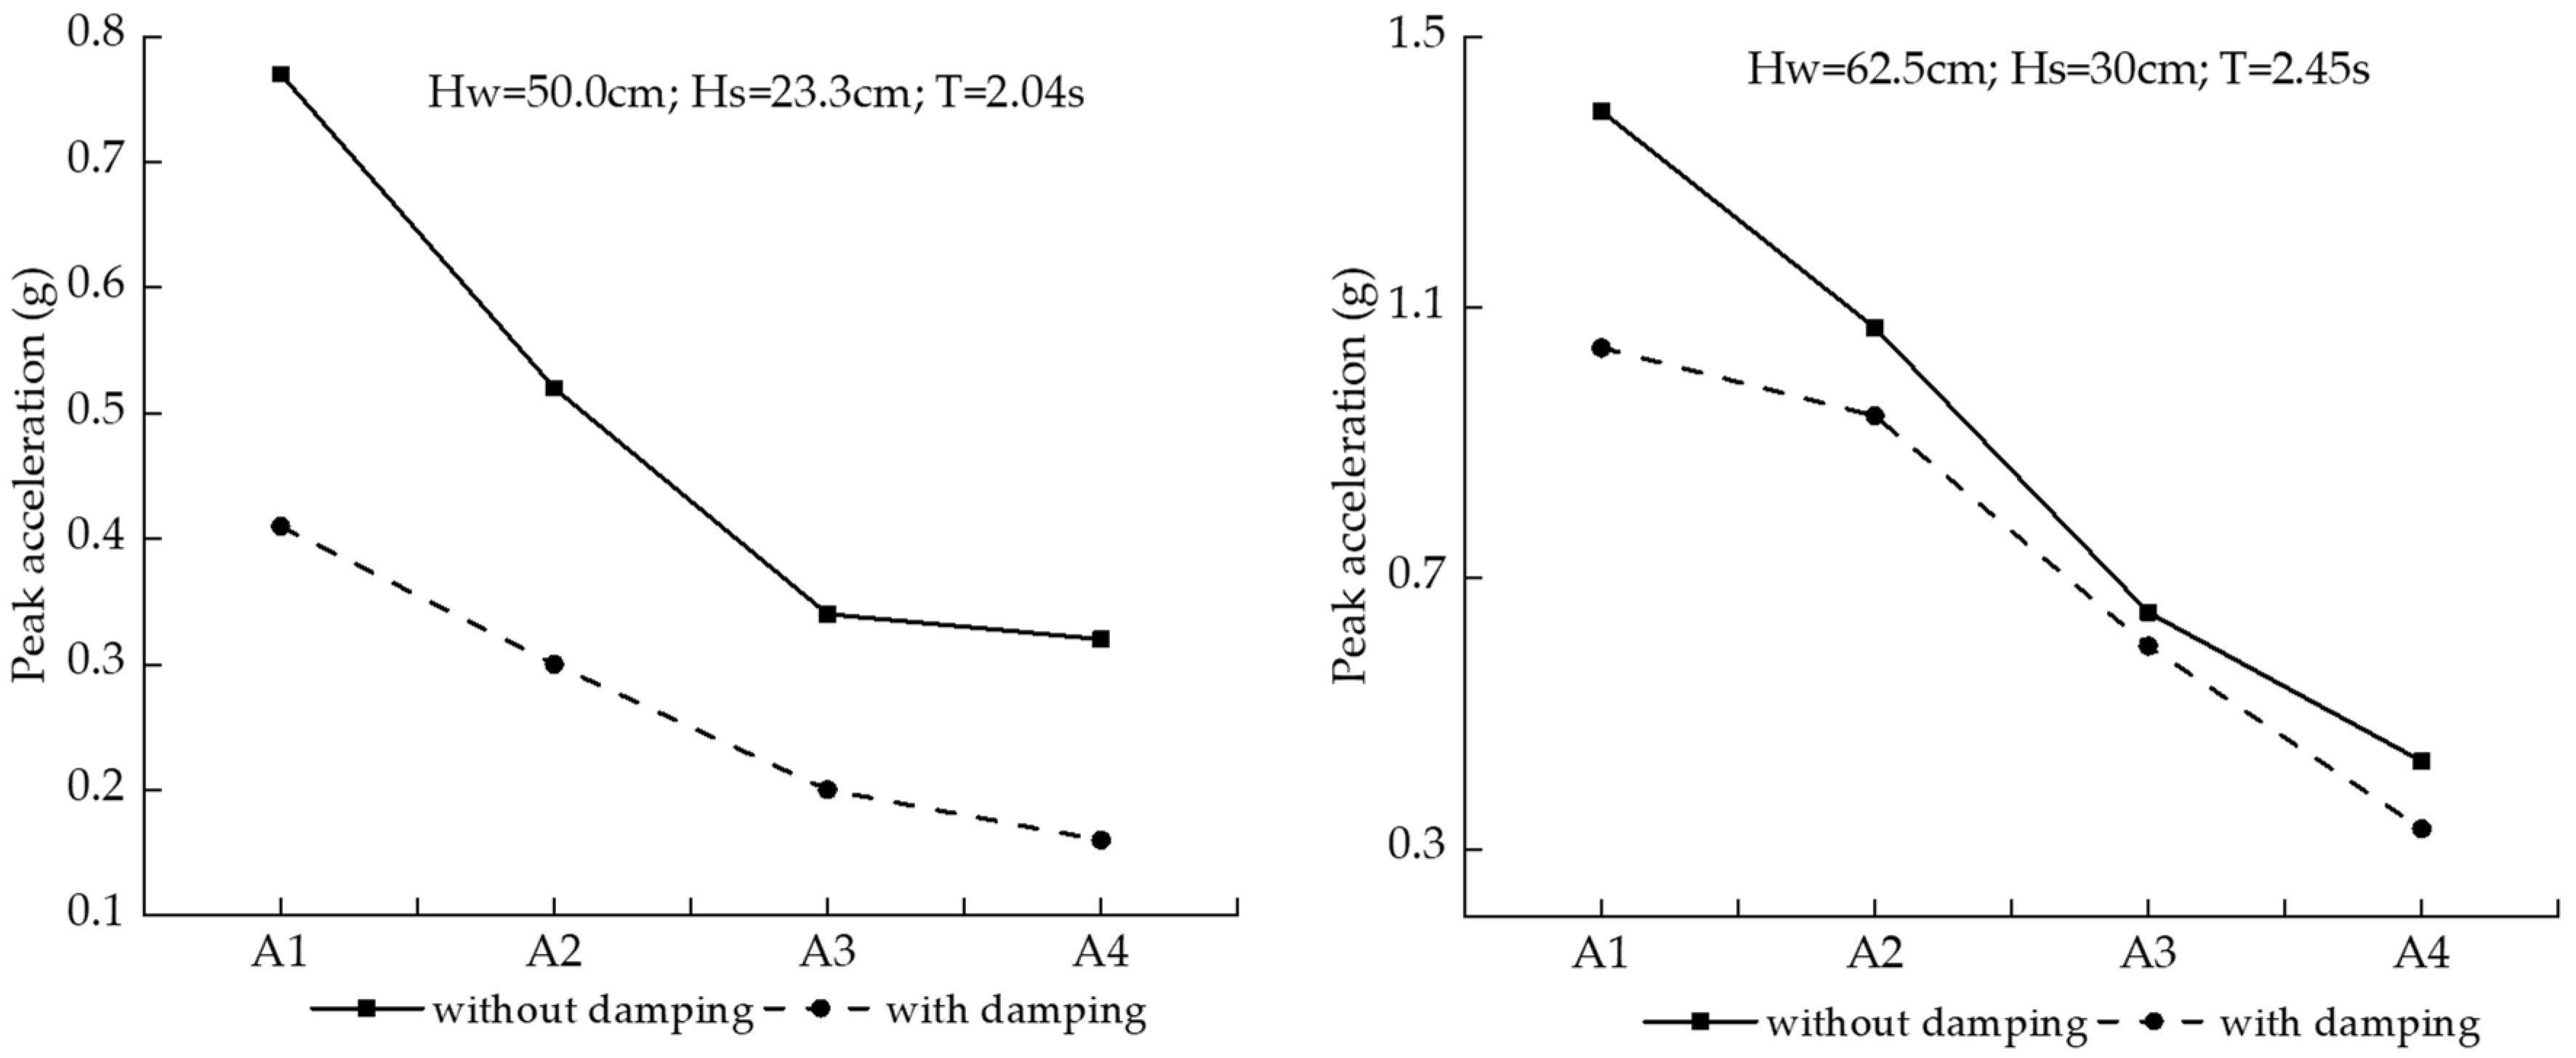
In the simulation of the coupling action of the jackup offshore platform, tower, and seabed under wave impacts, four acceleration sensors were arranged at equal intervals on the tower device on the platform. (The top acceleration sensor A1 and the bottom acceleration sensor A4 were positioned on the top of the tower and the upper surface of the platform, respectively; the others were at the middle of the tower.) The test results show that (a) the acceleration of the tower structure is significantly greater than that of the platform structure; (b) the acceleration of the tower structure decreases gradually with the height of the tower; and (c) the acceleration of the tower structure with the damping device at different heights is significantly lower than that of the tower structure without the damping device (see Figure 18).
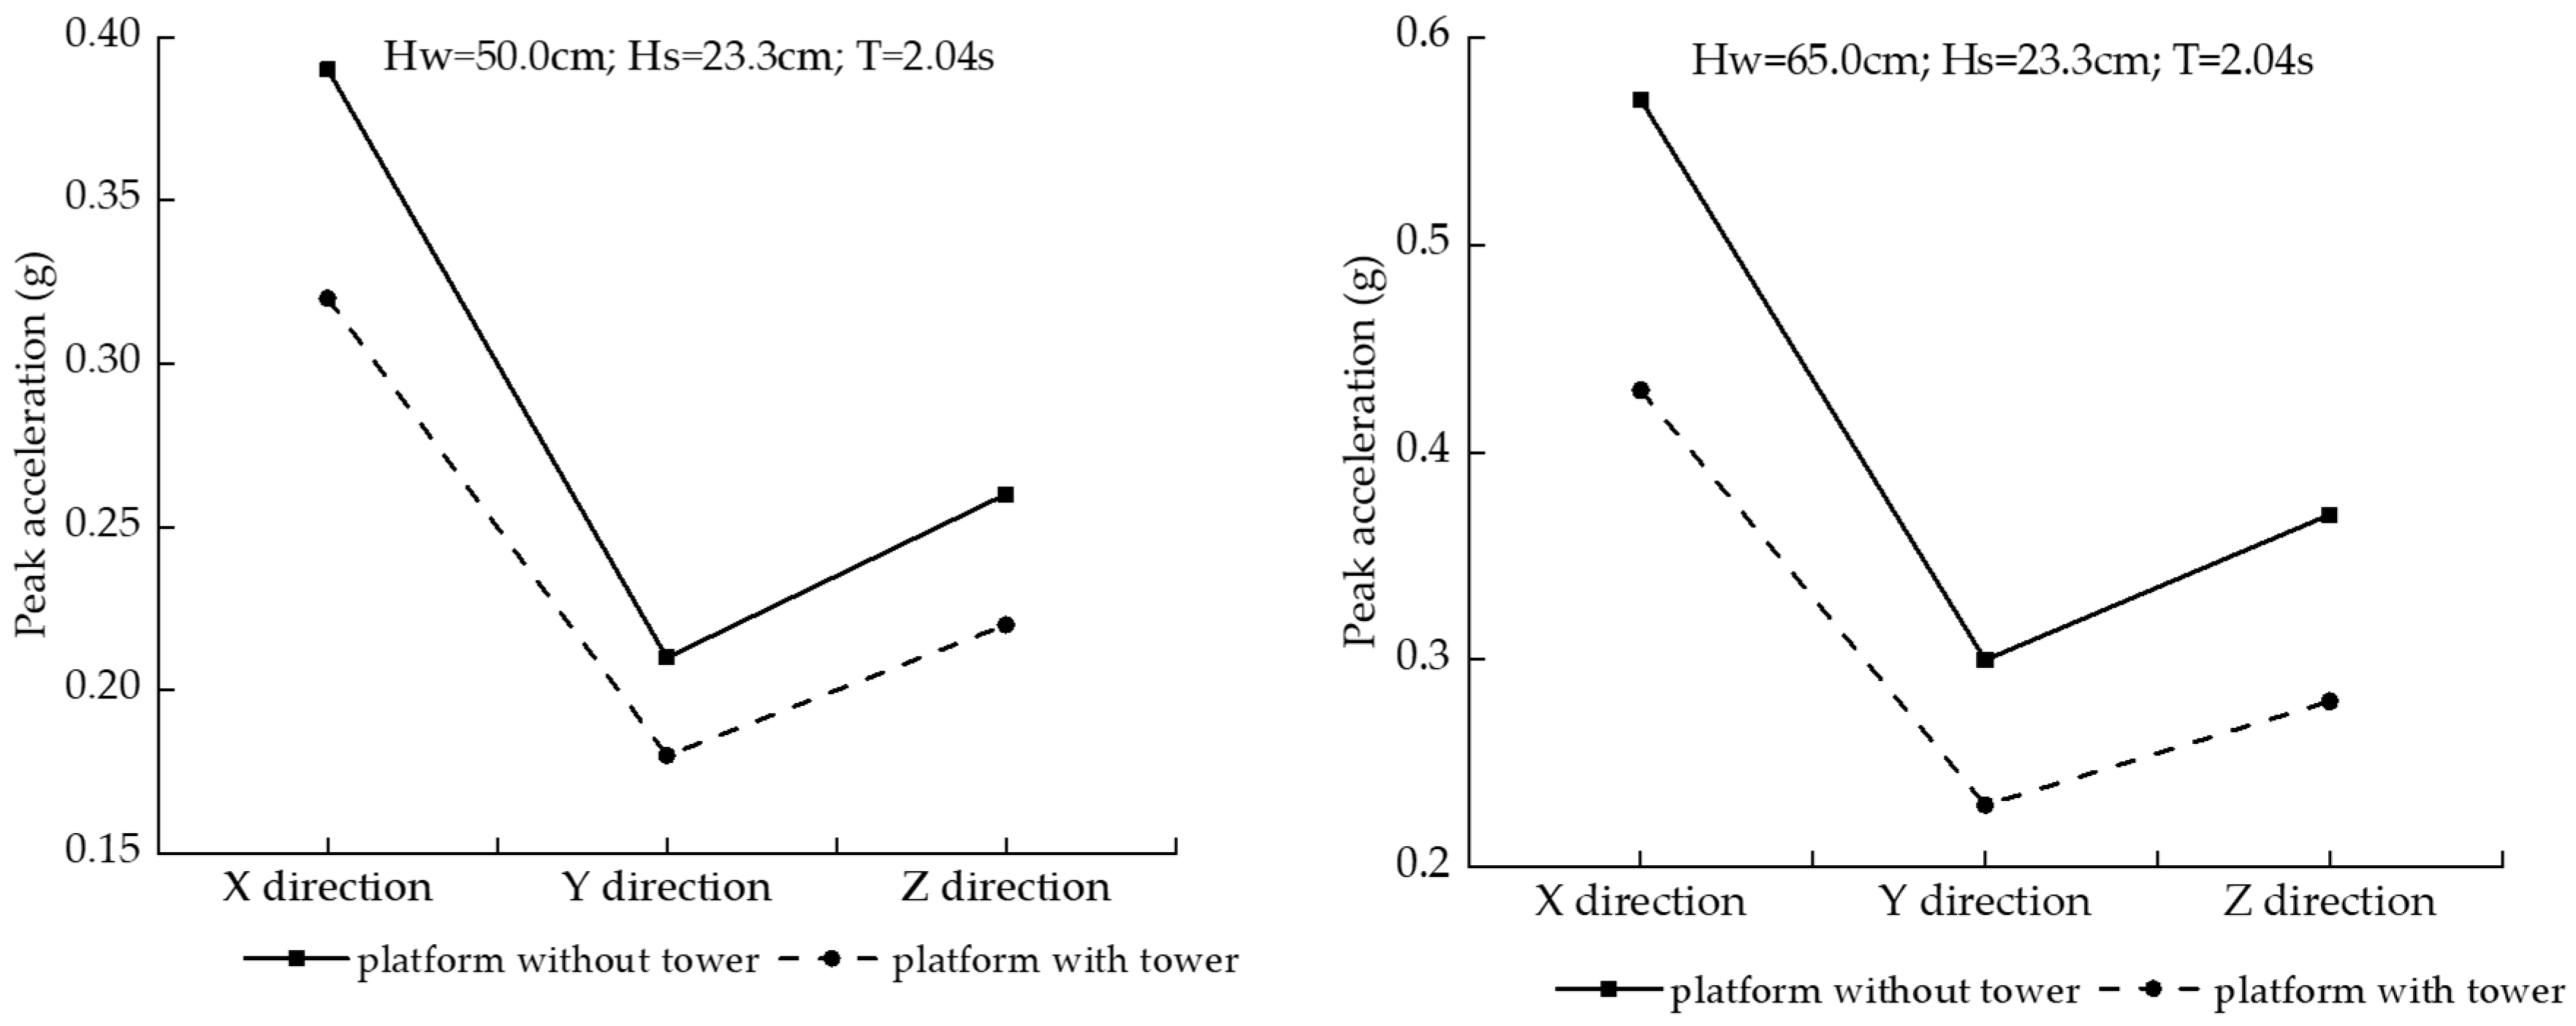
At the same time, we compared the acceleration at the monitoring points on the top face of the platform, as shown in Figure 19, where the X-direction is the wave propagation direction, the Y-direction is the rolling direction, and the Z-direction is the pitch direction. It can be seen that the acceleration of the platform itself with the tower is smaller than that without the tower, indicating that there is a coupling vibration effect between the tower and the platform, and that the installation of a tower can play a certain role in mitigating the vibration of the platform itself.

4. Discussion

4.1. Stability Control of Jackup Offshore Platforms under Waves of Large Wave Height

Under waves of large wave height, the wave is blocked by the platform’s surface, causing a pile group effect, thereby increasing the water body’s energy. The experiment results show that the effect of waves on the platform is significant, and the platform exhibits obvious shaking, along with surging, pitching, and rolling. The platform produces reciprocating motion as it shakes; combined with the wave impact, the pore pressure at the lower measuring points (i.e., P7, P8, P11, and P12, as shown in Figure 10) first increases and then gradually dissipates with time, while the soil near the pile leg becomes soft and the lateral soil resistance decreases. The mechanism of pile instability of the offshore platform under waves of large wave height is revealed, which is consistent with the cause of the drilling platform accident in the Shengli Oil Field in China [39].
There are two effective methods for controlling the stability of jackup offshore platforms under waves of large wave height: First, the platform and sea surface pore height should be kept safe enough to prevent waves from impacting the bottom of the platform, moderate the shaking of the platform, and reduce the softening of the seabed foundation, just as a recent literature review [40] highlighted that an important aspect of the offshore designer’s task is identifying the environmental conditions within which the offshore structure is to operate. Second, measures should be taken to limit the softening of the pile foundation soil induced by waves of large wave height. Ye et al. [35] investigated discs attached to the pile legs of an offshore platform to suppress liquefaction, and the numerical results showed that no momentary liquefaction occurs in the seabed directly below the discs on the pile legs of the offshore platform under waves, which could make the jackup offshore platform structure more stable under waves. This is convenient and economical, and it is recommended for application in the design of jackup offshore platforms to resist waves of large wave height, e.g., storm surges (tsunamis).

4.2. Coupling Effect between the Jackup Offshore Platform, the Tower, and the Seabed Foundation

Via analysis of the experimental results, as shown in Figure 18 and Figure 19, it can be seen that there is a coupling vibration effect between the tower and the platform, and the installation of the tower can play a certain role in mitigating the vibration of the platform itself. However, it should be noted that the natural frequency and the dynamic response of the tower are related to the height of the tower, its overall stiffness, the size of the platform, and the anchoring performance of the soil. In this test, the ratio of platform leg length to tower height was 1:2, because the above test results are only applicable to this test scheme.
In an actual marine environment, the waves may approach a platform from different directions, affected by winds, tides, currents, etc. In the design of a jackup offshore platform, all waves that might approach the platform site from any direction during the entire life of the structure should be considered [41]. The previous research [42,43] revealed that wave directions have a complex effect on platform, which can reduce the hydrodynamic forces in one main axis direction of platform but generate additional out-of-plane forces and yaw and roll moments. Therefore, in our study, only the wave impacts on the platform at a normal angle were considered. Although there is a limitation in the test, reasonably correct test data can be obtained under this condition. In a further study, various wave directions should be taken into consideration to study the coupling effect of jackup offshore platforms, towers, and seabed foundations. Furthermore, we would carry out more experiments with various wave periods and sizes of the platform, in order to extend the findings of this paper to other complex conditions. It is important to look at different wave periods and platform sizes because past work [44] demonstrated that the ratio of the “wave length to the deck length” has a critical effect on the hydrodynamic loads applied on a marine platform and that if this ratio is exceeded above a certain limit, then the hydrodynamic uplift forces do not continue to increase.

4.3. The Vibration Control of the Tower on the Offshore Platform

Many researchers have used various methods including artificial intelligence methods to control the vibration of steel platforms under environmental loads, such as wind, waves, ice, and earthquakes [15,16,17,18,19,45]. All of the relevant studies and achievements have further strengthened our confidence in controlling the vibration of offshore platforms. Based on the findings of previous studies, a flume experiment on the coupling between a jackup offshore platform, tower, and seabed foundation under waves of large wave height was carried out in this study.
The experimental results show that the acceleration response of the tower structure increases gradually with the height of the tower under the action of wave impacts, and the vibration effect of the tower is amplified, which poses great risks to the structural safety of the offshore platform and tower. To ensure that offshore platforms successfully complete their missions—i.e., oil drilling and the generation of offshore wind power—reliable measures should be implemented to control the vibration of the jackup offshore platform and tower. The motion of the jackup offshore platform can be reduced by the measures described in Section 4.1, while controlling the vibration of the tower can increase the stiffness of its structural components, as can the addition of a damping device, as described in this paper. The model test results show that the damping of the structure itself increases by ~38.8% and the natural frequency decreases by ~14.3% after adding the structural damping parts. Finally, the peak acceleration at the four tower monitoring points on the tower decreased by ~7–41.7%. The smaller the wave height, the more the peak acceleration decreased, proving that the method of adding damping components to suppress the vibration of the tower structure on the jackup offshore platform is feasible.

5. Conclusions

In this study, an experimental analysis of a jackup offshore platform structure under waves of large wave height was carried out, and the dynamic response of the jackup offshore platform structure under wave impacts, along with the coupling between the pile leg structure, the tower, and the seabed foundation, was investigated, providing significant enlightenment for the design of offshore platforms with towers to resist waves of large wave height. The main conclusions are as follows:
(1)
The wave pressures on the platform structure increase more under waves of large wave height than under normal conditions, and they also increase with the increase in wave height. When the wave height is large enough, the wave is blocked by the platform surface and the water body gathers under the platform surface, causing a pile group effect. The pressure on the platform’s back pile legs is greater than that on the front pile legs.
(2)
Due to the reciprocating movement of the structures under waves of large wave height, the soil near the pile legs squeezes the foundation bed in front of and behind the pile legs, causing the pore pressure of the foundation bed near the pile legs to increase cumulatively, and causing local softening of the foundation, which is manifested in the soil near the pile legs becoming soft, and the structure undergoes a certain displacement, revealing the mechanism of instability of the offshore platform’s pile foundation under waves of large wave height.
(3)
The platform produces longitudinal movement (along the propagation direction of wave) under normal conditions, and the longitudinal movement of the platform increases under waves of large wave height, accompanied by the vortex-induced vibration of the platform in the lateral direction of the pile legs.
(4)
The motion response of the tower structure is significantly greater than that of the platform structure, and a damping device has an obvious impact on the dynamic response characteristics of the tower. The maximum longitudinal movement of the tower without the damping device is 3.13 times that of the tower with the damping device under waves of large wave height.
(5)
Under the action of waves, a coupling vibration effect will occur between the tower and the platform, and the installation of the tower can play a certain role in mitigating the vibration of the platform itself.

Author Contributions

Methodology and formal analysis, H.Y.; data curation, F.Z.; funding acquisition, H.Y.; investigation, H.Y. and F.Z.; project administration, W.B.; writing—original draft, C.J.; writing—review and editing, Y.F. All authors have read and agreed to the published version of the manuscript.

Funding

This work was financially supported by the Chinese Military Logistics Scientific Research Program (No: CZZ19J013).

Institutional Review Board Statement

Not applicable.

Informed Consent Statement

Not applicable.

Data Availability Statement

The data that support the findings of this study are available from the corresponding author upon reasonable request.

Conflicts of Interest

The authors declare no conflict of interest.

References

  1. Amaechi, C.V.; Reda, A.; Butler, H.O.; Ja’e, I.A.; An, C. Review on Fixed and Floating Offshore Structures. Part I: Types of Platforms with Some Applications. J. Mar. Sci. Eng. 2022, 10, 1074. [Google Scholar] [CrossRef]
  2. Bea, R.G.; Xu, T.; Stear, J.; Ramos, R. Wave Forces on Decks of Offshore Platforms. J. Waterw. Port Coast. Ocean Eng. 1999, 125, 136–144. [Google Scholar] [CrossRef]
  3. Istrati, D.; Buckle, I. Role of trapped air on the tsunami-induced transient loads and response of coastal bridges. Geosciences 2019, 9, 191. [Google Scholar] [CrossRef] [Green Version]
  4. Istrati, D.; Buckle, I.; Lomonaco, P.; Yim, S. Deciphering the tsunami wave impact and associated connection forces in open-girder coastal bridges. J. Mar. Sci. Eng. 2018, 6, 148. [Google Scholar] [CrossRef] [Green Version]
  5. Mao, D.F.; Zhong, C.; Zhang, L.B.; Chu, G. Dynamic response of offshore jacket platform including foundation degradation under cyclic loadings. Ocean Eng. 2015, 100, 35–45. [Google Scholar] [CrossRef]
  6. Sunder, S.S.; Connor, J.J. Sensitivity analyses for steel jacket offshore platforms. Appl. Ocean Res. 1981, 3, 13–26. [Google Scholar] [CrossRef]
  7. Mostafa, Y.E.; Naggar, M.H.E. Response of fixed offshore platforms to wave and current loading including soil–structure interaction. Soil Dyn. Earthq. Eng. 2004, 24, 357–368. [Google Scholar] [CrossRef]
  8. Elshafey, A.A.; Haddara, M.R.; Marzouk, H. Dynamic response of offshore jacket structures under random loads. Mar. Struct. 2009, 22, 504–521. [Google Scholar] [CrossRef]
  9. Golafshani, A.A.; Ebrahimian, H.; Bagheri, V.; Holmas, T. Assessment of offshore platforms under extreme waves by probabilistic incremental wave analysis. J. Constr. Steel Res. 2011, 67, 759–769. [Google Scholar] [CrossRef]
  10. Hezarjaribi, M.; Bahaari, M.R.; Bagheri, V.; Ebrahimian, H. Sensitivity analysis of jacket-type offshore platforms under extreme waves. J. Constr. Steel Res. 2013, 83, 147–155. [Google Scholar] [CrossRef]
  11. Zhang, Q.; Zhou, X.L.; Wang, J.H.; Guo, J.J. Wave-induced seabed response around an offshore pile foundation platform. Ocean Eng. 2017, 130, 567–582. [Google Scholar] [CrossRef]
  12. Zhang, D.L.; Bi, C.W.; Wu, G.Y.; Zhao, S.X.; Dong, G.H. Laboratory Experimental Investigation on the Hydrodynamic Responses of an Extra-Large Electrical Platform in Wave and Storm Conditions. Water 2019, 11, 2042. [Google Scholar] [CrossRef] [Green Version]
  13. Xie, Y.C.; Huang, J.T.; Li, X.K.; Tian, X.J.; Liu, G.J.; Leng, D.X. Experimental study on hydrodynamic characteristics of three truss-type legs of jack-up offshore platform. Ocean Eng. 2021, 234, 109305. [Google Scholar] [CrossRef]
  14. Liu, H.B.; Zhao, C.Y.; Jiang, Z.; Su, H.H.; Qu, X.Q. Numerical investigation of wave run-up and impact forces on large offshore jacket platforms. Ocean Eng. 2022, 266, 112539. [Google Scholar] [CrossRef]
  15. Luo, M.; Zhu, W.Q. Nonlinear stochastic optimal control of offshore platforms under wave loading. J. Sound Vib. 2006, 296, 734–745. [Google Scholar] [CrossRef]
  16. Ma, H.; Zhang, Y.; Wang, S.Q.; Xu, J.L.; Su, H. Rolling-optimized model predictive vibration controller for offshore platforms subjected to random waves and winds under uncertain sensing delay. Ocean Eng. 2022, 252, 111054. [Google Scholar] [CrossRef]
  17. Moharrami, M.; Tootkaboni, M. Reducing response of offshore platforms to wave loads using hydrodynamic buoyant mass dampers. Eng. Struct. 2014, 81, 162–174. [Google Scholar] [CrossRef]
  18. Enferadi, M.H.; Ghasemi, M.R.; Shabakhty, N. Wave-induced vibration control of offshore jacket platforms through SMA dampers. Appl. Ocean Res. 2019, 90, 101848. [Google Scholar] [CrossRef]
  19. Ghadimi, B.; Taghikhany, T. Dynamic response assessment of an offshore jacket platform with semi-active fuzzy-based controller: A case study. Ocean Eng. 2021, 238, 109747. [Google Scholar] [CrossRef]
  20. Li, X.J.; Gao, F.P.; Yang, B. Wave-induced pore pressure responses and soil liquefaction around pile foundation. Int. J. Offshore Polar Eng. 2011, 21, 233–239. [Google Scholar]
  21. Qi, W.G.; Gao, F.P. Equilibrium scour depth at offshore monopile foundation in combined waves and current. Sci. China-Technol. Sci. 2014, 57, 1030–1039. [Google Scholar] [CrossRef]
  22. Lin, Z.B.; Pokrajac, D.; Guo, Y.K.; Jeng, D.S.; Tang, T.; Rey, N.; Zheng, J.H.; Zhang, J.S. Investigation of nonlinear wave-induced seabed response around mono-pile foundation. Coast. Eng. 2017, 121, 197–211. [Google Scholar] [CrossRef] [Green Version]
  23. Jacobsen, N.G.; Fuhrman, D.R.; Fredsϕe, J. A wave generation toolbox for the open-source CFD library: Open Foam. Int. J. Numer. Methods Fluids 2012, 70, 1073–1088. [Google Scholar] [CrossRef]
  24. Jacobsen, N.G.; Gent, M.R.A.; Wolters, G. Numerical analysis of the interaction of irregular waves with two dimensional permeable coastal structures. Coast. Eng. 2015, 102, 13–29. [Google Scholar] [CrossRef]
  25. Tang, T.; Hededal, O.; Cardiff, P. On finite volume method implementation of poro-elasto-plasticity soil model. Int. J. Numer. Anal. Methods Geomech. 2015, 39, 1410–1430. [Google Scholar] [CrossRef]
  26. Tang, T.; Roenby, J.; Hededal, O. A coupled soil-pore fluid formulation for modeling soil liquefaction and cyclic mobility in seabed using the finite volume method. Adv. Civil. Environ. Mater. Res. 2012, 1000, 26–30. [Google Scholar]
  27. Tang, T. Modeling of Soil-Water-Structure Interaction. Ph.D. Thesis, Technical University of Denmark, Lyngby, Denmark, 2014. [Google Scholar]
  28. Yuan, Q.Y.; Liao, C.C.; Zhou, X.L. Experimental Study on the Distribution of Wave-Induced Excess Pore Pressure in a Sandy Seabed around a Mat Foundation. J. Mar. Sci. Eng. 2019, 7, 304. [Google Scholar] [CrossRef] [Green Version]
  29. Ye, J.H.; Jeng, D.S.; Wang, R.; Zhu, C.Q. A 3-D semi-coupled numerical model for fluid-structures-seabed-interaction (FSSI-CAS3D): Model and verification. J. Fluids Struct. 2013, 40, 148–162. [Google Scholar] [CrossRef]
  30. Ye, J.H.; Jeng, D.S.; Wang, R.; Zhu, C.Q. Validation of a 2-D semi-coupled numerical model for fluid-structure-seabed interaction. J. Fluids Struct. 2013, 42, 333–357. [Google Scholar] [CrossRef]
  31. Jeng, D.S.; Ye, J.H.; Zhang, J.S.; Liu, P.L.F. An integrated model for the wave-induced seabed response around marine structures: Model verifications and applications. Coast. Eng. 2013, 72, 1–19. [Google Scholar] [CrossRef]
  32. Ye, J.H.; Yu, D.W. ABAQUS–OlaFlow integrated numerical model for fluid-seabed-structure interaction. Mar. Struct. 2021, 78, 103016. [Google Scholar] [CrossRef]
  33. Ye, J.H.; Wang, G. Seismic dynamics of offshore breakwater on liquefiable seabed foundation. Soil Dyn. Earthq. Eng. 2015, 76, 86–99. [Google Scholar] [CrossRef]
  34. Ye, J.H.; He, K.P.; Zhou, L.J. Subsidence prediction of a rubble mound breakwater at Yantai port: A application of FSSI-CAS 2D. Ocean. Eng. 2021, 219, 108349. [Google Scholar] [CrossRef]
  35. Ye, H.L.; Yu, D.; Ye, J.H.; Yang, Z.F. Numerical Analysis of Dynamics ofJack-Up Offshore Platform and Its Seabed Foundation under Ocean Wave. Appl. Sci. 2022, 12, 3299. [Google Scholar] [CrossRef]
  36. Cui, L.; Jeng, D.S.; Liu, J.W. Numerical analysis of the seabed liquefaction around a fixed gravity-based structure (GBS) of an offshore platform and protection. Ocean Eng. 2022, 249, 110844. [Google Scholar] [CrossRef]
  37. Arena, F.; Filianoti, P. Small-Scale Field Experiment on a Submerged Breakwater for Absorbing Wave Energy. J. Waterw. Port Coast. Ocean Eng. 2007, 133, 161–167. [Google Scholar] [CrossRef]
  38. Wang, W.H.; Gao, Z.; Moan, T.; Li, X. Model Test and Numerical Analysis of a Multi-Pile Offshore Wind Turbine under Seismic, Wind, Wave and Current Loads. J. Offshore Mech. Arct. Eng. 2016, 139, 031901. [Google Scholar] [CrossRef]
  39. Du, F.C. Geological Cause Analysis of Overturning of No. 3 Workover Platform in Shengli Oilfield. Ph.D. Thesis, Ocean University of China, Qingdao, China, 2013. (In Chinese). [Google Scholar]
  40. Amaechi, C.V.; Reda, A.; Butler, H.O.; Ja’e, I.A.; An, C. Review on Fixed and Floating Offshore Structures. Part II: Sustainable Design Approaches and Project Management. J. Mar. Sci. Eng. 2022, 10, 973. [Google Scholar] [CrossRef]
  41. American Petroleum Institute. API RP 2A, Recommended Practice for Planning, Designing and Constructing Fixed Offshore Platforms; API Publishing Services: Washington, DC, USA, 2004. [Google Scholar]
  42. Meer, J.; Briganti, R.; Zanuttigh, B.; Wang, B. Wave transmission and reflection at low-crested structures: Design formulae, oblique wave attack and spectral change. Coast. Eng. 2005, 52, 915–929. [Google Scholar] [CrossRef]
  43. Istrati, D.; Buckle, I.G. Tsunami Loads on Straight and Skewed Bridges—Part 2: Numerical Investigation and Design Recommendations; Technical Report (No. FHWA-OR-RD-21-13); Oregon Department of Transportation: Research Publications: Salem, OR, USA, 2021; p. 3. [CrossRef]
  44. Xiang, T.; Istrati, D. Assessment of Extreme Wave Impact on Coastal Decks with Different Geometries via the Arbitrary Lagrangian-Eulerian Method. J. Mar.Sci. Eng. 2021, 9, 1342. [Google Scholar] [CrossRef]
  45. Namlı, B. Vibration Control of Offshore Structures Using Deep Learning Prediction Methods. Master’s Thesis, İstanbul Technical University, İstanbul, Turkey, 2022. [Google Scholar]
Figure 1. General layout of the offshore platform structure in the wave flume.
Water 15 00024 g001
Figure 2. Sketch of the experimental setup. (A: accelerometer; E: pressure sensor; L: displacement measuring instrument; WH: wave height sensor; P: pore pressure sensor).
Water 15 00024 g002aWater 15 00024 g002b
Figure 3. Schematic diagram of the model size and installation of the offshore platform.
Water 15 00024 g003
Figure 4. Photo after the preparation of model A.
Water 15 00024 g004
Figure 5. Photo after the preparation of model B.
Water 15 00024 g005
Figure 6. Photo after the preparation of model C.
Water 15 00024 g006
Figure 7. Diagram of wave pressure at different positions on the pile.
Water 15 00024 g007
Figure 8. Diagram of wave pressure at different positions on the platform face.
Water 15 00024 g008
Figure 9. Wave pressure history of the platform model under waves ( H w = 62.5 cm, H s = 30.0 cm, T = 2.45 s).
Water 15 00024 g009
Figure 10. Pore pressure history of the pile leg under waves ( H w = 62.5 cm, H s = 30.0 cm, T = 2.45 s).
Water 15 00024 g010aWater 15 00024 g010b
Figure 11. Schematic diagram of the platform’s motion under wave action.
Water 15 00024 g011
Figure 12. Motion of the platform under waves of large wave height.
Water 15 00024 g012
Figure 13. Peak acceleration of the platform under waves of large wave height.
Water 15 00024 g013
Figure 14. Natural vibration attenuation curve of the tower without the damping device.
Water 15 00024 g014
Figure 15. Natural vibration attenuation curve of the tower with the damping device.
Water 15 00024 g015
Figure 16. Comparison diagram of the surge history of the towers with and without the damping device ( H w   = 62.5 cm, H s = 30.0 cm, T = 2.45 s).
Water 15 00024 g016
Figure 17. Comparison diagram of the surge and pitch of the towers with and without the damping device.
Water 15 00024 g017
Figure 18. Comparison diagram of acceleration at the monitoring points on the tower with and without the damping device (wave propagation direction).
Water 15 00024 g018
Figure 19. Comparison diagram of acceleration at the monitoring points on the top face of the platform with and without the tower.
Water 15 00024 g019
Table 1. Basic physical parameters of the model’s soil.
Specific gravity of the soil particle G s 2.71
Moisture content ω 25.59%
Saturated density   ρ s a t (g/cm3)1.780
Maximum saturated density     ρ d m a x (g/cm3)1.719
Minimum saturated density   ρ d m i n (g/cm3)1.286
Designed dry density ρ d (g/cm3)1.502
Minimum porosity rate emin0.357
Maximum porosity rate emax0.525
Table 2. The corresponding parameters of the prototype and the experimental model.
ModuleParametersReal ValueProportional ScaleExperimental Model Value
PlatformWidth (m)14.4 λ W = 24 0.6
Length (m)14.4 λ L = 24 0.6
Height (m)0.48 λ H = 24 0.02
Diameter of pillars (m)1.92 λ D = 24 0.08
Length of pillars24 λ L = 24 1
WaveWave height H (m)1; 2; 3; 4.46; 5.60; 7.2 λ H = 24 0.042; 0.083; 0.125; 0.186;
0.233; 0.30
Wave period T (s)8; 10; 12 λ T = 240.5 = 4.91.63; 2.04; 2.45
Water depth h (m)10; 12; 15 λ d = 24 0.417; 0.50; 0.625
Monitoring objectsPressure (kPa)- λ p = 24 -
Acceleration (g)- λ a = 1 -
Displacement (m)- λ s = 24 -
Table 3. Summary of experimental tests for wave, celerity, and platform conditions.
Test Number Water   Depth   H w   ( cm ) Wave   Height   H s   ( cm ) Wave Period T (s) Wave   Length   λ (m) Wave Celerity C (m/s)
Normal conditions141.74.21.632.951.81
241.78.31.632.951.81
341.718.61.632.951.81
Extreme conditions with waves of large wave height441.723.31.632.951.81
550.030.02.044.152.03
662.520.82.455.642.30
Table 4. Stationary state of the platform model.
Conditions H w   ( cm ) H s ( cm ) T (s)Stationary State
Normal operating conditions41.74.21.63Yes
41.78.31.63Yes
41.712.51.63Yes
Extreme conditions with waves of large wave height41.718.61.63No
50.023.32.04No
62.530.02.45No
Table 5. The natural vibration period and equivalent damping of the two towers.
Tower TypePeriod (s)Equivalent Damping
SurgePitchSurgePitch
Tower without damping device0.180.210.3640.354
Tower with damping device0.200.230.5000.473
Disclaimer/Publisher’s Note: The statements, opinions and data contained in all publications are solely those of the individual author(s) and contributor(s) and not of MDPI and/or the editor(s). MDPI and/or the editor(s) disclaim responsibility for any injury to people or property resulting from any ideas, methods, instructions or products referred to in the content.