
Study of Atmospheric Forcing Influence on Harbour Water Renewal

 ,
,  , , and
Abstract
1. Introduction
2. Materials and Methods
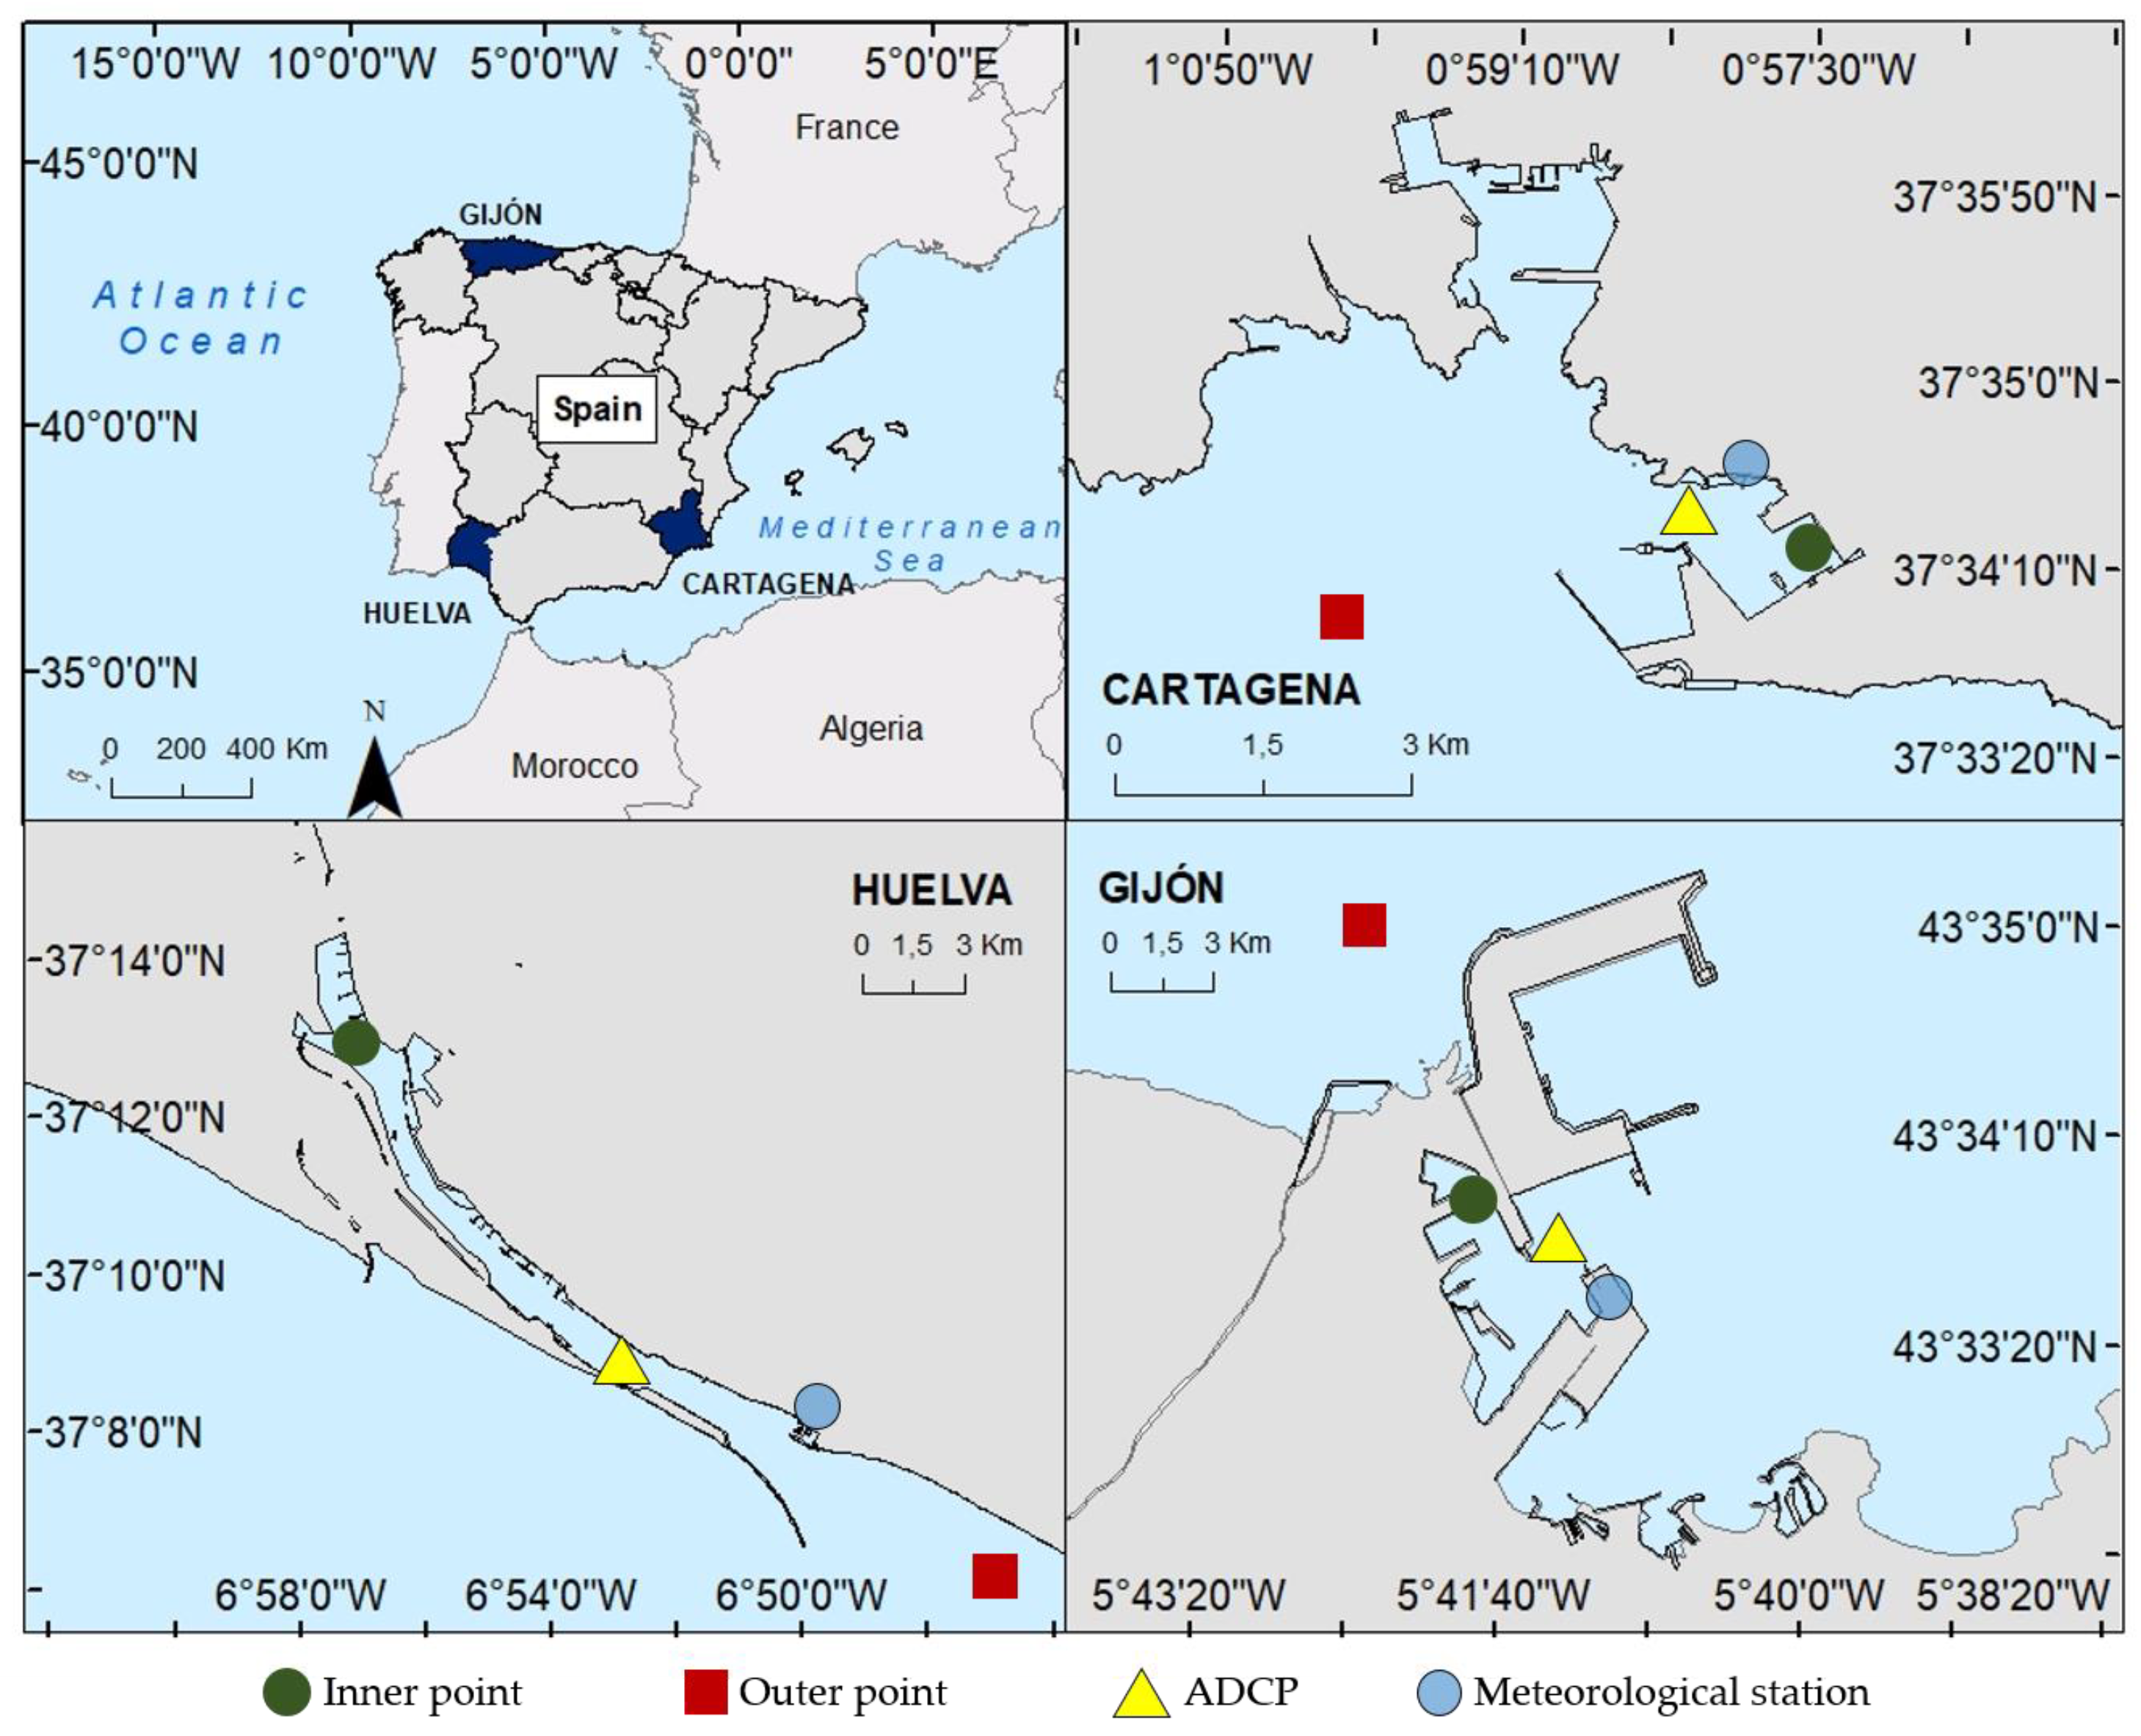
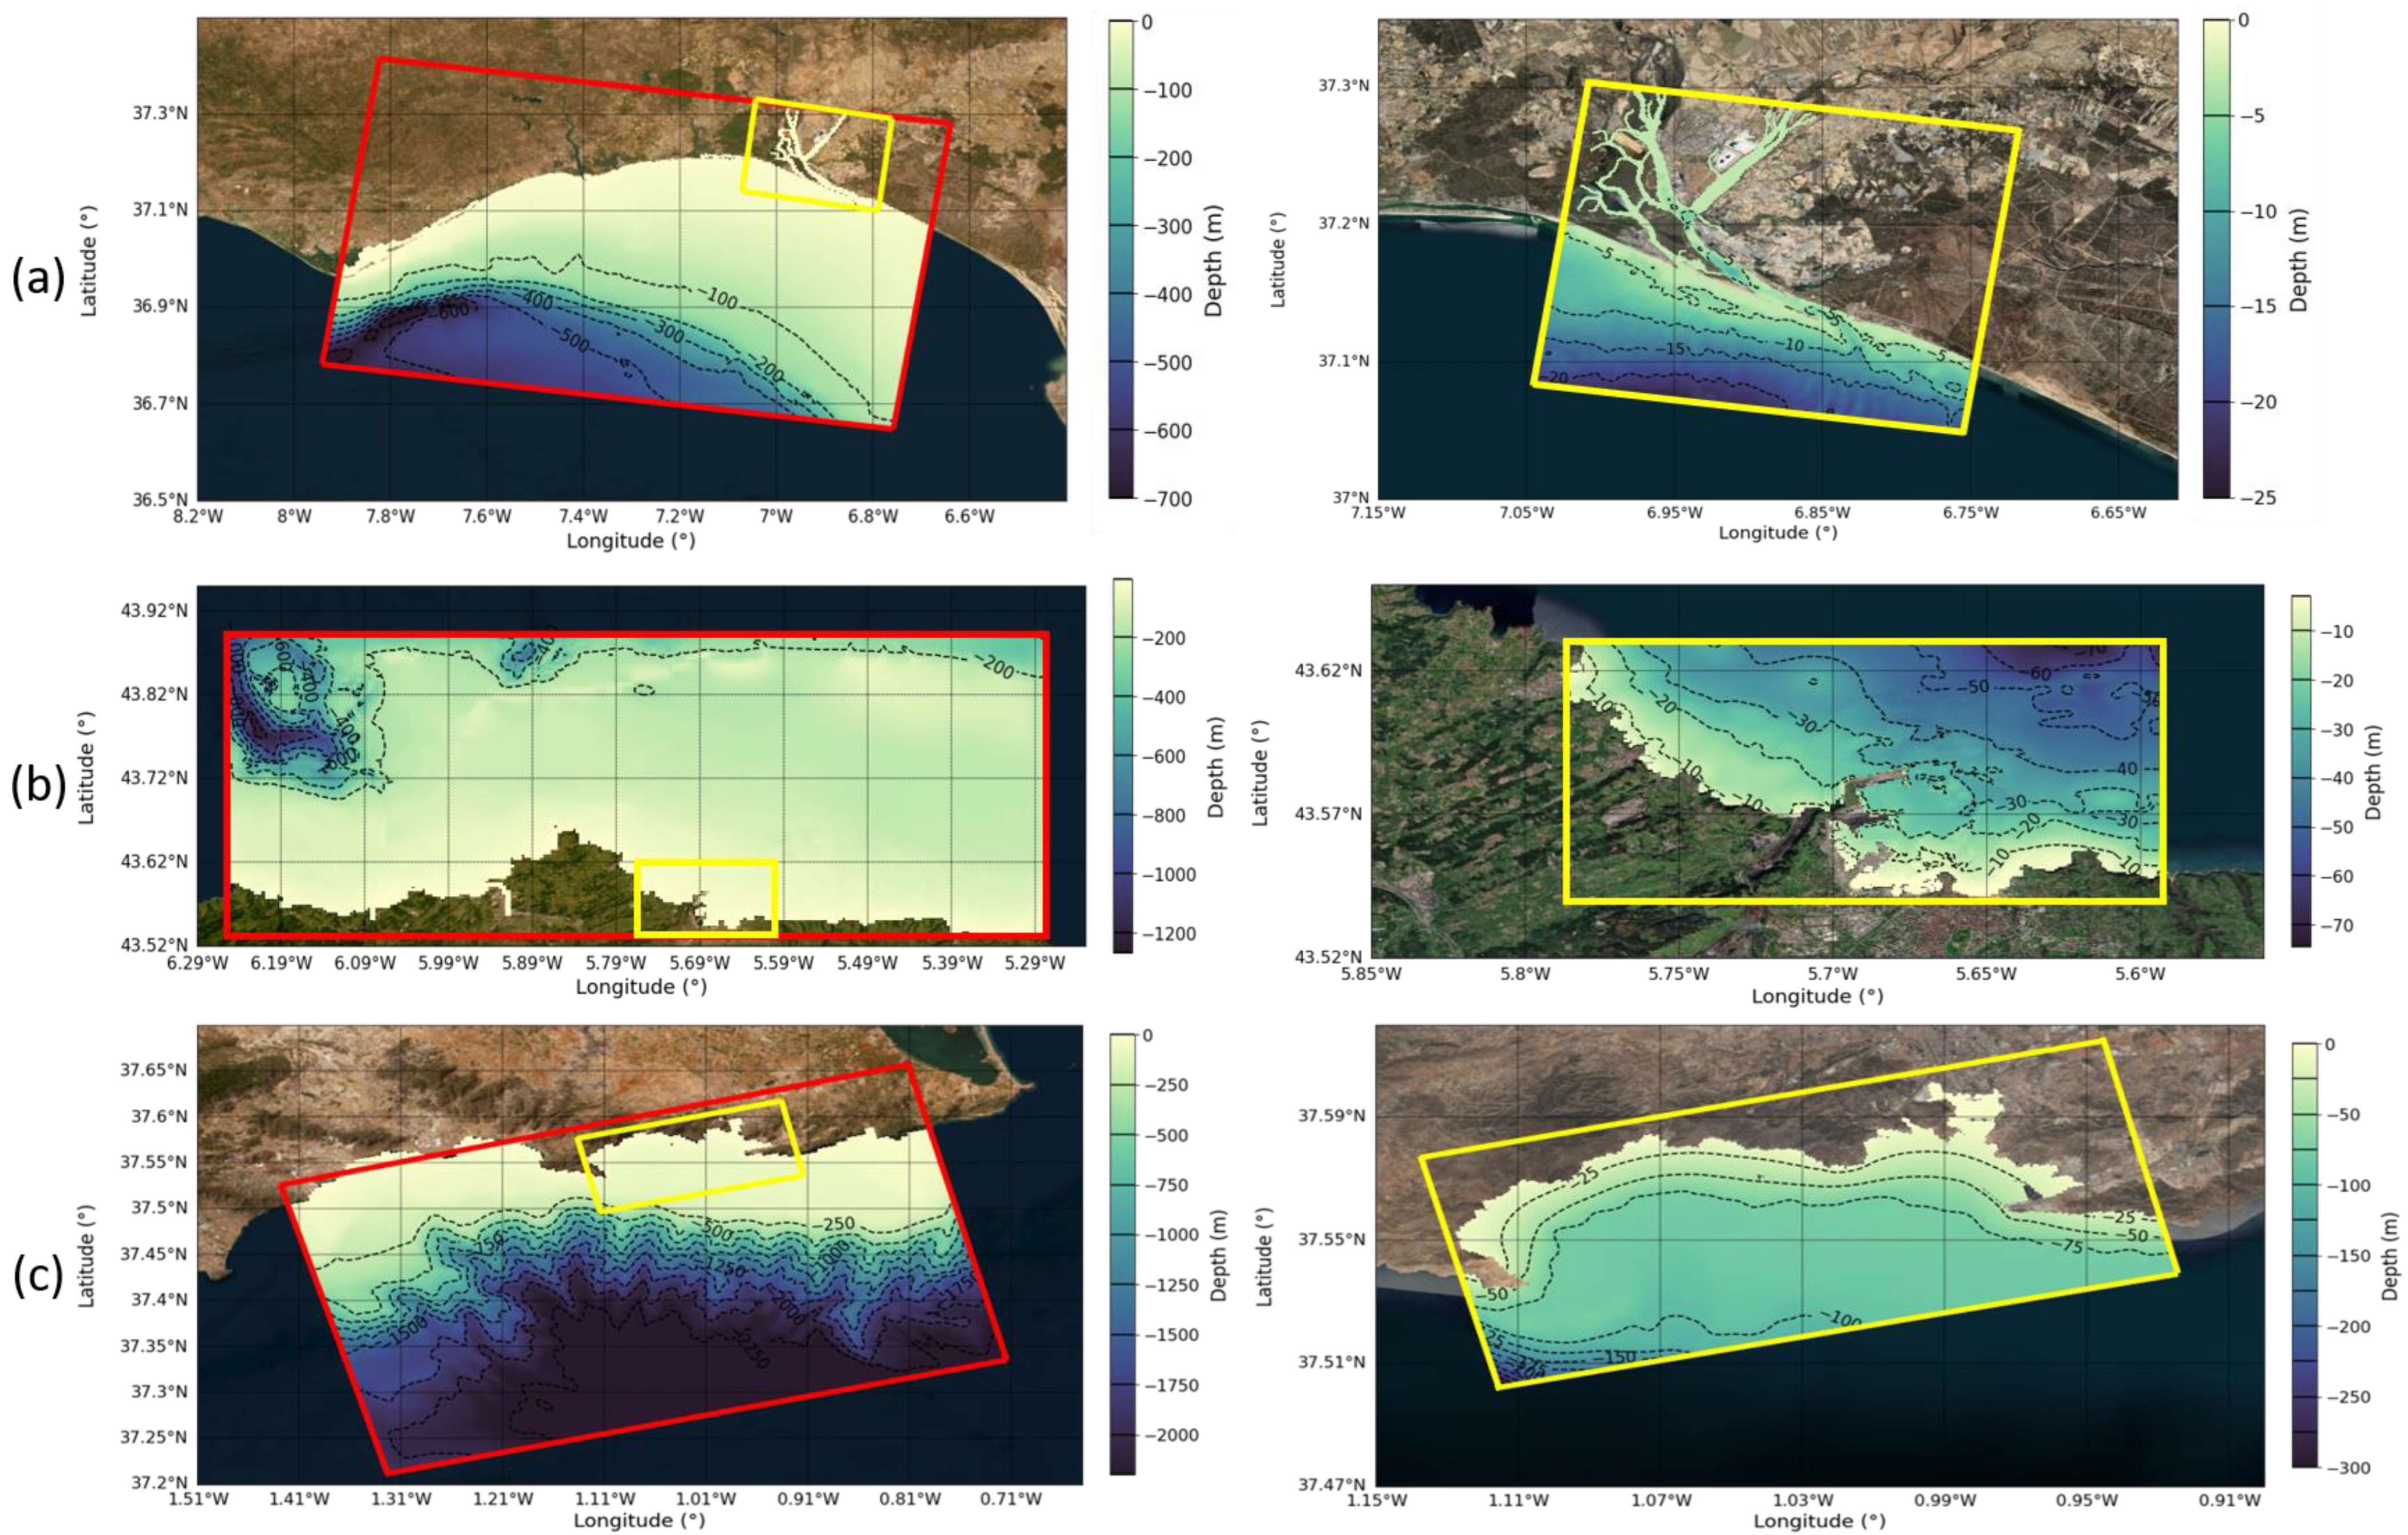
2.1. Study Area
2.1.1. Huelva Harbour
2.1.2. Gijón Harbour
2.1.3. Cartagena Harbour
2.2. Fiel Campaigns
2.3. Renewal Times
2.4. The SAMOA Operational Service
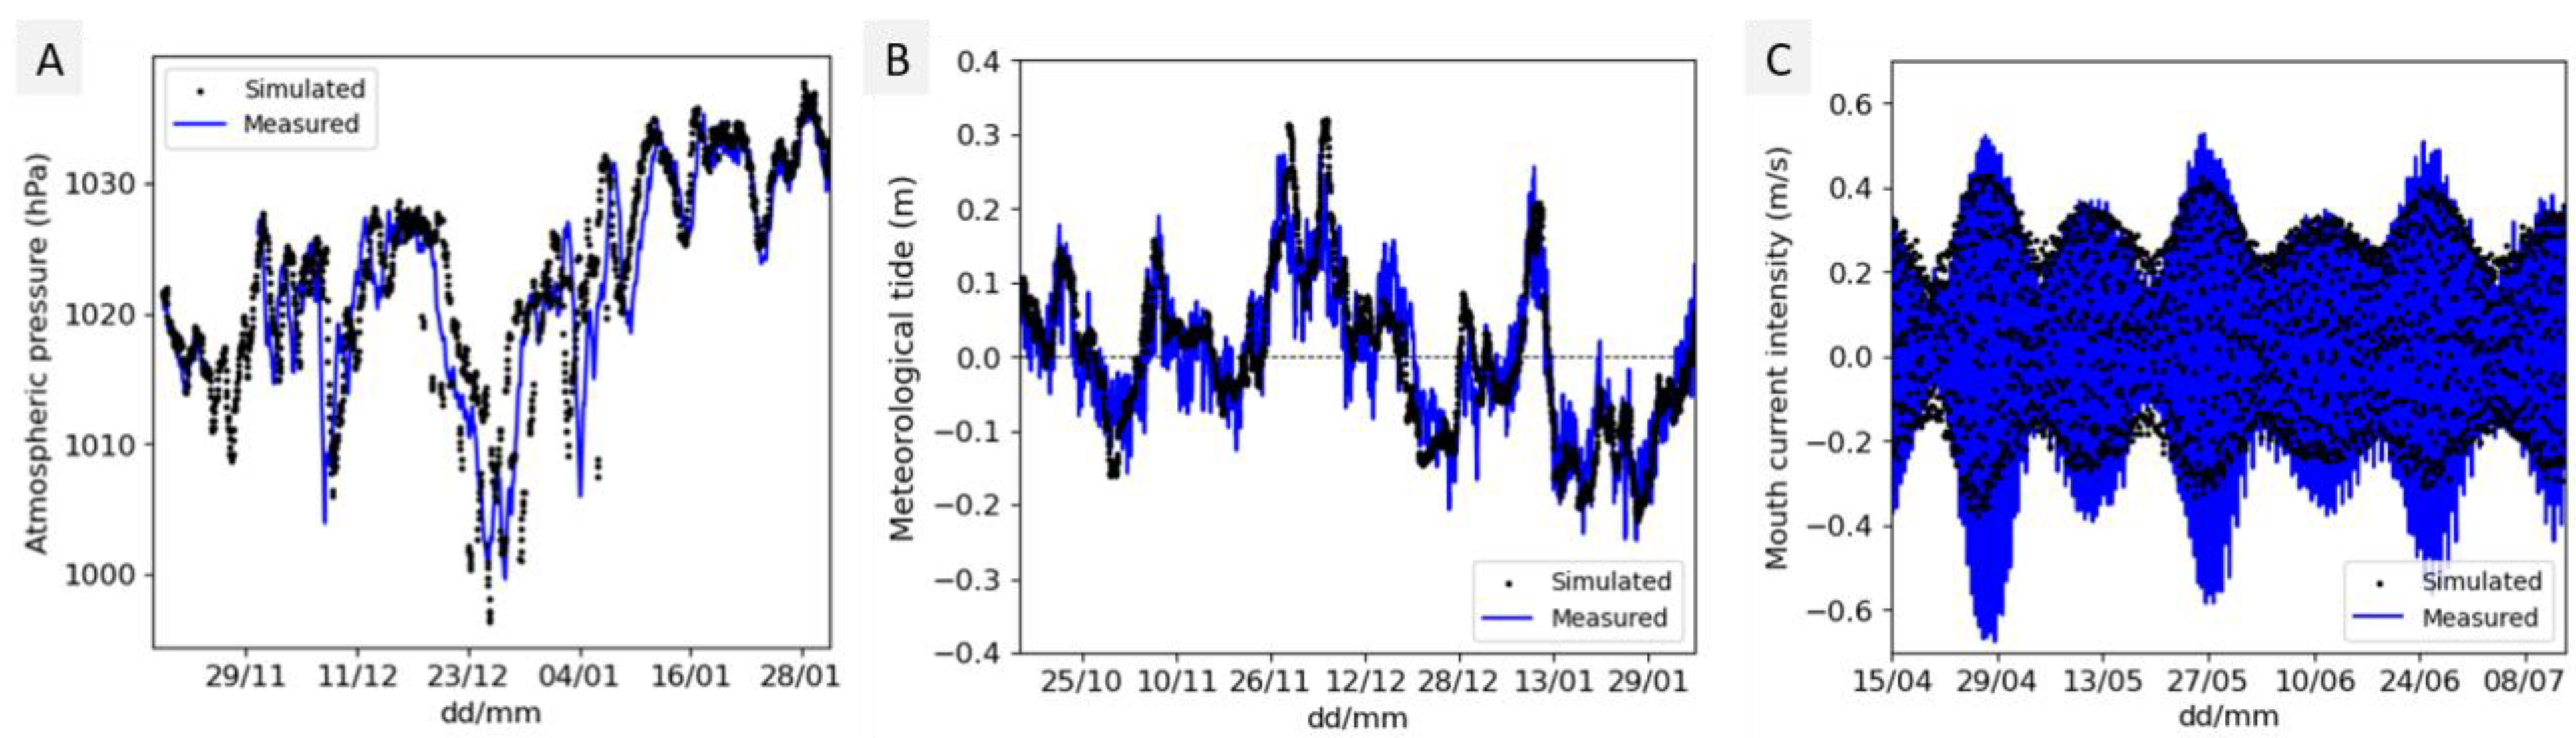
2.5. Validation
3. Results
3.1. Metocean Field Data
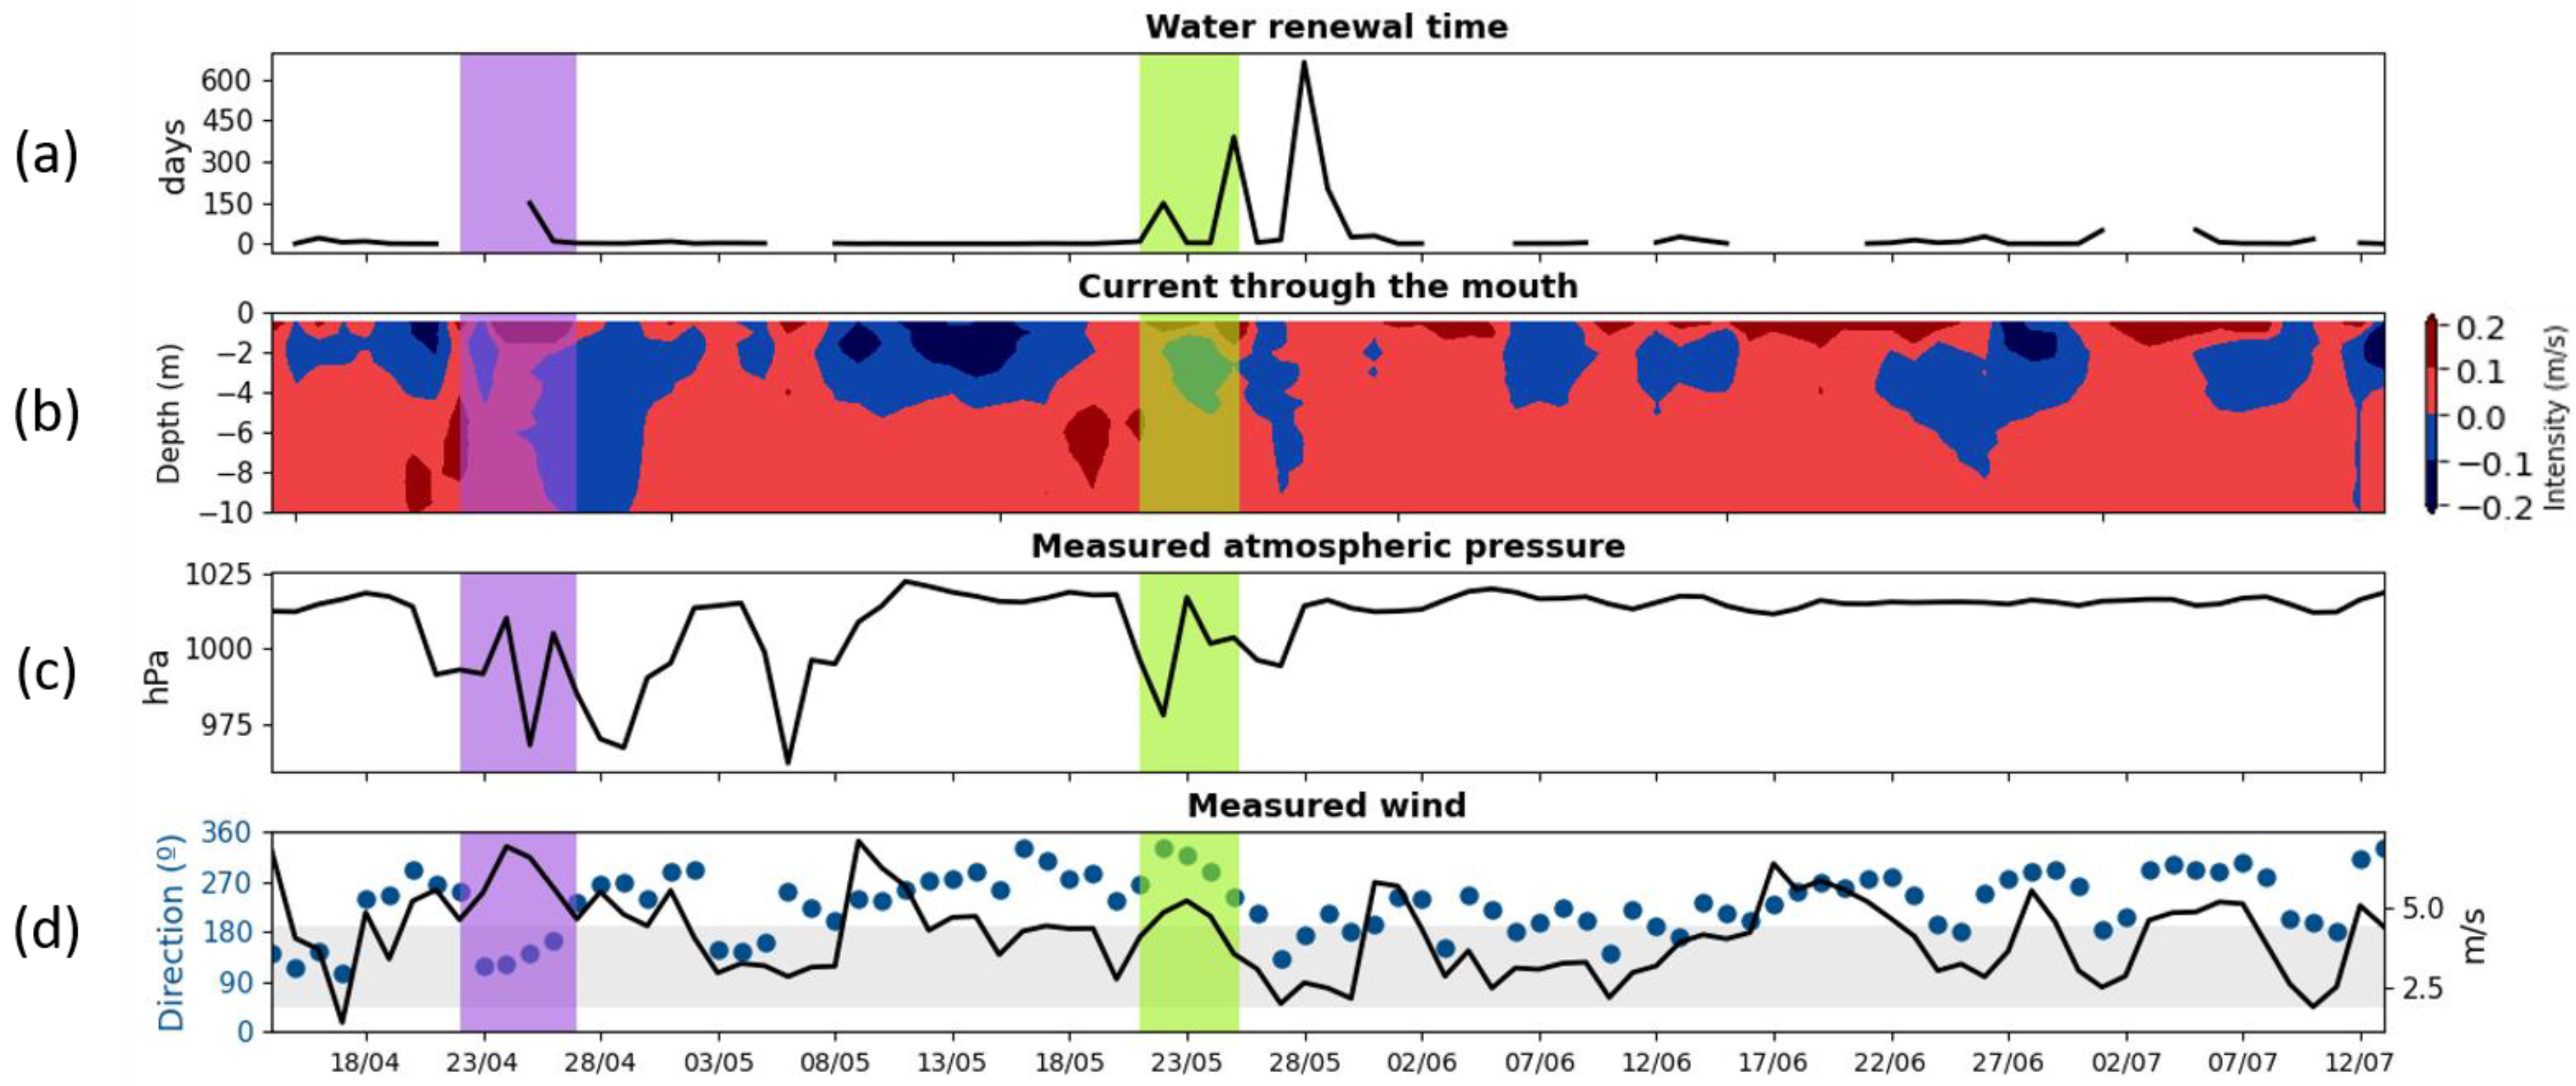
3.2. Model Results
4. Discussion
5. Conclusions
Supplementary Materials
Author Contributions
Funding
Data Availability Statement
Acknowledgments
Conflicts of Interest
References
- Eurostat. Eurostat/Regions and Cities Illustrated (RCI). Available online: http://ec.europa.eu/eurostat/cache/RCI/ (accessed on 29 September 2022).
- González-Marco, D.; Sierra, J.P.; de Ybarra, O.F.; Sánchez-Arcilla, A. Implications of long waves in harbor management: The Gijón port case study. Ocean Coast. Manag. 2008, 51, 180–201. [Google Scholar] [CrossRef]
- Darbra, R.; Pittam, N.; Royston, K.; Darbra, J.; Journee, H. Survey on environmental monitoring requirements of European ports. J. Environ. Manag. 2009, 90, 1396–1403. [Google Scholar] [CrossRef]
- Sotillo, M.G.; Cailleau, S.; Lorente, P.; LeVier, B.; Aznar, R.; Reffray, G.; Amo-Baladrón, A.; Chanut, J.; Benkiran, M.; Alvarez-Fanjul, E. The MyOcean IBI Ocean Forecast and Reanalysis Systems: Operational products and roadmap to the future Copernicus Service. J. Oper. Oceanogr. 2015, 8, 63–79. [Google Scholar] [CrossRef]
- Montero, N.; Belzunce-Segarra, M.; Del Campo, A.; Garmendia, J.; Ferrer, L.; Larreta, J.; González, M.; Maidana, M.; Espino, M. Integrative environmental assessment of the impact of Pasaia harbour activities on the Oiartzun estuary (southeastern Bay of Biscay). J. Mar. Syst. 2011, 109–110, S252–S260. [Google Scholar] [CrossRef]
- Von Schuckmann, K.; Le Traon, P.-Y.; Smith, N.; Pascual, A.; Brasseur, P.; Fennel, K.; Djavidnia, S.; Aaboe, S.; Fanjul, E.A.; Autret, E.; et al. Copernicus Marine Service Ocean State Report. J. Oper. Oceanogr. 2018, 11, S1–S142. [Google Scholar] [CrossRef]
- Fanjul, E.A.; Sotillo, M.G.; Pérez Gómez, B.; Garcia Valdecasas, J.M.; Perez Rubio, S.; Lorente, P.; Rodriguez Dapena, A.; Martinez Marco, I.; Luna, Y.; Padorno, E.; et al. Operational Oceanography at the service of the ports. New Front. Oper. Oceanogr. 2018, 729–736. [Google Scholar]
- MVillalonga, M.M.; Infantes, M.E.; Colls, M.G.; Ridge, M.M. Environmental Management System for the Analysis of Oil Spill Risk Using Probabilistic Simulations. Application at Tarragona Monobuoy. J. Mar. Sci. Eng. 2020, 8, 277. [Google Scholar] [CrossRef]
- ASánchez-Arcilla, A.; Sierra, J.P.; Brown, S.; Casas-Prat, M.; Nicholls, R.J.; Lionello, P.; Conte, D. A review of potential physical impacts on harbours in the Mediterranean Sea under climate change. Reg. Environ. Chang. 2016, 16, 2471–2484. [Google Scholar] [CrossRef]
- Sierra, J.P.; Casas-Prat, M.; Virgili, M.; Mösso, C.; Sánchez-Arcilla, A. Impacts on wave-driven harbour agitation due to climate change in Catalan ports. Nat. Hazards Earth Syst. Sci. 2015, 15, 1695–1709. [Google Scholar] [CrossRef]
- Sierra, J.P.; Casanovas, I.; Mösso, C.; Mestres, M.; Sánchez-Arcilla, A. Vulnerability of Catalan (NW Mediterranean) ports to wave overtopping due to different scenarios of sea level rise. Reg. Environ. Chang. 2015, 16, 1457–1468. [Google Scholar] [CrossRef]
- Grifoll, M.; Jordà, G.; Espino, M. Surface water renewal and mixing mechanisms in a semi-enclosed microtidal domain. The Barcelona harbour case. J. Sea Res. 2014, 90, 54–63. [Google Scholar] [CrossRef]
- MMestres, M.; Sierra, J.P.; Sánchez-Arcilla, A. Baroclinic and wind-induced circulation in Tarragona harbour (northeastern Spain). Sci. Mar. 2007, 71, 223–238. [Google Scholar] [CrossRef]
- Fourniotis, N.T.; Horsch, G.M.; Leftheriotis, G.A. On the Hydrodynamic Geometry of Flow-Through versus Restricted Lagoons. Water 2018, 10, 237. [Google Scholar] [CrossRef]
- Alastuey, A.; Moreno, N.; Querol, X.; Viana, M.; Artíñano, B.; Luaces, J.; Basora, J.; Guerra, A. Contribution of harbour activities to levels of particulate matter in a harbour area: Hada Project-Tarragona Spain. Atmos. Environ. 2007, 41, 6366–6378. [Google Scholar] [CrossRef]
- Grifoll, M.; Jorda, G.; Borja, A.; Espino, M. A new risk assessment method for water quality degradation in harbour domains, using hydrodynamic models. Mar. Pollut. Bull. 2010, 60, 69–78. [Google Scholar] [CrossRef]
- Monsen, N.E.; Cloern, J.E.; Lucas, L.V.; Monismith, S.G. A comment on the use of flushing time, residence time, and age as transport time scales. Limnol. Oceanogr. 2002, 47, 1545–1553. [Google Scholar] [CrossRef]
- Cáceres, I.; Grifoll, M.; González-Marco, D.; Sánchez-Arcilla, A.; Espino, M. Relevance of Different Driving Terms in the Barcelona Harbor Winter Circulation: Field Study and Numerical Model Performance. J. Waterw. Port Coast. Ocean. Eng. 2008, 134, 275–285. [Google Scholar] [CrossRef]
- Cerralbo, P.; Balsells, M.F.-P.; Mestres, M.; Fernandez, M.; Espino, M.; Grifoll, M.; Sanchez-Arcilla, A. Use of a hydrodynamic model for the management of water renovation in a coastal system. Ocean Sci. 2019, 15, 215–226. [Google Scholar] [CrossRef]
- Samper, Y.; Liste, M.; Mestres, M.; Espino, M.; Sánchez-Arcilla, A.; Sospedra, J.; González-Marco, D.; Ruiz, M.I.; Fanjul, E. Water Exchanges in Mediterranean Microtidal Harbours. Water 2022, 14, 2012. [Google Scholar] [CrossRef]
- Huguet, J.-R.; Brenon, I.; Coulombier, T. Characterisation of the Water Renewal in a Macro-Tidal Marina Using Several Transport Timescales. Water 2019, 11, 2050. [Google Scholar] [CrossRef]
- He, L.-M.; He, Z.-L. Water quality prediction of marine recreational beaches receiving watershed baseflow and stormwater runoff in southern California, USA. Water Res. 2008, 42, 2563–2573. [Google Scholar] [CrossRef] [PubMed]
- Grifoll, M.; Del Campo, A.; Espino, M.; Mader, J.; González, M.; Borja, A. Water renewal and risk assessment of water pollution in semi-enclosed domains: Application to Bilbao Harbour (Bay of Biscay). J. Mar. Syst. 2013, 109–110, S241–S251. [Google Scholar] [CrossRef]
- Yerubandi, R.R.; Boegman, L.; Bolkhari, H.; Hiriart-Baer, V. Physical processes affecting water quality in Hamilton Harbour. Aquat. Ecosyst. Health Manag. 2016, 19, 114–123. [Google Scholar] [CrossRef]
- Autoridad Portuaria de Huelva (APH). Memoria AP Huelva 2021.pdf; APH: Huelva, Spain, 2021. [Google Scholar]
- Espino, M.; Maidana, M.A.; Sánchez-Arcilla, A.; German, A. Hydrodynamics in the Huelva Estuary: Tidal Model Calibration Using Field Data. J. Waterw. Port Coast. Ocean. Eng. 2007, 133, 313–323. [Google Scholar] [CrossRef]
- Jiménez-Romero, R.; Fernández-Salas, L.M.; Palomino, D.; Sánchez-Leal, R.F.; Vila, Y. Discovering the Fine-Scale Morphology of the Gulf of Cádiz: An Underwater Imaging Analysis. J. Mar. Sci. Eng. 2022, 10, 651. [Google Scholar] [CrossRef]
- Nelson, C.; Baraza, J.; Maldonado, A.; Rodero, J.; Escutia, C.; Barber, J.H. Influence of the Atlantic inflow and Mediterranean outflow currents on Late Quaternary sedimentary facies of the Gulf of Cadiz continental margin. Mar. Geol. 1999, 155, 99–129. [Google Scholar] [CrossRef]
- Autoridad Portuaria de Gijón. Memoria AP Gijón 2020; APJ: Gijón, Spain, 2020. [Google Scholar]
- Rubio, A.; Solabarrieta, L.; Gonzalez, M.; Mader, J.; Castanedo, S.; Medina, R.; Charria, G.; Aranda, J.A. Surface circulation and Lagrangian transport in the SE Bay of Biscay from HF radar data. In Proceedings of the 2013 MTS/IEEE OCEANS-Bergen, Bergen, Norway, 10–14 June 2013. [Google Scholar]
- Borja, A.; Collins, M. Oceanography and Marine Environment of the Basque Country; Elsevier Oceanography Series; Elsevier: Amsterdam, The Netherlands, 2004; Volume 70. [Google Scholar] [CrossRef]
- Autoridad Portuaria de Cartagena (APC). Memoria AP Cartagena 2020.pdf; APC: Cartagena, Colombia, 2020. [Google Scholar]
- Juza, M.; Mourre, B.; Renault, L.; Gómara, S.; Sebastián, K.; Lora, S.; Beltran, J.P.; Frontera, B.; Garau, B.; Troupin, C.; et al. SOCIB operational ocean forecasting system and multi-platform validation in the Western Mediterranean Sea. J. Oper. Oceanogr. 2016, 9, s155–s166. [Google Scholar] [CrossRef]
- Sotillo, M.G.; Cerralbo, P.; Lorente, P.; Grifoll, M.; Espino, M.; Sanchez-Arcilla, A.; Álvarez-Fanjul, E. Coastal ocean forecasting in Spanish ports: The SAMOA operational service. J. Oper. Oceanogr. 2019, 13, 37–54. [Google Scholar] [CrossRef]
- Sotillo, M.G.; Mourre, B.; Mestres, M.; Lorente, P.; Aznar, R.; García-León, M.; Liste, M.; Santana, A.; Espino, M.; Álvarez, E. Evaluation of the Operational CMEMS and Coastal Downstream Ocean Forecasting Services During the Storm Gloria (January 2020). Front. Mar. Sci. 2021, 8, 644525. [Google Scholar] [CrossRef]
- García-León, M.; Sotillo, M.G.; Mestres, M.; Espino, M.; Fanjul, E. Improving Operational Ocean Models for the Spanish Port Authorities: Assessment of the SAMOA Coastal Forecasting Service Upgrades. J. Mar. Sci. Eng. 2022, 10, 149. [Google Scholar] [CrossRef]
- Sámano, M.L.; Bárcena, J.F.; García, A.; Gómez, A.G.; Álvarez, C.; Revilla, J.A. Flushing time as a descriptor for heavily modified water bodies classification and management: Application to the Huelva Harbour. J. Environ. Manag. 2012, 107, 37–44. [Google Scholar] [CrossRef] [PubMed]


| Harbour | Surface (km2) | Mean Depth (m) | Volume Considered (m3) |
|---|---|---|---|
| Huelva | 5.04 | 10.3 | 51.91200 |
| Gijón | 0.95 | 11.4 | 10.80162 |
| Cartagena | 0.95 | 20.3 | 19.31455 |
| Harbour | Domain | Extension (km) | Dimension (Cells) |
|---|---|---|---|
| Huelva | Coastal | 106 × 70.5 | 303 × 202 |
| Harbour | 26 × 24.3 | 372 × 347 | |
| Gijón | Coastal | 77.9 × 40 | 223 × 115 |
| Harbour | 15.5 × 9.9 | 222 × 142 | |
| Cartagena | Coastal | 55.4 × 39 | 159 × 112 |
| Harbour | 17.26 × 8.13 | 177 × 132 |
| Variable | Number of Data for the Validation | ||
|---|---|---|---|
| Huelva | Gijón | Cartagena | |
| Atmospheric pressure | 1729 | 224 | 452 |
| Meteorological tide | 1793 | 1463 | 2752 |
| Currents through the mouth | 2161 | 1729 | 2752 |
| Variable | Statistical | Huelva | Gijón | Cartagena |
|---|---|---|---|---|
| Atmospheric pressure | RMSD | 256.23 hPa | 120.38 hPa | 111.17 hPa |
| R | 0.61 | 0.87 | 0.83 | |
| Meteorological tide | RMSD | −0.0009 m | −0.01 m | 0 m |
| R | 0.57 | 0.73 | 0.88 | |
| Currents through the mouth | RMSD | −0.01 m/s | −0.03 m/s | 0.009 m/s |
| R | 0.76 | 0.45 | 0.34 |
| Mean TR | Days above Average (%) | |
|---|---|---|
| HUELVA | 27 days | 28 |
| GIJÓN | 21 days | 27 |
| CARTAGENA | 25 days | 25 |
| Days with Renewal Time Above Average | |||
|---|---|---|---|
| Cause | |||
| Wind (%) | Atmospheric Pressure (%) | Unknown (%) | |
| HUELVA | 20 | 32 | 48 |
| GIJÓN | 26 | 44 | 30 |
| CARTAGENA | 53 | 27 | 20 |
Disclaimer/Publisher’s Note: The statements, opinions and data contained in all publications are solely those of the individual author(s) and contributor(s) and not of MDPI and/or the editor(s). MDPI and/or the editor(s) disclaim responsibility for any injury to people or property resulting from any ideas, methods, instructions or products referred to in the content. |
© 2023 by the authors. Licensee MDPI, Basel, Switzerland. This article is an open access article distributed under the terms and conditions of the Creative Commons Attribution (CC BY) license (https://creativecommons.org/licenses/by/4.0/).
Share and Cite
Samper, Y.; Espino, M.; Liste, M.; Mestres, M.; Alsina, J.M.; Sánchez-Arcilla, A. Study of Atmospheric Forcing Influence on Harbour Water Renewal. Water 2023, 15, 1813. https://doi.org/10.3390/w15101813
Samper Y, Espino M, Liste M, Mestres M, Alsina JM, Sánchez-Arcilla A. Study of Atmospheric Forcing Influence on Harbour Water Renewal. Water. 2023; 15(10):1813. https://doi.org/10.3390/w15101813
Chicago/Turabian StyleSamper, Yaiza, Manuel Espino, Maria Liste, Marc Mestres, José M. Alsina, and Agustín Sánchez-Arcilla. 2023. "Study of Atmospheric Forcing Influence on Harbour Water Renewal" Water 15, no. 10: 1813. https://doi.org/10.3390/w15101813
APA StyleSamper, Y., Espino, M., Liste, M., Mestres, M., Alsina, J. M., & Sánchez-Arcilla, A. (2023). Study of Atmospheric Forcing Influence on Harbour Water Renewal. Water, 15(10), 1813. https://doi.org/10.3390/w15101813