Article

Spatial–Temporal Variability of Climatic Water Balance in the Brazilian Savannah Region River Basins

by
Fernanda Laurinda Valadares Ferreira
1,*,
Lineu Neiva Rodrigues
1,2,
Daniel Althoff
3 and
Ricardo Santos Silva Amorim
1
1
Department of Agricultural Engineering, Federal University of Viçosa (UFV), Peter Henry Rolfs Ave., Viçosa 36570-000, MG, Brazil
2
Brazilian Agricultural Research Corporation, Embrapa Cerrados, BR-020, km 18, s/n–Planaltina, Brasília 73310-970, DF, Brazil
3
Department of Physical Geography, Stockholm University, Universitetsvägen 10A, 106 91 Stockholm, Sweden
*
Author to whom correspondence should be addressed.
Water 2023, 15(10), 1820; https://doi.org/10.3390/w15101820
Submission received: 20 March 2023 / Revised: 25 April 2023 / Accepted: 8 May 2023 / Published: 10 May 2023
(This article belongs to the Topic Hydrology and Water Resources Management)

Abstract

:
The evaluation of water and energy cycles from the estimation of water balance is a fundamental instrument to assess the water potential of a region. Thus, the objective of this study was to evaluate the probable monthly water deficit and surplus in Cerrado river basins and the trend of monthly data on climatic water balance (CWB) and its input variables in the study region. Monthly data on precipitation (P) and reference evapotranspiration (ETo) from January 2003 to December 2019 were used. The deficit and the probable monthly water surplus were obtained from the CWB for each of the 4531 ottobasins. For this, the frequency equal to or greater than 80% of permanence in time was used as a reference. Trend analysis was applied. In the rainy season, most ottobasins showed positive CWB. On the other hand, in the period of lower water availability, most ottobasins showed a negative balance. In all months, there was some ottobasin with a significant trend both for CWB and for P and ETo. In most situations, these trends were a decrease in CWB and monthly P and an increase in monthly ETo.

1. Introduction

The Brazilian Cerrado region accounts for about 45% of the national agricultural area, being responsible for producing 35% of cattle, 52% of soybeans, 52% of sugarcane, 54% of corn, and 96% of cotton [1,2,3,4]. In addition, 15% of agricultural establishments are located in this biome, where 32% of the country’s gross agricultural income is generated, and annual agricultural crops account for 40% of the country’s total production [2]. In addition, the Cerrado Biome plays an important role in the dynamics of water resources since it has segments of 10 of the 12 hydrographic regions of Brazil [5].
Approximately 70% of the Cerrado’s 204 million hectares have potential for agricultural development [6]. The intensification of agriculture in the region is one of the main strategies to reduce imbalances in the ecosystem. In this context, irrigated agriculture, the main user of water resources, is one of the most promising techniques, and the greatest challenge is to conciliate its expansion with the availability of water resources, especially in regions that are already in a situation of water scarcity [7].
It is estimated that by 2030 the irrigated area in Brazil will increase by 3.64 Mha, representing an average growth of 200,000 hectares per year, that is, an increase of 45% over the current area [8]. About 64% of the irrigated area in Brazil is located in the Cerrado region [9], which contains approximately 80% of all center pivots in the country [10]. Considering the current scenario of water use in the region and the potential for the emergence of conflicts [11], it is essential to evaluate and improve tools that can assist in the management of water resources at the river basin scale. In this region, it is increasingly important to produce more with a smaller volume of water.
Due to the variations that occur in the hydrological cycle, excessive use of water resources, and low effectiveness of water management programs, water scarcity has been accentuated in several regions of the world [12,13]. Changes that occur in the hydrological cycle may have a direct influence on precipitation (quantity, periodicity, and duration), evaporation, temperature, and streamflow, thus influencing the availability of water and the occurrence of extreme events [14,15], which significantly affect socioeconomic, environmental, and agricultural aspects [16].
The evaluation of water and energy cycles from the estimation of water balance, besides being a way of understanding the dynamics of basins in relation to these changes [17], is an instrument that allows the assessment of the water potential of a region [18]. Understanding the water balance, even if simplified, is important for understanding the processes of degradation and conservation of water resources [19].
According to Berghuijs et al. [20], seasonal water balance has an imprint on the signatures of streamflow variability over time and a wide range of states (minimum flows and maximum flows). In general, the seasonal water balance is a measure that fits both short-term and long-term hydrological responses.
According to Jesus et al. [21] and Souza et al. [19], quantitative information on the variables precipitation (P) and reference evapotranspiration (ETo), as well as climatic water balance (CWB), is of great importance in the analysis of the severity, distribution, and frequency of water deficits. This information is also important for the evaluation of water availability and the occurrence of extreme events, such as droughts and floods, which are fundamental for the efficient management of water resources [17].
Given the changes in climate caused by anthropogenic activities as well as their potential impact on the water cycle, it is important to know the conditions of the earth’s surface and atmosphere [17]. The net flow of water on the earth’s surface (difference between precipitation and evapotranspiration), which, on the continents, corresponds to the sum of surface and subsurface runoff, is a key aspect of the water cycle [22].
According to Assad et al. [1], climate change is evident in the Cerrado region. The increase in temperature leads to an increase in potential evapotranspiration, and there is not necessarily an increase in precipitation, so there is a significant increase in the water deficit. These expected changes in climate variables may result in changes in the hydrological regime and, consequently, in water availability and water allocation processes [23]. In addition, anomalies in these climatic variables are the main causes of low yield. Thus, monitoring climate dynamics is extremely important for the optimization of agricultural production [24].
In this scenario, it is important to know which regions are at higher risk of compromising water availability to meet water demands. This knowledge is fundamental for the strategic planning of the economic development of a region. Water balance is one of the tools that can be used for this purpose, as it portrays the behavior of the water regime, as carried out by Cassettari and Queiroz [25] in a study on water balance in a river basin in the area of transition between the Cerrado and Amazon biomes.
Several studies related to climatic water balance have been conducted in parts of the Cerrado [25,26,27,28,29,30]. For the management of water resources, however, it is important to evaluate the region in an integrated manner. In this context, the aim of this study was to evaluate the probable monthly water deficit and surplus in river basins of the Cerrado and the trend of monthly data of climatic water balance (CWB) and its input variables, precipitation (P) and reference evapotranspiration (ETo), in the study region.

2. Materials and Methods

2.1. Study Area

The study area comprises the Cerrado Biome (Figure 1a), which occupies approximately 24% of the Brazilian territory and covers about 204 million hectares [31]. The reference adopted for the analysis was the level 5 ottocoded hydrographic base [32]. This base is the official coding of basins in Brazil. In total, 4531 ottobasins were evaluated (Figure 1b).
The Cerrado Biome is predominantly classified as a region with a tropical savanna climate (Aw), according to Köppen’s climatic classification [33]. The Cerrado climate is characterized by having two well-defined seasons: rainy and dry. The dry season comprises the months from May to September, and the rainy season usually extends from October to April, accounting for approximately 90% of the total annual precipitation. In all months of the year, the average air temperature is higher than 18 °C and precipitation in the driest month is less than 60 mm [34,35].
The Cerrado has a transition to a warm semi-arid climate on the border with the Caatinga, to a tropical monsoon climate on the border with the Amazon and the Pantanal, and to a temperate climate on the border with the Atlantic Forest. These transition areas are important to better understand the climate variation in the Cerrado, mainly due to the spatiotemporal distribution of precipitation throughout the year [36].
According to Mapbiomas [31], the Cerrado has approximately 53.6% of its surface covered by native vegetation (109.4 Mha), 31.2% by planted pasture (63.6 Mha), 11.8% by annual and perennial agriculture (24.1 Mha), 1.9% by planted forest (3.8 Mha), and 1.5% by urban areas and others (3.1 Mha).

2.2. Monthly Climatic Water Balance (CWB)

The monthly CWB values, in mm, of the Cerrado ottobasins were obtained using the calculation of the difference between monthly P and ETo (CWB = P − ETo), as performed by Byrne and O’Gorman [22] and Prăvălie et al. [37]. CWB was estimated based on the frequency of exceedance equal to or greater than 80%. The calculations associated with these estimates were performed in the R environment [38].
P and ETo data for the Cerrado ottobasins were obtained from the HydroCerrado database [39], for the period from January 2003 to December 2019. P and ETo data are gridded at 0.1° spatial resolution (~100 km2) and the average daily value was extracted for each ottobasin (with an average size of 569 km² and a median of 185 km²). In the HydroCerrado, daily precipitation data were obtained from the integrated Multi-Satellite Retrievals for the Global Precipitation Measurement (GPM) mission (IMERG) [40,41], and the daily reference evapotranspiration data were obtained from Althoff et al. [42].
Based on each monthly period, the frequency of the occurrence of water deficit and surplus was calculated using the equation of Kimball [43], Equation (1).
F = m n + 1
where:
  • F = frequency (%)
  • m = order of the monthly water deficit and/or surplus event; and
  • n = number of observations.

2.3. Analysis of the Stationarity of the Historical Series of the Monthly Climatic Water Balance (CWB), Precipitation (P), and Reference Evapotranspiration (ETo)

The stationarity test was applied to the data to analyze whether or not the CWB has any trend. The CWB input variables, P and ETo, were also analyzed to check whether or not there is a trend and their influence on the monthly CWB in the Cerrado ottobasins.
For trend analysis of historical data of CWB, total monthly P, and total monthly ETo in the Cerrado ottobasins, the Run test [44] was applied to evaluate the randomness of the series. The Mann-Kendall test [45,46] was used to evaluate whether the data series showed a temporal trend of statistically significant changes, which may be negative or positive. The Pettitt test [47] was applied to confirm whether or not there was stationarity. Finally, the Sen Slope test [48,49] was used to measure the magnitude of the trends. The tests were applied considering a significance level of 5% [50,51].
The calculations associated with all trend tests were performed in the R environment [38], through the packages “randtests” with the function “runs.test”, “Kendall” with the function “MannKendall” and “trend” with the functions “pettitt.test” and “sens.slope”.

3. Results and Discussion

3.1. Reference Evapotranspiration (ETo) and Precipitation (P) in the Cerrado

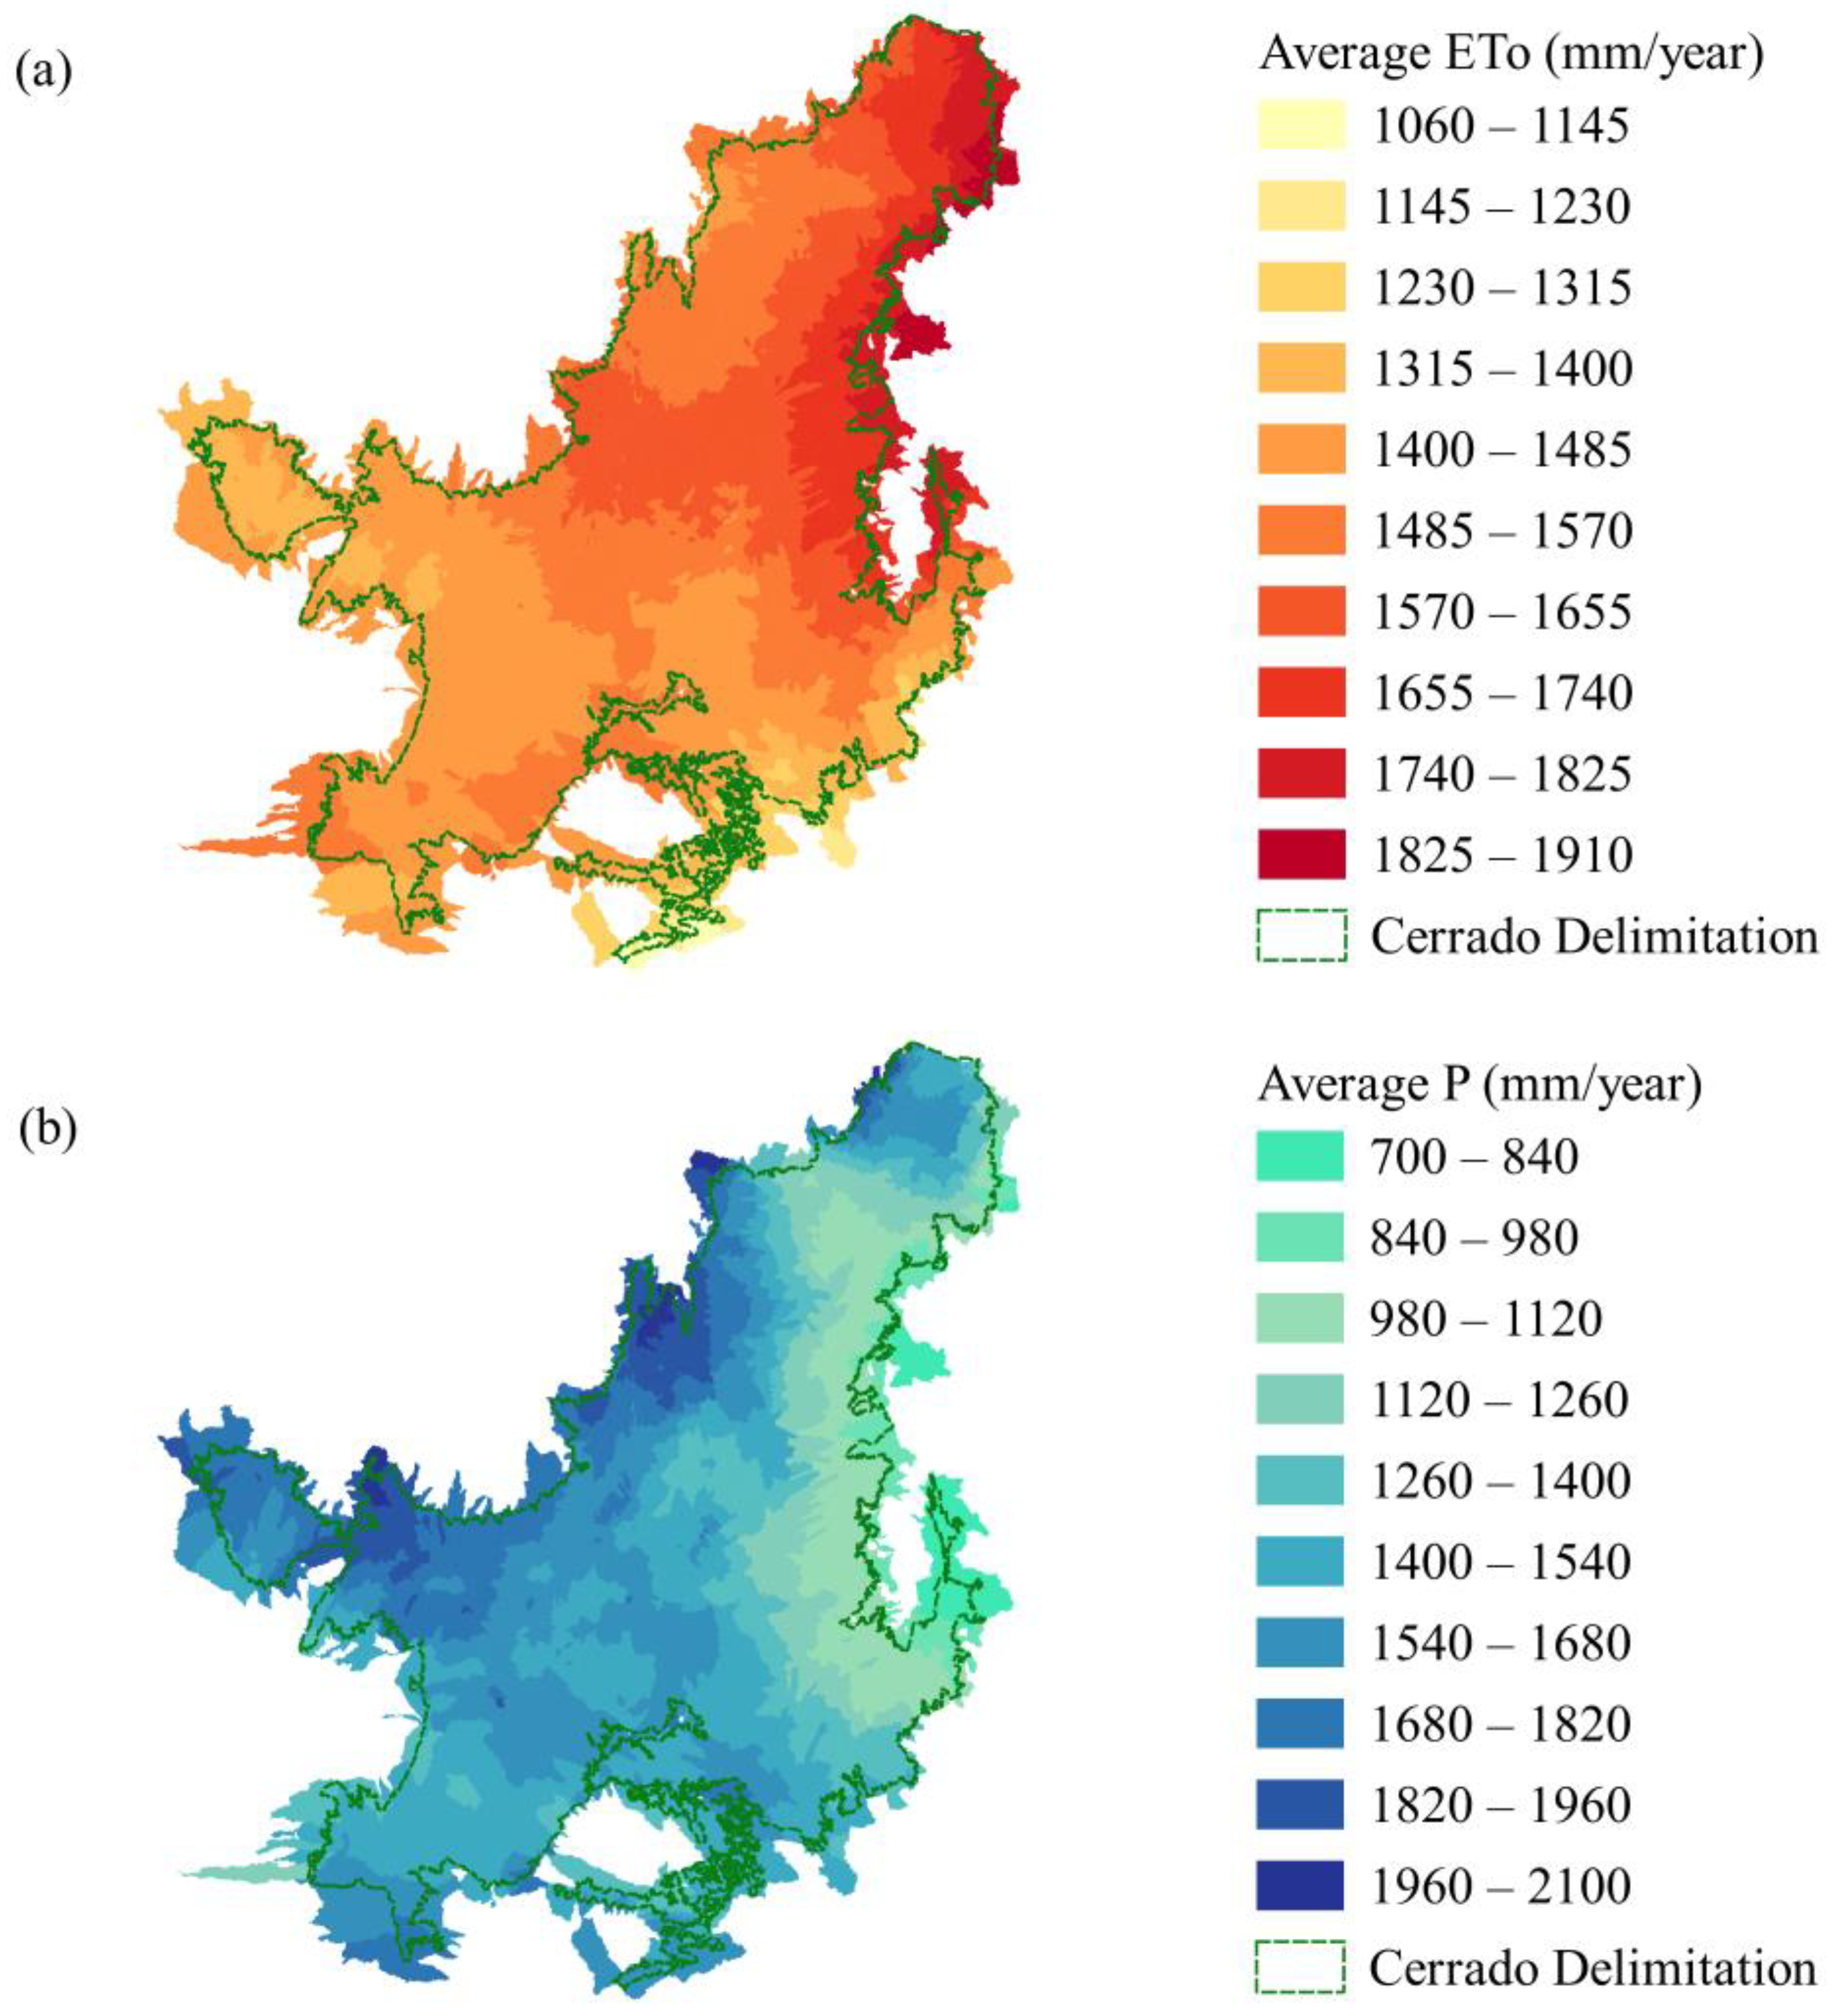
The average total annual reference evapotranspiration (ETo) and precipitation (P) between 2003 and 2019 of the Cerrado ottobasins are shown in Figure 2. The figure shows a significant variation in the average total annual ETo, with values ranging from 1060 to 1903 mm and an average of 1563 mm, with an increase in ETo from west to east and from south to north. For the average total annual P (Figure 2b), the values ranged between 700 and 2063 mm, with an average of 1471 mm, with a reduction in precipitation from west to east and from south to north, corroborating the study conducted by Sano et al. [52].
The highest average total annual ETo was 1902.6 mm in the ottobasin of 74453, located between the municipalities of Ribeira do Piauí and São José do Peixe in the state of Piauí (PI-location, Figure 1), a region located in the area of transition between the Cerrado and Caatinga biomes. The lowest average of ETo was 1061 mm in the ottobasin of 86424 located among the municipalities of Tibagi, Ventania, and Piraí do Sul in the state of Paraná (PR-location, Figure 1), a region located in the area of transition between the Cerrado and Atlantic Forest biomes. For monthly ETo, the highest average over the years was 205.4 mm, observed in October, in the ottobasin of 74277 located among the municipalities of Juazeiro do Piauí, Castelo do Piauí, and Buriti dos Montes, in the state of Piauí, a region also located in the area of transition between Cerrado and Caatinga. The month with the lowest monthly average was June with 46.9 mm, which is also in the ottobasin of 86424 between the Cerrado and Atlantic Forest biomes.
Althoff et al. [42], when evaluating ETo in Brazil, found that the highest values of ETo usually occur in October in the northeast region, which faces heat waves with high solar radiation, a maximum daily temperature reaching 40 °C, low relative humidity (<40%), and high wind speed. On the other hand, the authors reported that the lowest monthly average was observed in June in the southern region, corroborating the results found in the present study.
Regarding precipitation, the highest average total annual P was 2062.7 mm in the ottobasin of 64432, located in the municipality of Araguacema in the state of Tocantins (TO-location, Figure 1), a region located near the area of transition between Cerrado and Amazon. The lowest average total annual P was 700.9 mm in the ottobasin of 77692, located among the municipalities of Paramirim, Caetité, and Livramento de Nossa Senhora in the state of Bahia (BA-location, Figure 1), a region located in the area of transition between Cerrado and Caatinga. For monthly P, in the period comprising the rainy season, the highest average over the years was equal to 411.6 mm observed in January in the ottobasin of 69413, located between the municipalities of São Miguel do Araguaia and Nova Crixás, in the state of Goiás (GO-location, Figure 1), a region also located near the area of transition between Cerrado and Amazon. During the dry season, the lowest precipitation average (0.03 mm) was observed in July in the ottobasin of 74982, located between the municipalities of Barreiras do Piauí and Gilbués, in the state of Piauí, a region also located in the area of transition between Cerrado and Caatinga.
These results corroborate those found by Campos and Chaves [53] in a study on the variability of precipitation in the Cerrado biome, which showed that the average precipitation values occur in the central region of the biome, the values lower than the regional average occur in the states of Piauí, Bahia, and northern Minas Gerais (MG-location, Figure 1), in the zone of transition to Caatinga, and the values higher than the average occur in the area of transition to the Amazon forest.
According to Althoff et al. [42], regions with lower ETo values, in general, have the highest precipitation since it is correlated with higher relative humidity and cloud cover, leading to lower solar radiation reaching the surface. Although there is a negative correlation between ETo and precipitation, it is not linear.

3.2. Evaluation of Monthly Water Deficit and Surplus

Figure 3 shows the monthly CWB of the Cerrado ottobasins for a frequency of permanence in time equal to or greater than 80%. For the rainy season, the CWB data showed that only about 0.6% of the ottobasins (29 ottobasins) had positive CWB in October; that is, these areas had a water surplus in this period. This number increases to 46.7% (2118 ottobasins) in November, 52.7% (2386 ottobasins) in December, 55.6% (2519 ottobasins) in January, 78.9% (3577 ottobasins) in February, 75.6% (3426 ottobasins) in March, and 26.0% (1179 ottobasins) in April. In October, at the beginning of the rainy season, there were only 29 ottobasins with positive CWB; that is, these areas have a higher P than ETo. These ottobasins are located to the west and northwest of the Cerrado, a region of transition to the Amazon Biome, a tropical climate with higher precipitation rates [36].
In relation to the dry season, from May to September, most of the Cerrado showed negative CWB. Only the months of May and June showed a few ottobasins with positive CWB, with 132 ottobasins (2.91%) in May and only 1 ottobasin (0.02%) in June. All other months, from July to September, showed negative CWB for all Cerrado ottobasins. In 80% of the time, the variation of CWB in the ottobasins, was from 73.4 to −143.0 mm in May, from 0.11 to −151.9 mm in June, from −26.6 to −172.9 mm in July, from −62.6 to −195.4 mm in August, and from −45.1 to −208.7 mm in September, with the lowest CWB values observed for the ottobasins of the east and northeast regions of the Cerrado.
The results obtained in the present study corroborate those of Jesus et al. [21], who studied CWB in the Cerrado and found a water deficit between April and September and a dry period with no water surplus between April and October. When analyzing CWB in the future scenario, these authors found that there will be an intensification of the water deficit in the dry period. Assad et al. [1] point to a probable increase in water deficits in the biome over the current century, which may restrict the various uses and increase conflicts over water use. Agriculture is one of the main users to suffer the consequences due to its vulnerability. According to Assad et al. [1], for agriculture to maintain and increase its production capacity in a sustainable manner, it is necessary to seek better conditions of adaptation, such as the development of better-adapted cultivars, improvements in pasture and irrigation management, and soil- and water-integrated management. The sustainable intensification of irrigation can be an important tool in agricultural development, especially in these periods in which P does not meet the needs of ETo.
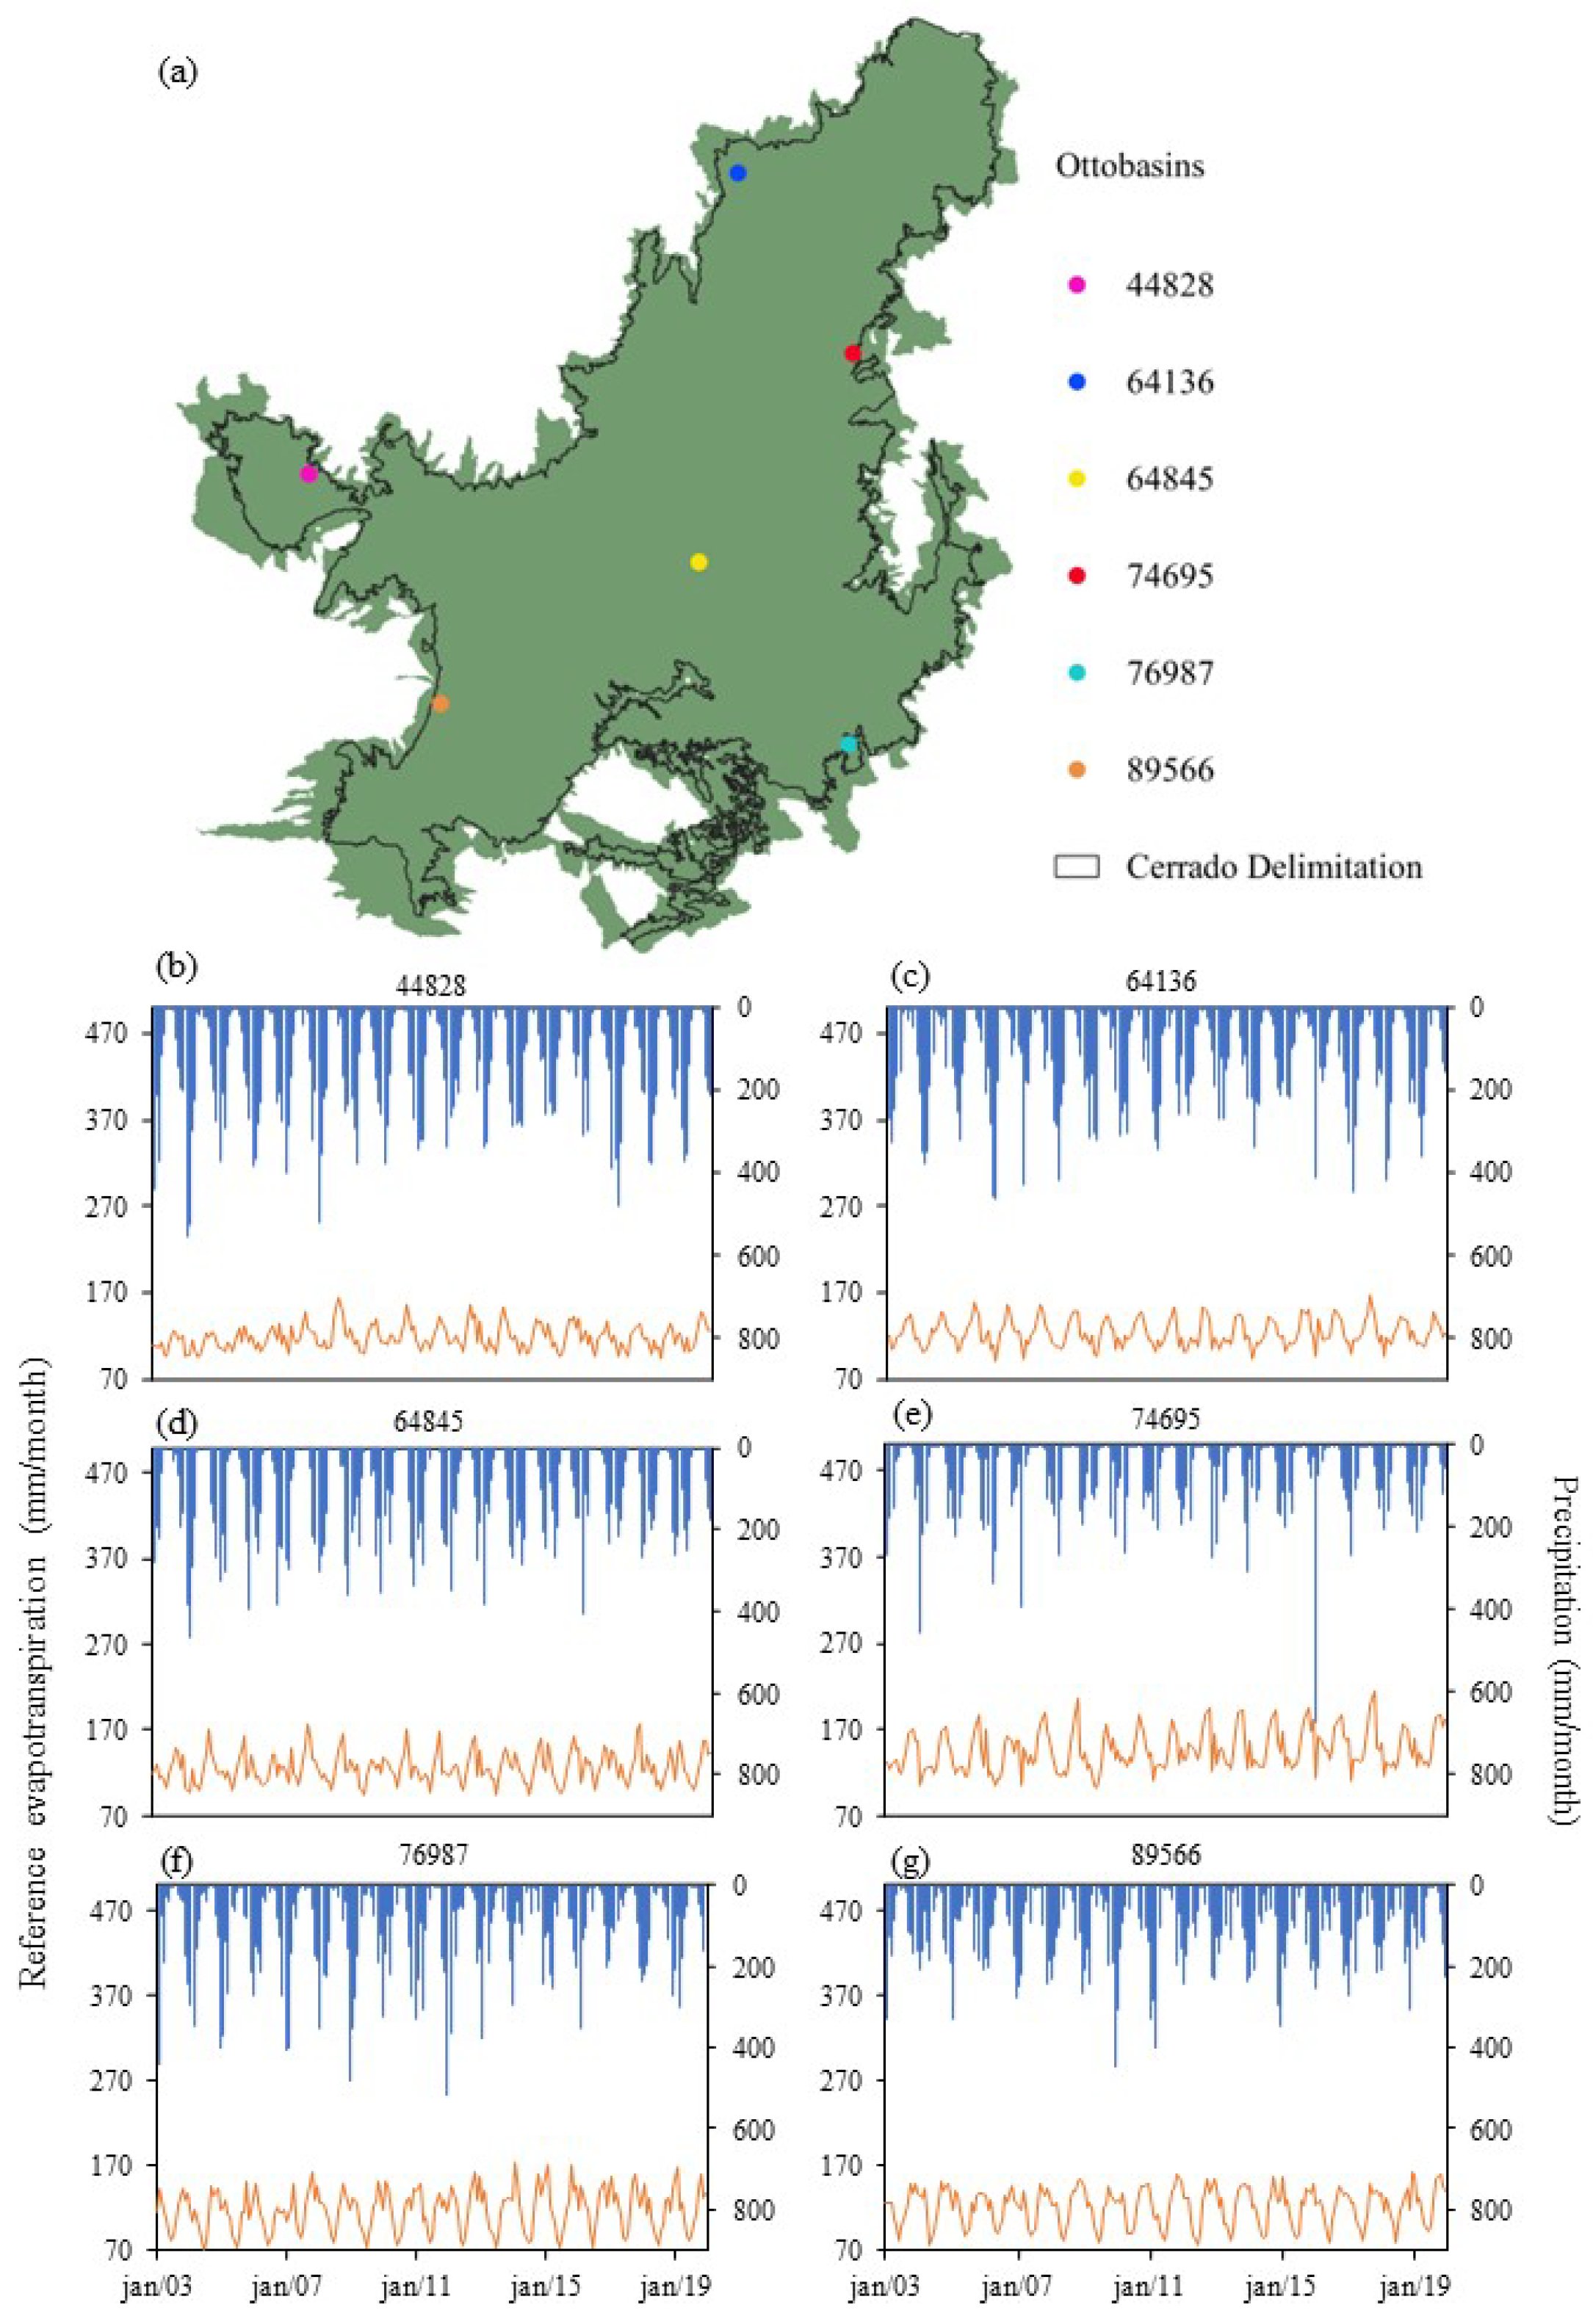
Based on the ottobasins of 44828, 64136, 64845, 74695, 76987, and 89566 distributed in different regions of the Cerrado biome (Figure 4a), the CWB components were analyzed from January 2003 to December 2019 and are represented in Figure 4b–g. There are different variations of ETo and P in the ottobasins (Figure 4). The ottobasin of 64136 (Figure 4c) located in the north of the state of Tocantins and the ottobasin of 74695 (Figure 4e) located between the states of Piauí and Bahia generally had P peaks in periods opposite to those of ETo peaks. The ottobasin of 76987 (Figure 4f) located in the South Central of the state of Minas Gerais and the ottobasin of 89566 (Figure 4g) located in the state of Mato Grosso do Sul (MS-location, Figure 1) between the municipalities of Rio Verde and São Gabriel do Oeste showed in general P peaks occurring together with ETo peaks. The ottobasin of 44828 (Figure 4b) located in the western part of the state of Mato Grosso (MT-location, Figure 1) and the ottobasin of 64845 (Figure 4d) located in the state of Goiás between the municipalities of Cocalzinho de Goiás and Padre Bernardo showed a greater correspondence between the peaks of P and ETo. These results agree with those found through the precipitation timing index in the Cerrado region by [36].
When analyzing the monthly CWB with a permanence time equal to 80% (Figure 3), for the ottobasins in question, a high variation was observed between them. The CWB of the ottobasins of 44828, 64136, and 64845 follows the oscillation with water deficit (negative values) in the dry season and water surplus (positive values) in the rainy season. In addition, it was observed that, for the ottobasins closest to the area of transition between the Cerrado and Amazon biomes, the value of the water surplus was higher. For the ottobasins 89566 and 76987, located near the transition between the Cerrado biome and the Pantanal, tropical climate, and between the Cerrado and the Atlantic Forest, temperate climate [36], respectively, these areas are generally characterized by regular rains and high temperatures, which leads to high ETo values, thus suppressing P and resulting in negative CWB for most months.
For the ottobasin of 74695, a water deficit was observed in all months; although this deficit varies according to the rainy or dry season, it is noticeable that P was not sufficient to meet the demand of ETo in all months of the year. Like this ottobasin, most ottobasins located to the east and northeast of the Cerrado show water deficits in all months, with the highest degree of severity in the months of drought (May to October). The variation of ETo observed in these ottobasins is due to the border of the region with the Caatinga, which has a warm semi-arid climate [36]. This transition to the Caatinga, in the northeast region of the Cerrado, is marked by heatwaves, with high solar radiation and maximum daily temperatures reaching 40 °C. As evapotranspiration is largely influenced by temperature [37], the eastern and northern regions of the Cerrado generally show higher rates of aridity [39]. So, there is probably a greater concern about changes in climatic variables in these areas of semi-arid climate, as they affect water balance and water availability [54].

3.3. Evaluation of the Stationarity of the Data of Monthly Climatic Water Balance (CWB) and the Input Variables Precipitation (P) and Reference Evapotranspiration (ETo)

The run test indicated that the time series of the studied variables are independent and random. In all months, a significant trend was detected in the CWB for some of the ottobasins (Table 1). In all months, for the most part, the trend was a reduction in CWB, that is, a trend toward water deficits. For the total monthly P, an input variable of the CWB, in all months, a significant trend was observed in some ottobasins (Table 1). In all months, for the most part, the trend was a reduction in total P. As observed for P, in the case of total monthly ETo, there was a significant trend in all months (Table 1). In all months, for the most part, the trend was an increase in total ETo.
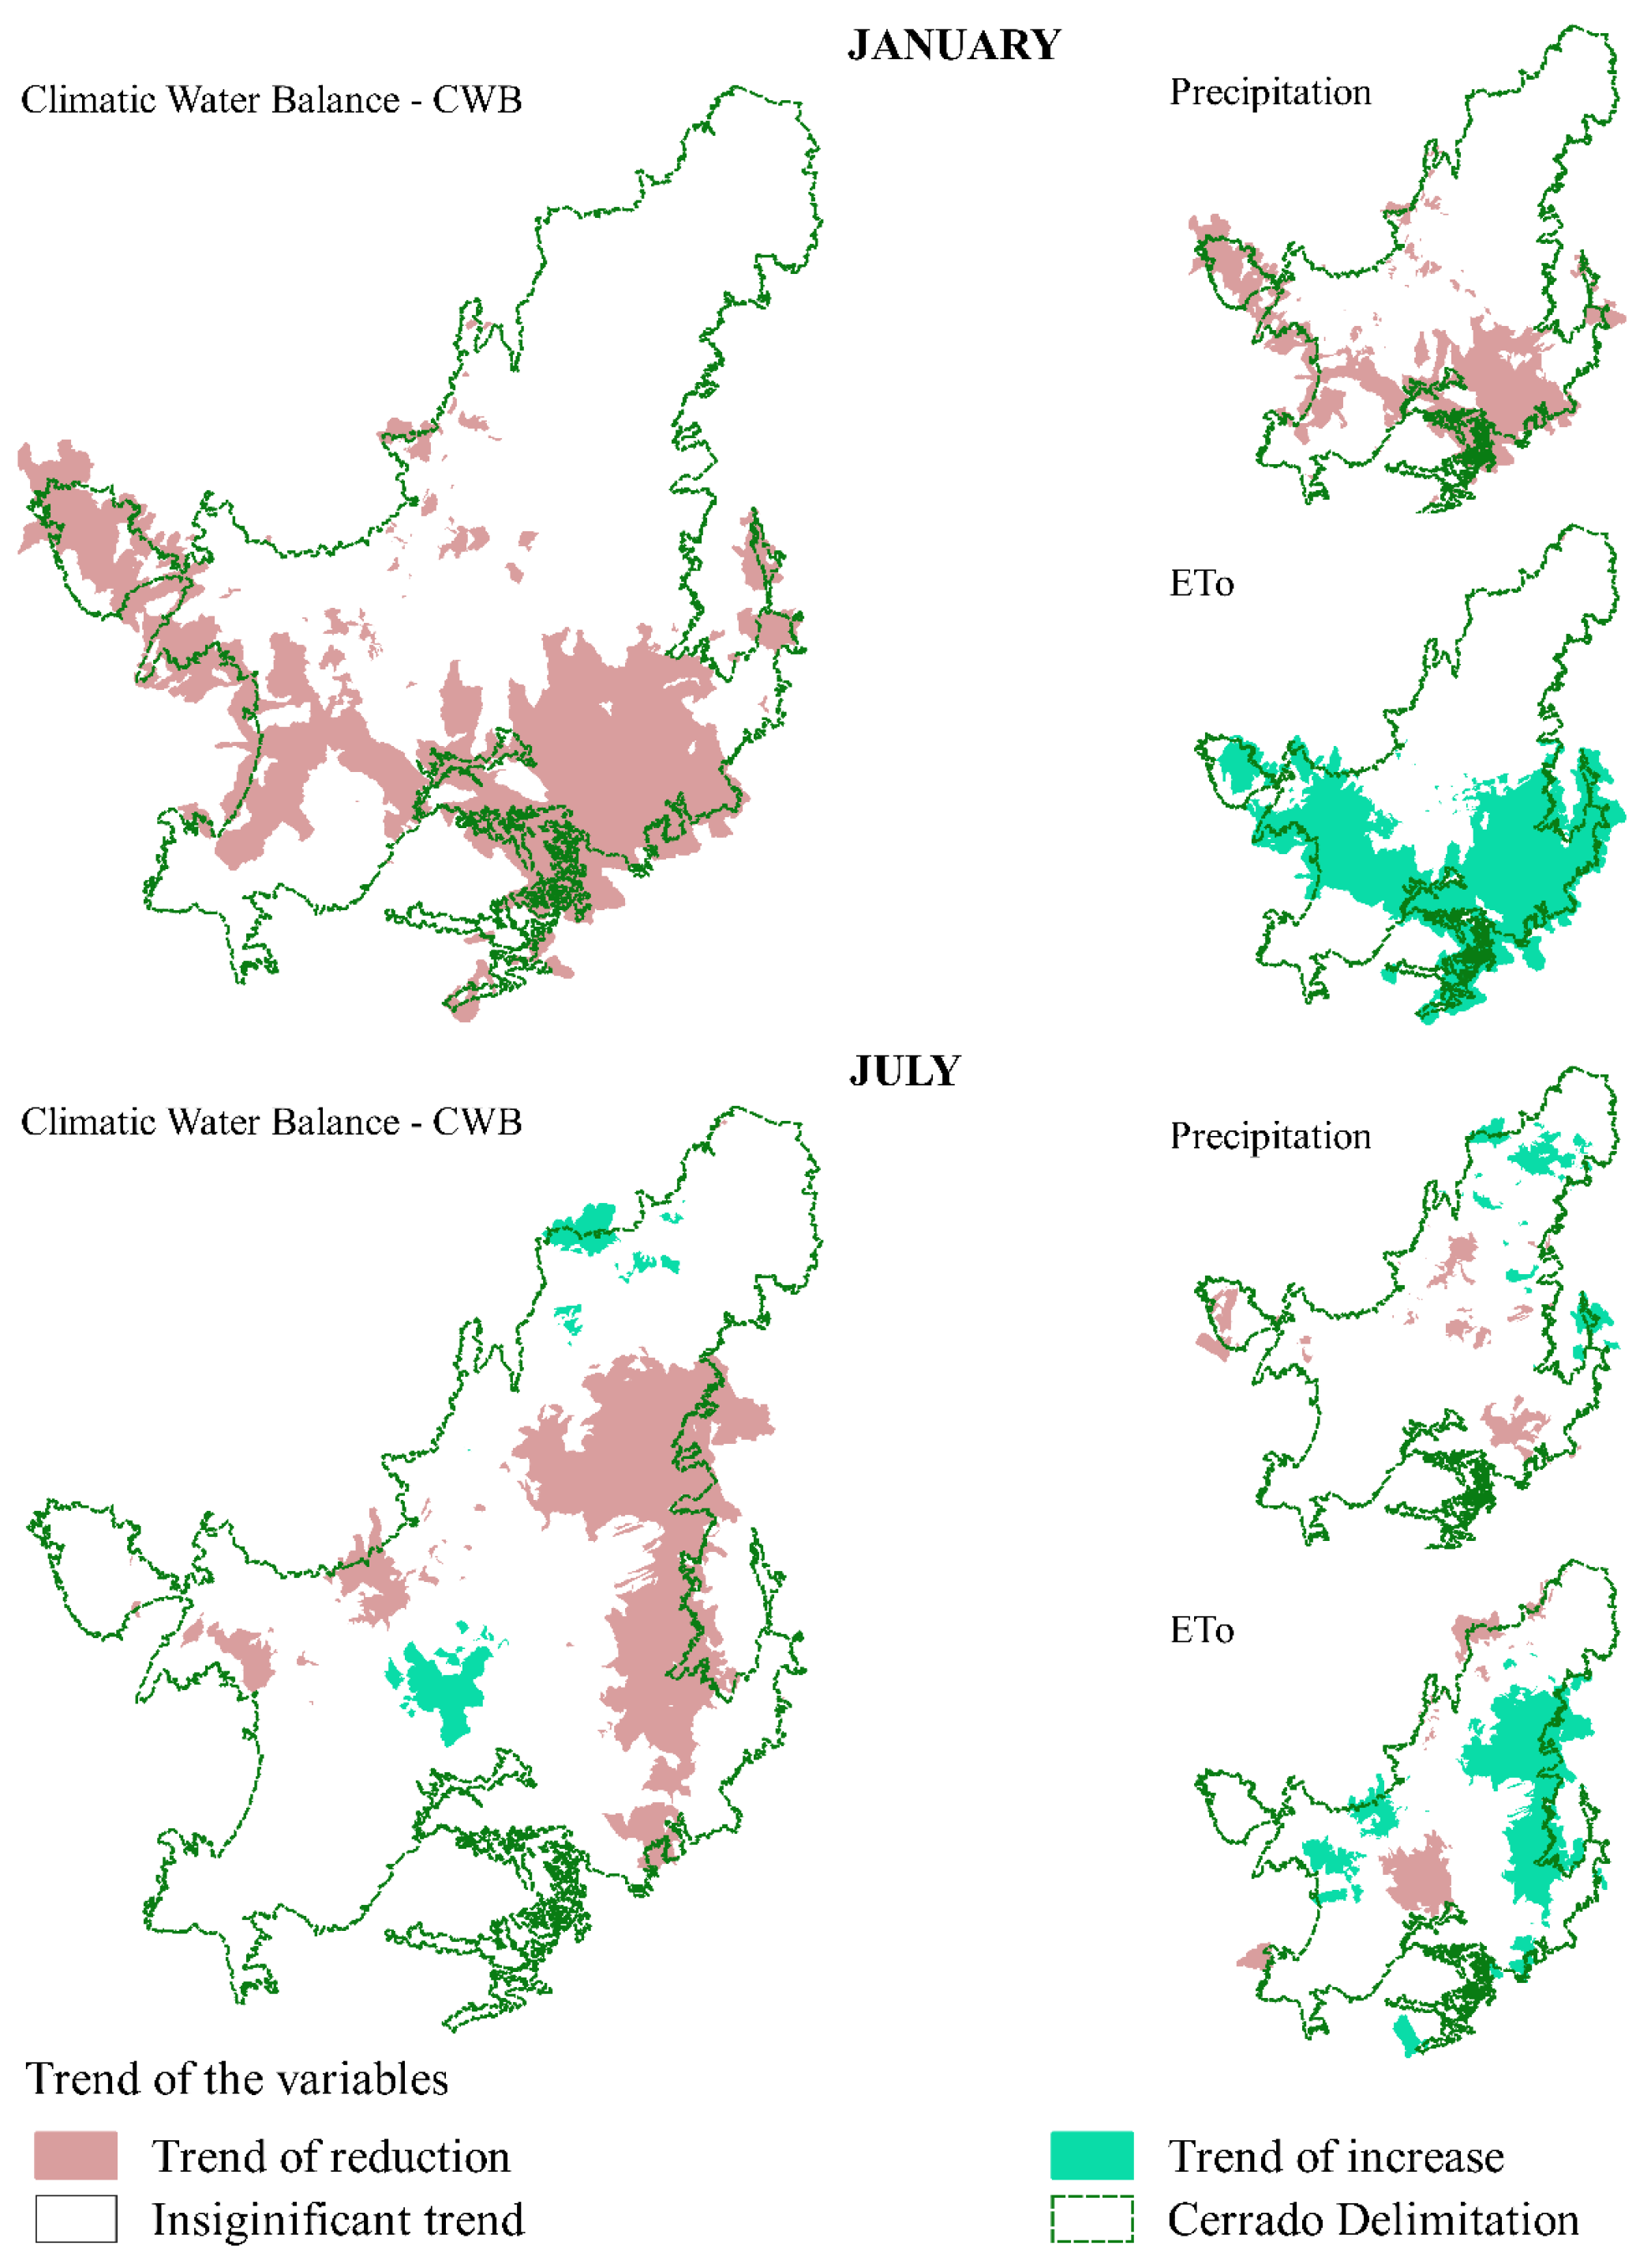
To represent the significant trends observed in the monthly CWB and the influence of its input variables, monthly P and ETo, on trends for the rainy season and for the dry season, the months of January and July were used as a reference, as in addition to having a great number of ottobasins with significant trends in the Cerrado (Figure 5), these are the months which account respectively for the highest and lowest average rainfall in the region, the main input variable in the CWB. It was found that, for January, 14.7% of the Cerrado ottobasins had significant trends of reduction in CWB and are distributed according to Figure 5. The areas with significant reductions in CWB correspond to areas with a significant trend of reduction in P, in 12.6% of the ottobasins, and a significant trend of increase in ETo, in 25.5% of the ottobasins. The reduction observed in the CWB in January is possibly due to the balance between P, with a trend of reduction, and ETo, with a trend of increase, hence reducing the CWB.
In July, the CWB had a significant trend in 16.4% of the Cerrado ottobasins, 12.7% with a trend of reduction, and 3.7% with a trend of increase. Trends in P were observed in 9.9% of the ottobasins, 3.9% with a trend of reduction, and 6.0% with a trend of increase. In turn, ETo showed a trend in 22.3% of the ottobasins, 7.2% with a trend of reduction, and 15.1% with a trend of increase. The behavior of the trends observed in the CWB is possibly related to the trends of the input variables of the CWB.
The positive trends of P in July corroborate studies conducted by Salviano et al. [55], in which this trend of increase was mainly found in semi-arid regions. Although there is this variation in the trends of increase and reduction in P, the predominance of a trend of reduction in precipitation in the region of the present study corroborates the results obtained by Assad et al. [1], who also found variations of precipitation in the Cerrado, with indications of both increase and reduction, but, in general, there was a predominance of reduction in precipitation. Another study that corroborates the results found here is the one conducted in the Cerrado by Campos and Chaves [53], who found that 14% of the stations evaluated showed a trend of reduction in precipitation in January and, in July (dry season), a reduction in precipitation in 76% of the 125 historical series analyzed.
Evapotranspiration results that corroborate the ones found here were those of Salviano et al. [55], who found high percentage of positive trends in evapotranspiration, especially in the central part of the country, a region consistent with the Cerrado biome. According to Beebe et al. [56], the increase in evapotranspiration may cause reduction in streamflow. Sousa and Moura [57], in a study conducted in Goiás, core of the Brazilian Cerrado, found a high negative correlation between evapotranspiration and streamflow, with a trend of 29.3% increase in evapotranspiration and a trend of reduction in streamflow in 2010 and 2020.
Siqueira et al. [58], in a study on climate change in a basin in the Cerrado, found reduction in streamflow, since the increase in evapotranspiration reduces water availability in soils and groundwater and alters energy flows. The reduction in streamflow compromises the availability for multiple uses of water and may cause the formation of islands and sand deposits, restricting navigation and accelerating the degradation of the water course [59], besides intensifying conflicts resulting from the difficulty in compatibilizing the demands with the availability [58].
Among the ottobasins that showed a significant trend, the average magnitude of variation of the monthly CWB, as well as the monthly P and ETo, is represented in Table 2. In this table, for example, for January, CWB was equal to −13.3 mm. This value is the average of 665 ottobasins (14.7%) with significant trends. This negative value, in this case, means that on average the trend is a reduction in 13.3 mm per year, with an average reduction in approximately 226 mm for the CWB in the ottobasins for the period from 2003 to 2019.
Table 2 shows that the greatest amplitudes of variation, for both the CWB and the variables P and ETo, occurred in January and December, with average reductions of 13.3 and 10.2 mm for the CWB, average reductions of 11.7 and 9.0 mm for P, and average increments of 2.1 and 1.0 mm for ETo, respectively.
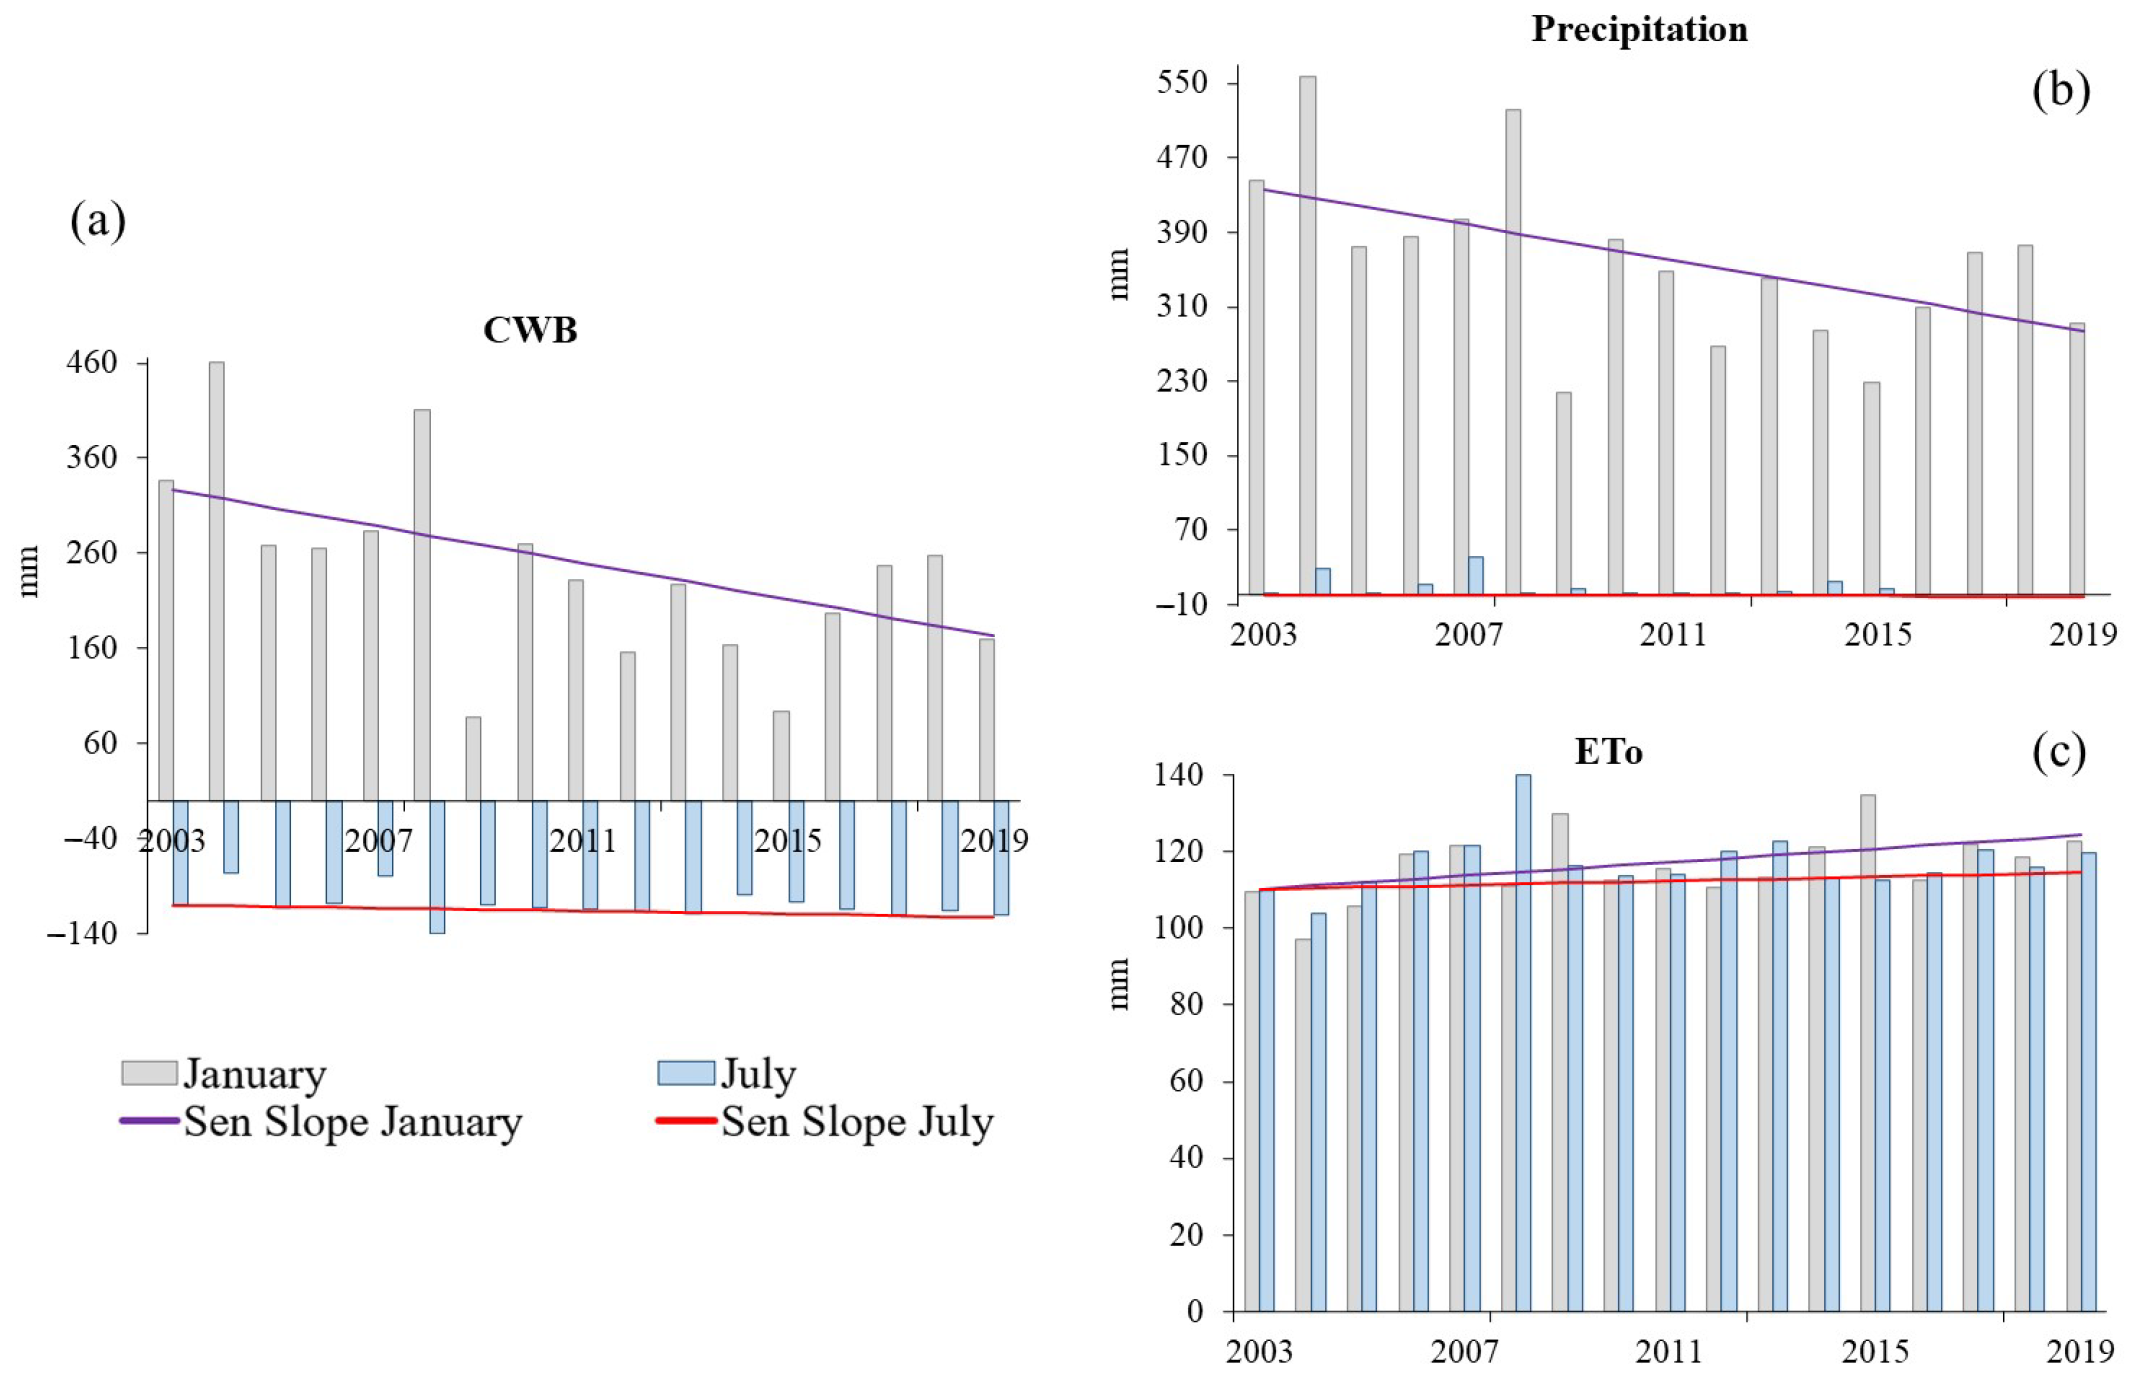
To represent these changes over the years, the ottobasin 44828, located in the state of Mato Grosso (Figure 4), which showed a trend in January and July for CWB, P, and ETo, is graphically represented in Figure 6.
The magnitude of the trend in January in the ottobasin of 44828 is greater than in July (Figure 6). The CWB of this ottobasin is decreasing in both January and July, with annual reduction rates of 9.6 mm and 0.8 mm, respectively; i.e., this rate of reduction in the monthly CWB totals 163.4 mm for January and 13.6 mm for July in the period from 2003 to 2019. There is also a trend of reduction in P in January and July, with an annual reduction rate of 9.5 mm/year and 0.1 mm/year, respectively; i.e., this rate of reduction in the total monthly P totals 161.2 mm for January and 2.1 mm for July in the period from 2003 to 2019. On the other hand, ETo tended to increase in January and July, with estimated annual increase rates of 0.9 mm/year and 0.3 mm/year, respectively; that is, the increase in the monthly ETo in the period from 2003 to 2019 totals 14.9 mm in January and 4.7 mm in July.
As in January and July, the other months had significant trends in CWB in the Cerrado ottobasins, and it was found that possibly these trends are also directly related to the trends of the input variables of CWB, P and ETo; that is, there is a negative nonlinear correlation between P and ETo.
Due to the land use and cover in the Cerrado, studies have shown a reduction in latent heat flux accompanied by an increase in sensible heat flux, resulting in higher air temperatures and a substantial decrease in humidity and precipitation near the surface [60]. Higher temperatures imply increased potential evapotranspiration; however, if there is no increase in precipitation to compensate, the water deficit will increase [1]. According to Siqueira et al. [58], in a study conducted in a basin in the Cerrado, higher evapotranspiration rates and lower precipitation result in less water available for runoff and infiltration. With a smaller volume of water infiltrated, there is less recharge of groundwater.

3.4. Relationship between the Variation of the Climatic Water Balance (CWB) and Water Availability

Climate change in the Cerrado region is evident. The trends observed in the climatic variables, with an increase in ETo and a reduction in P in most ottobasins, may result in changes in the hydrological regime and, consequently, in water availability and water allocation processes [23]. The ottobasins that showed negative CWB, that is, with water deficits, are the regions with the highest risk of compromising water availability and not having enough water to meet the demands.
The CWB with a frequency of 80% showed that, in the rainy season, the ottobasins in the western Cerrado (area of transition between the Cerrado and Amazon biomes), central, and southern regions were positive, that is, with water surplus, while the ottobasins to the north and east showed water deficits in all months.
The results found in the present study, in relation to the CWB, corroborate those obtained by Althoff et al. [36], who found that the ottobasins located in the area of transition between the Cerrado and Amazon biomes have significantly higher potential for water availability. Besides this region, the central and southern regions of the Cerrado also showed considerably higher potential water availability. On the other hand, the ottobasins located in the east and north of the Cerrado region have a lower potential for water availability since they are located in a zone of transition to a semi-arid climate.
September and October are the months in which the ottobasins show water deficits with a higher degree of severity. These months are those with higher occurrences of a greater risk of an increase in pressure on water availability, according to a study conducted by Althoff et al. [36]. The Cerrado has the largest energy supply from August to December, and its rainy season usually begins in October and extends until March or April. When the dry season lasts until the end of October, the flow in the rivers continues to decrease, and pressure on water resources increases. This justifies September and October being the months of highest risk in most of the Cerrado region [61].
The period in which the risk of increased pressure on water availability is higher is usually at the beginning of the rainy season. This indicates that agricultural activities can be compromised not only by the uncertainty of the distribution (spatial–temporal) of precipitation but also by the decrease in irrigation due to the lower availability of water courses [36].
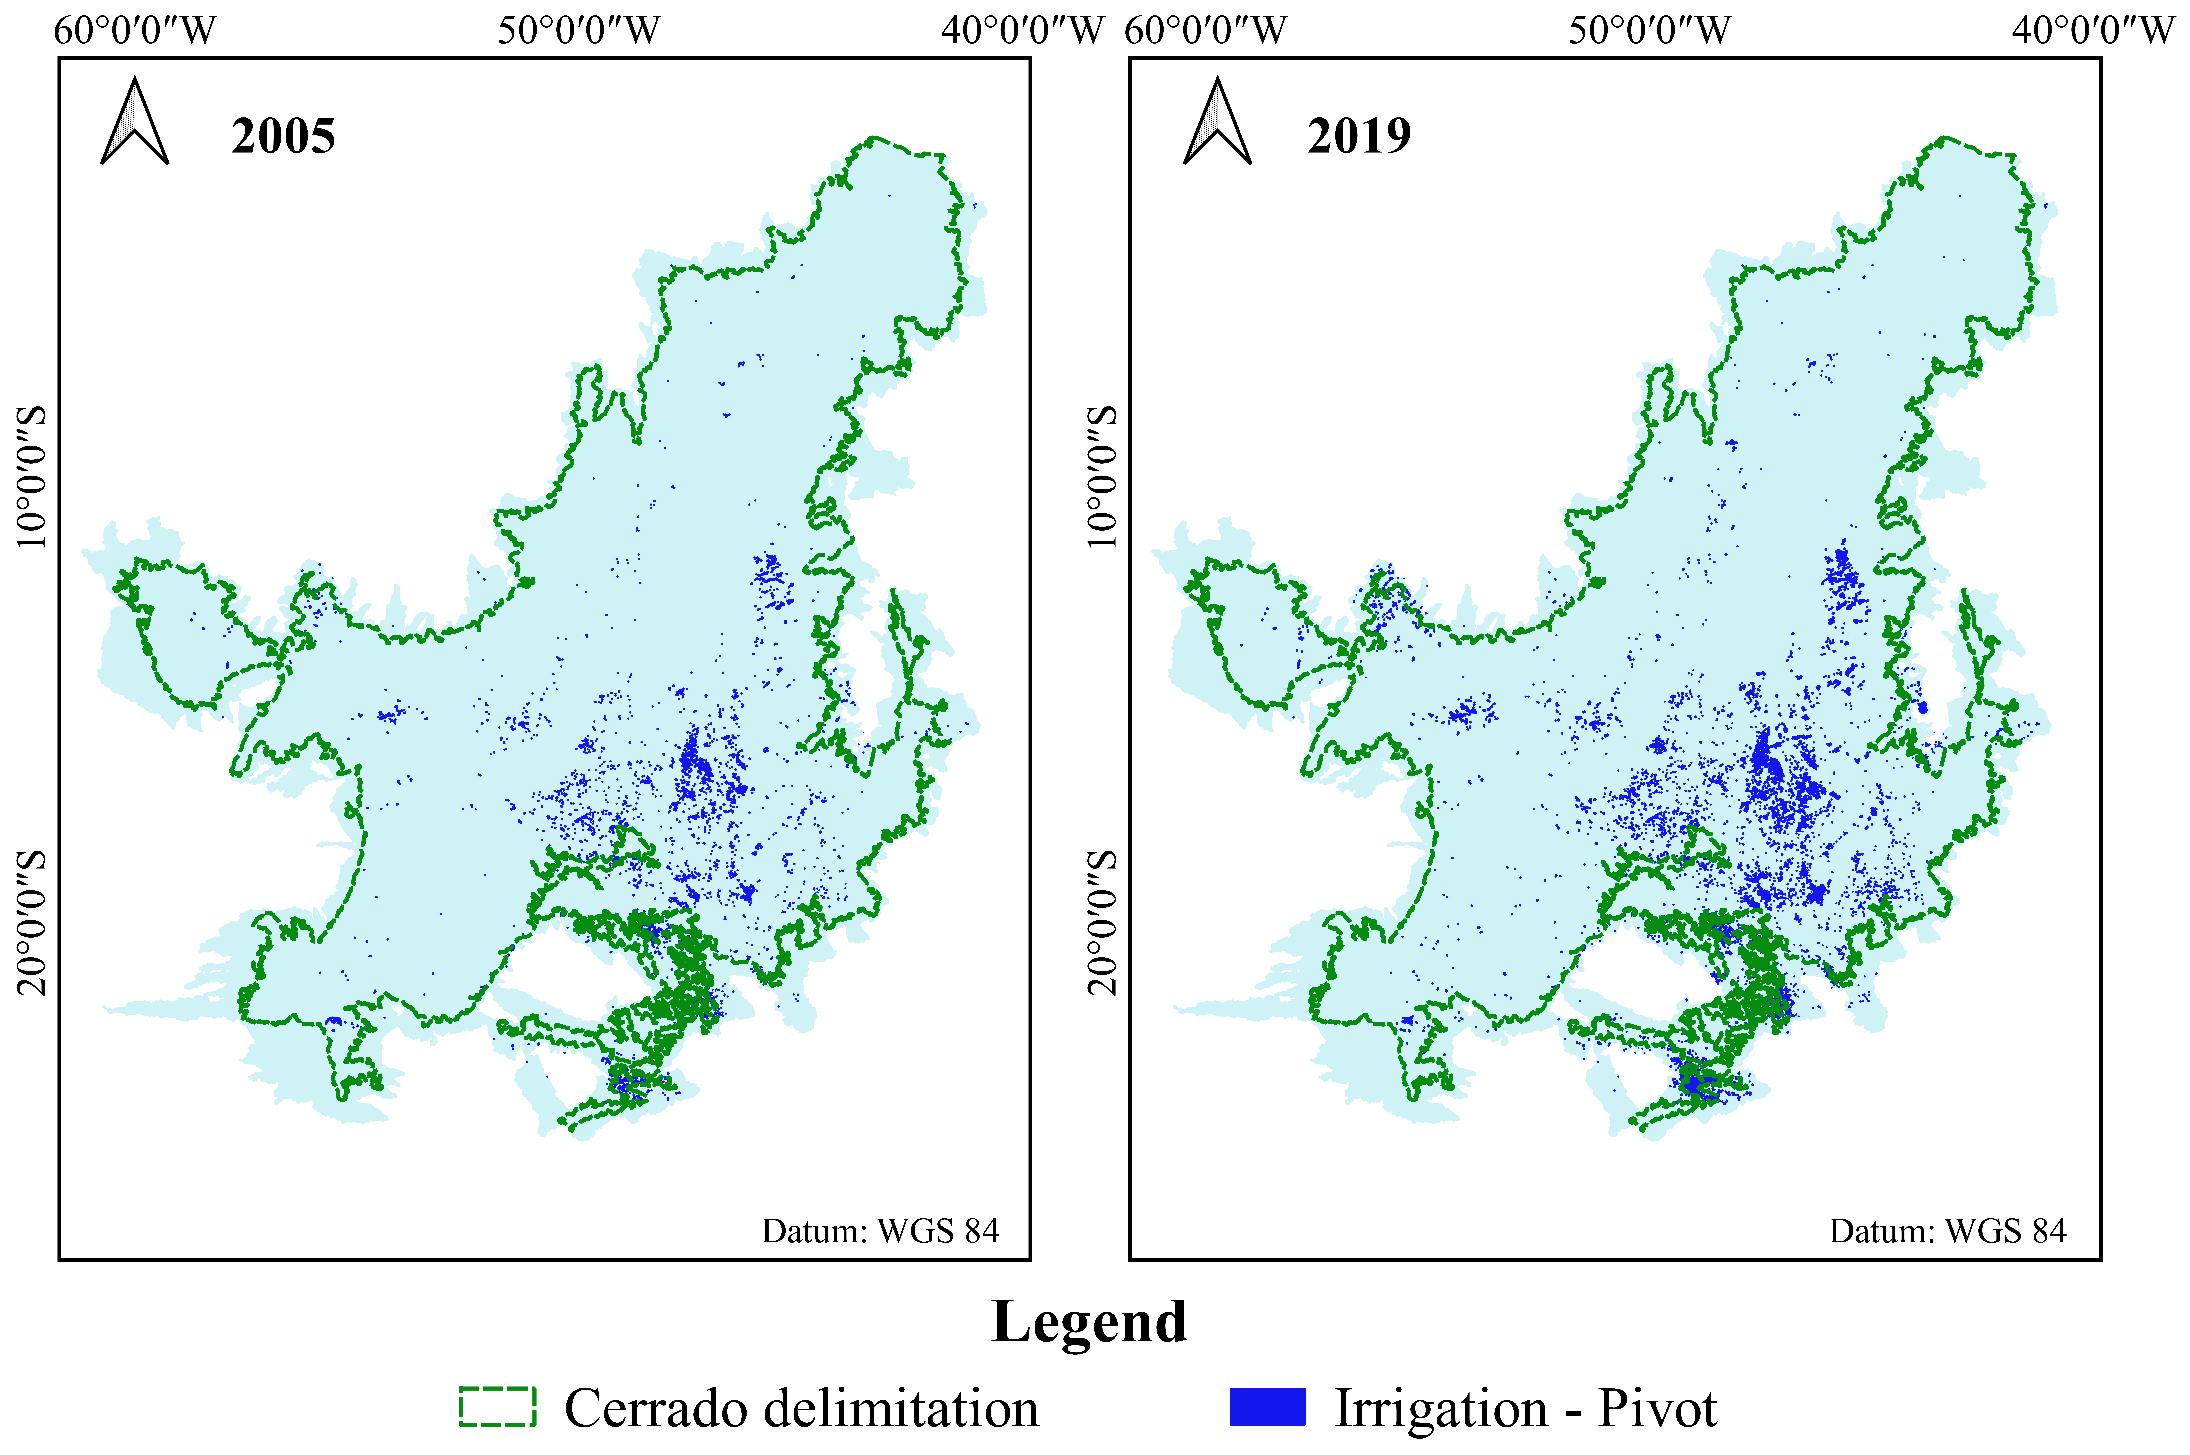
In the Cerrado, the expansion of areas with irrigated agriculture over the years occurred mostly without proper planning [39,62]. Figure 7 shows the irrigation by center pivots in the Cerrado in the years 2005 and 2019.
An increase in center pivot irrigation was observed in the Cerrado areas. In 2005, the number of pivots was around 7619, with a total irrigated area of approximately 581,253 hectares, increasing to approximately 19,088 pivots in 2019, covering an area of about 1291,330 hectares, an increase of 122% of the irrigated area in the biome.
The largest number of pivots is mainly concentrated in the south-central region of the Cerrado biome. In these regions, significant trends were observed for both CWB and monthly P and ETo. Thus, the increase in water demand for irrigation may be one of the factors of interference in the trends found in the present study. Oliveira et al. [5], in their study in the Brazilian Cerrado, found that trends in water balance components are partly due to changes in land use and cover. These changes can not only contribute significantly to the climate of the local territory but also affect neighboring regions [63,64,65,66,67,68,69].
According to Althoff et al. [36], this high concentration of center pivots in the south-central region of the Cerrado can be partially attributed to favorable conditions during the cultivation periods. The higher precipitation during periods when the climate is conducive to crop development results in higher yields and profitability.
The state with the highest percentage increase in area irrigated by center pivot within the Cerrado biome was Tocantins, with an increment of 306%, from 3478 hectares in 2005 to 14,115 hectares in 2019. Tocantins is part of a wider region called MATOPIBA, formed by the states of Maranhão (MA-location, Figure 1), Tocantins, Piauí, and Bahia. This region is an agricultural frontier in the Cerrado biome, which is characterized by rapid changes in land cover and land use for cultivation, mainly of soybean, cotton, and corn [62].
Among the states forming the MATOPIBA, Bahia has the largest irrigated area, especially in its western region, located in the Cerrado biome. This region had a percentage increase in the irrigated area of 147%, with 72,055 hectares (702 pivots) irrigated in 2005, which increased to 177,555 hectares (1598 pivots) in 2019. According to Pousa et al. [62], the western region of Bahia is one of the most active agricultural frontiers in the world; however, in recent years, water conflicts have increased in the region due to a reduction in water availability and an increase in the demand for water resources.
In addition to the western region of Bahia, other Cerrado regions showed CWB in water deficit in all months, or at least in the months of drought (Figure 3). Given the results found in the trends of monthly CWB, P, and ETo, if they continue, conflicts over water use may become increasingly frequent in the coming years.
Thus, in terms of adaptation, it is necessary to have strategies that encourage the diversification of production to increase the resilience of agroecosystems. Technology transfer, especially technologies that combine mitigation and adaptation, and ecologically sustainable and efficient production are ways to ensure the improvement of the viability of agriculture and food security [70].
According to Alizadeh and Mousavi [71], a technique that can be used efficiently in irrigation management is deficit irrigation, in which irrigation is performed during the growth stages in which the crop is sensitive to water deficit and limited in the other phenological stages. According to Evans and Sadler [72], deficit irrigation is a strategy that should be carefully managed and supported by advanced irrigation systems with flexible and technified systems.

4. Conclusions

The Cerrado shows great spatiotemporal variability in annual precipitation and evapotranspiration across its territory. The ottobasins in the area of transition between the Cerrado and the Amazon biome, in general, have more months with water surplus, while the ottobasins to the east and northeast of the Cerrado, area of transition to the Caatinga, show water deficits in all months. The severity of the water deficit is more pronounced in the months of drought, from May to October.
There were significant trends, mostly reductions, in the climatic water balance in different months. These trends were generally related to either negative trends in monthly precipitation and/or positive trends in monthly reference evapotranspiration, which are used in the estimation of the climatic water balance.
The trends observed in the climatic variables for the Cerrado may lead to changes in hydrological conditions, such as a decrease in streamflow and a shift in periods of water availability. These changes jeopardize water security and can interfere with water allocation processes, possibly compromising the development of the region.

Author Contributions

All authors have made relevant contributions to the manuscript. Material preparation and data collection were performed by all authors, and F.L.V.F. performed the analysis. The first version was written by F.L.V.F., L.N.R., D.A. and R.S.S.A. reviewed and contributed significantly to the study. All authors have read and agreed to the published version of the manuscript.

Funding

This study was supported by the Brazilian Agricultural Research Corporation (EMBRAPA Cerrados), the Federal University of Viçosa (UFV), the Coordination for the Improvement of Higher Education Personnel (CAPES—Finance Code 001), and the National Council for Scientific and Technological Development (CNPQ–Grant number 404187/2021).

Data Availability Statement

The database (Reference Evapotranspiration (ETo) and Precipitation (P) in the Cerrado used in this manuscript is freely available at the GitHub repository https://github.com/daniel-althoff/HydroCerrado/, accessed on 10 October 2021. And data regarding center pivot irrigation in the Cerrado is available through the metadata catalog of the National Water and Basic Sanitation Agency (ANA), available through the link https://metadados.snirh.gov.br/geonetwork/srv/api/records/e2d38e3f-5e62-41ad-87ab-990490841073, accessed on 10 January 2022.

Conflicts of Interest

There are no conflicts of interest.

References

  1. Assad, E.D.; Victoria, D.D.e.C.; Cuadra, S.V.; Pugliero, V.S.; Zanetti, M.R. Efeito das mudanças climáticas na agricultura do Cerrado. In Dinâmica Agrícola no Cerrado: Análises e Projeções, 1st ed.; Bolfe, E.L., Sano, E.E., Campos, S.K., Eds.; Embrapa Sede: Brasília, Brazil, 2020. [Google Scholar]
  2. Bolfe, E.L.; Sano, E.E.; Campos, S.K. Introdução. In Dinâmica Agrícola no Cerrado: Análises e Projeções, 1st ed.; Bolfe, E.L., Sano, E.E., Campos, S.K., Eds.; Embrapa Sede: Brasília, Brazil, 2020; pp. 15–20. [Google Scholar]
  3. CONAB—Companhia Nacional de Abastecimento. Safras Grãos: Série Histórica. 2018. Available online: https://www.conab.gov.br/info-agro/safras/serie-historica-das-safras (accessed on 20 May 2020).
  4. IBGE—Instituto Brasileiro de Geografia e Estatística. Produção Agrícola e Pecuária Municipal: Censo Agropecuário, Produção e Extração Vegetal da Silvicultura; IBGE: Rio de Janeiro, Brazil, 2018. Available online: https://sidra.ibge.gov.br/home/pms/brasil (accessed on 20 May 2020).
  5. Oliveira, P.T.S.; Nearing, M.A.; Moran, M.S.; Goodrich, D.C.; Wendland, E.; Gupta, H.V. Trends in water balance components across the Brazilian Cerrado. Water Resour. Res. 2014, 50, 7100–7114. [Google Scholar] [CrossRef]
  6. Francisco, E.A.B.; Kappes, C. Cerrado brasileiro carece de mais investimentos em práticas sustentáveis. Visão Agrícola 2012, 10, 55–57. [Google Scholar]
  7. Rodrigues, L.N. Quantidade de água utilizada na agricultura irrigada: Certezas e incertezas nas estimativas. ITEM Irrig. Tecnol. Mod. 2017, 114, 47–53. [Google Scholar]
  8. ANA—Agência Nacional de Águas. Atlas Irrigação: Uso da Agua na Agricultura Irrigada; ANA: Brasília, Brasil, 2017; p. 86. Available online: http://biblioteca.ana.gov.br/asp/download.asp?codigo=129435&tipo_midia=2&iIndexSrv=1&iUsuario=0&obra=72512 (accessed on 2 May 2022).
  9. Ministério da Integração e do Desenvolvimento Regional. Análise Territorial Para o Desenvolvimento da Agricultura Irrigada no Brasil; Ministério da Integração e do Desenvolvimento Regional: Brasília, Brazil, 2014; p. 217. Available online: https://www.gov.br/mdr/pt-br (accessed on 15 June 2022).
  10. Althoff, D.; Rodrigues, L.N. The expansion of center-pivot irrigation in the Cerrado biome. Irriga 2019, 1, 56–61. [Google Scholar] [CrossRef]
  11. Cambraia Neto, A.J.; Rodrigues, L.N. Impact of land use and occupation on potential groundwater recharge in a Brazilian savannah watershed. Water Int. 2021, 46, 348–364. [Google Scholar] [CrossRef]
  12. Burek, P.; Satoh, Y.; Fischer, G.; Kahil, M.T.; Scherzer, A.; Tramberend, S.; Nava, L.F.; Wada, Y.; Eisner, S.; Flörke, M.; et al. Water Futures and Solution: Fast Track Initiative (Final Report); IIASA Working Paper; WP-16–006; IIASA: Laxenburg, Austria, 2016; Available online: https://pure.iiasa.ac.at/13008 (accessed on 15 June 2022).
  13. Salis, H.H.C.; Evangelista, L.P.; Costa, A.M.; Horta, I.D.M.F. Diagnóstico da disponibilidade hídrica na bacia hidrográfica do rio Manso-MG. Caminhos Geogr. 2017, 18, 91–102. [Google Scholar] [CrossRef]
  14. Santos, E.F.N.; Barreto, I.D.C.; Barbosa, E.A.S.; Campos, L.; Silva, A.S.A. Contribuição de técnicas multivariadas a índices de seca na compreensão das otto-regiões da bacia do São Francisco. Res. Soc. Dev. 2021, 10, e7210313118. [Google Scholar] [CrossRef]
  15. Rápalo, L.M.C.; Uliana, E.M.; Moreira, M.C.; Silva, D.D.; Ribeiro, C.B.M.; Cruz, I.F.; Pereira, D.R. Effects of land-use and-cover changes on streamflow regime in the Brazilian Savannah. J. Hydrol. Reg. Stud. 2021, 38, 100934. [Google Scholar] [CrossRef]
  16. Behzadi, F.; Yousefi, H.; Javadi, S.; Moridi, A.; Shahedany, S.M.H.; Neshat, A. Meteorological drought duration–severity and climate change impact in Iran. Theor. Appl. Climatol. 2022, 149, 1297–1315. [Google Scholar] [CrossRef]
  17. Moreira, A.A.; Ruhoff, A.L.; Roberti, D.R.; Souza, V.A.; Rocha, H.R.; Paiva, R.C.D. Assessment of terrestrial water balance using remote sensing data in South America. J. Hydrol. 2019, 575, 131–147. [Google Scholar] [CrossRef]
  18. ANA—Agência Nacional de Águas. Conjuntura dos Recursos Hídricos no Brasil 2017: Relatório Pleno; ANA: Brasília, Brasil, 2017; p. 169. Available online: https://www.snirh.gov.br/portal/centrais-de-conteudos/conjuntura-dos-recursos-hidricos/relatorio-conjuntura-2017.pdf/@@download/file/relatorio-conjuntura-2017.pdf (accessed on 15 May 2022).
  19. Souza, J.L.M.; Jerszurki, D.; Schafer, R.; Gurski, B.C.; Schafer, H. Balanço hídrico climatológico: Precipitação e evapotranspiração de referência estimadas com metodologia alternativa. Rev. Bras. Climatol. 2017, 20. [Google Scholar] [CrossRef]
  20. Berghuijs, W.R.; Sivapalan, M.; Woods, R.A.; Savenije, H.H. Patterns of similarity of seasonal water balances: A window into streamflow variability over a range of time scales. Water Resour. Res. 2014, 50, 5638–5661. [Google Scholar] [CrossRef]
  21. Jesus, T.C.L.; Senna, M.C.A.; Cataldi, M.; Paiva, C.M.; Franz, B. Impacto do aumento da concentração atmosférica de CO2 no balanço hídrico climatológico do Cerrado. Rev. Bras. Climatol. 2017, 21. Available online: https://ojs.ufgd.edu.br/index.php/rbclima (accessed on 20 May 2022). [CrossRef]
  22. Byrne, M.P.; O’Gorman, P.A. The response of precipitation minus evapotranspiration to climate warming: Why the “wet-get-wetter, dry-get-drier” scaling does not hold over land. J. Clim. 2015, 28, 8078–8092. [Google Scholar] [CrossRef]
  23. Ferreira, F.L.V.; Rodrigues, L.N.; Silva, D.D. Influence of changes in land use and land cover and rainfall on the streamflow regime of a watershed located in the transitioning region of the Brazilian Biomes Atlantic Forest and Cerrado. Environ. Monit. Assess. 2021, 193, 1–17. [Google Scholar] [CrossRef]
  24. Passos, M.L.V.; Zambrzycki, G.C.; Pereira, R.S. Balanço hídrico climatológico e classificação climática para o município de Balsas-MA. Sci. Agrar. 2017, 18, 83–89. [Google Scholar] [CrossRef]
  25. Cassettari, G.A.; Queiroz, T.M. Balanço hídrico e classificação climática na bacia do rio Jauquara, região de transição entre o cerrado e Amazônia brasileira. Rev. Bras. Climatol. 2020, 26. [Google Scholar] [CrossRef]
  26. Soares, A.K.; Ohnuma, A.A., Jr.; Borges, A.C.; Pagnossi, A.A.; Angelotti Netto, A.; Corrêa Filho, C.R.R.; Mendiondo, E.M. Análise do balanço hídrico serial na bacia da represa do Broa, SP. Simpósio Bras. Recur. Hídricos 2003, 15. Available online: https://files.abrhidro.org.br/Eventos/Trabalhos/154/285.pdf (accessed on 13 January 2022).
  27. D’Angiolella, G.L.B.; Vasconcellos, V.L.D.; Rodriguez, F.A. Balanço hídrico climático do Mato Grosso e Mato Grosso do Sul. In Proceedings of the XV Congresso Brasileiro de Agrometeorologia, Aracaju, Brazil, 2–5 July 2007; Available online: http://www.sbagro.org/files/biblioteca/2641.pdf (accessed on 14 January 2022).
  28. Carvalho, H.D.P.; Dourado Neto, D.; Teodoro, R.E.F.; Melo, B.D. Balanço hídrico climatológico, armazenamento efetivo da água no solo e transpiração na cultura de café. Biosci. J. 2011, 27, 221–229. Available online: http://fi-admin.bvsalud.org/document/view/zwcsy (accessed on 15 January 2022).
  29. Santos, G.O.; Martins, G.R.; Blat, N.R.; Mendonça, L.B. Disponibilidade hídrica e as anomalias climáticas no cultivo de soja e milho no Cerrado. J. Biotechnol. Biodivers. 2022, 10, 214–222. [Google Scholar] [CrossRef]
  30. De Oliveira, J.A.M. Estimativa do balanço hídrico climatológico e classificação climática para o município de Carbonita—MG. Rev. Bras. Geogr. Física 2023, 16, 755–764. [Google Scholar] [CrossRef]
  31. Mapbiomas. Coleção 4.1. 2020. Available online: https://mapbiomas-br-site.s3.amazonaws.com/Mapa%20Mural/Mapbiomas_2018_Col4_1_Cerrado.pdf (accessed on 4 June 2020).
  32. ANA—Agência Nacional de Águas. Codificação de Bacias Hidrográficas Pelo Método Otto Pfafstetter. 2014. Available online: https://capacitacao.ead.unesp.br/dspace/bitstream/ana/104/1/apostila.pdf (accessed on 4 May 2020).
  33. Alvares, C.A.; Stape, J.L.; Sentelhas, P.C.; Gonçalves, J.L.M.; Sparovek, G. Köppen’s climate classification map for Brazil. Meteorol. Z. 2013, 22, 711–728. [Google Scholar] [CrossRef] [PubMed]
  34. Klink, C.A. Policy intervention in the cerrado savannas of Brazil: Changes in land use and effects on conservation. In Ecology and Conservation of the Maned Wolf: Multidisciplinary Perspectives; Consorte-McCrea, E., Santos, F., Eds.; CRC Press: Boca Raton, FL, USA, 2014; pp. 293–308. [Google Scholar]
  35. Rodrigues, L.N.; Sano, E.E.; Steenhuis, T.S.; Passo, D.P. Estimation of small reservoir storage capacities with remote sensing in the Brazilian Savannah Region. Water Resour. Manag. 2012, 26, 873–882. [Google Scholar] [CrossRef]
  36. Althoff, D.; Rodrigues, N.L.; Silva, D.D. Assessment of water availability vulnerability in the Cerrado. Appl. Water Sci. 2021, 11, 1–14. [Google Scholar] [CrossRef]
  37. Prăvălie, R.; Piticar, A.; Roșca, B.; Sfîcă, L.; Bandoc, G.; Tiscovschi, A.; Patriche, C. Spatio-temporal changes of the climatic water balance in Romania as a response to precipitation and reference evapotranspiration trends during 1961–2013. Catena 2019, 172, 295–312. [Google Scholar] [CrossRef]
  38. R Development Core Team, R. A Language and Environment for Statistical Computing; R Foundation for Statistical Computing: Vienna, Austria, 2021; Available online: http://www.r-project.org (accessed on 30 November 2021).
  39. Althoff, D.; Rodrigues, L.N.; Silva, D.D. Predicting runoff series in ungauged basins of the Brazilian Cerrado biome. Environ. Model. Softw. 2022, 149, 105315. [Google Scholar] [CrossRef]
  40. Huffman, G.J.; Bolvin, D.T.; Braithwaite, D.; Hsu, K.; Joyce, R.; Kidd, C.; Nelkin, E.J.; Sorooshian, S.; Tan, J.; Xie, P. Integrated Multi-Satellite Retrievals for GPM (IMERG): Algorithm Theoretical Basis Document; National Aeronautics and Space Administration: Washington, DC, USA, 2019; p. 8. Available online: https://docserver.gesdisc.eosdis.nasa.gov/public/project/GPM/IMERG_ATBD_V06.pdf (accessed on 2 July 2022).
  41. Huffman, G.J.; Stocker, E.F.; Bolvin, D.T.; Nelkin, E.J.; Tan, J. GPM IMERG Final Precipitation L3 1 Day 0.1 Degree x 0.1 Degree V06; Goddard Earth Sciences Data and Information Services Center (GES DISC): Greenbelt, MD, USA, 2019; Available online: https://doi.org/10.5067/GPM/IMERGDF/DAY/06 (accessed on 6 July 2022).
  42. Althoff, D.; Dias, S.H.B.; Filgueiras, R.; Rodrigues, L.N. ETo-Brazil: A Daily Gridded Reference Evapotranspiration Data Set for Brazil (2000–2018). Water Resour. Res. 2020, 56, e2020WR027562. [Google Scholar] [CrossRef]
  43. Kimball, B.F. On the choice of plotting positions on probability paper. J. Am. Stat. Assoc. 1960, 55, 546–560. [Google Scholar] [CrossRef]
  44. Thom, H.C.S. Some methods of climatological analysis. World Meteorol. Organ. 1966, 81, 53. [Google Scholar]
  45. Mann, H.B. Nonparametric tests against trend. Econom. J. Econom. Soc. 1945, 13, 245–259. [Google Scholar] [CrossRef]
  46. Kendall, M.G. Rank Correlation Methods; Charles Griffin: London, UK, 1975. [Google Scholar]
  47. Pettitt, A.N. A non-parametric approach to the change-point problem. J. R. Stat. Soc. Ser. C 1979, 28, 126–135. [Google Scholar] [CrossRef]
  48. Sen, P.K. Estimates of the regression coefficient based on Kendall’s tau. J. Am. Stat. Assoc. 1968, 63, 1379–1389. [Google Scholar] [CrossRef]
  49. Hirsch, R.M.; Slack, J.R.; Smith, R.A. Techniques of trend analysis for monthly water quality data. Water Resour. Res. 1982, 18, 107–121. [Google Scholar] [CrossRef]
  50. Mudbhatkal, A.; Raikar, R.V.; Venkatesh, B.; Mahesha, A. Impacts of climate change on varied river-flow regimes of southern India. J. Hydrol. Eng. 2017, 22. [Google Scholar] [CrossRef]
  51. Ferreira, F.L.V.; Rodrigues, L.N.; Silva, D.D.D.; Teixeira, D.B.D.S.; Almeida, L.T.D. Time Series Trends of Streamflow and Rainfall in the Santo Antônio River Basin, Brazil. Eng. Agrícola 2021, 41, 47–55. [Google Scholar] [CrossRef]
  52. Sano, E.E.; Rodrigues, A.A.; Martins, E.S.; Bettiol, G.M.; Bustamante, M.M.; Bezerra, A.S.; Couto, A.F., Jr.; Vascocelos, V.; Schüler, J.; Bolfe, E.L. Cerrado ecoregions: A spatial framework to assess and prioritize Brazilian savanna environmental diversity for conservation. J. Environ. Manag. 2019, 232, 818–828. [Google Scholar] [CrossRef]
  53. Campos, J.D.O.; Chaves, H.M.L. Trends and variabilities in the historical series of monthly and annual precipitation in cerrado biome in the period 1977–2010. Rev. Bras. Meteorol. 2020, 35, 157–169. [Google Scholar] [CrossRef]
  54. Di Nunno, F.; Granata, F. Future trends of reference evapotranspiration in Sicily based on CORDEX data and Machine Learning algorithms. Agric. Water Manag. 2023, 280, 108232. [Google Scholar] [CrossRef]
  55. Salviano, M.F.; Groppo, J.D.; Pellegrino, G.Q. Análise de tendências em dados de precipitação e temperatura no Brasil. Rev. Bras. Meteorol. 2016, 31, 64–73. [Google Scholar] [CrossRef]
  56. Beebe, D.A.; Castle, J.W.; Molz, F.J.; Rodgers, J.H., Jr. Effects of evapotranspiration on treatment performance in constructed wetlands: Experimental studies and modeling. Ecol. Eng. 2014, 71, 394–400. [Google Scholar] [CrossRef]
  57. Sousa, F.A.; Moura, D.M.B. Evapotranspiração potencial (ETp) e sua influência na vazão de rios do Cerrado Brasileiro. Elisée Rev. Geo. 2022, 11, e111222. [Google Scholar] [CrossRef]
  58. Siqueira, P.P.; Oliveira, P.T.S.; Bressiani, D.; Neto, A.A.M.; Rodrigues, D.B. Effects of climate and land cover changes on water availability in a Brazilian Cerrado basin. J. Hydrol. Reg. Stud. 2021, 37, 100931. [Google Scholar] [CrossRef]
  59. Egger, D.S.; Rigotto, R.M.; Souza, F.A.N.; Costa, A.M.; Aguiar, A.C.P. Ecocídio nos Cerrados: Agronegócio, espoliação das águas e contaminação por agrotóxicos. Desenvolv. Meio Ambiente 2021, 57, 16–54. [Google Scholar] [CrossRef]
  60. Hofmann, G.S.; Cardoso, M.F.; Alves, R.J.; Weber, E.J.; Barbosa, A.A.; Toledo, P.M.; Pontual, F.B.; Salles, L.D.O.; Hasenack, H.; Cordeiro, J.L.P.; et al. The Brazilian Cerrado is becoming hotter and drier. Glob. Change Biol. 2021, 27, 4060–4073. [Google Scholar] [CrossRef]
  61. Althoff, D.; Bazame, H.C.; Filgueiras, R.; Rodrigues, L.N. Assessing rainfall spatial variability in the Brazilian savanna region with TMPA rainfall dataset. J. South Am. Earth Sci. 2021, 111, 103482. [Google Scholar] [CrossRef]
  62. Pousa, R.; Costa, M.H.; Pimenta, F.M.; Fontes, V.C.; Brito, V.F.A.D.; Castro, M. Climate change and intense irrigation growth in Western Bahia, Brazil: The urgent need for hydroclimatic monitoring. Water 2019, 11, 933. [Google Scholar] [CrossRef]
  63. Hoffmann, W.A.; Jackson, R.B. Vegetation–climate feedbacks in the conversion of tropical savanna to grassland. J. Clim. 2000, 13, 1593–1602. [Google Scholar] [CrossRef]
  64. Costa, M.H.; Pires, G.F. Effects of Amazon and Central Brazil deforestation scenarios on the duration of the dry season in the arc of deforestation. Int. J. Climatol. 2010, 30, 1970–1979. [Google Scholar] [CrossRef]
  65. Lee, J.E.; Lintner, B.R.; Boyce, C.K.; Lawrence, P.J. Land use change exacerbates tropical South American drought by sea surface temperature variability. Geophys. Res. Lett. 2011, 38. [Google Scholar] [CrossRef]
  66. Salazar, A.; Baldi, G.; Hirota, M.; Syktus, J.; McAlpine, C. Land use and land cover change impacts on the regional climate of non-Amazonian South America: A review. Glob. Planet. Change 2015, 128, 103–119. [Google Scholar] [CrossRef]
  67. Arantes, A.E.; Ferreira, L.G.; Coe, M.T. The seasonal carbon and water balances of the Cerrado environment of Brazil: Past, present, and future influences of land cover and land use. ISPRS. J. Photogramm. Remote Sens. 2016, 117, 66–78. [Google Scholar] [CrossRef]
  68. Spera, S.A.; Galford, G.L.; Coe, M.T.; Macedo, M.N.; Mustard, J.F. Land-use change affects water recycling in Brazil’s last agricultural frontier. Glob. Change Biol. 2016, 22, 3405–3413. [Google Scholar] [CrossRef] [PubMed]
  69. Debortoli, N.S.; Dubreuil, V.; Hirota, M.; Filho, S.R.; Lindoso, D.P.; Nabucet, J. Detecting deforestation impacts in Southern Amazonia rainfall using rain gauges. Int. J. Climatol. 2016, 37, 2889–2900. [Google Scholar] [CrossRef]
  70. Milhorance, C.; Sabourin, E.; Chechi, A.L. Adaptação às Mudanças Climáticas e Integração de Políticas Públicas no Semiárido Pernambucano; Working Paper; Brasília, Brazil. 2018, Volume 1, p. 44. Available online: http://inct-odisseia.i3gs.org/wp-content/uploads/2019/12/WP2.pdf (accessed on 19 February 2022).
  71. Alizadeh, H.; Mousavi, S.J. Coupled stochastic soil moisture simulation-optimization model of deficit irrigation. Water Resour. Res. 2013, 49, 4100–4113. [Google Scholar] [CrossRef]
  72. Evans, R.G.; Sadler, E.J. Methods and technologies to improve efficiency of water use. Water Resour. Res. 2008, 44. [Google Scholar] [CrossRef]
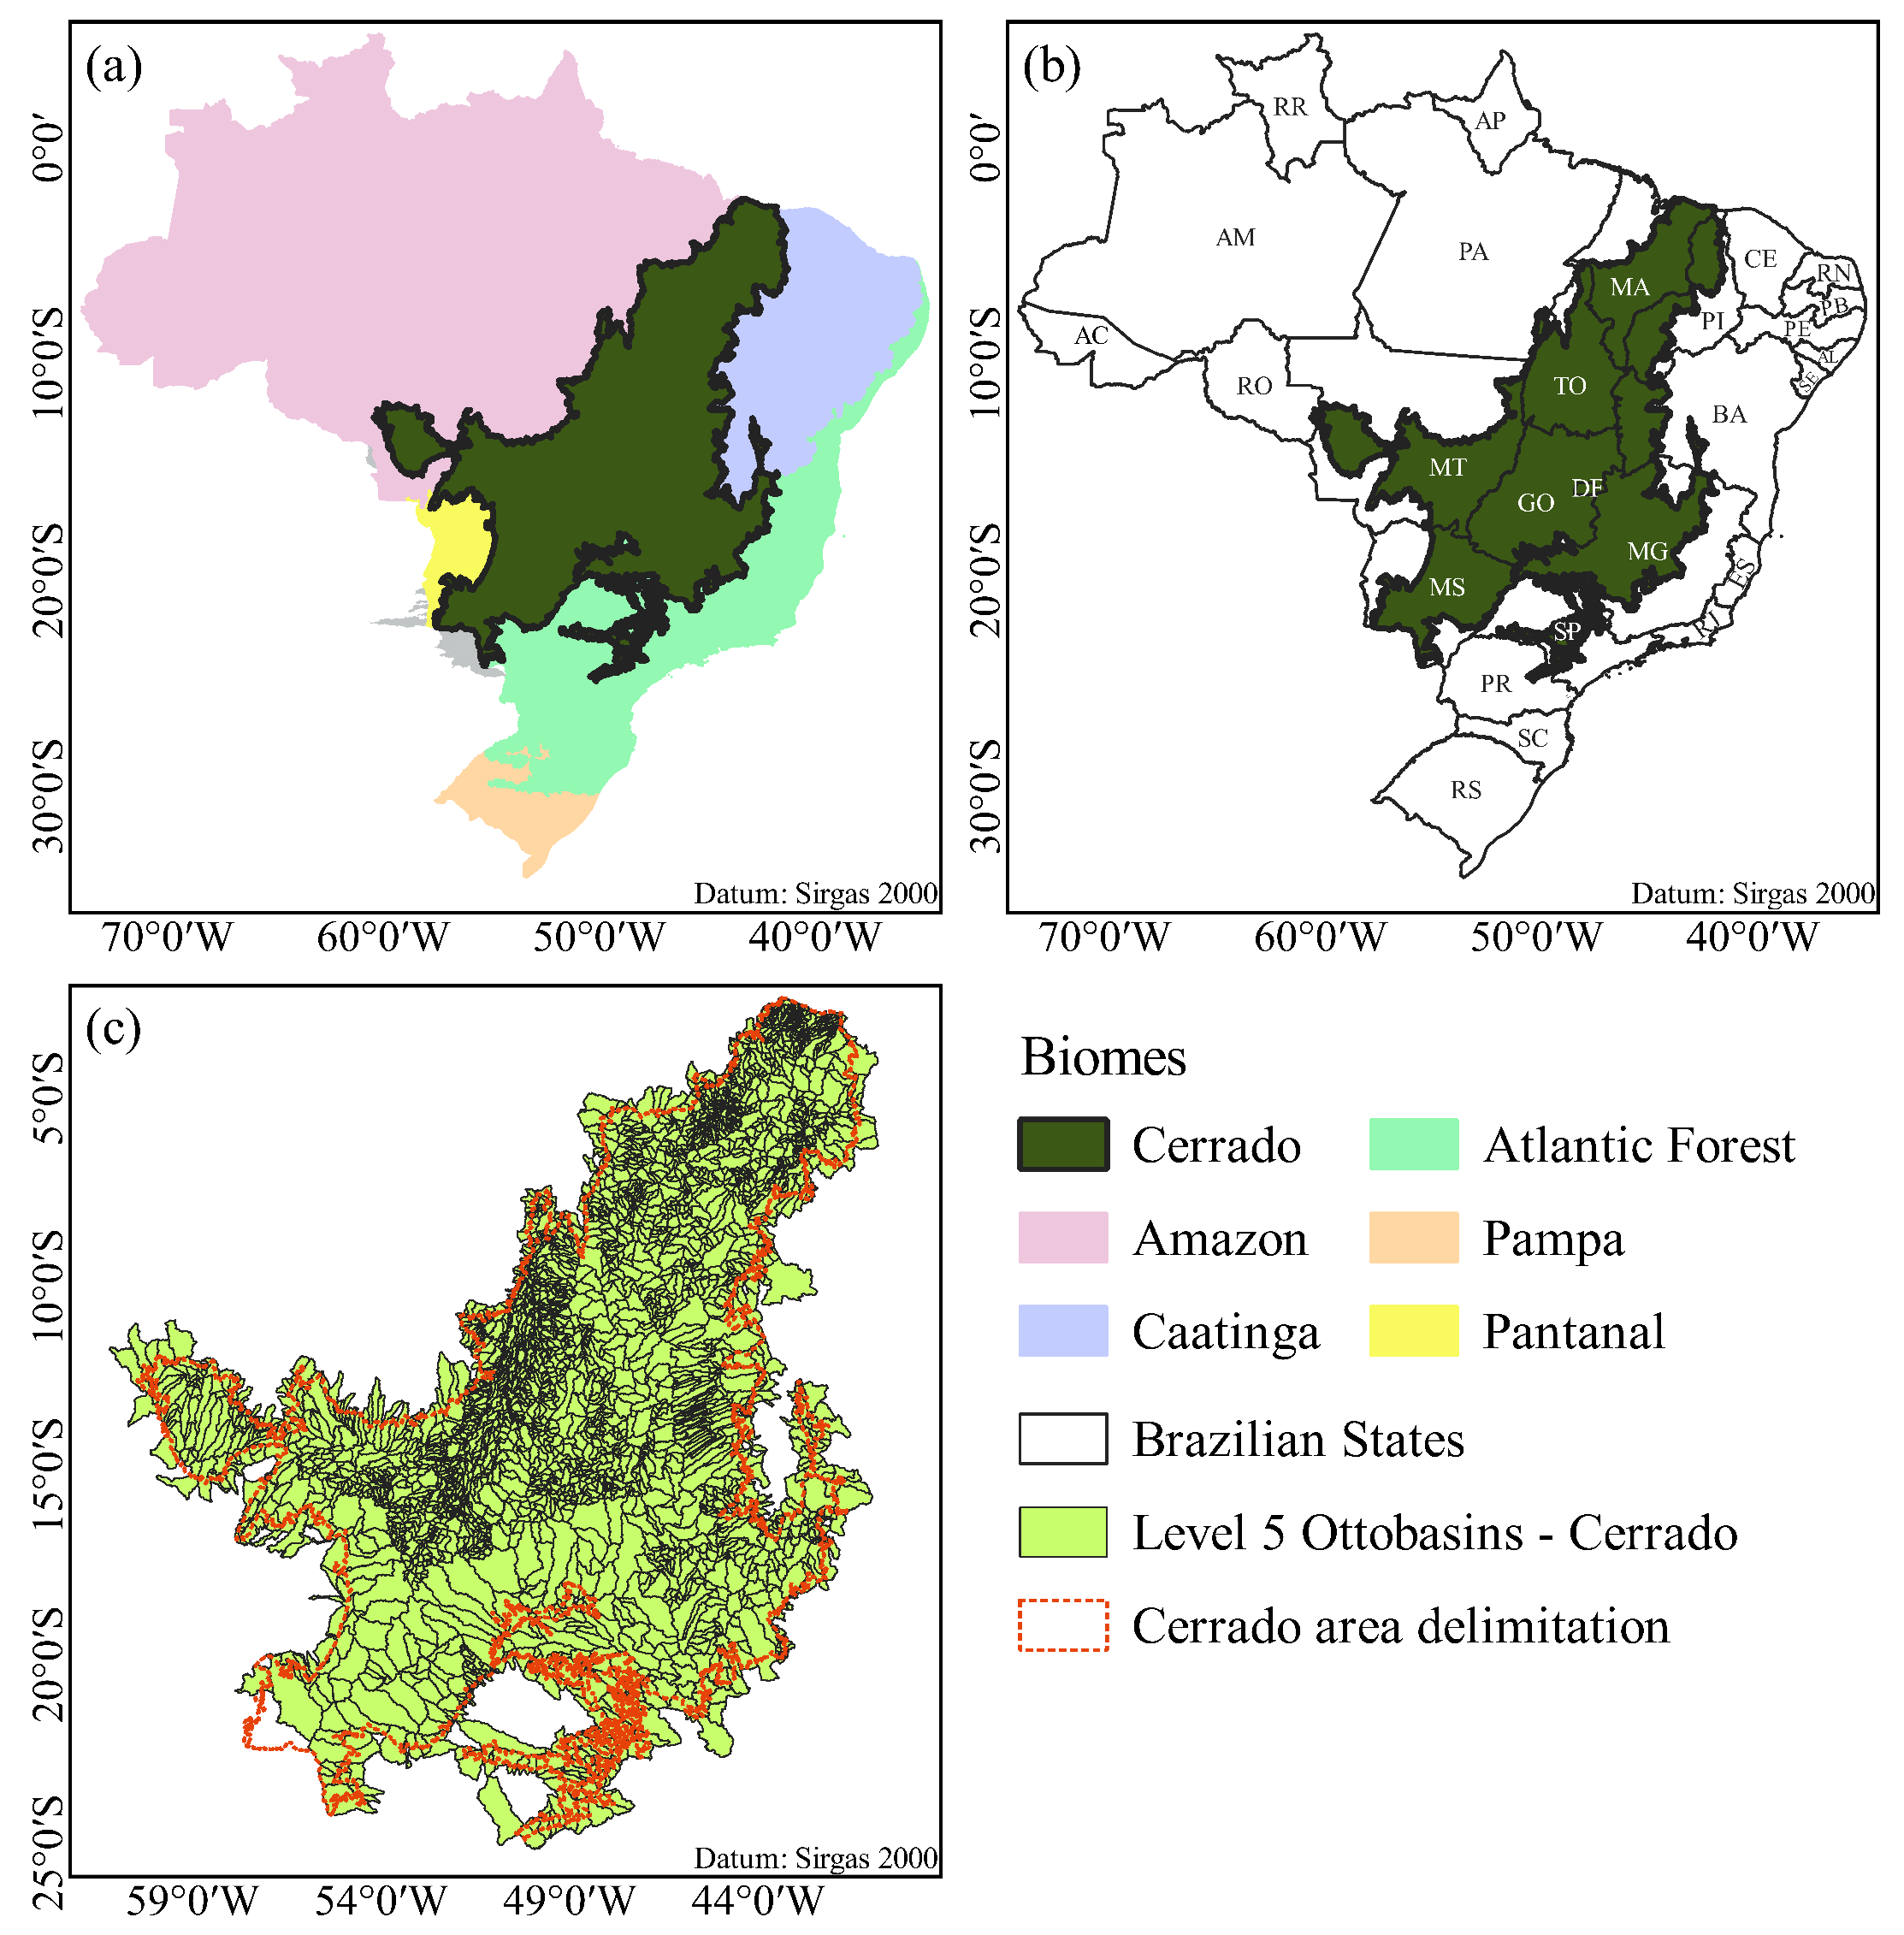
Figure 1. (a) Spatial distribution of biomes (Amazon, Caatinga, Cerrado, Atlantic Forest, Pampa, and Pantanal) in the Brazilian territory; (b) Brazilian States; (c) Subdivision of the Cerrado Biome region into level 5 ottobasins.
Water 15 01820 g001
Figure 2. Averages of total annual reference evapotranspiration-ETo (a) and precipitation-P (b) for the Cerrado ottobasins.
Water 15 01820 g002
Figure 3. Monthly climatic water balance (CWB) of Cerrado ottobasins estimated based on frequency equal to or greater than 80% of permanence in time, from January 2003 to December 2019.
Water 15 01820 g003
Figure 4. Location of the six ottobasins in the Cerrado: (a) series of total monthly reference evapotranspiration (ETo) and precipitation (P) for the ottobasins 44828 (b); 64136 (c); 64845 (d); 74695 (e); 76987 (f); 89566 (g).
Water 15 01820 g004
Figure 5. Trends of climatic water balance (CWB) and the variables’ precipitation (P) and reference evapotranspiration (ETo) in January and July for the Cerrado ottobasins.
Water 15 01820 g005
Figure 6. Sen slope test for the climatic water balance (CWB) (a) precipitation (b) and reference evapotranspiration (ETo) (c) in January and July in the ottobasin 44828 between 2003 and 2019.
Water 15 01820 g006
Figure 7. Irrigation by center pivot in the Cerrado in 2005 and 2019.
Water 15 01820 g007
Table 1. Number of ottobasins and percentage with significant trend in monthly data on climatic water balance (CWB), precipitation (P), and reference evapotranspiration (ETo).
JANFEBMARAPRMAYJUNJULAUGSEPOCTNOVDEC
CWB66553771811379074535316897106164
%14.71.21.70.42.517.416.47.83.72.12.33.6
Precipitation5736975151693494452781122127162
%12.61.51.70.33.77.79.86.10.20.52.83.6
ETo115530304333891128100972575073195125
%25.50.76.70.78.624.922.316.016.616.12.12.8
Table 2. Magnitude of the average monthly variation of climatic water balance (CWB), precipitation (P), and reference evapotranspiration (ETo) by the Sen Slope test in ottobasins with significant trend.
JANFEBMARAPRMAYJUNJULAUGSEPOCTNOVDEC
(mm)
CWB−13.3−8.2−1.4−0.9−3.6−3.0−0.4−1.2−0.2−1.44.5−10.2
Precipitation−11.7−8.2−1.91.6−2.8−5.20.1−0.70.5−3.75.7−9.0
ETo2.1−1.20.6−1.00.60.60.40.20.60.7−0.91.0
Disclaimer/Publisher’s Note: The statements, opinions and data contained in all publications are solely those of the individual author(s) and contributor(s) and not of MDPI and/or the editor(s). MDPI and/or the editor(s) disclaim responsibility for any injury to people or property resulting from any ideas, methods, instructions or products referred to in the content.