Article

Member Formation Methods Evaluation for a Storm Surge Ensemble Forecast System in Taiwan

1
Graduate Institute of Hydrological and Oceanic Sciences, National Central University, Chungli 320317, Taiwan
2
Marine Meteorology Center, Central Weather Bureau, Taipei 100006, Taiwan
*
Author to whom correspondence should be addressed.
Water 2023, 15(10), 1826; https://doi.org/10.3390/w15101826
Submission received: 17 March 2023 / Revised: 21 April 2023 / Accepted: 9 May 2023 / Published: 10 May 2023

Abstract

:
The forecast of typhoon tracks remains uncertain and is positively related to the accuracy of the storm surge forecast. The storm surge prediction error increases dramatically when the forecast track error is larger than 100 km. This study aims to develop an ensemble storm surge prediction system using parametric weather models to account for the uncertainty in typhoon track prediction. The storm surge model adopted in this study is COMCOT-SS storm surge forecast system. Two methods are introduced and analyzed to generate the ensemble members in this study. One is from the weather ensemble prediction system (WEPS), and the other is from the error distribution of the deterministic forecasts (EDF). The ensemble prediction results show that the ensemble mean of WEPS performs similarly to the deterministic forecast. However, the maximum surge height of WEPS is often lower than one from EDF. The verification results suggest that, for disaster prevention, EDF provides stronger warnings to the coastal region than WEPS. However, it may provide overestimated forecasts in some cases.

1. Introduction

A storm surge is the abnormal rise of water caused by a storm above the predicted astronomical tide and is often the most damaging component of a tropical cyclone. Accurate prediction of storm surge height and coastal inundation can help prevent the effects of significant flooding, damage to infrastructure, and loss of life, especially in low-lying areas. The accuracy of storm surge prediction is highly dependent on the accuracy of tropical cyclone prediction [1]. It is critical in coastal regions such as Taiwan, where densely populated areas and critical infrastructure are at risk [2,3].
The official atmospheric model in CWB is still striving to improve the accuracy of the deterministic forecast [4]. However, tropical cyclones are mesoscale weather phenomena with a high degree of forecast uncertainty. Therefore, a small error can lead to significant differences in the resulting storm surge. The operational storm surge forecast system produces a deterministic result that may differ from the observed data if the weather forecast error is significant. As for the storm surge forecast in Taiwan, the existing deterministic storm surge models have limitations in their ability to capture the uncertainties in the estimates, especially when tropical cyclones cross the 4 km high Central Mountain Range in Taiwan. Their track and intensity are difficult to predict accurately, which can lead to potentially dangerous situations. This difference means that more than the deterministic forecast predicted by adopting a specific meteorological model may be required to meet the requirements of disaster prevention. Ensemble forecasting systems, however, provide a range of possible outcomes and their associated probabilities, allowing decision-makers to make informed decisions and take necessary precautions.
In storm surge ensemble forecasting, generating the ensemble members is essential. The members can either be artificially generated from deterministic forecasts or follow the products of the weather models resulting from their calculated dynamical processes and environmental conditions.
Regarding the atmospheric modeling ensemble members, European countries typically use the ECMWF EPS [5] as input [6,7] to account for atmospheric uncertainties due to its accessibility and reliability. However, some would instead use their operational regional atmospheric models as input for finer grid resolution, parameterized physics, and data assimilation to fit regional characteristics [8,9]. Using the atmospheric models as input to simulate storm surges has double-edged implications. It can account for atmospheric uncertainties but limits flexibility in the choice of constituents. In addition, some have suggested that the coarse grid resolution may lead to an underestimation of winds near the inner core of the tropical cyclone [10,11].
For the method of artificially generating members, the P-Surge model operated by NWS, USA, which takes five-year error statistics, including track, size, and intensity, according to the normal distribution [12], and determines the weight of each member by simply taking the product of the weight of each error sample. This method is straightforward and provides more flexibility in choosing the combination of ensemble members than atmospheric models for storm surge modelers. In addition, by taking advantage of the idealized wind models, they can effectively and efficiently provide storm structure with limited information provided by the agencies. Although they may underestimate the wind field far from the cyclone track, they usually perform well within a certain distance from the center [13].
To take advantage of the atmospheric model and the ideal wind ensemble, the Japan Meteorological Agency (JMA) selects representative ensemble members from the global EPS by cluster analysis and inserts an idealized typhoon into the selected atmospheric members [14]. The computational cost spent on hybrid winds improves the overall atmospheric conditions, which significantly improves the storm surge simulation. However, it results in a limited number of ensemble composites compared to other operational ensemble forecasting systems. This study focuses on developing a storm surge ensemble prediction system for Taiwan, prone to typhoons and associated storm surges. Despite the availability of similar systems in other regions, there is a knowledge gap regarding applying ensemble prediction systems for storm surges in Taiwan. Since both the error distribution of historical parametric forecasts and the atmospheric ensemble forecast model can be obtained from CWB to generate the ensemble typhoon tracks, it raises a topic worthy of in-depth study on which method is more compatible for this region. Section 2 introduces the operational model and available materials for building an ensemble forecast. Section 3 presents the 2018 Typhoon Maria event for deterministic model validation, comparison of ensemble member generation methods, and further analysis, including the statistical evaluation and computational efficiency. Finally, the conclusions are presented in Section 4.

2. Materials and Methods

2.1. COMCOT-SS (Cornell Multi-Grid Coupled Tsunami Model—Storm Surge)

The storm surge can be described by the shallow water equations [15] and the COMCOT-SS storm surge model [16,17], which solves the nonlinear shallow water equations with the Coriolis effect and includes bottom friction. The governing equations are
η t + 1 Rcos φ { P ψ + φ ( cos φ · Q ) } = 0
P t + 1 Rcos φ ψ ( P 2 H ) + 1 R φ ( PQ H ) + gH Rcos φ η ψ fQ + F ψ b = H ρ w Rcos φ P a ψ + F ψ s ρ w
Q t + 1 Rcos φ ψ ( PQ H ) + 1 R φ ( Q 2 H ) + gH R η φ + fP + F φ b = H ρ w R P a ψ + F ψ s ρ w
where η is the free surface elevation, H is the total water column (H = η + h), h is the bathymetric depth, P and Q denote the momentum flux at ψ longitude and φ latitude, respectively. g is the acceleration due to gravity, ρ w is the water density, F b is the bottom friction, F s is the wind shear stress, and f is the Coriolis parameter ( f = 2 ω sin φ ).
The bottom friction shear stress in the model is assumed by following Manning’s formula, which can be expressed as:
F x = gn 2 H 7 3 P ( P 2 + Q 2 )
F y = gn 2 H 7 3 Q ( P 2 + Q 2 )
where n = 0.03 represents Manning’s Roughness Coefficient [18].
A quadric law calculates the storm surge component generated by the wind shear stress:
F s = ρ a C d | V w | V w
where V w is the 10-m wind vector, ρ a is the density of air, and C d is the wind drag coefficient:
10 3 C d = { 2.16 ,                                                      | V w | 26.0   ms 1 0.49 + 0.065 | V w | ,        10.0   ms 1 | V w | < 26.0   ms 1 1.14 ,                                  3.0   ms 1 | V w | 10.0   ms 1 0.62 + 1.56 | V w | ,                      1.0   ms 1 | V w | < 3.0   ms 1 2.18 ,                                                       | V w | < 1.0   ms 1

2.2. Parametric Wind and Pressure Fields

The parametric model supplies wind stress and atmospheric surface pressure [19,20]. Therefore, the idealized pressure distribution from the parametric wind model and the radial wind profile with the Coriolis effect can be expressed as:
P a ( r ) = P c + ( P n P c ) exp [ ( R max r ) B ]
V w ( r ) = B ( P n   P c ) ρ a ( R max r ) B exp [ ( R max r ) B ] + r 2 f 2 4 rf 2
where P a is air pressure, P n is the ambient pressure, P c is the pressure in the typhoon’s center, R max is the radius of maximum wind, r is the distance from the typhoon center, V w is the wind velocity, ρ a is the density of air. f is the Coriolis parameter. B is the peak value parameter for scaling the pressure and wind profiles and is defined as [20]:
B = 2 P c 900 160
The radius of maximum wind is calculated from the pressure at the center of a typhoon and tuned by CWB, which is empirically obtained from tropical cyclones from 1995 to 2015:
R max = { 42.6 0.86 · ( P c 990 ) ,         P c 990 51.0 0.84 · ( P c 980 ) ,   980 P c < 990 58.4 0.74 · ( P c 970 ) ,   970 P c < 980 63.0 0.46 · ( P c 960 ) ,   960 P c < 970 70.0 0.234 · ( P c 930 ) ,   930 P c < 960 80.0 0.167 · ( P c 870 ) ,   870 P c < 930 80.0 ,             P c < 870

2.3. Computational Domain and Gauges

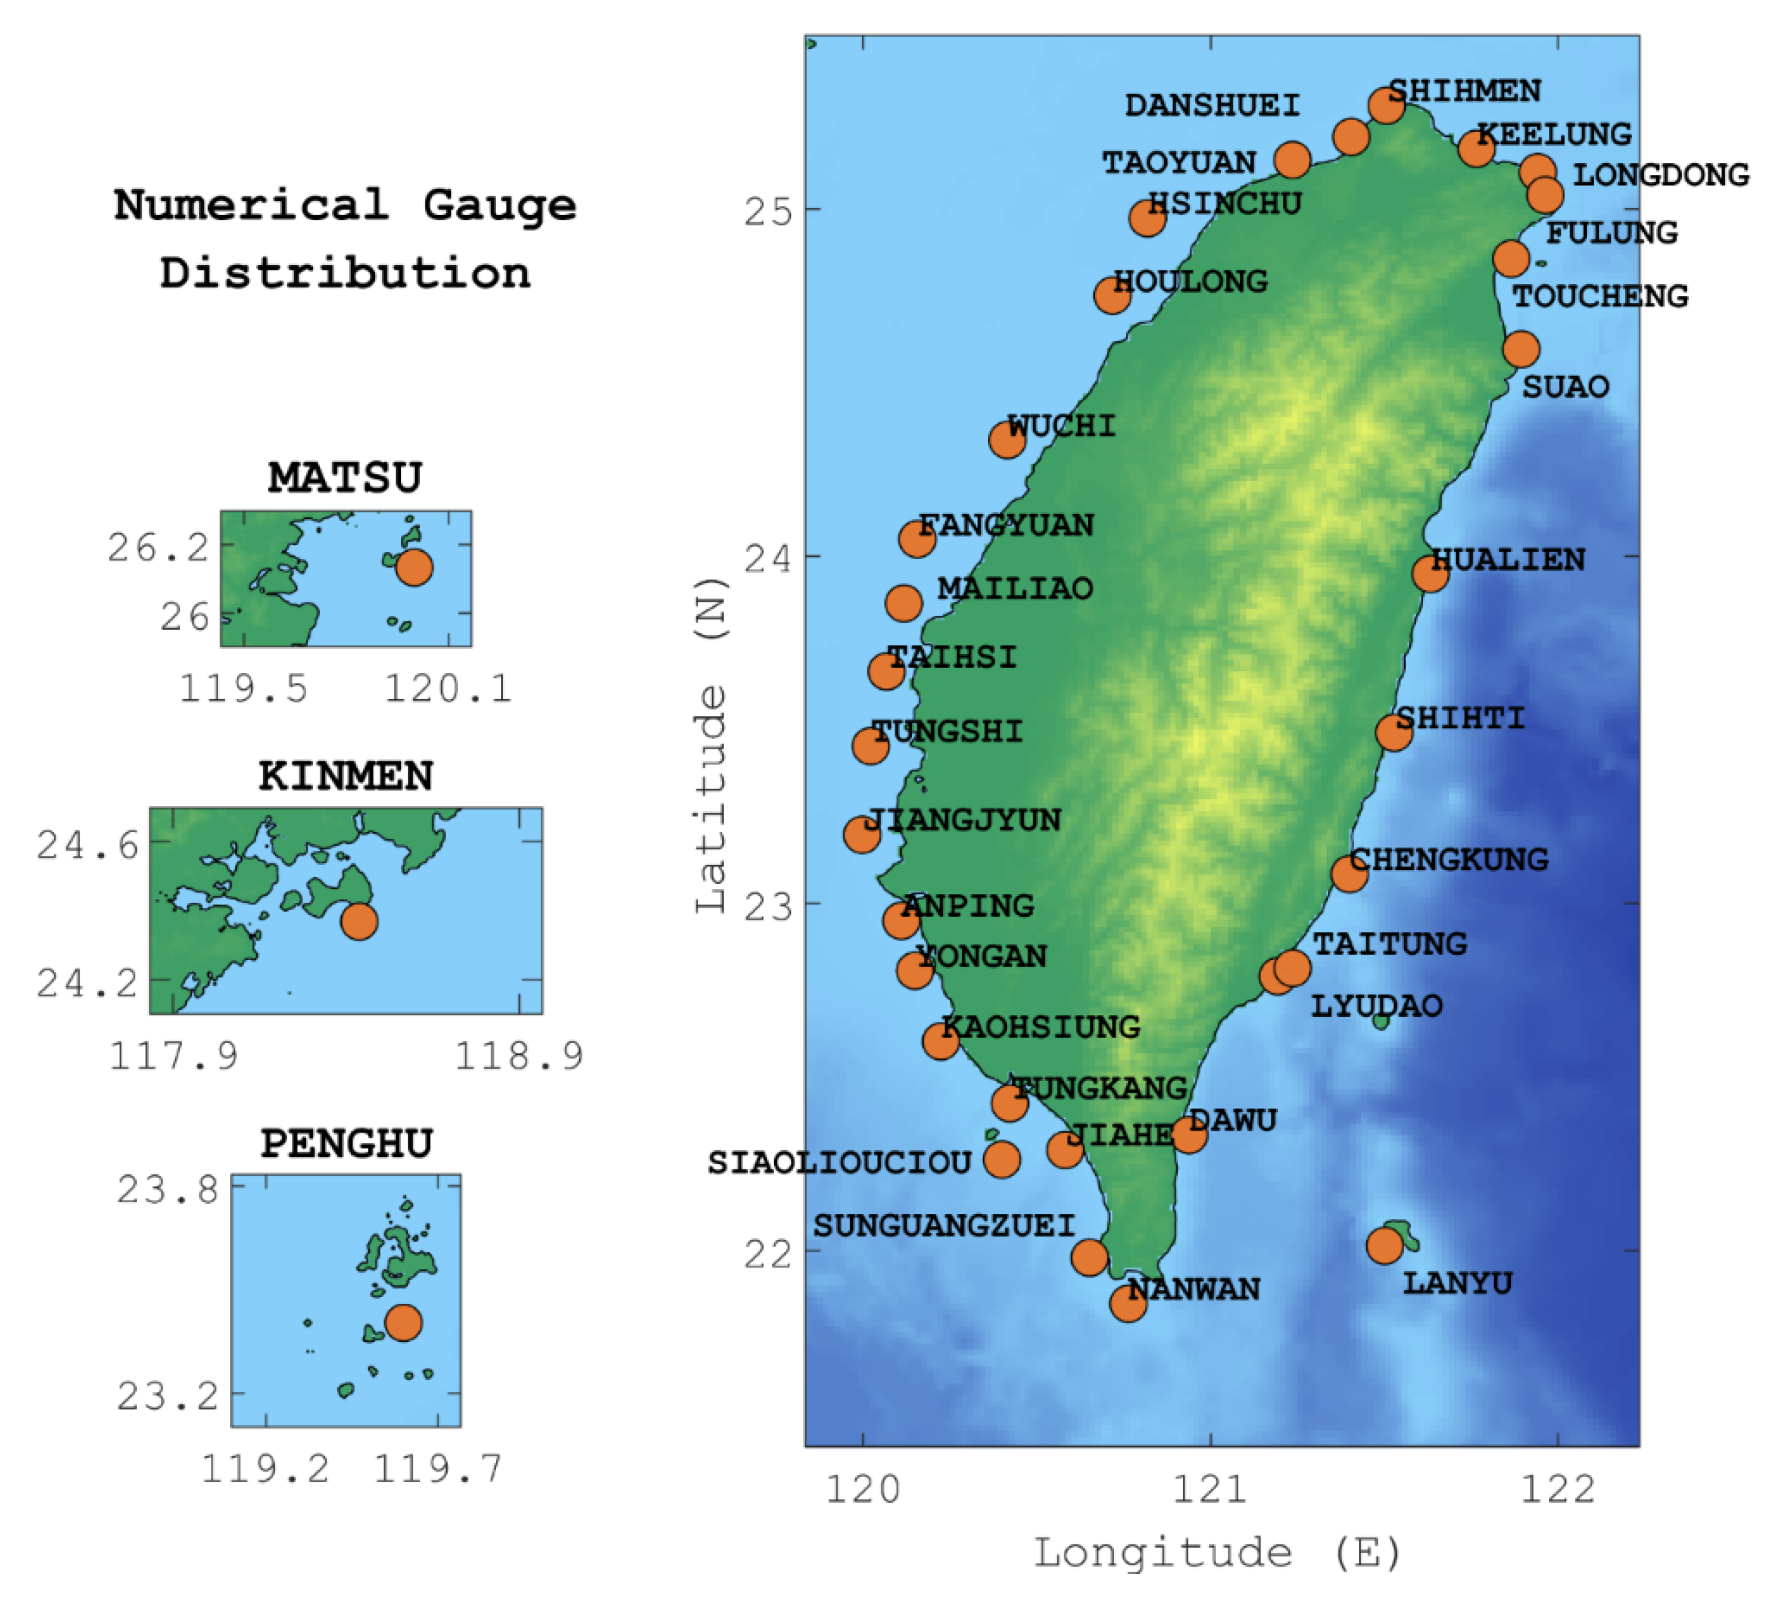
The two-layer nested staggered Arakawa C grid [21] is used for the operational deterministic storm surge prediction system in CWB. The first layer, the mother layer, ranges from 10 N~35 N to 110 E~134 E. The second layer and the sublayers cover Taiwan, Penghu, Kinmen, and Matsu, as shown in Figure 1 and Table 1. The grid resolution of the parent layer is four arc minutes with the bathymetry data from ETOPO1. The bathymetry data for the sublayers are obtained from GEBCO, and the grid resolutions of the sublayers are one arc minute for sublayer A and 0.5 arc minute for the rest. During the forecast, 34 numerical tide gauges are used to provide the time series of predicted pressure, wind, and water level, as shown in Figure 2.

2.4. The Boundary Condition for Tides

The TPXO Global Tidal Model [22] is used to compute the tidal components at the domain boundary of the sublayers. This model fits altimetry data and Laplace’s tidal equations with the least squares method to compute amplitudes of MSL-relative sea surface heights and transports/currents for eight primaries (M2, S2, N2, K2, K1, O1, P1, Q1), two long-period (Mf, Mm), and three nonlinear (M4, MS4, MN4) harmonic constituents. The current version used in this study is TPXO9-atlas. It provides 1/30-degree resolution in the computational domain.

2.5. Ensemble Generation of Typhoon Tracks

Both the error distribution of historical parametric forecasts and the atmospheric ensemble forecasting model can be obtained from CWB to generate the ensemble typhoon tracks. One is the official deterministic forecast known as land/sea warnings. The other is the Taiwan mesoscale ensemble prediction system [23,24] developed by CWB, which will be called WEPS for WRF Ensemble Prediction System.
For the deterministic forecast, CWB issues the forecast and warning when the typhoon moves into the area of 10 N~30 N and 105 E~180 E. The land/sea warnings are terminated when the radius of near gale winds (Beaufort scale 7) leaves the land or the nearby waters of Taiwan or when the typhoon dissipates or is downgraded to a tropical depression [25].
WEPS is developed using the Advanced Research WRF dynamic solver [26]. The domain of the model covers the East-Asian region from 5 S~43 N and 78 E~180 E with a grid spacing of 15 km [24]. The initial conditions of WEPS are obtained by downscaling the results of the NCEP Global Forecast System (GFS) and adding perturbations from the Ensemble Adjustment Kalman Filter (EAKF [27]). The perturbations are computed as the difference between members of the EAKF and the ensemble mean after a 6-h forecast period. WEPS uses 20 combinations of physics packages to parameterize the microphysics, cumulus parameterization, planetary boundary layer, and surface layer. This configuration was chosen by combining a total of 6 different cumulus parameterization schemes (Betts–Miller–Janjic, Grell-3 Scheme, Kain–Fritsch, Modified Tiedtke Scheme, New GFS Simplified Arakawa–Schubert Scheme, and Simplified Arakawa–Schubert Scheme), 4 planetary boundary layer schemes (Yonsei University scheme, Mellor–Yamada–Janjic Scheme, ACM2 Scheme and Mellor–Yamada–Nakanishi–Niino 2.5 level TKE Scheme), two microphysics schemes (WSM5 and NASA Goddard 5-class Scheme) and four surface layer schemes (Mesoscale Model System version V, Monin–Obukhov similarity theory, Pleim–Xiu Scheme and Mellor–Yamada Nakanishi Niino Scheme) [24]. For all members, the Rapid Radiative Transfer Model (RRTMG) is used for both long and short-wave radiation schemes, and the Noah land surface model is coupled with WRF.
Depending on the capabilities of the computing hardware resources and the abundance of data from CWB, there are three methods for generating ensemble members. The first is to directly use 20 sets of the two-dimensional 10-m wind and pressure fields produced by WEPS as the metrological input to COMCOT-SS. Since WEPS uses the Lambert conformal map projection, a transformation is required to reproject the results into the spherical coordinate system. Finally, cubic spline interpolation is used to interpolate the wind and pressure data from WEPS to the grid points of COMCOT-SS [28].
The second method is to substitute the typhoon tracks and their modeled intensities for parametric wind models to generate idealized meteorological fields. This method has the advantage of accounting for the uncertainty in the typhoon tracks and intensities and reduces computational resources.
The third method is the error distribution of deterministic forecasts (EDF), inspired by P-Surge. P-Surge takes the NHC hurricane forecast and uses the error statistics from the forecast database to generate the statistically likely hurricanes. For example, the averaged 24/48/72 h T.C. track forecast errors of the CWB official forecast track from 2011 to 2015 are 100/171/259, 69/175/253, 83/148/205, 94/155/228, 80/132/187 km [29], while those of the TWRF (Typhoon WRF) model and the operational tropical cyclone forecast model are 74/127/215, 64/122/202, 70/120/194, 70/122/180, 68/114/149 km in 2016, 2017, 2018, 2019, 2020, respectively [30]. However, none of the above track errors regarding cross-track error (CTE) and along-track error (ATE) are presented.
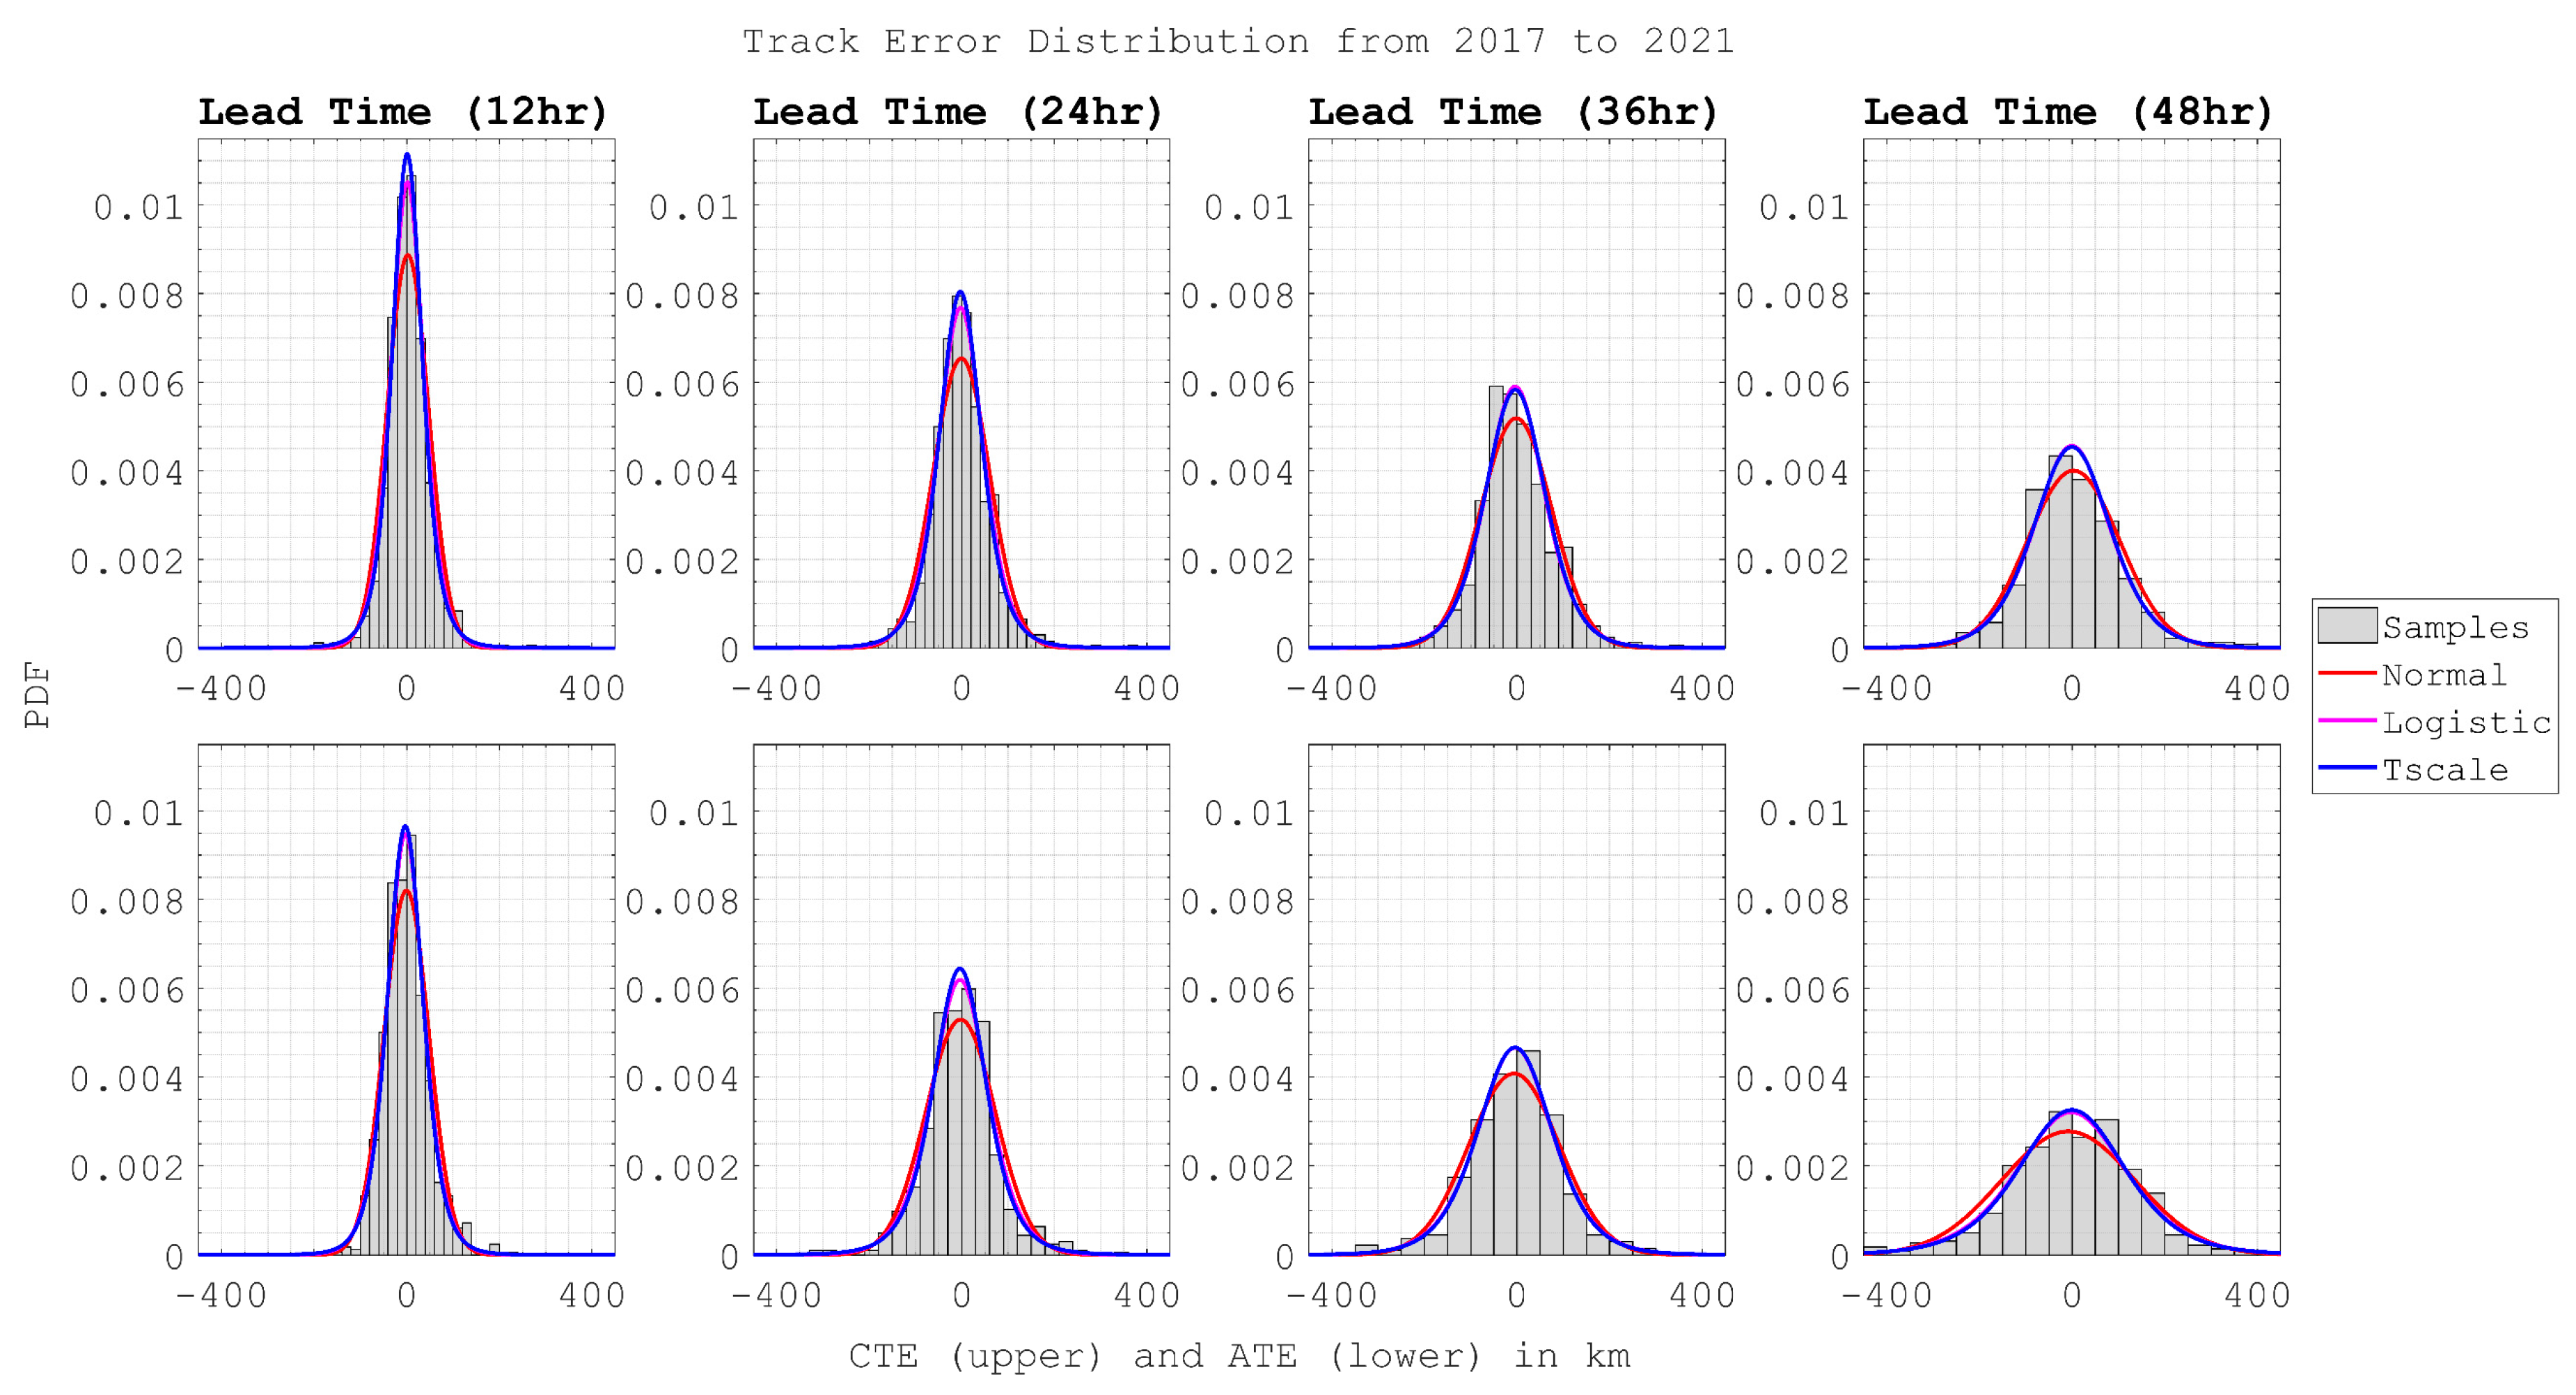
Figure 3 shows the CTEs and ATEs between the CWB forecast and the best tracks from 2016 to 2021. The CWB issued 737 warnings during these years, and the available data points at the 12th, 24th, 36th, and 48th forecast hours are 737/643/545/469 in this time window. The gray histograms in Figure 3 show the distribution of the samples obtained. The horizontal axis is the error value with the unit in kilometers. The vertical axis is the distribution according to the probability density function. The top row shows the CTE. The bottom row is the ATE from left to right according to the forecast time. The direction to the right and forward is defined as positive. Three probability density functions (PDFs) of bell-shaped normal distribution, logistic distribution, and t-location scale distribution are selected to fit the samples and shown as red, magenta, and blue curves, respectively. The normal distribution is widely used [31], while the logistic distribution has a longer tail and higher kurtosis than the normal distribution [32], and the t-location scale distribution is usually more appropriate for a small and non-uniform data set [33]. The equations for the PDFs are as follows. The parameters used to generate the PDFs are listed in Table 2:
f ( x ) = 1 σ 2 π e ( x μ ) 2 2 σ 2
f ( x ;   μ , σ ) = e ( x μ σ ) σ ( 1 + e ( x μ σ ) ) 2 ,   { < x < < μ < σ 0
f ( x ;   μ ,   σ ,   ν ) Γ ( ν + 1 2 ) σ ν π Γ ( ν 2 ) [ ν + ( x μ σ ) 2 ν ] ( ν + 1 2 ) ,   { Γ ( x ) = 0 t x 1 e t dt < μ < σ > 0 ν > 0
where Γ (   ) is the gamma function, μ is the location parameter, σ is the scale parameter, and ν is the shape parameter.
In Figure 3, the histograms of the data set are nearly symmetrical for all distributions. For the curves, the kurtosis of the normal distribution is usually lower and flatter than that of the logistic distribution and the T Location-Scale distribution. The shape of the logistic and T Location-Scale distributions is similar. The kurtosis of the T Location-Scale distribution is usually higher in most situations, except for the 48-h CTE data set. The probability distributions with higher kurtosis should improve their ability to describe the probability distribution of the data set. This phenomenon implies that the T Location-Scale distribution is better than the others.
Each PDF has a location parameter, which can be thought of as the location of the peak of the curve after fitting the data set. For the CTE, the location parameter gradually increases to a more significant negative value. On the other hand, the location parameter of the ATEs tends to increase positively. This indicates that the predicted typhoon position tends to be on the left and front sides of the best track. The result also shows that t μ and σ increase with increasing forecast time.
The following studies on the error distribution of deterministic forecasts will all adopt the t-location scale distribution to standardize the method of generating the ensemble tracks. By evenly dividing the area under the probability density distribution function curve, the corresponding points on the horizontal axis can be obtained as the reference members of the error distribution, and the schematic diagram is shown in Figure 4. The area is divided into even numbers, the peak of the PDF will be kept as one of the members. If the area under the PDF is divided into N equal parts, N + 1 members can be obtained from the curve. The corresponding errors can then be obtained as ensemble members. The repeated member simulation of the EDF method is skipped in the ensemble prediction. However, when calculating the weight of each member, it is given a higher weight value than the non-repeated members according to the count. The weight of the member is as follows:
W = N 2 n = 1 N / 2 ( 1 2 n + 1 ) ,   if   duplicated
W = N 2 ( 1 2 N + 1 ) ,   if   not   duplicated
where W indicates the members’ weight, N indicates the cut number of equal areas. For the WEPS, members are carrying weights equally. Using Figure 4d as a demonstration to calculate the weight of each member, the results show 71/315 for blue members, 1/15 for purple members, and 1/21 for yellow members.
The area under the PDF curve can be sliced to obtain the error elements as many times as needed. Table 3 lists the error elements obtained from the curve when the area under the curve is sliced into 2, 4, and 6 parts, respectively. The table’s positive and negative signs indicate the errors’ direction relative to the observed position. For example, for CTE, the right side of the observation position is positive, and the left side is negative. For ATE, the front of the observation position is positive, and the back is negative. Taking the CTE curve at the 12th forecast hour as an example, when the area is divided into two parts, three elements can be obtained as 1.1, −118.6, 120.8, that is, in the ensemble member located 1.1 km to the right of the reference point, 120.8 km to the right of the reference point, and 118.6 km to the left of the reference point, respectively.
After obtaining the error members from the PDFs, the subsequent prediction operation can produce multiple combinations of trace members. This method provides more flexibility than WEPS because the composition of the CTE and ATE components can be considered separately or simultaneously, and the number of members can be freely determined. Using the EDF method, which multiplies the error elements of the CTE and ATE components, 81 unique track members can be generated when their PDF is divided into six equal areas.

3. Results and Discussion

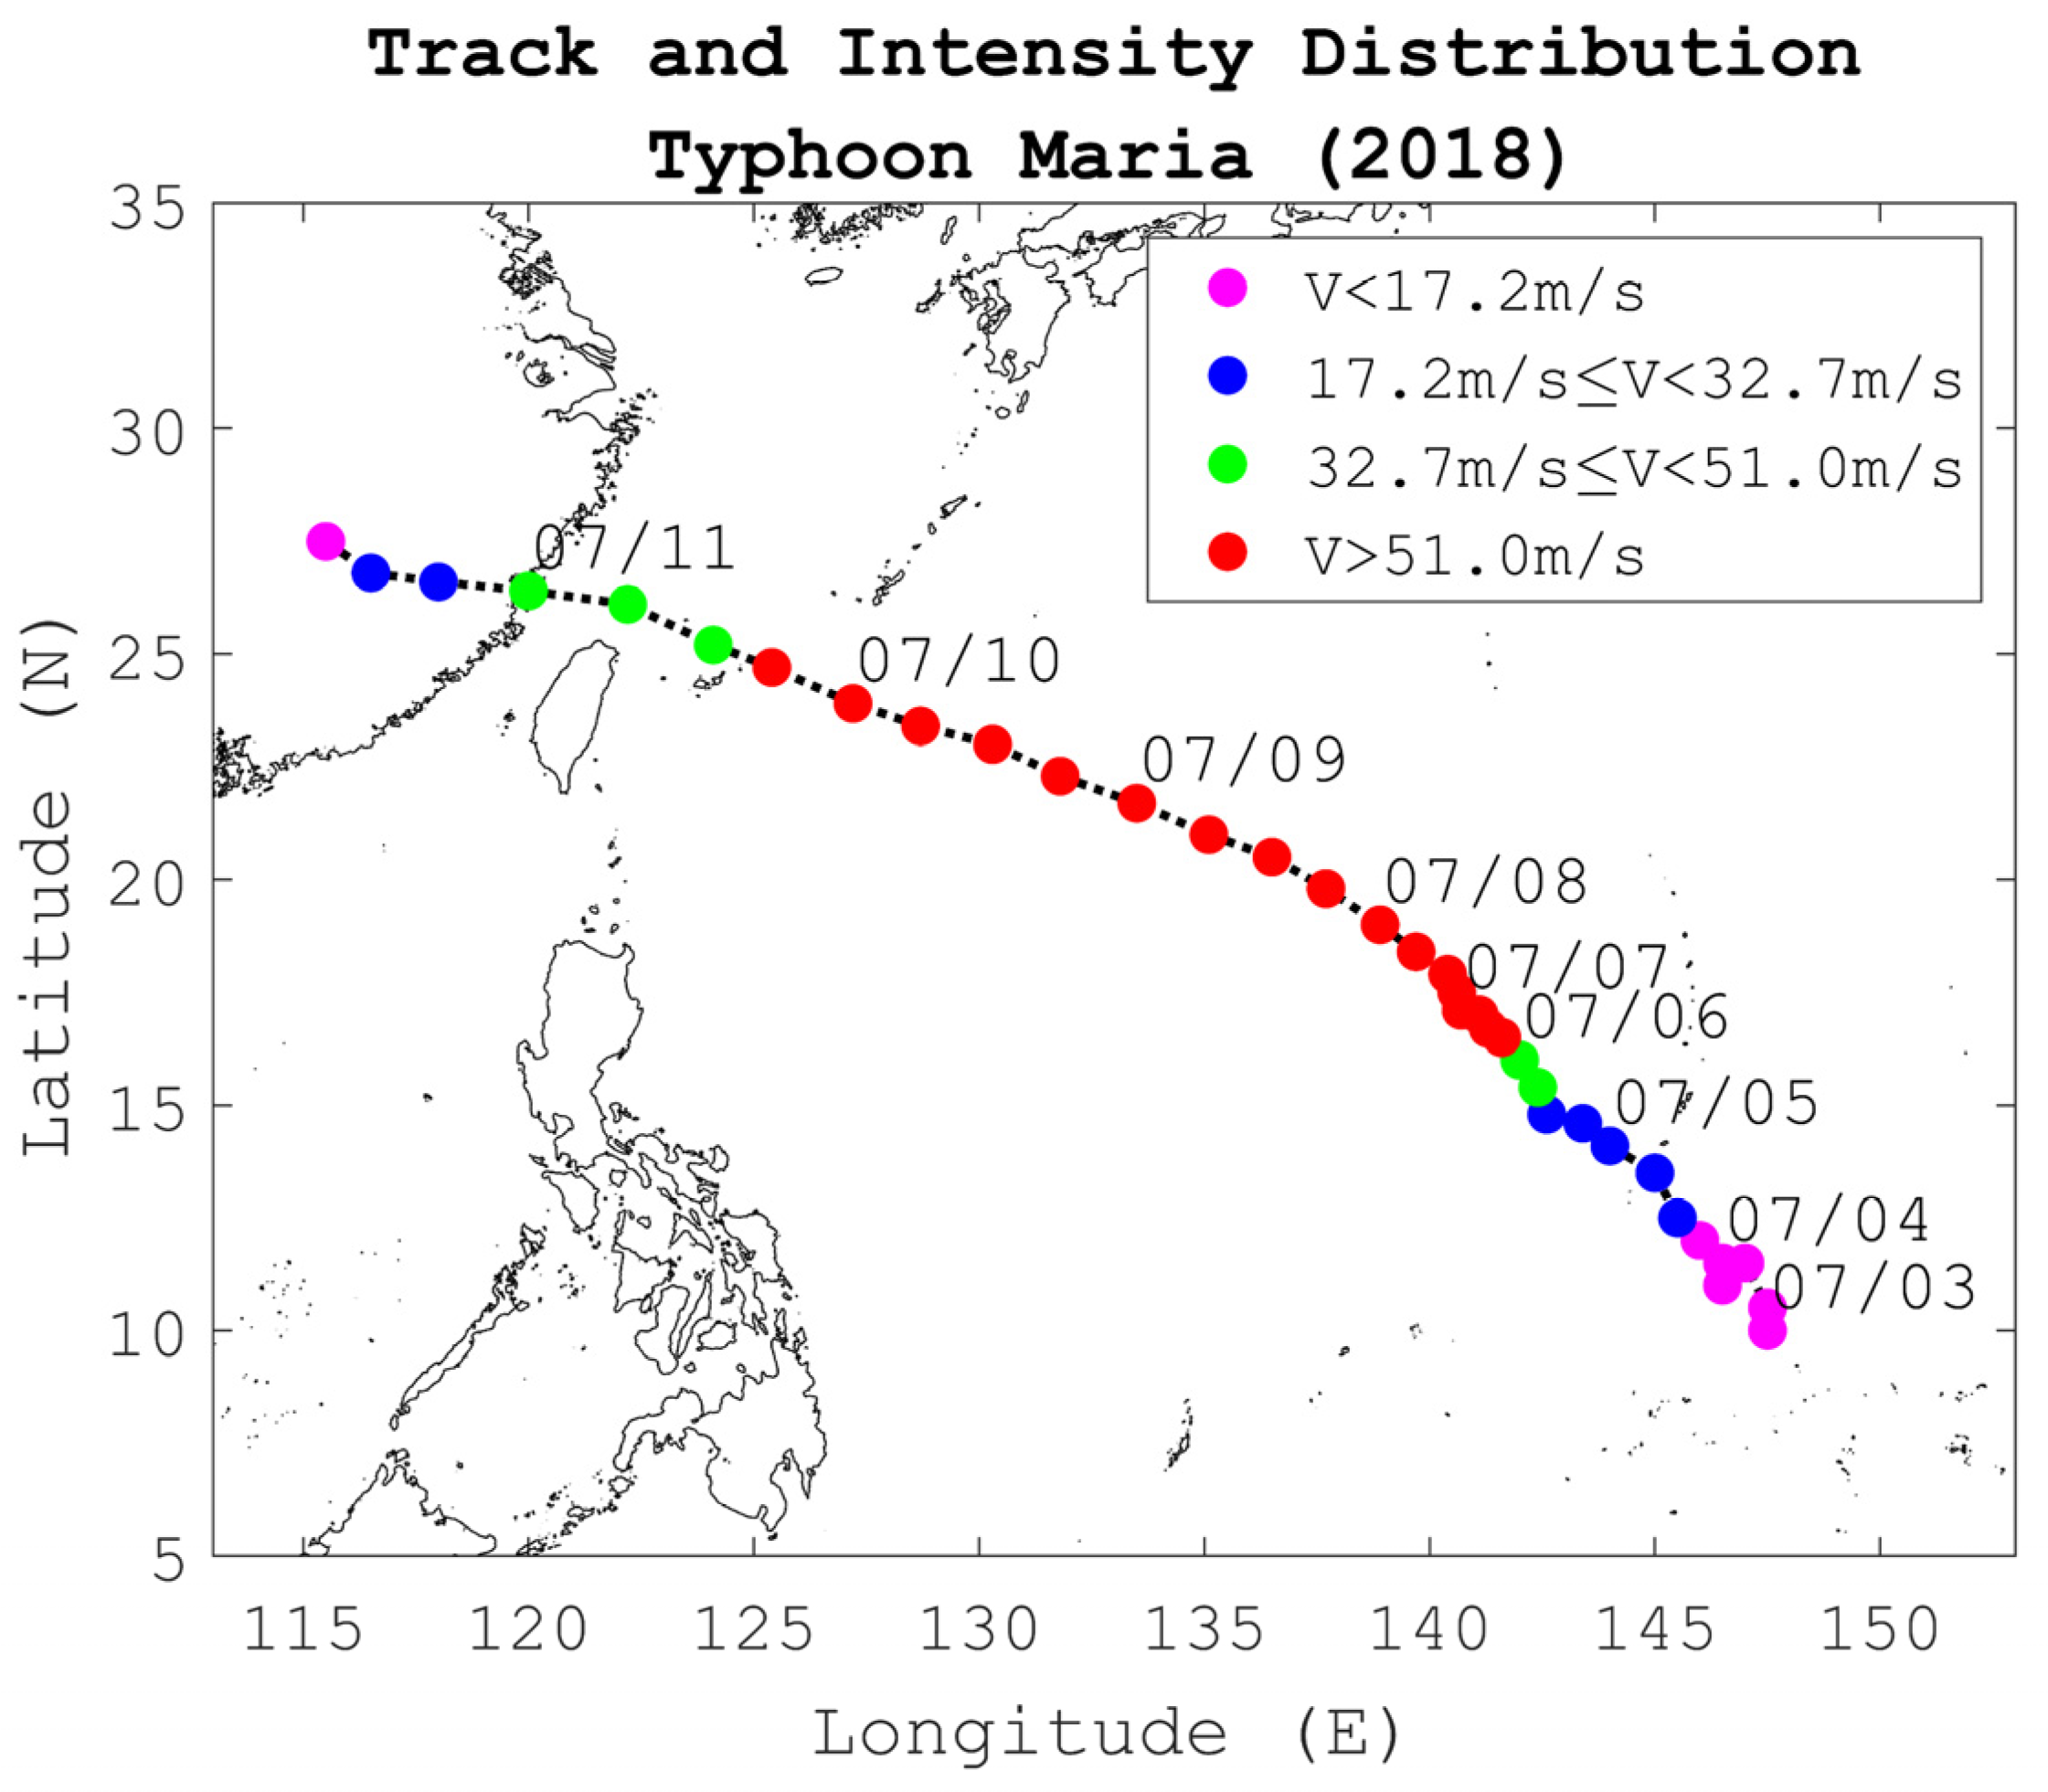
Typhoon Maria of 2018 is chosen to investigate the ensemble method in this study. Figure 5 shows the observed track and intensity. It can be seen that the intensity reached category five on the Saffir–Simpson hurricane wind scale on 7 July 2018. As a result, the sea warning was issued at 14:30 local time, and the land warning was issued at 23:30 local time. Both warnings were canceled at 14:30 on 11 July 2018 [34].

3.1. Calibration of the Storm Surge from the Deterministic Forecast and the Revised Track

To demonstrate the performance of this numerical model in simulating typhoon surges at the current stage, we first compared the initial forecast results obtained in operation with the observed data. Then, we showed the predictions from the track revised according to the historical forecast errors before considering the ensemble members to see if adjusting the track during the forecast operation could improve the forecast.
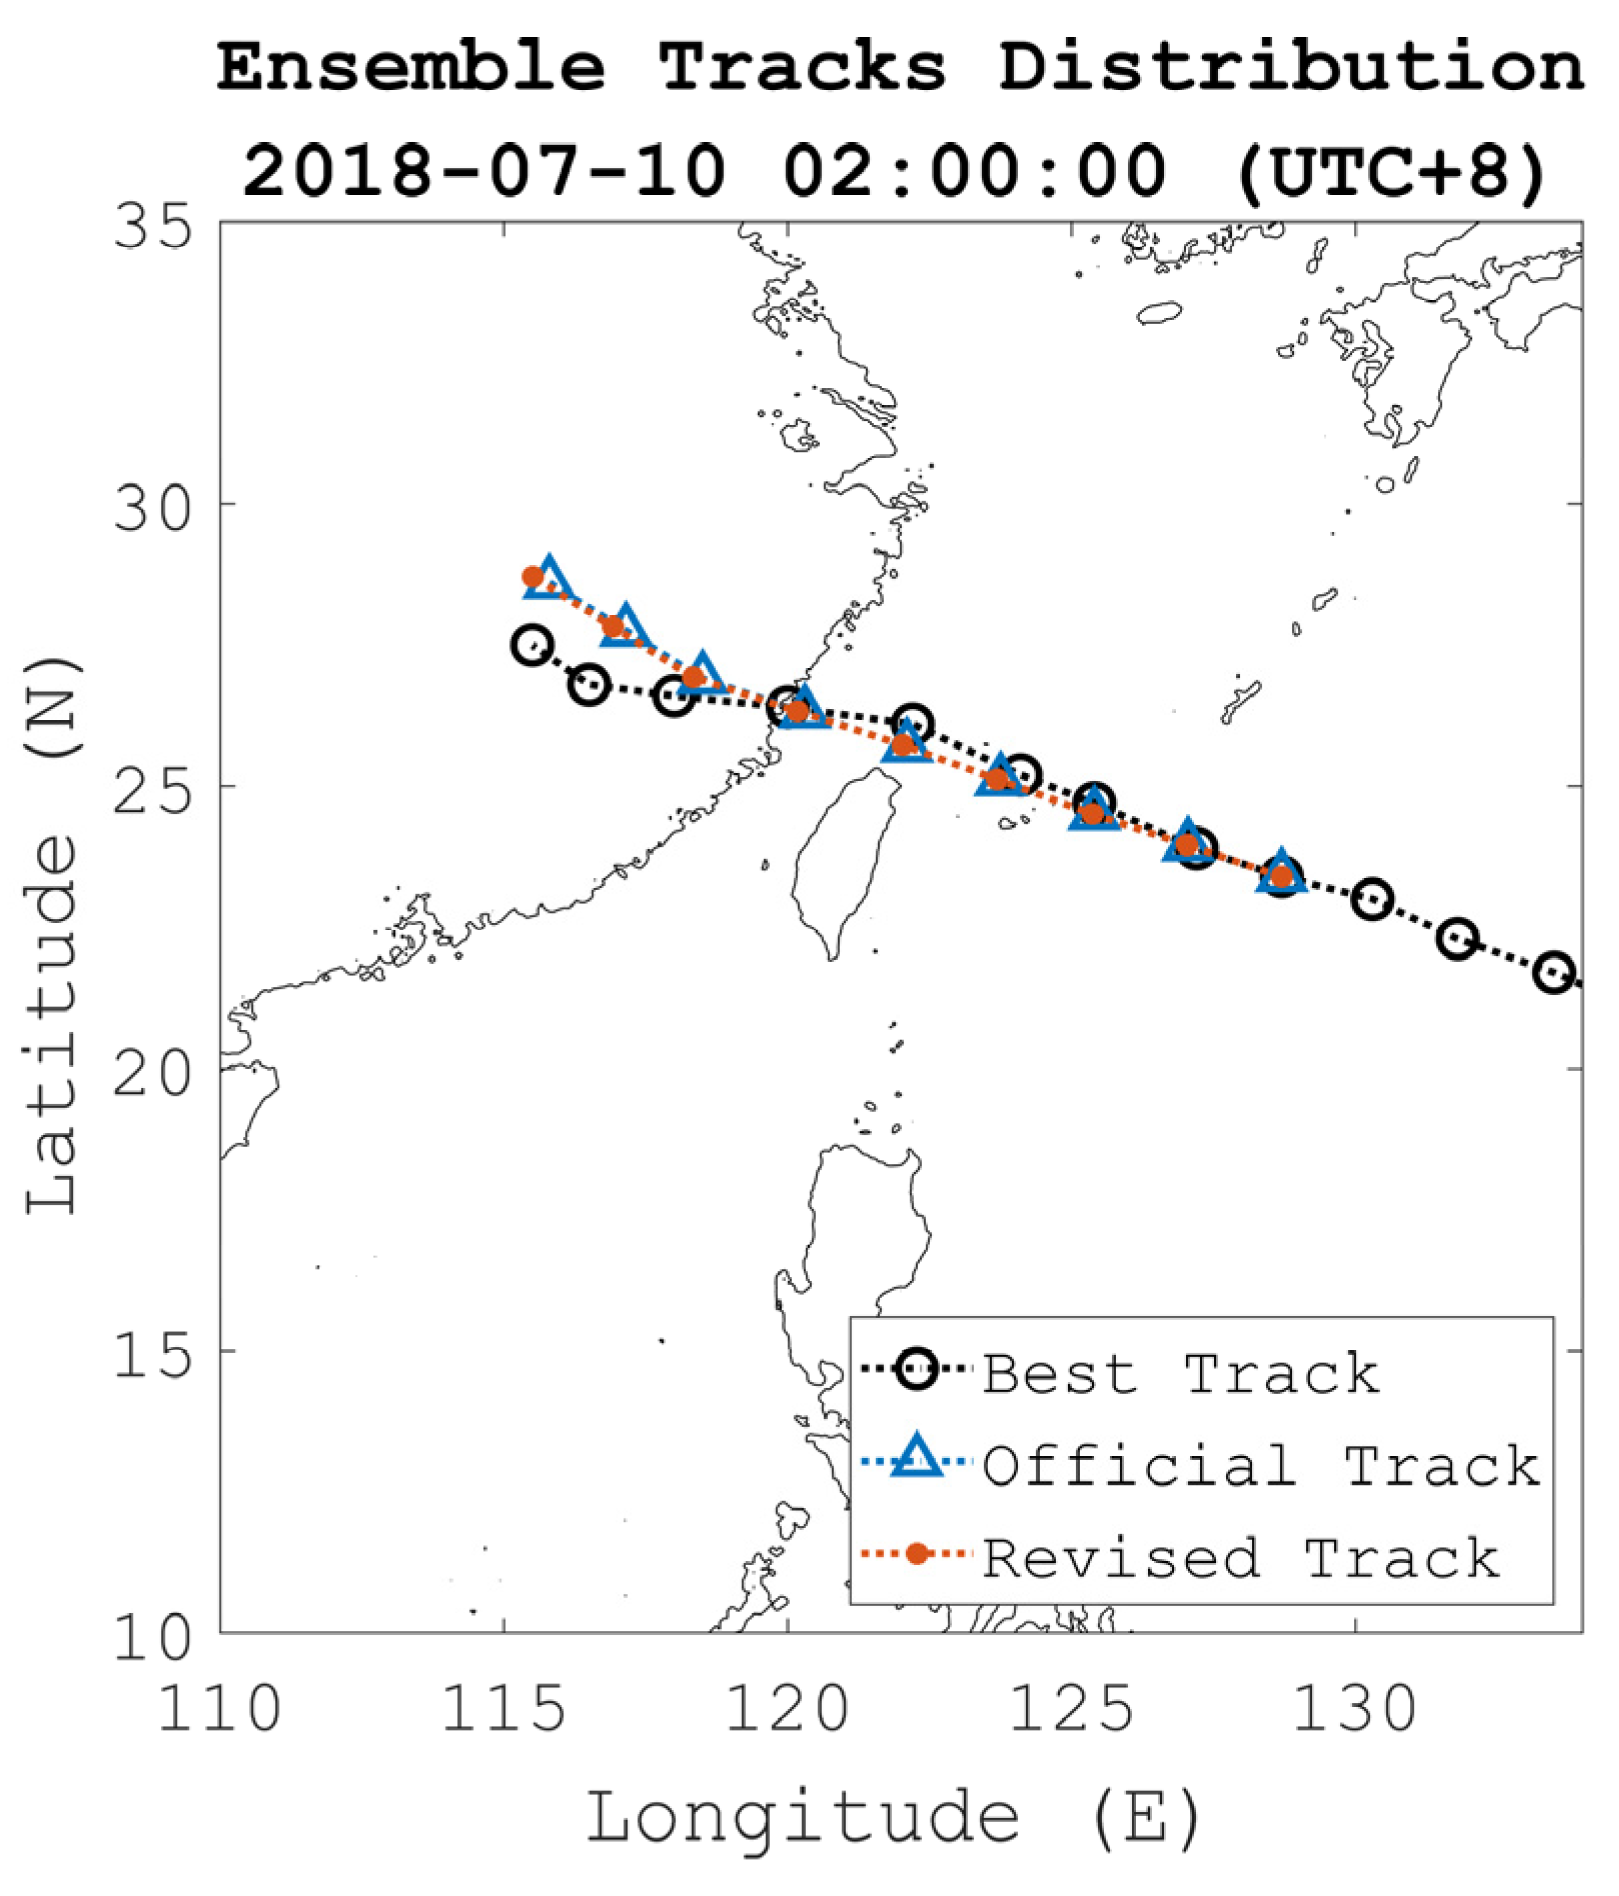
Figure 6 compares the track distribution of the event, including the best track, the official warning track issued at 02:00 local time (UTC+8) on 10 July 2018, and the track revised from the official warning. The best track in black circles is obtained from the CWB typhoon database and can only be retrieved after the event. Considering that there were errors in the historical forecasts, adding statistical errors to the present forecasts should be able to improve the accuracy of the track prediction. The revised track in red dots is calculated by summing the official warning track (blue triangles) and the EDF adjustment shown in Table 3. According to Table 3, both CTE and ATE are less than 10 km in 48 h, indicating the adjustment to the official track is minor. It can be seen from Figure 6 that the adjusted track locates the typhoon slightly faster than the official warning track as the forecast hour increases and is also closer to the best track as the leap time increases over 24 h.
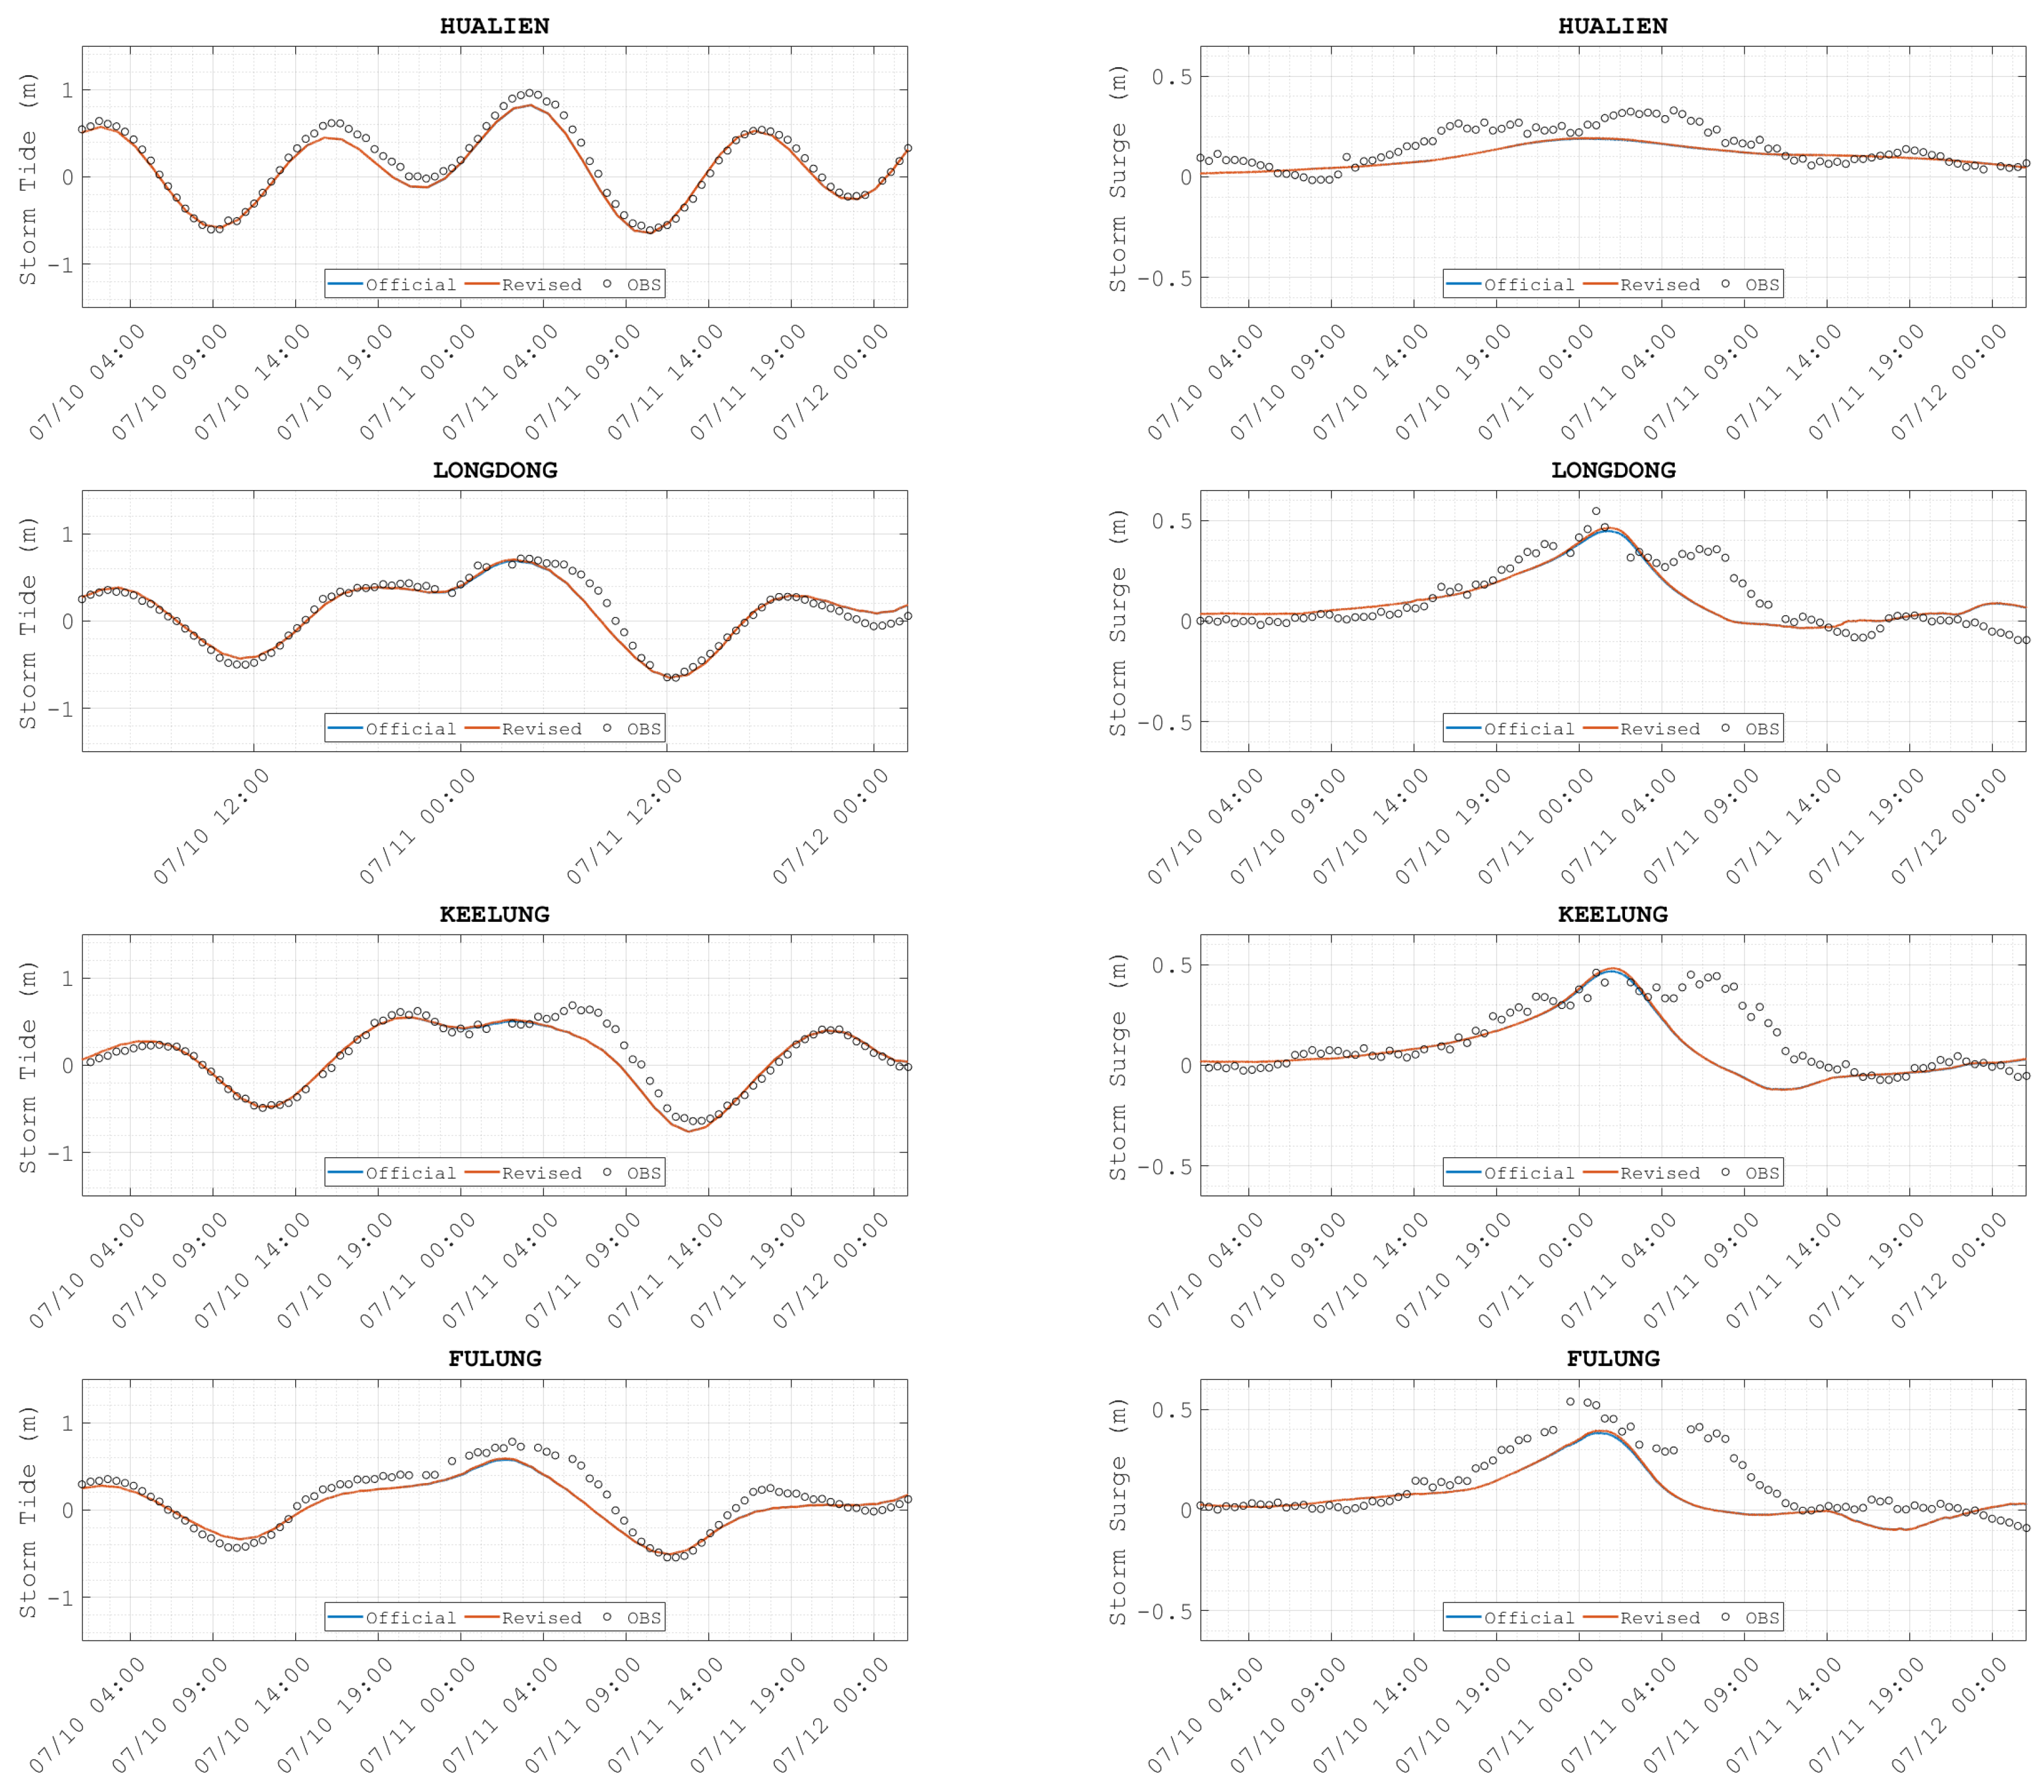
Figure 7 compares the results of the official deterministic forecast track and the EDF-based deterministic track at Longdong, Keelung, Fulung, and Hualien stations. The definition of storm surge height is the astronomical tide height plus the storm surge height. The observed storm surge height is obtained from the residual between the observed storm surge height and the predicted astronomical tide height from harmonic analyses. The expected storm surge height is calculated from the residual between the tide-driven and tide-storm-driven modes. Figure 7 shows that the results from the official track are very similar to those from the adjusted track. With a leap time within 24 h, results from both tracks agree well with the observations when the tropical cyclone track is accurately predicted. The observed storm surge height in northern Taiwan varies from −0.5 to 1.0 m, and the peak surge height is 0.5 to 0.6 m. Both forecast results describe the astronomical tide well. As for the storm surge, both forecast results agree with the observation at the first surge peak at about 11 (02:00). However, both forecasts miss the second peak at about 11 (08:00).
This comparison of water levels shows that even considering the most common error scenario, where the forecast track is revised based on historical errors, does not significantly improve storm surge predictions. However, the difference between the best track and the forecast tracks also indicates that considering a range of the track error distribution has a chance of covering the actual location of the typhoon, showing that we can describe its uncertainty by ensemble typhoon track prediction.

3.2. Surge Elevation from Ensemble Members at Gauges

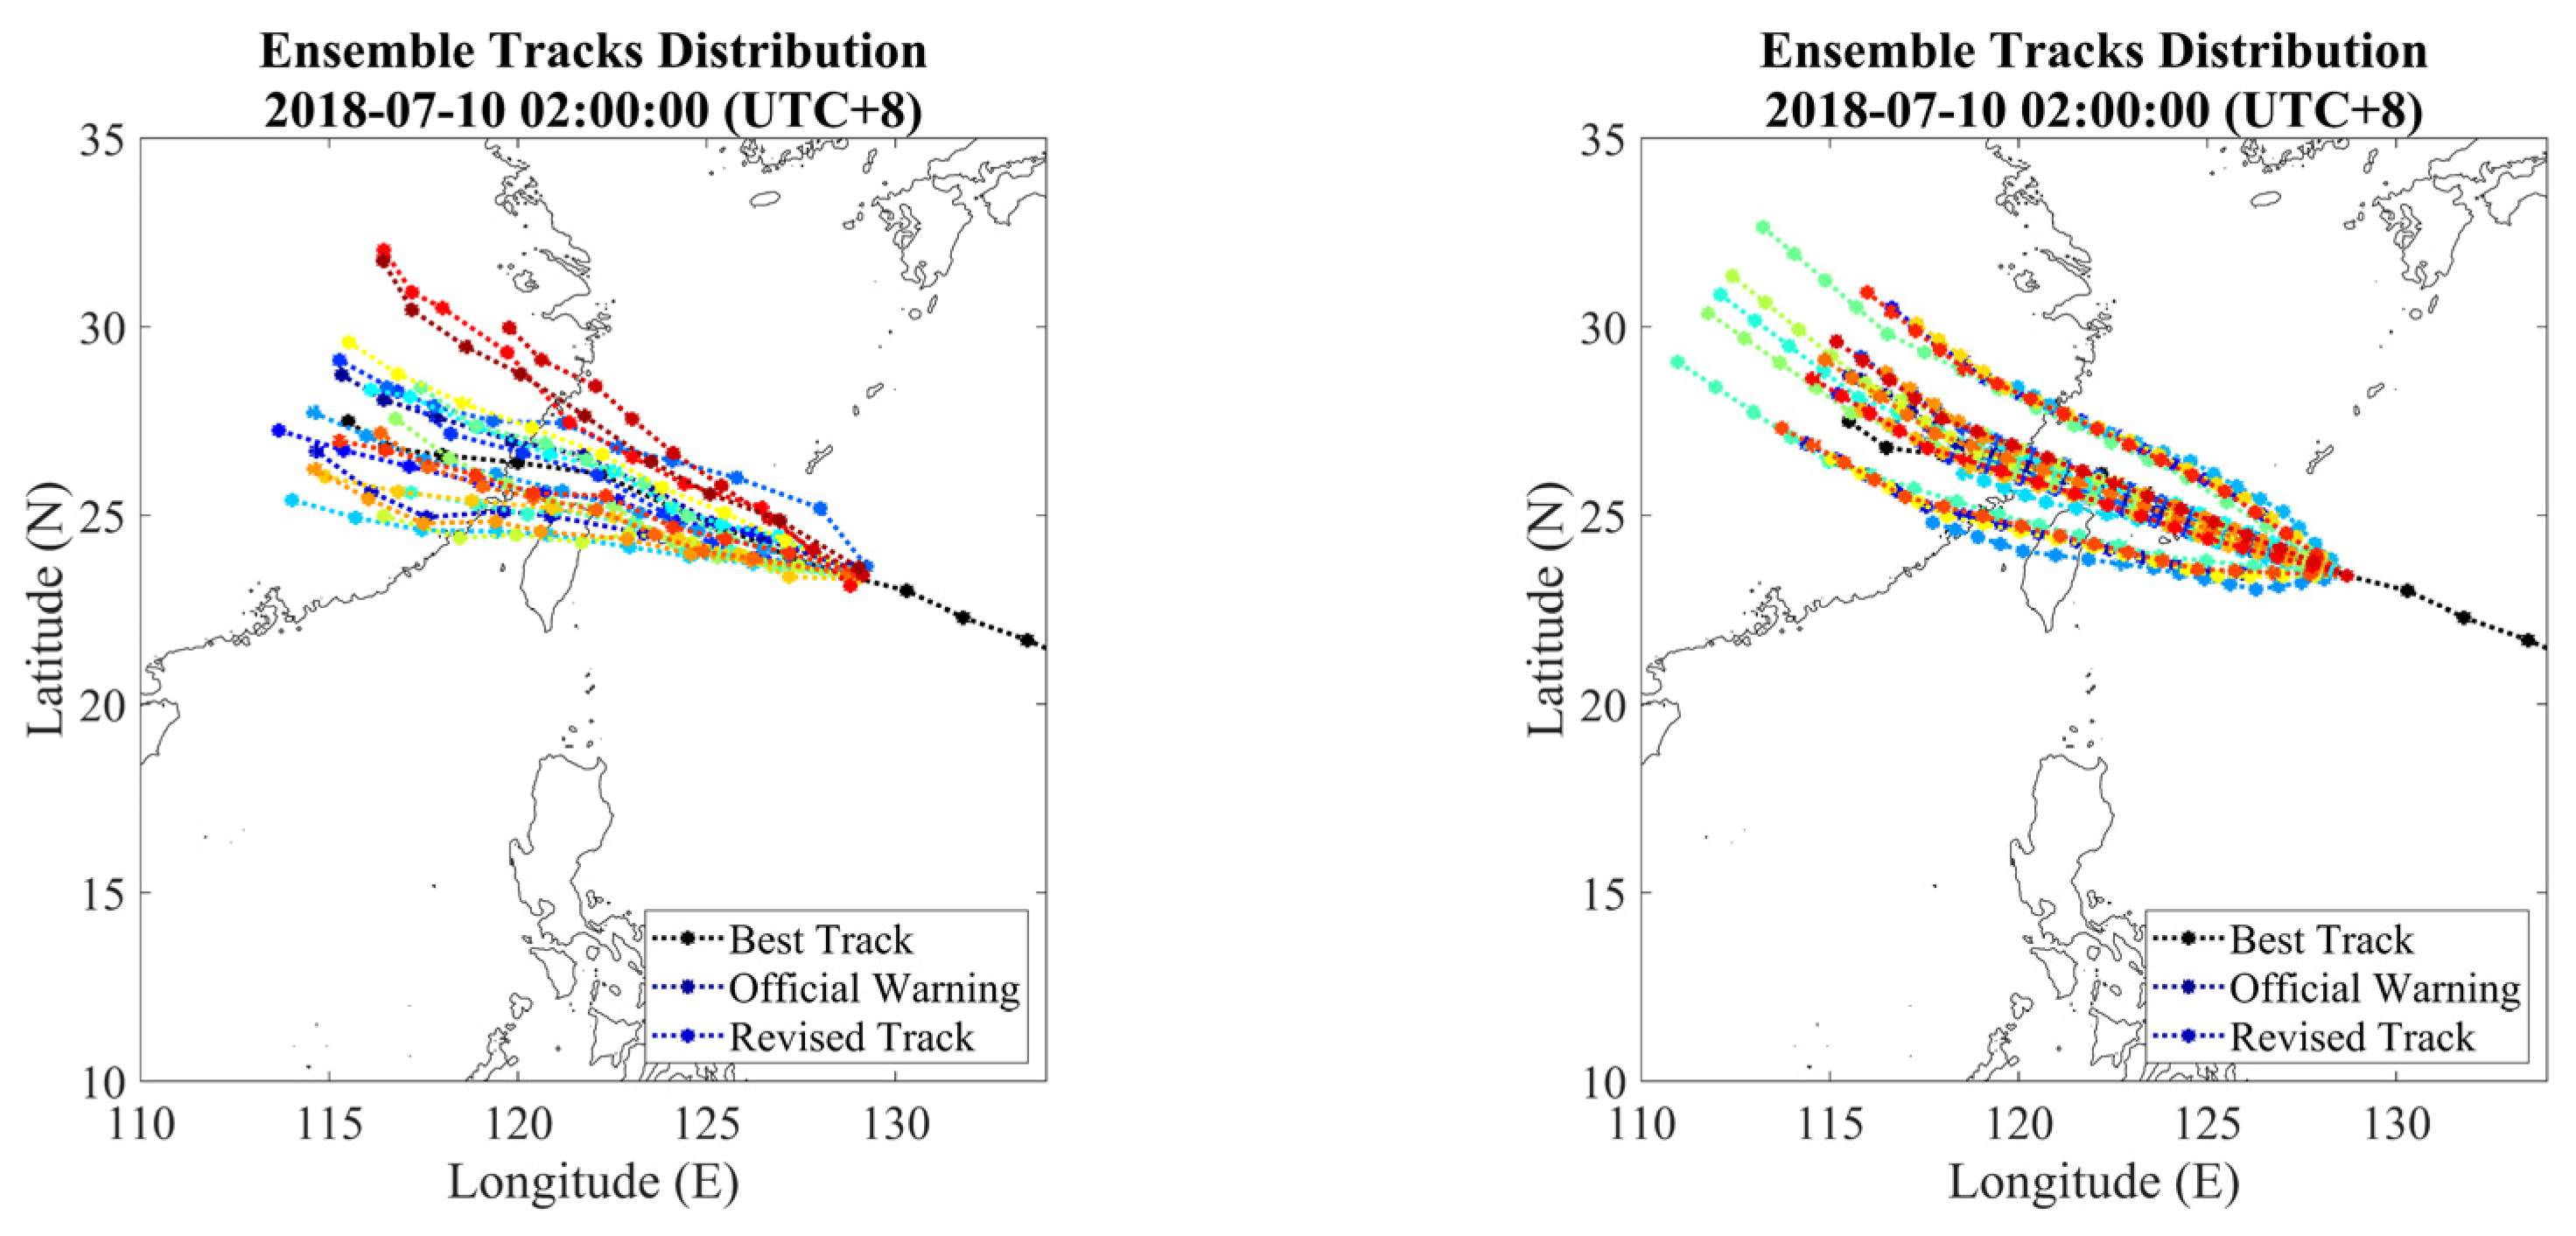
The ensemble members from atmospheric models can represent the instability of environmental perturbations, while the ensemble members from historical errors can be relatively flexible in the number of members selected. However, the official forecasts usually do not compare the difference between the two methods for the accuracy of the ensemble forecast. Therefore, this study compares the differences in the track distribution with two composition methods for the water level ensemble forecast results. In the comparison, WEPS and EDF (0505) are selected for display, among which WEPS has 20 path members and EDF (0505) has 25 track members composed by using five error members in ATE/CTE in the EDF method.
Figure 8 shows the ensemble tracks of WEPS and EDF. The forecast is initialized at 02:00 local time on 7 July 2018, about 24 h before the peak surge around northern Taiwan. The time interval of the forecast location in WEPS is 6 h. In this study, the ensemble composition of WEPS and EDF (0505) is selected to evaluate the performance.
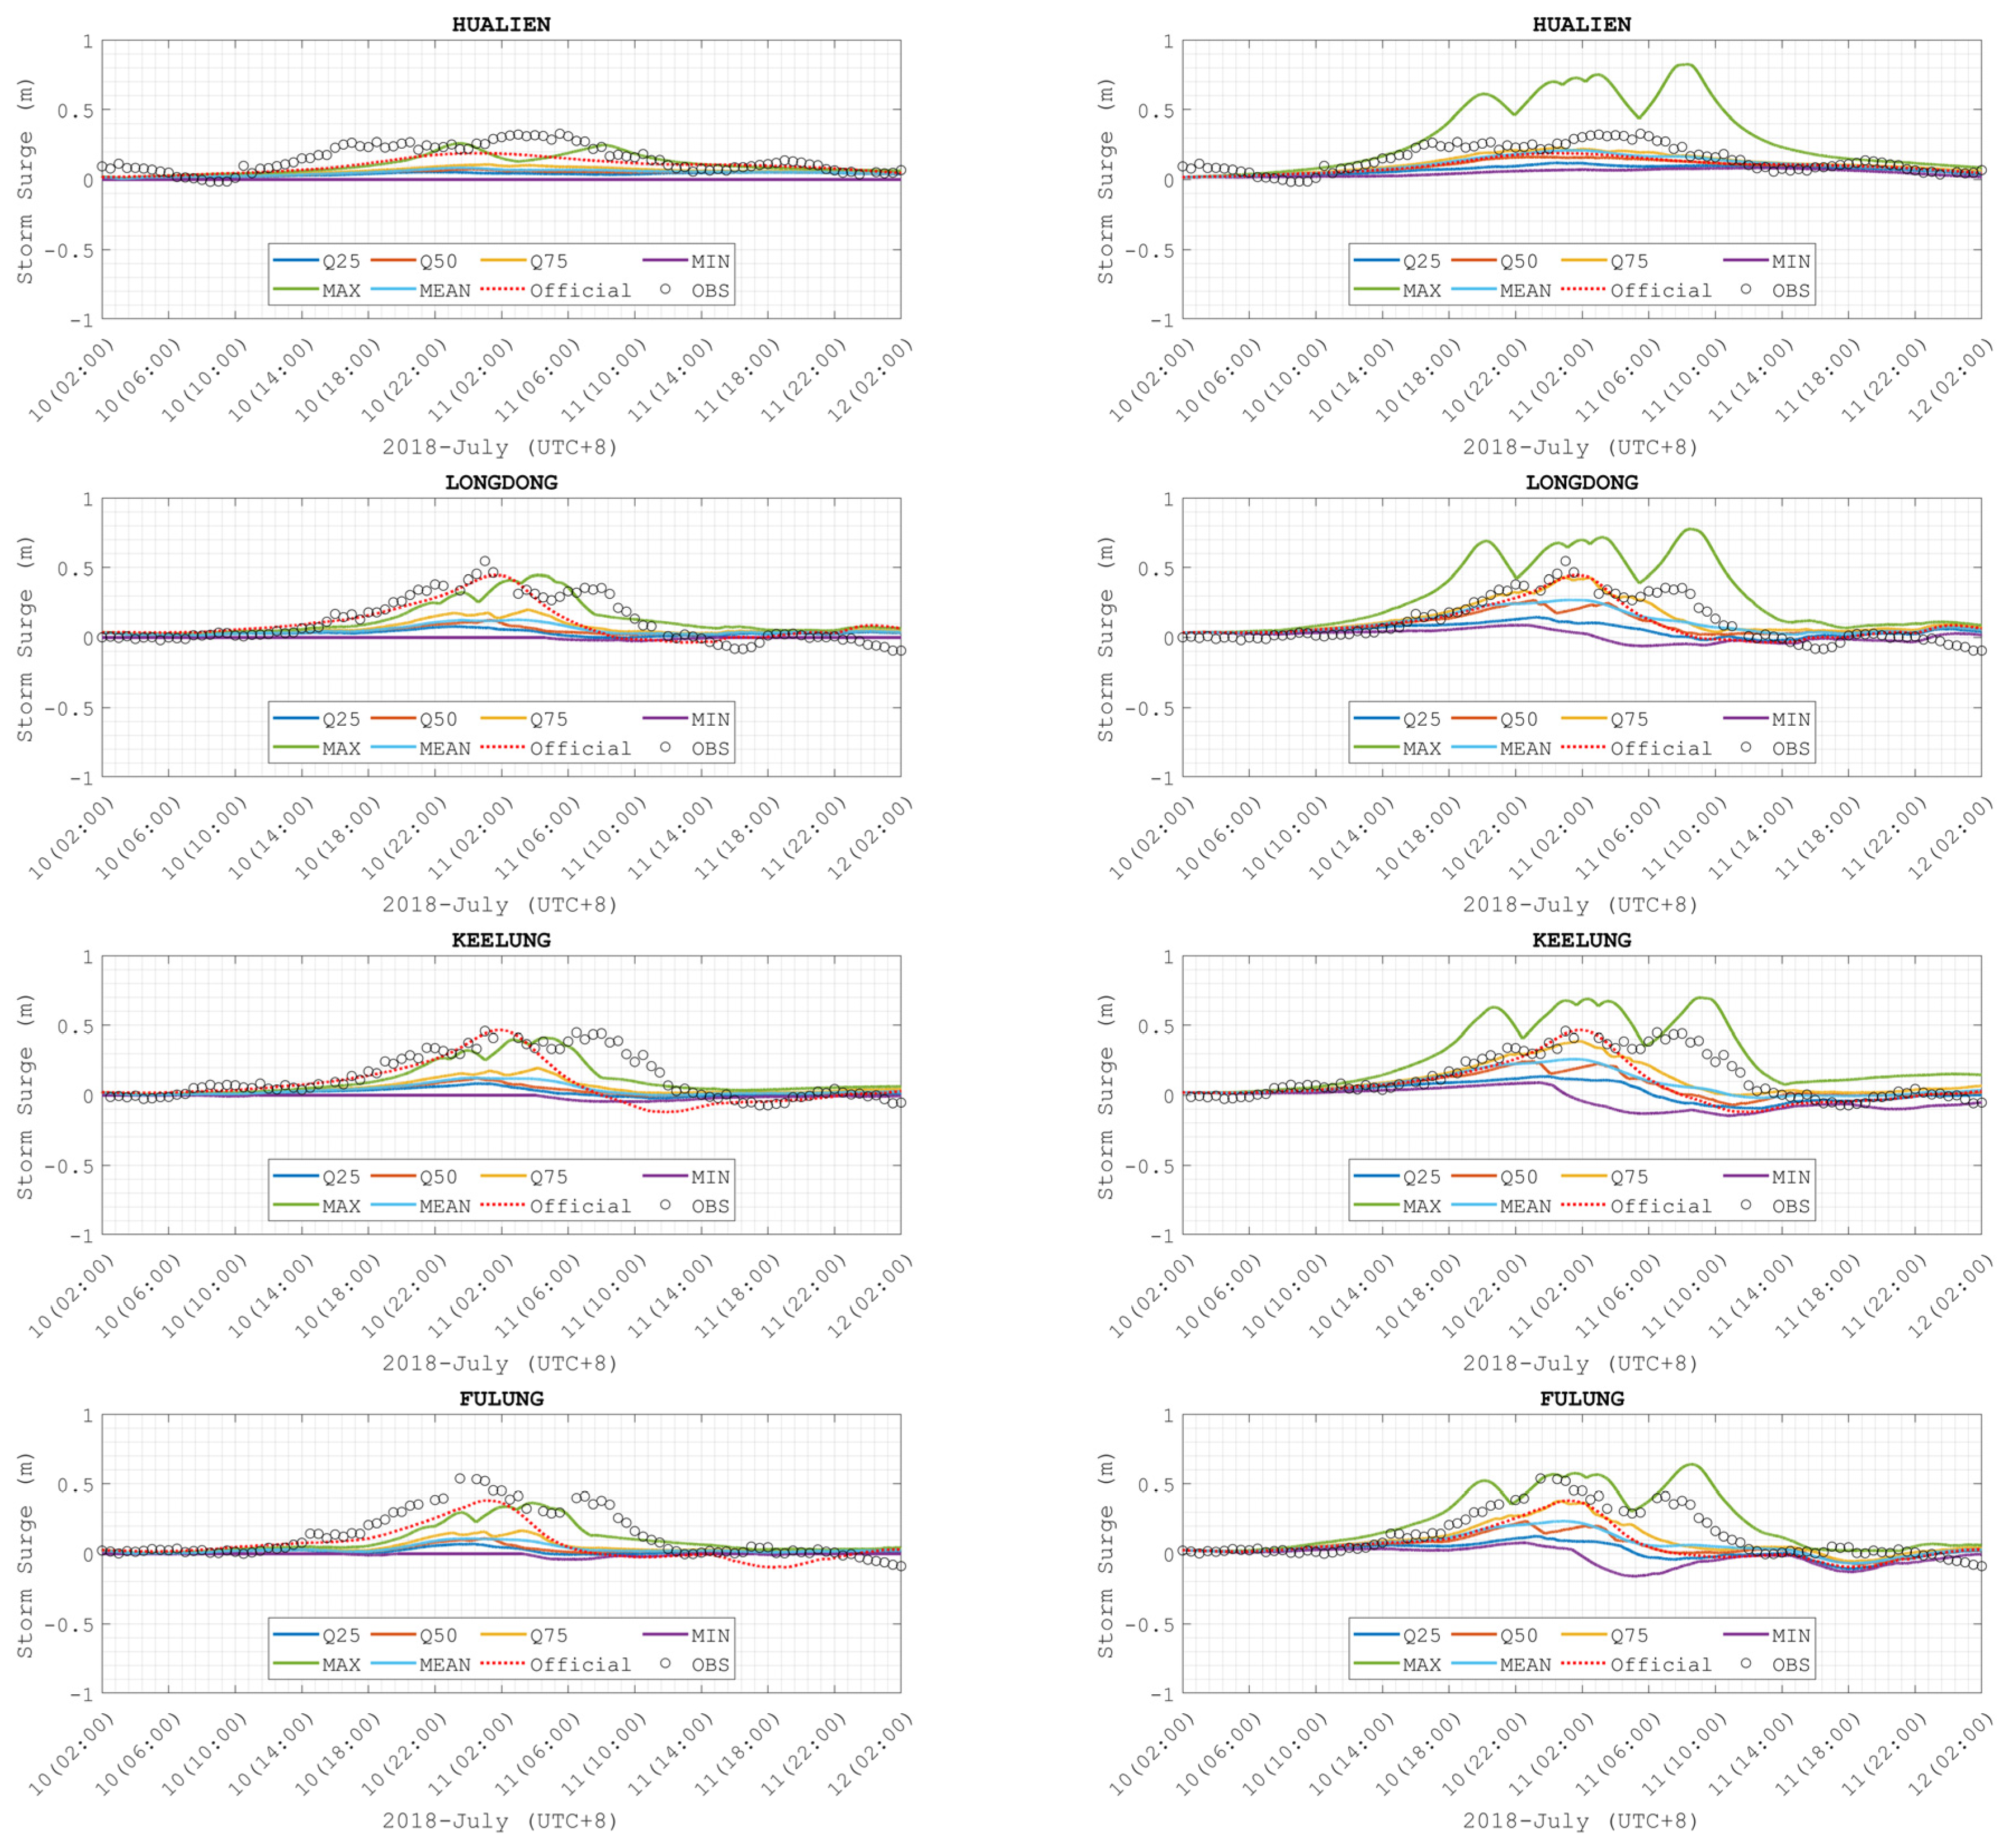
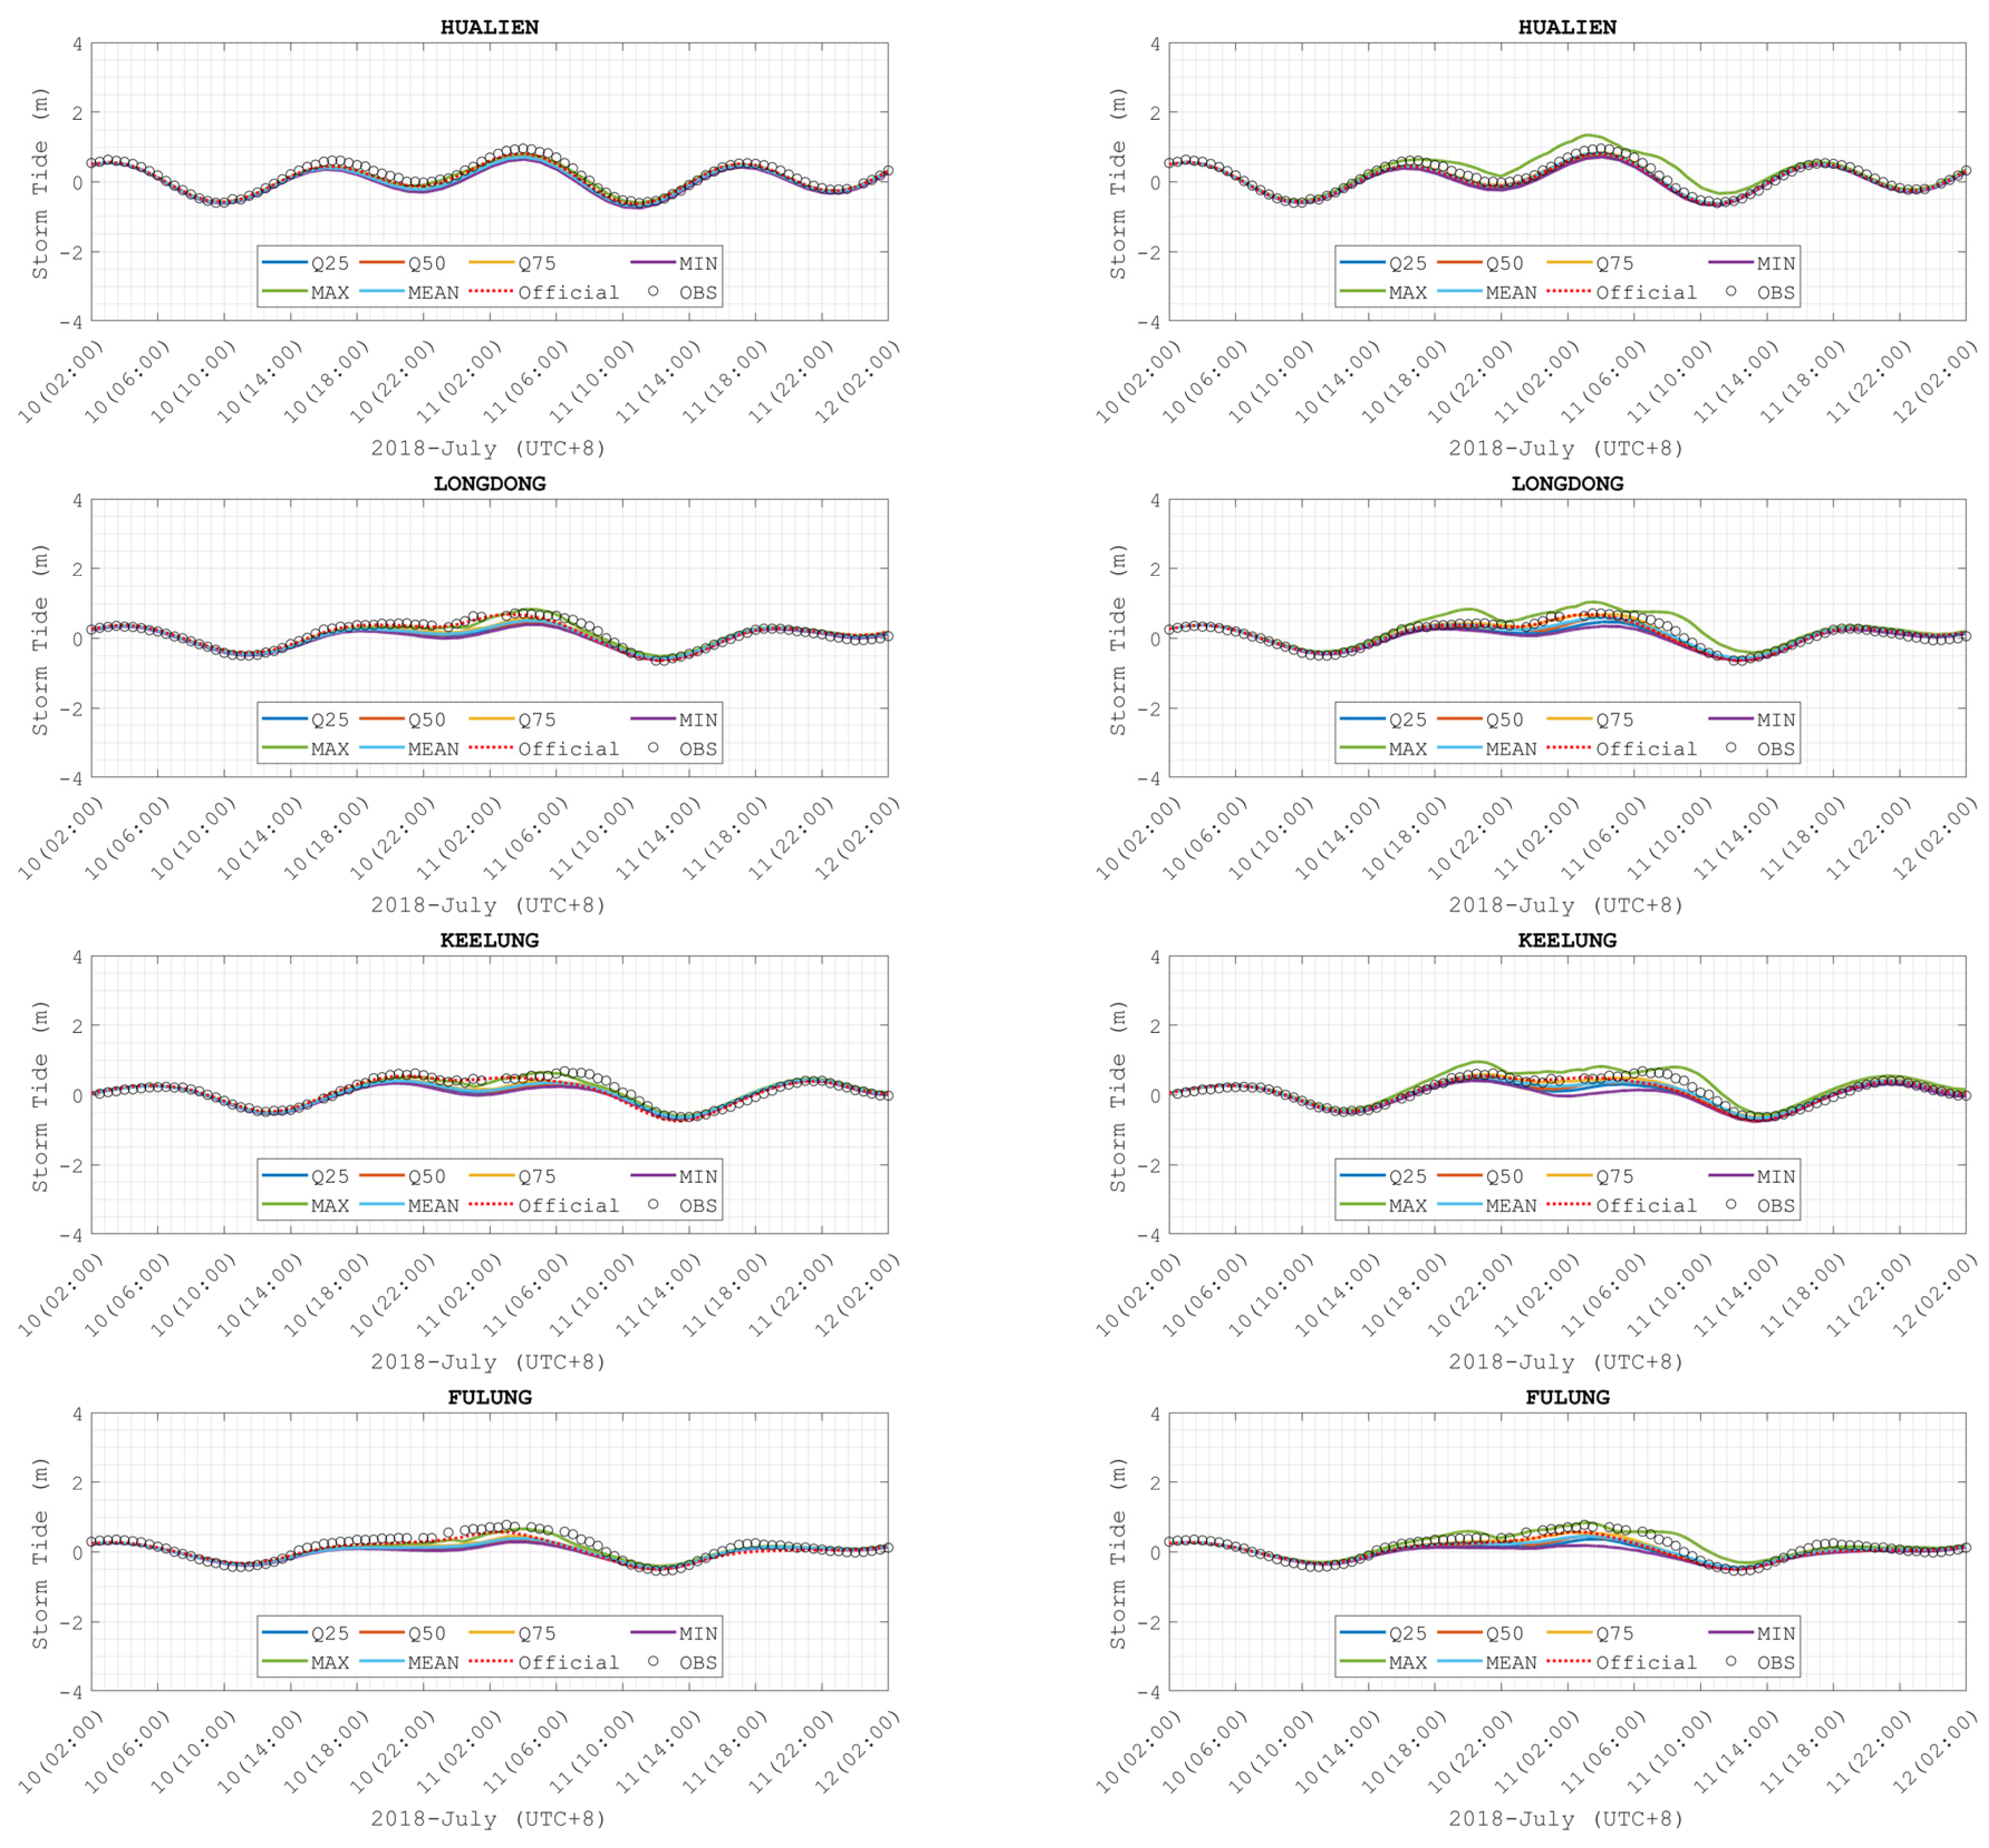
The statistical results of the storm surge and storm tide elevation presented in the time series are shown in Figure 9 and Figure 10. The left panels are from WEPS, and the right is from EDF. The statistical results are the ensembles’ quartiles, minimum, maximum, and mean. The red dashed line and the black circles indicate the official forecast and the observation, respectively.
With a time series ensemble forecast covering the upper and lower bounds of the observations, it is easy to determine the ensemble spread qualitatively. For example, Figure 9 and Figure 10 show that the maximum ensemble heights of storm surge and storm tide from EDF are more variable than those from WEPS. It can also be seen that the maximum heights of storm surge and storm tide from WEPS usually have similar values to the official forecast but cannot capture the maximum value from the observation. On the other hand, the maximum value from EDF is larger than the observations at all stations shown, which fulfills one of the purposes of doing the ensemble forecast: To consider the possibility and provide a reasonable range of variation. The results from storm tide are similar to those from storm surge because the same astronomical tide heights are used in all ensemble members.

3.3. Elevation Profiles from Ensemble Forecast System

The storm surge can be dangerous when a massive storm surge is combined with a high astronomical tide. Therefore, we also compare two probabilistic analysis products referencing the P-surge model [12] for storm surges computed by WEPS and EDF in the developing ensemble prediction system.
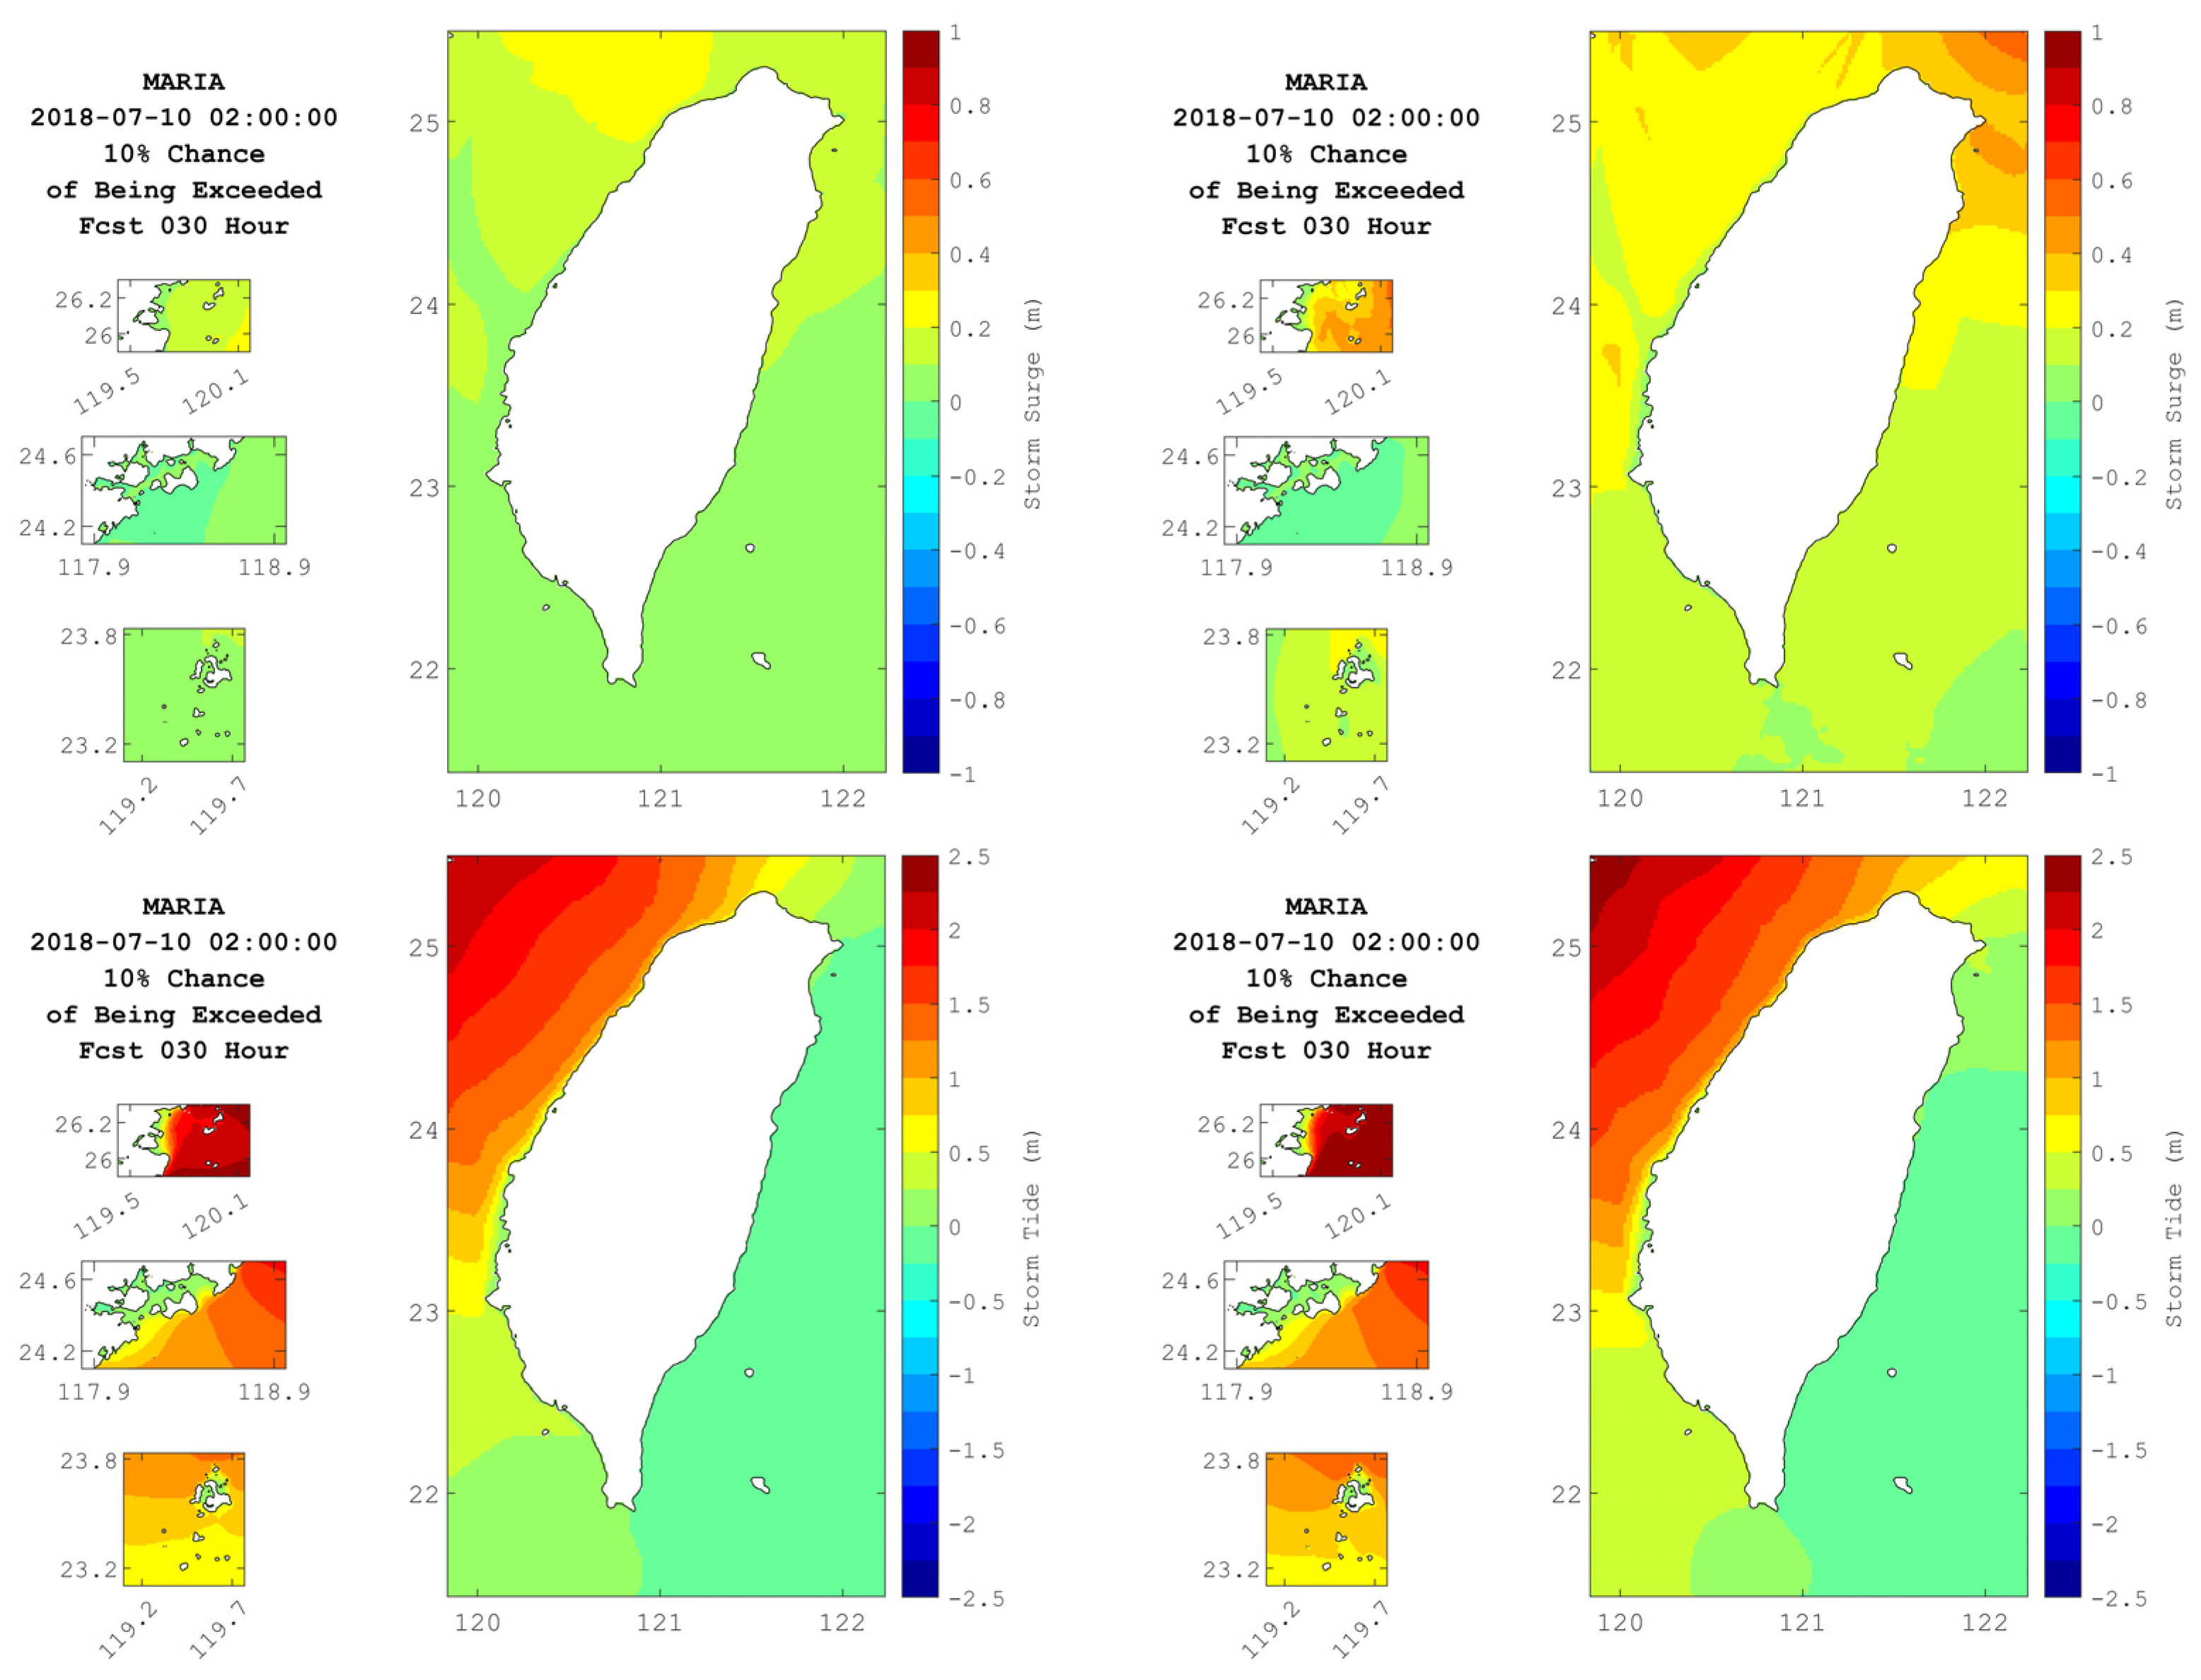
One of the probabilistic products is the water level with a specific chance of being exceeded. For example, Figure 11 shows the water surface elevation with a 10% chance of being exceeded at the 30-h lead time. The product can be obtained by sorting the simulated water levels of all members from highest to lowest and summing the weight of each member in that order until the value is greater than or equal to the specified exceedance probability to obtain the corresponding water level.
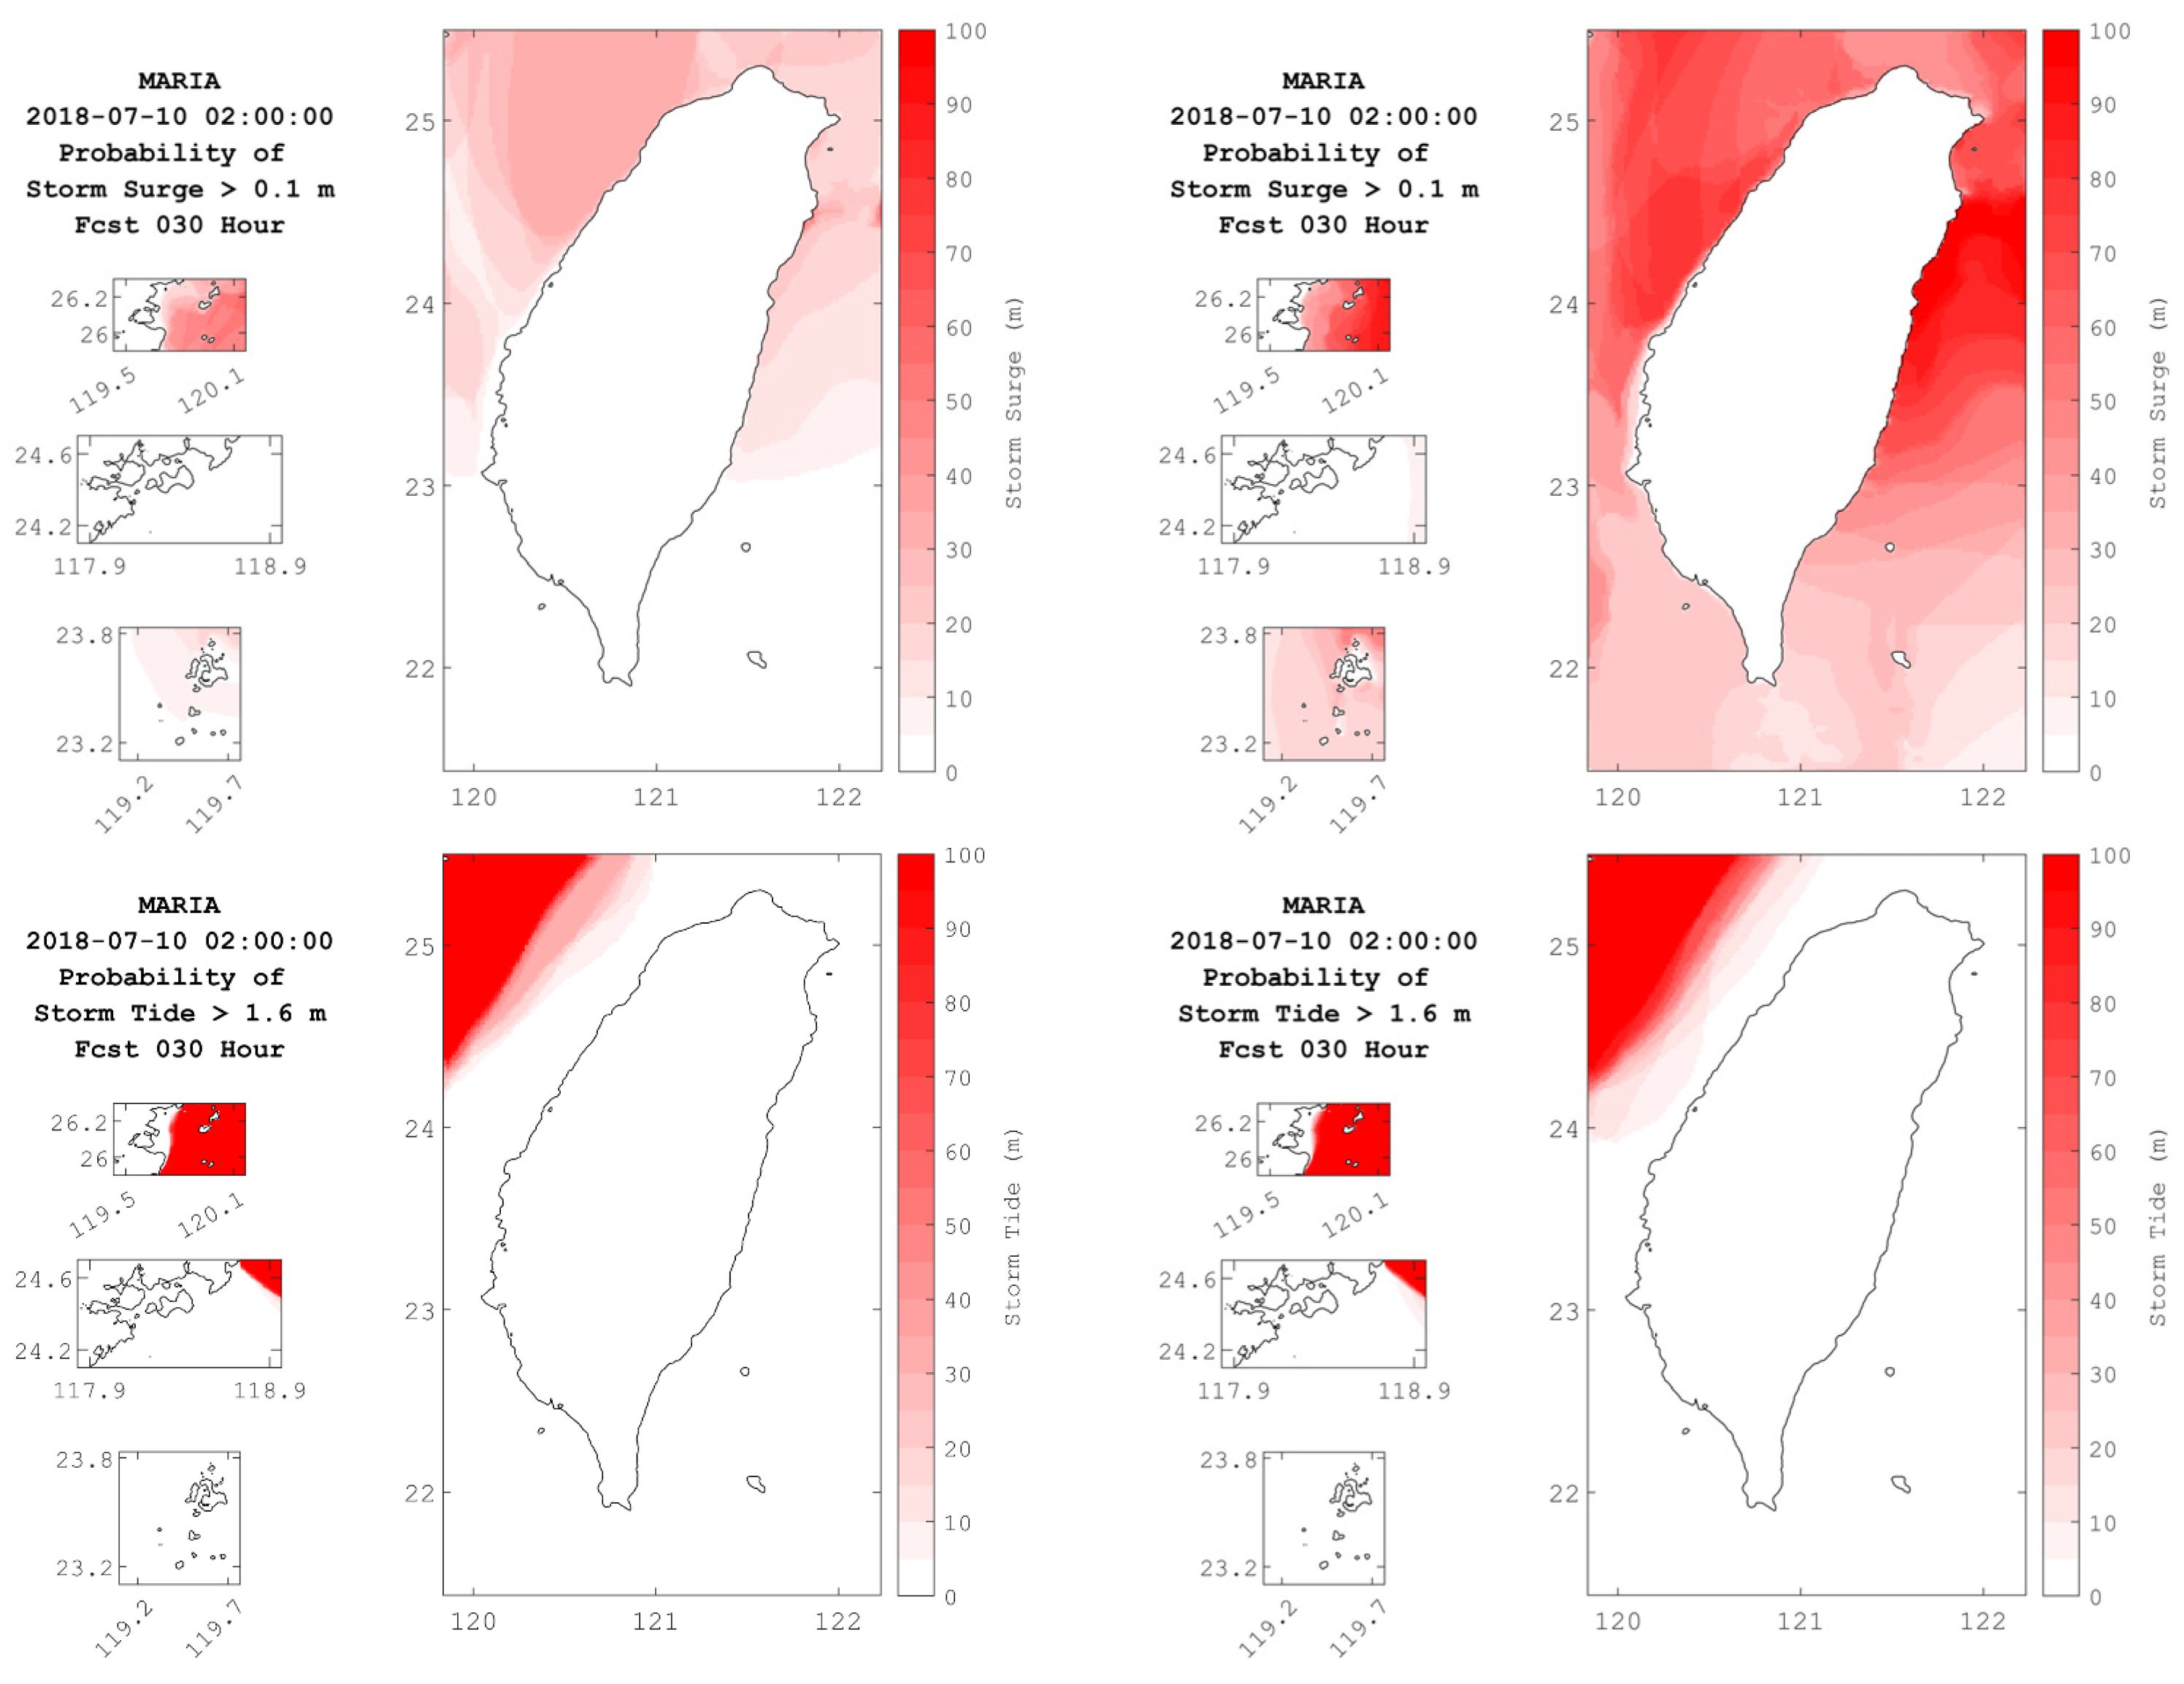
The other product is the probability distribution of water levels above a specified threshold. It is calculated by summing the weights of the elements that meet the threshold criteria. For example, Figure 12 shows the probability of water elevation higher than 0.1 m for storm surge and the threshold of 1.6 m for storm surge to illustrate the product’s functionality.
Figure 11 compares the distribution of the 10% exceedance storm surge from two ensembles. The results from the EDF members show a higher elevation on Taiwan’s northern and eastern coasts. With a 30-h forecast lead time, this higher surge elevation varies from 0.3 to 0.5 m, while the peak surge from WEPS is 0.2 m in the nearshore region along the northwest coast of Taiwan. In this case, the tidal height, about 1.0 to 1.5 m in northwest Taiwan, is the main component of the storm tide for both ensembles. We can see that in the EDF ensemble products, the total water height is less than 0.3 m in the worst case when the surge component exceeds 0.5 m. In contrast, the typhoon may not affect northeastern Taiwan, but the total water height can reach 0.7 m in extreme scenarios, showing that considering the tidal component is essential for assessing the impact of storm surges in forecasting.
Figure 12 shows the percent probability map of the water level reaching the threshold with a 30-h forecast lead time. The threshold is 0.1 m for the storm surge and 1.6 m for the storm tide. The 1.6 m threshold is the mean spring tide obtained from the CWB. It can be seen in Figure 12 that the probability percentages of storm surges reaching the 1.6 m threshold from both ensembles are mainly located on the northwest coast of Taiwan, and it is directly related to the high astronomical tide level. The percentage of probability that the storm surge height reaches 0.1 m ranges from 10% to 50%, covering the north of central Taiwan and the Matsu area in the WEPS forecasts. In Kinmen, the percentage of probability of the storm surge reaching 0.1 m in both ensemble methods is less than 10%, indicating that the impact of the storm on Kinmen is insignificant during this forecast period.
Comparing the results between Figure 11 and Figure 12, the 10% exceedance map from the EDF method reaches a higher water level than WEPS, and the percentage probability map of reaching the 0.1 m water level threshold is also more extended. More than 50% of the EDF members affect the northeast and northwest of Taiwan, some will affect the water level rise in the south. On the other hand, less than 50% of the WEPS members reach the threshold in the north of Taiwan. In Figure 12, it can be seen that the water level of the WEPS members can rise less than 0.3 m of water level in northwest Taiwan in more extreme scenarios, which shows that the overall water level predicted by the WEPS ensemble is lower than that of the EDF, which is consistent with the time series prediction.

3.4. Statistic Evaluation

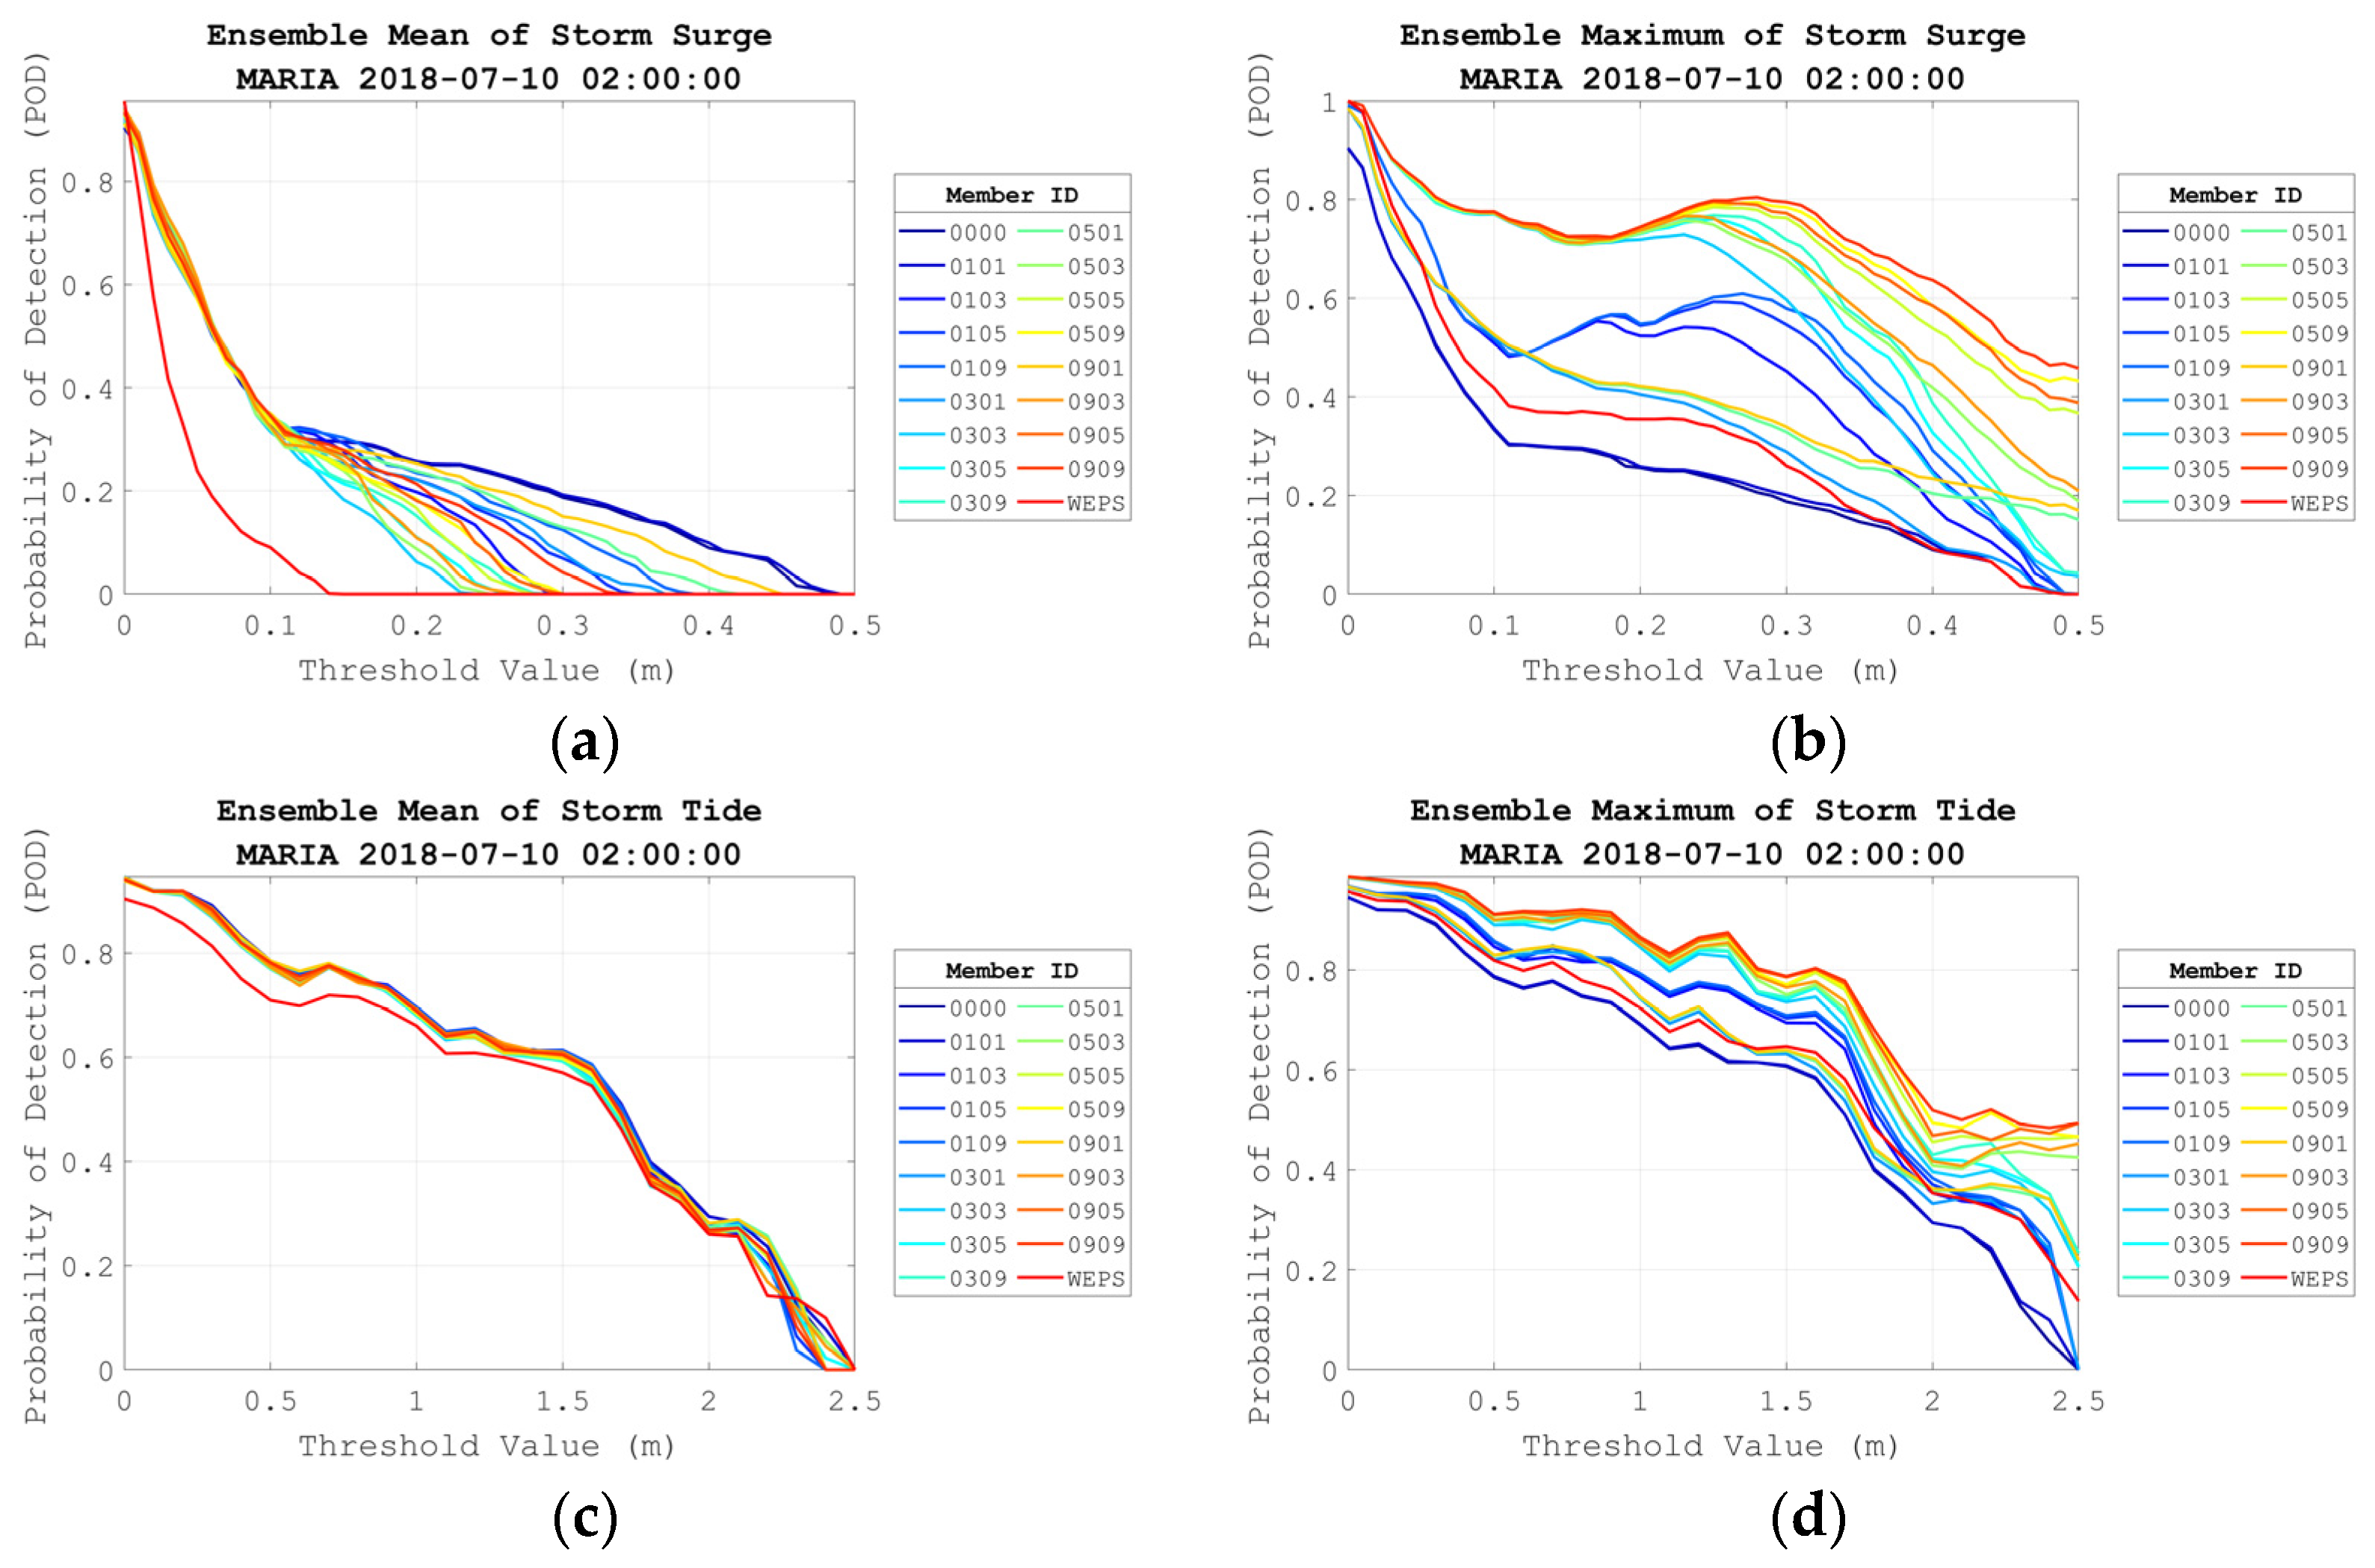
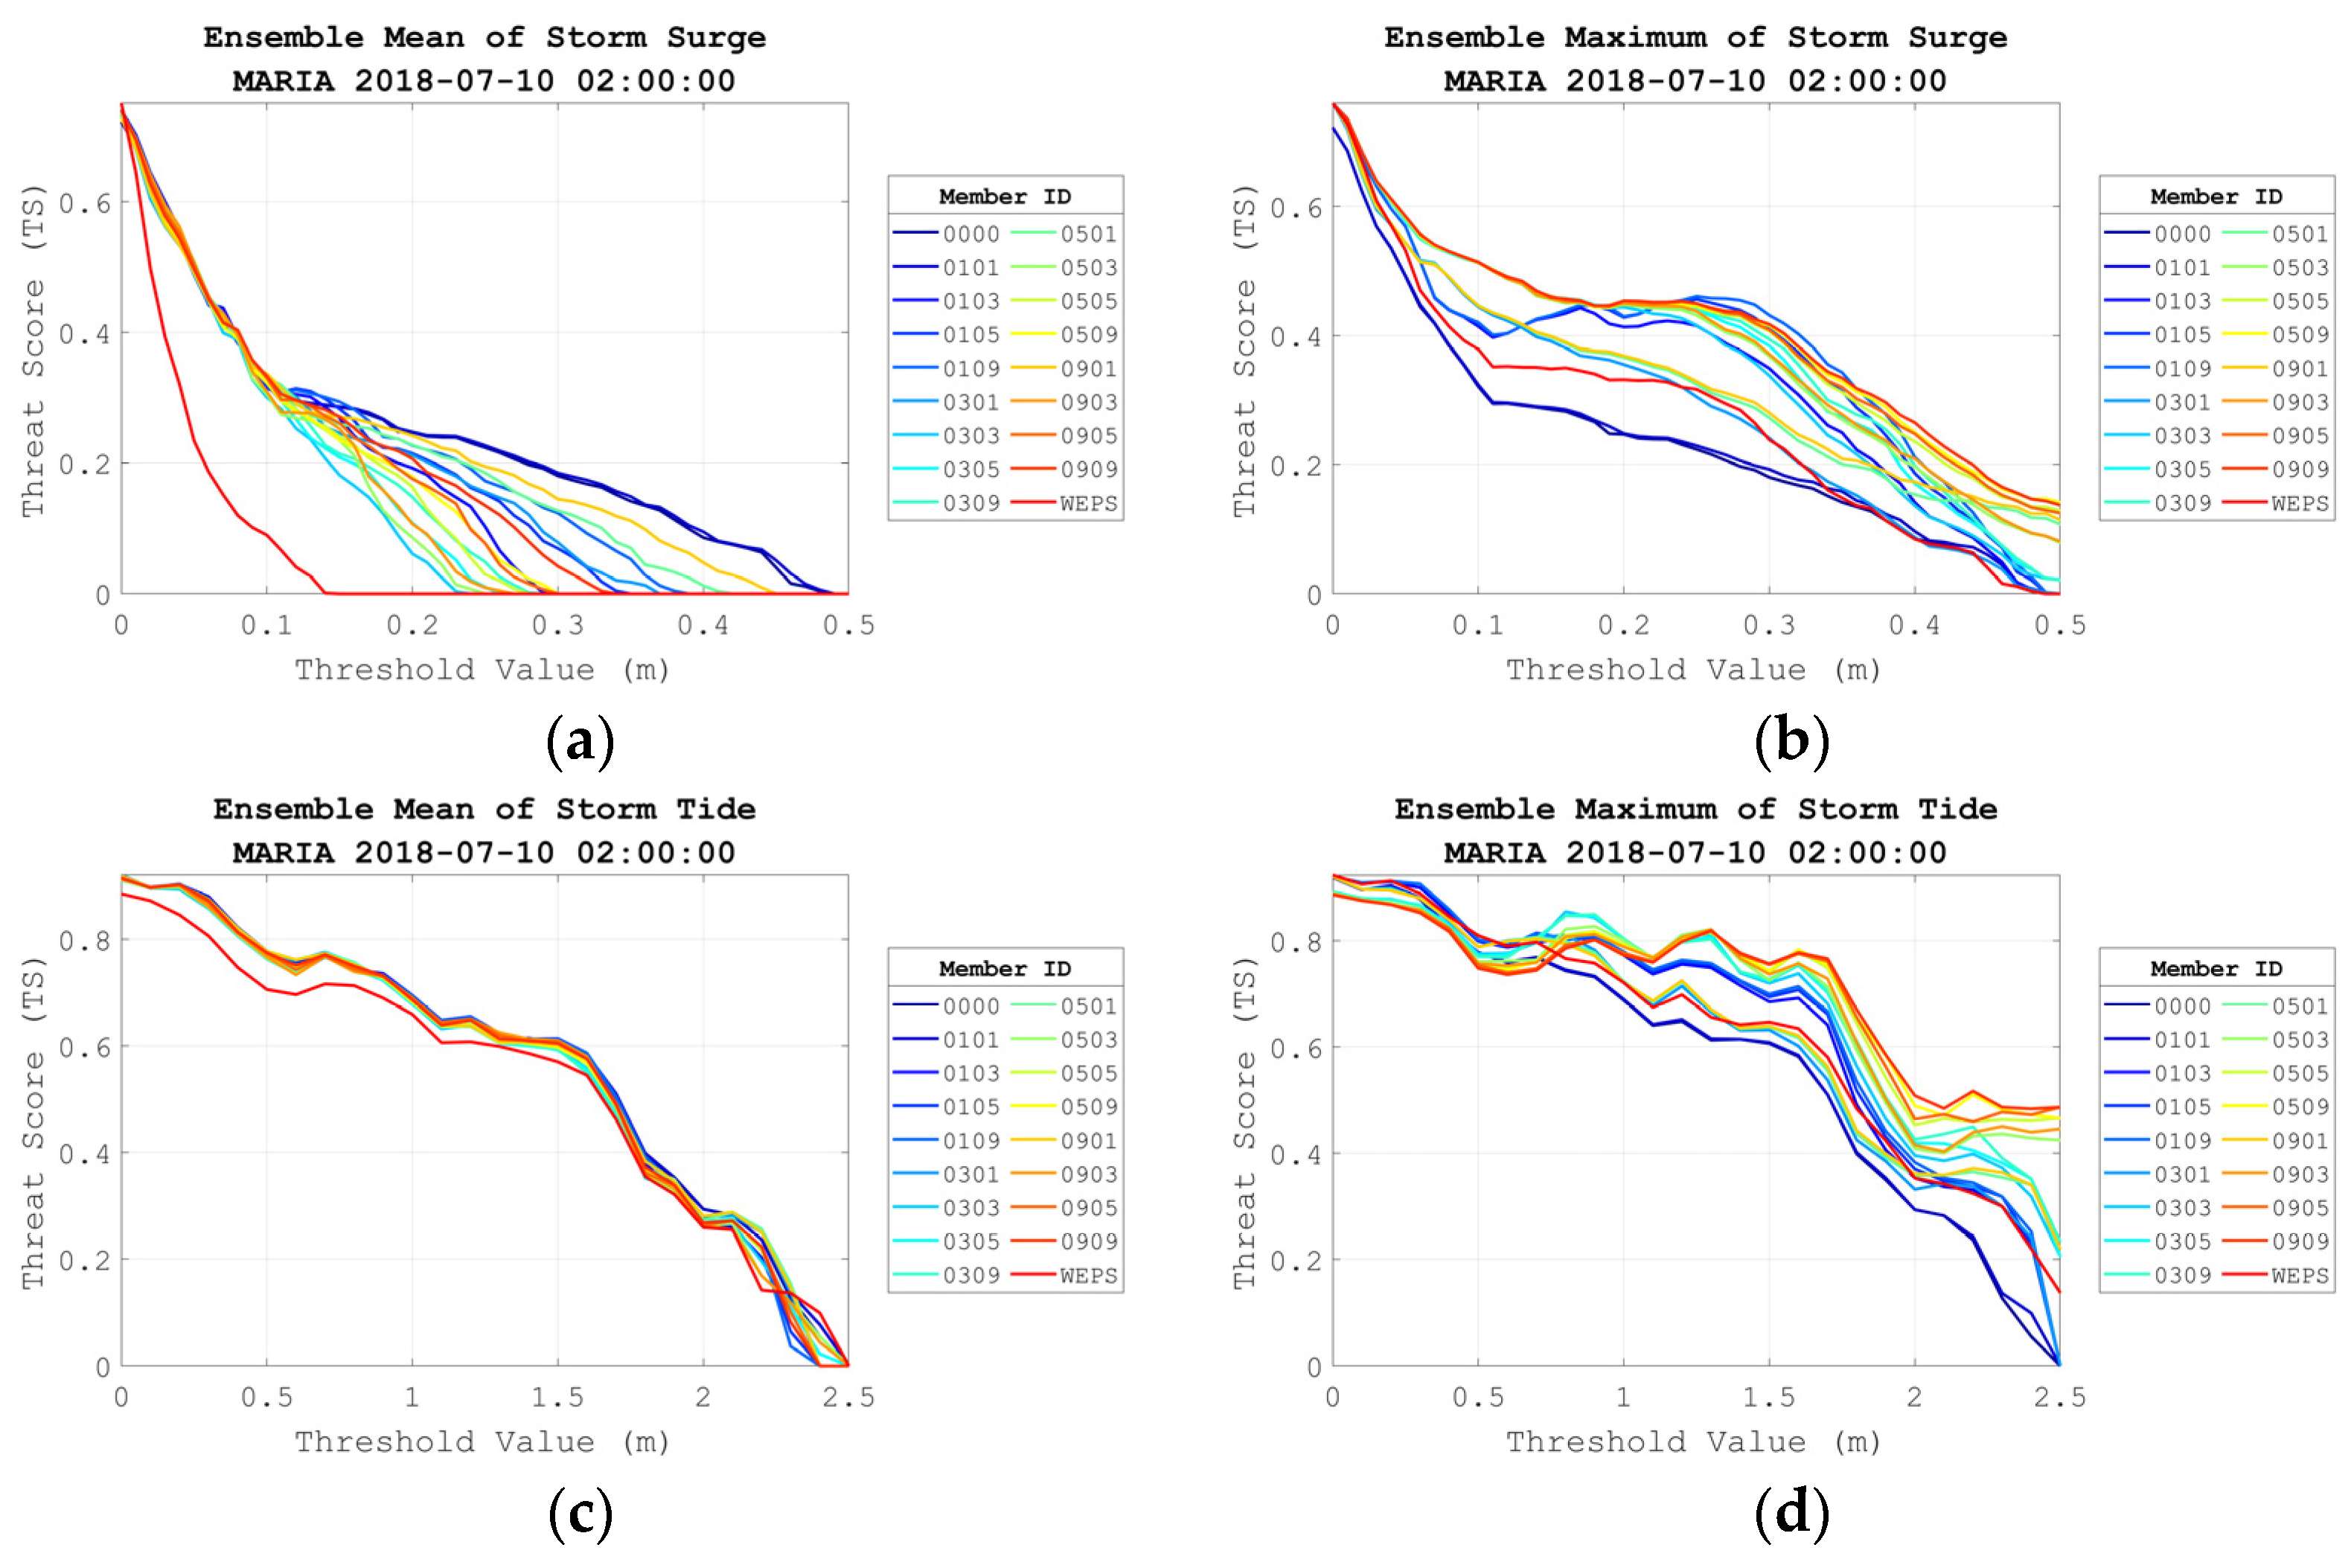
Four methods are used to quantitatively evaluate the accuracy of the ensemble models, including Probability of Detection (POD), Probability of False Detection (POFD), Threat Score (T.S.), and Bias Score (B.S.). The evaluation objects are the ensemble mean, maximum value of both storm surge and storm tide. The evaluation standard for the predicted storm tide is the observed free surface elevation, while the evaluation standard corresponding to the surge component is the residual obtained by subtracting the tidal component from the observed water level. The horizontal axis indicates the threshold of the dichotomous forecast verification method (Appendix A, [35]), which ranges from 0.0 to 0.5 m for storm surge evaluation and 0.0 to 2.5 m for storm tide evaluation. The colored lines represent the evaluated values of ensembles of different compositions. The 4-digit number indicates the composition of an ensemble, where the first two digits indicate the number of CTE members considered, the last two digits indicate the number of ATE members, and WEPS stands for the 20-member WEPS ensemble. The number of members in the EDF ensembles is the product of the number of CTEs and ATEs considered.
In the POD plot of all ensembles means of storm surge (Figure 13a), the EDF ensembles perform similarly when the threshold is less than 0.1 m. The 0101 group has the best overall performance thresholds. At the same time, WEPS shows the weakest performance, and its POD reaches zero when the threshold is 0.15 m. The 0101 shows a non-zero value until the threshold reaches 0.45 m, meaning that there should be observations above 0.45 m. Furthermore, it implies that the ensemble means of WEPS may underestimate the storm surges during this forecast, causing the POD curve to be lower than the EDF ensembles. The POD distribution of the ensemble maximum surges (Figure 13b) shows that the EDF ensembles, considering more members, may have a chance to obtain a higher POD value, and the ensembles with more than 45 members share good and similar performance in this forecast. At the same time, the performance of WEPS and 0101 is relatively low. These characteristics can also be found in the ensemble maximum of the storm tides (Figure 13d). All ensembles perform similarly when evaluating the ensemble mean storm tide (Figure 13c). Since the storm tide is mainly composed of tidal components, and the tidal components do not change with the ensemble simulation, resulting in a similar trend performance.
Figure 14a shows that in the POFD plot of all ensembles means of storm surges, WEPS has the lowest POFD distribution, indicating the best performance. The POFD of the EDF ensembles is similar. These characteristics also appear in the POFD distribution of the ensemble mean storm surges of all ensemble sets (Figure 14c). For the POFD of the maximum storm surge (Figure 14b), the performance of the 0101 and WEPS members is comparable and better than other ensemble sets, where their POFD approaches zero when the threshold is above 0.1 m. The POFD tends to be higher when the number of ensemble members exceeds 20 due to more false alarm predictions from the members. For the set of 0909 members, the POFD distribution remains above 0.1 for all threshold ranges considered in this plot. The POFD distribution of the ensemble maximum storm surges of all ensemble sets is divided into three groups (Figure 14d). The first group includes 0101 and WEPS, which have the lowest POFD distribution and show the best performance among the others. Another group consists of ensembles that consider only one CTE/ATE member in the EDF method, and their POFD distributes between the other two groups. The other has the rest of the ensemble sets.
The distribution pattern of the T.S. plot of the storm surge ensemble mean (Figure 15a) is roughly the same as the POD plot (Figure 13a), with the 0101 members performing best. In contrast, the WEPS members could be more satisfactory. From the T.S. distribution of the ensemble maximum storm surges (Figure 15b), it can be seen that most of the EDF ensemble sets can achieve T.S. between 0.3 and 0.4 m when the threshold is between 0.2 and 0.4 m, except for some ensembles whose total number of members is less than ten, or the ensemble sets consider only one member in ATE. When the threshold is above 0.4 m, the groups with more members are more likely to provide higher T.S.s than the others. WEPS initially shows comparable T.S. to 0101 when the threshold is less than 0.3 m. However, it approaches zero when the threshold is above 0.4 m, which will likely cause WEPS to underestimate results, resulting in no sample being included. When evaluating the ensemble mean of storm surges (Figure 15c), all ensembles have identical performance, and the plot is almost the same as the corresponding POD plot. The false alarm distribution is similar in all ensemble sets, so it does not make a significant difference in the calculation of T.S. For the ensemble maximum storm surge, Figure 15d shows that all ensemble sets have comparable performance when the threshold is less than 0.5 m. Once the threshold is above 1.0 m, the ensemble with more members can get higher T.S.
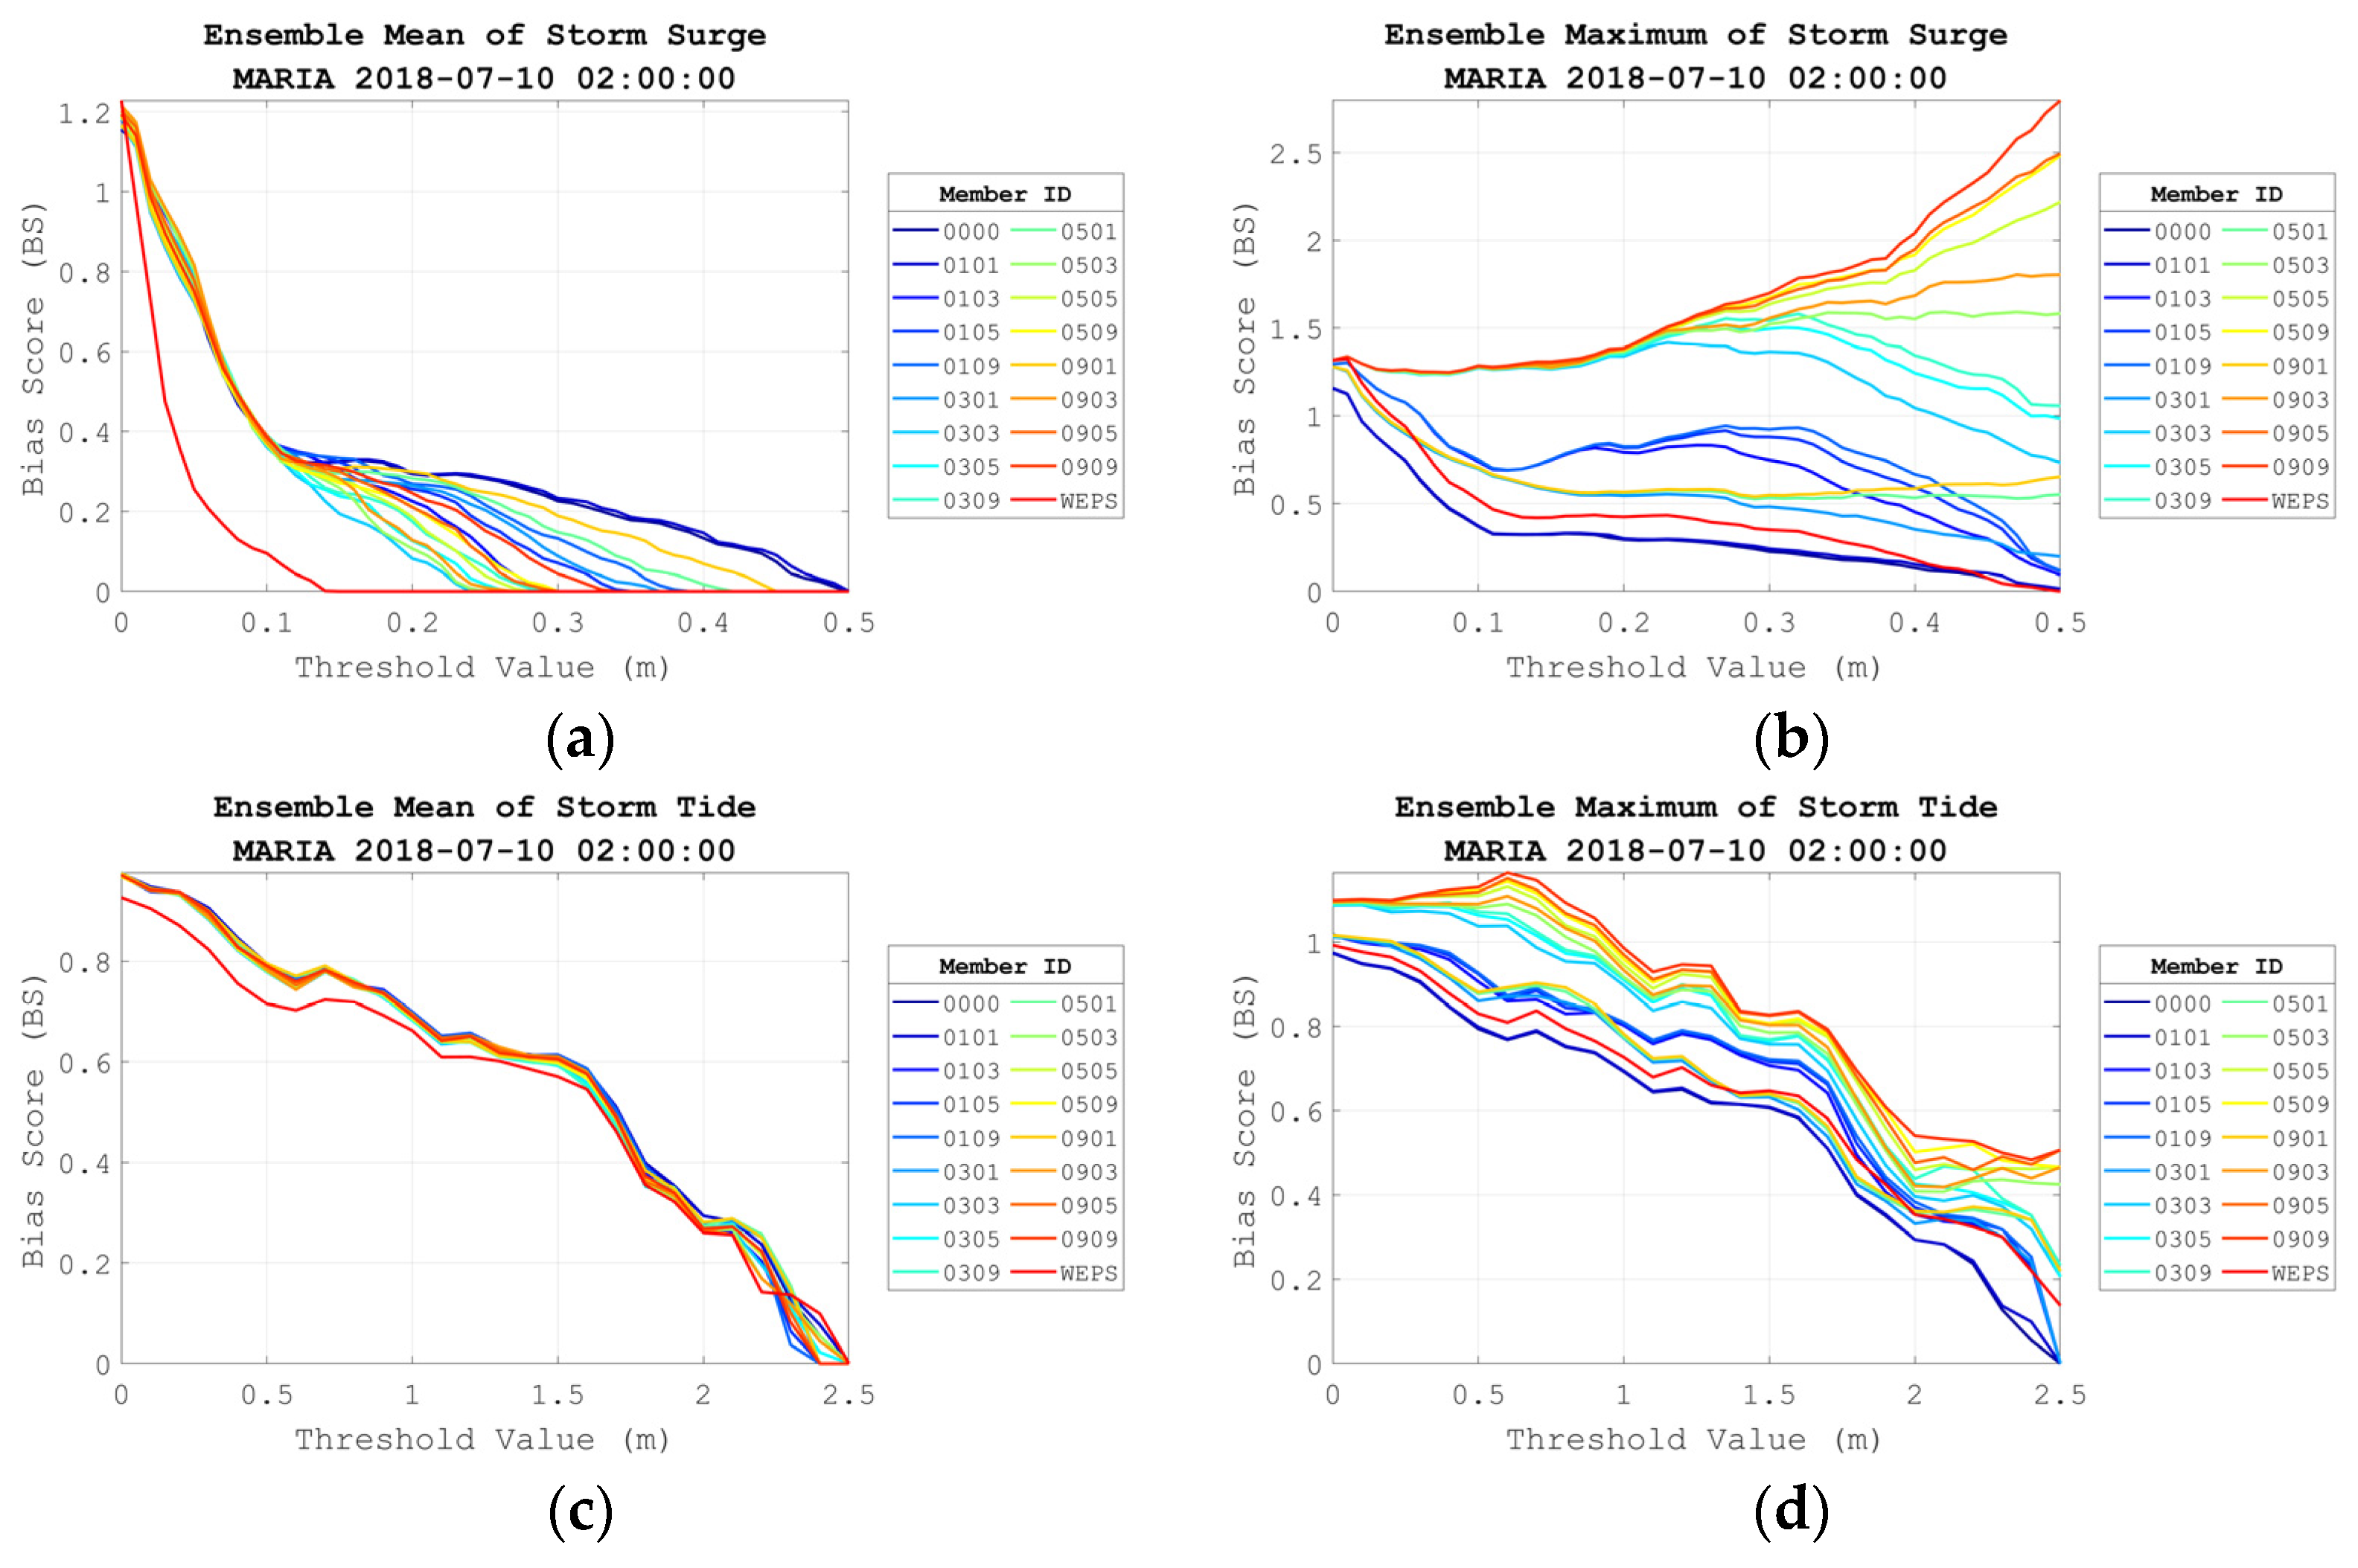
Regarding the biases of the ensemble mean, all ensembles tend to underpredict storm surges (Figure 16a) and storm tides (Figure 16b). Regarding the ensemble maximum, WEPS and 0101 give the lowest B.S. distributions in predicting surges and tides. The EDF ensembles, which include only one member in the CTE/ATE, provide underestimated forecasts in predicting surges. When the number of EDF ensembles exceeds ten, there is generally an overprediction of storm surges, as shown in (Figure 16c,d).
From all the statistical evaluations mentioned above, the WEPS ensemble should have an excellent ability to forecast storm surges since it has the advantage of considering not only the perturbation of the atmospheric model, but also the uncertainty of both tracks and intensities. Unfortunately, its performance could be better than the EDF ensembles or comparable to the adjusted deterministic track. This situation may be understandable because there are still challenges to overcome in the development of atmospheric models. For example, a mesoscale meteorological model underestimates a typhoon’s maximum sustained winds and pressure drop when a large grid size is used [36].

3.5. Computational Efficiency

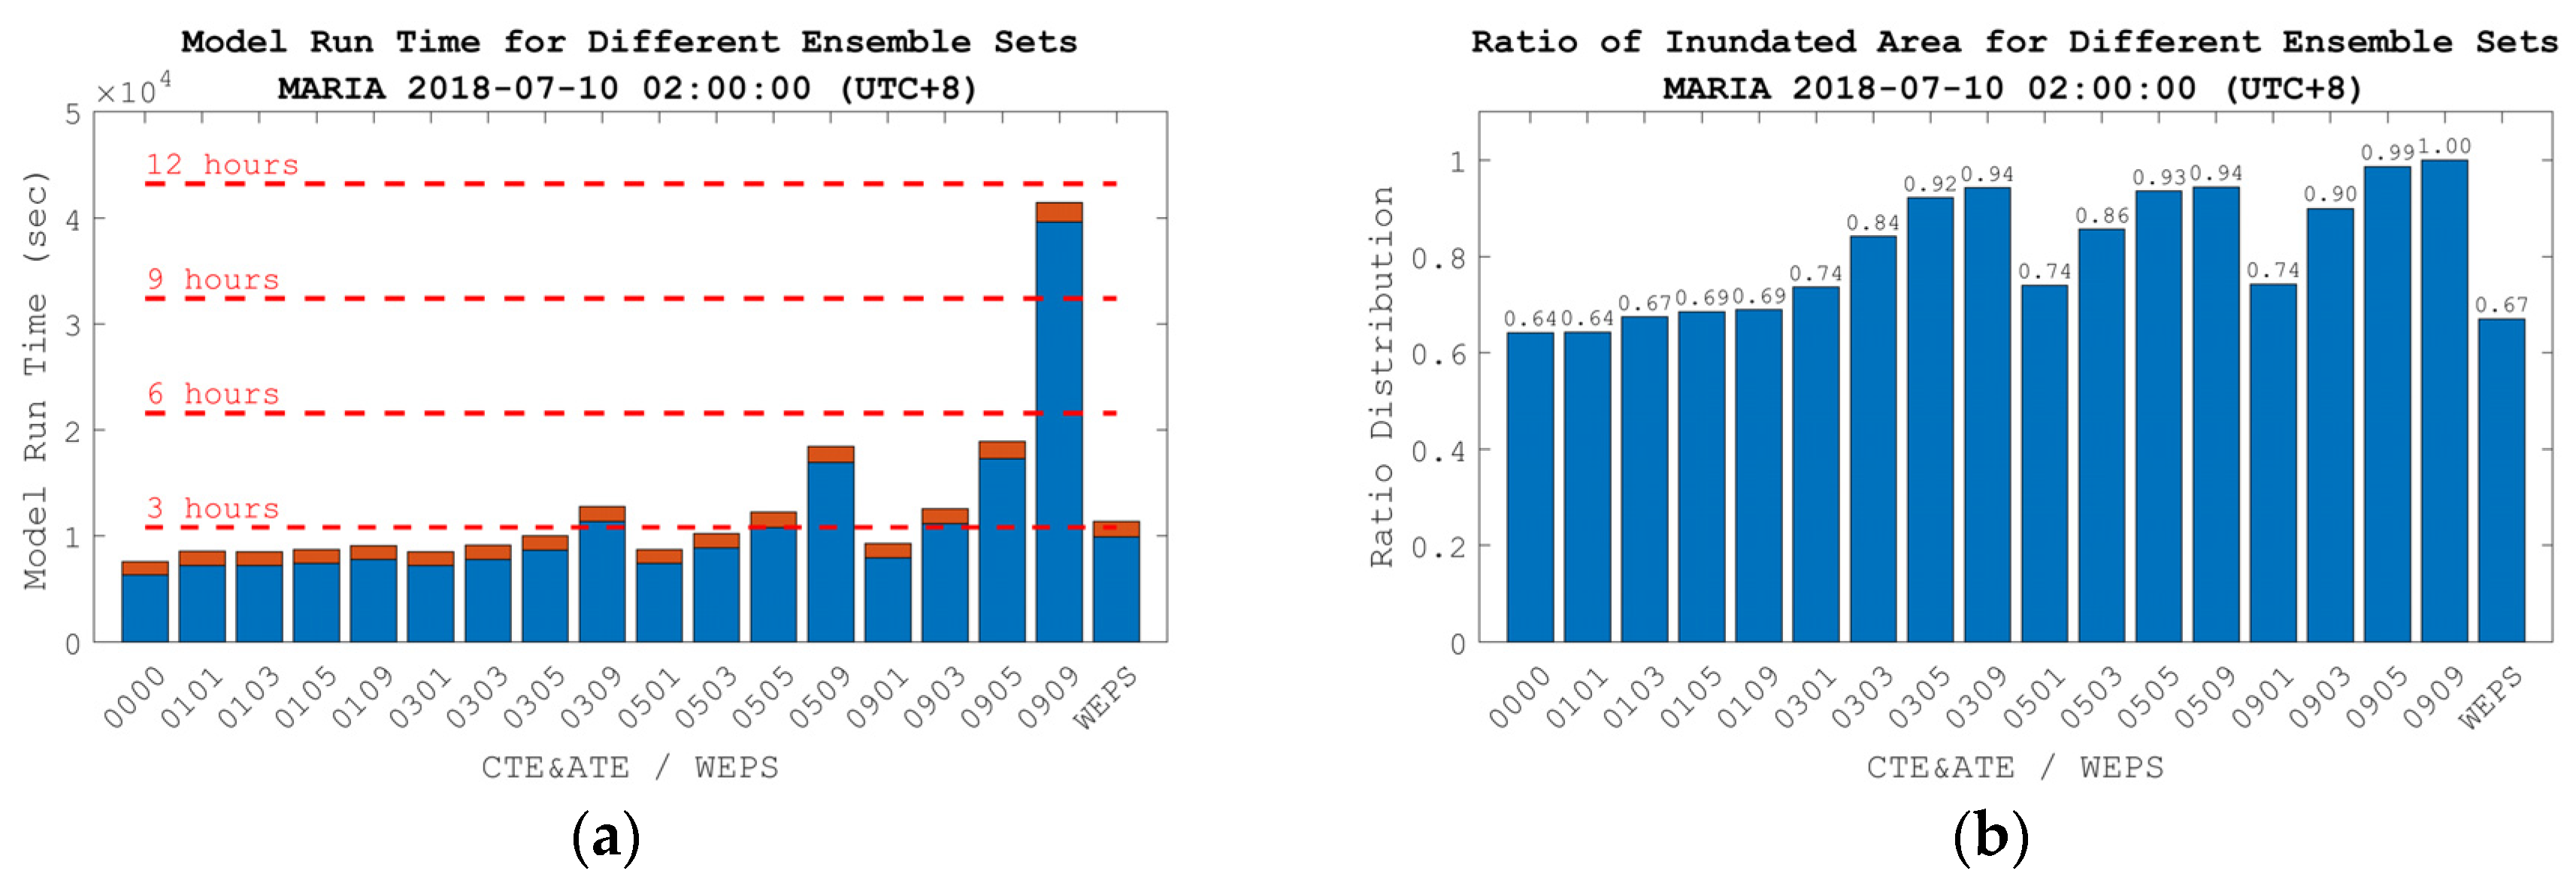
The computational time required for the different ensembles is recorded and shown in Figure 17a. The horizontal axis is the ensemble composition, and the vertical axis is the simulation time in seconds. The blue bars indicate the time required for the kernel computation, the red bars indicate the time needed for the product output, and the red dotted line marks the position of 3, 6, and 9 h, respectively, to facilitate graphical reading. The computation time is mainly affected by the number of members of the ensembles, and the influence of changing the tracks is relatively insignificant. For example, when the ensemble set with 81 members is simulated, it takes about 9 h to complete the forecast and product output. When the number of members is more than 40 sets in the ensemble, the system prediction takes about 5 h, while the rest of the sets with several members less than 30 can complete the forecast around or within 3 h. The system prediction takes about 2 h when only a single ensemble member is simulated, the minimum requirement for performing a prediction.
The original COMCOT model can simulate the coastal inundation induced by tsunamis with the nonlinear shallow water wave equations and moving boundary schemes [37]. The simulated inundation results are used to objectively evaluate whether the composition of different members of the ensembles has fully considered the threat of inundation in the coastal areas of Taiwan. The primary purpose of selecting the flood amount provided by the model for the forecast completeness assessment is to evaluate the difference in results produced by the different ensemble sets. Therefore, an assessment method that can only make judgments by relying on the model is adopted. The inundated volume ratio (IVR) in this study is defined as follows:
V = 1 V max n = 1 N A n H n
where V is the inundated volume ratio, and V max is the maximum inundated volume during the forecast among all comparing ensembles, normalizing the inundated amount from others. N is the number of inundated grids, A n is the area of the inundated cell, and H n is the maximum inundation height the cell experienced during the ensemble forecast.
Figure 17b shows the distribution of the inundated volume ratio corresponding to the ensembles. The horizontal axis indicates the composition of the ensembles, and the vertical axis is the normalized inundated volume ratio during the forecast. When calculating the ensemble forecast coastal inundation volume in the study, we assume that the forecast result obtained by the ensemble with the most members has the chance to have complete considerations. By normalizing the inundated volume, the ratio, which ranges from 0 to 1, can then be used as a standard for evaluating the completeness of the ensemble forecast. The figure shows that the inundated volume ratio of WEPS and 0101 is below 0.7, the lowest of all the ensembles. The number of ensemble members and the inundated volume ratio for the EDF ensembles are positively correlated but not directly related. When an ensemble considers several CTE members and one ATE member, the inundated volume ratio will be higher than those considering only one CTE member and several ATE members. When the total number of members exceeds 20, the inundated volume ratio can reach 0.89 or more.
By cross-comparing the plots of model run time and inundation volume ratio of all ensemble sets, we see that the 0505 and 0303 can have a relatively efficient performance in both computational requirements and completeness of inundation assessment.

4. Conclusions

This study aims to develop the operational probabilistic storm surge forecast system with the parametric wind field, provide two methods for ensemble generation, and compare their performance. The storm surge model solves nonlinear shallow water equations in the nested-grid scheme. For the generation of ensemble members, one is derived from the Weather Ensemble Prediction System (WEPS) operated by CWB, and the other is derived from the calculation of the error distribution of the deterministic forecasts (EDF).
The simulated time-history free surface elevation of each gauge station obtained by the ensembles shows that the envelope obtained by the EDF method (0505) is 80% to 150% more significant in storm surge than the ones obtained by WEPS. For the time range where surge is significant, results from the EDF method extend from 33% to 100% longer than WEPS. Similar results can be observed in the two-dimensional forecast products. This result indicates that the ensemble produced by the EDF method covers the possibility of typhoons hitting Taiwan.
From the statistical evaluation, the maximum forecast value of storm surges obtained from the WEPS track performs similarly to the single-track members. However, it still needs improvement compared to other ensemble sets from the EDF method.
The underestimated maximum sustained winds and pressure drop in the mesoscale WRF model may be one of the reasons. The idealized wind model is used in the current research, which may result in affecting the superiority of the WRF model, that supposed to reflect the influence of the sea-land boundary or complex topography on the typhoon structure. The above reasons may lead to the model’s limitations in predicting storm surges. Initial verification results suggest that EDF could provide a more powerful reminder to the coastal region for disaster prevention, even considering more than one track can perform better in statistical evaluations than deterministic forecasts.
This study proposes a computational efficiency evaluation after analyzing different sets to evaluate the composition of the best ensemble members of the ensemble forecasting system to meet the forecast timeliness. The computational resources at this stage allow us to perform the ensemble prediction under 45 members to operate four times a day, or less than 20 members to operate eight times a day. The flooded volume ratio caused by the storm surge in the model is used to consider the completeness of the ensemble forecasts. From the case analysis, it can be seen that the flooded volume ratio of a single member or WEPS member is equivalent and lower than 0.7. For the ensembles generated by the EDF method, the flooded volume ratio also increases as the number of members increases. However, the increased ratio is independent of the total number of ensemble members. Therefore, when the total number of members reaches more than 20, the obtained model prediction results have a certain degree of completeness that the flooded volume ratio reaches 0.9 and more.
A single case analysis should not summarize the consistent features of the ensemble generation method. Therefore, the two ensemble generation methods will be operated in parallel to provide a complete reference for forecasters. In addition, further research and comparison of ensemble forecasting methods will be conducted when more typhoon events occur. Moreover, to improve the coupling between the storm surge ensemble forecast and the mesoscale meteorological model, it will be essential to improve the meteorological field input to make it more consistent with the actual strength or structure of a typhoon.
In addition to considering the ensembles of track divergence, the typhoon’s intensity can also be applied to the EDF method by considering parameters, such as size, lowest central pressure, and maximum wind speed. However, as more factors are considered, the number of ensemble members at the power level increases. In addition, there is a nonlinear relationship between the parameters related to the intensity, so how to determine the parameter combination of the typhoon intensity is reasonable, or how to simplify the typhoon intensity in the ensemble consideration, still needs further research and discussion.

Author Contributions

Conceptualization, C.-W.L. and T.-R.W.; methodology, C.-W.L. and Y.-L.T.; software, C.-W.L. and Y.-L.T.; validation, C.-W.L.; formal analysis, C.-W.L. and S.-C.C.; investigation, C.-W.L. and S.-C.C.; resources, C.-H.C. and C.-T.T.; data curation, C.-H.C. and C.-T.T.; writing—original draft preparation, C.-W.L.; writing—review and editing, T.-R.W. and Y.-L.T.; visualization, C.-W.L. and S.-C.C.; supervision, T.-R.W.; project administration, T.-R.W. and C.-T.T.; funding acquisition, T.-R.W. and C.-T.T. All authors have read and agreed to the published version of the manuscript.

Funding

This research was funded by the Central Weather Bureau, grant number “1092042D”.

Institutional Review Board Statement

Not applicable.

Informed Consent Statement

Not applicable.

Data Availability Statement

Restrictions apply to the availability of these data. Data was obtained from the Central Weather Bureau and are available from the authors with the permission of the Central Weather Bureau.

Acknowledgments

Tide gauge observation and technical support provided by the Marine Meteorological Center of CWB and the Meteorological Information Center of CWB are much appreciated.

Conflicts of Interest

The authors declare no conflict of interest. The funders had no role in the design of the study; in the collection, analyses, or interpretation of data; in the writing of the manuscript; or in the decision to publish the results.

Appendix A

This study used the dichotomous (yes/no) forecasts verification method of the World Weather Research Programme/Working Group on Numerical Experimentation (WWRP/WGNE) Joint Working Group on Forecast Verification Research [35]. All pairs of predicted and observed values are divided into four categories, as shown in Table A1, the joint distribution are hits, false alarms, misses, and correct negatives, respectively. According to the contingency tables, four evaluation standards or indices can be calculated to verify the storm surge forecasts.
Table A1. Contingency table.
Observed
YesNoTotal
ForecastYesHitsFalse alarmsForecast yes
NoMissesCorrect negativesForecast no
TotalObserved yesObserved noTotal
  • Probability of Detection (POD)
The probability of detection describes the proportion of events that actually occurred and how many events are correctly predicted. It can be calculated by the parameters of the contingency table as follows:
POD = Hits/(Hits + Misses)
The value range is between 0 and 1, and the best value is 1. Since this value only considers the hits and does not consider the false alarms, its forecast value will be higher when applied to rare cases, so it must be combined with the false alarm rate and the threat score as a reference.
2
Probability of false detection (POFD)
The probability of false detection is also known as a false alarm rate, which describes what percentage of the events that did not occur in observation, yet the forecast provides a prediction over the threshold value. It can be calculated using the parameters of the contingency table as follows:
POFD = False alarms/(False alarms + Correct negatives)
The value range is between 0 and 1, and the perfect score should be zero.
3
Threat Score (T.S.)
The threat score excludes the correct negatives, so it can be regarded as the accuracy of the model forecast, which only concerns the forecasts that count. The score can be calculated by the parameters of the contingency table as follows:
TS = Hits/(Hits + Misses + False alarms)
The value range is between 0 and 1. The larger value indicates the higher the accuracy of the model, while 0 indicates no skill for the performance.
4
Bias Score (B.S.)
The bias score describes the ratio of forecast hits to observation hits, and can be calculated using the parameters in the contingency table as follows:
BS = (Hits + False alarms)/(Hits + Misses)
The value range is between 0 and ∞. If it is greater than 1, it means over-forecasting, less than one means under-forecasting, and the best value is 1. This value only represents the relative relationship between forecast and observation and cannot be used to describe how close the forecast result is to the observation.

References

  1. Kohno, N.; Dube, S.K.; Entel, M.; Fakhruddin, S.H.M.; Greenslade, D.; Leroux, M.D.; Rhome, J.; Thuy, N.B. Recent Progress in Storm Surge Forecasting. Trop. Cyclone Res. Rev. 2018, 7, 128–139. [Google Scholar] [CrossRef]
  2. Huang, W.-K.; Wang, J.-J. Typhoon damage assessment model and analysis in Taiwan. Nat. Hazards 2015, 79, 497–510. [Google Scholar] [CrossRef]
  3. Yu, Y.-C.; Chen, H.; Shih, H.-J.; Chang, C.-H.; Hsiao, S.-C.; Chen, W.-B.; Chen, Y.-M.; Su, W.-R.; Lin, L.-Y. Assessing the Potential Highest Storm Tide Hazard in Taiwan Based on 40-Year Historical Typhoon Surge Hindcasting. Atmosphere 2019, 10, 346. [Google Scholar] [CrossRef]
  4. Hsiao, L.-F.; Chen, D.S.; Hong, J.S.; Yeh, T.C.; Fong, C.T. Improvement of the Numerical Tropical Cyclone Prediction System at the Central Weather Bureau of Taiwan: TWRF (Typhoon WRF). Atmosphere 2020, 11, 657. [Google Scholar] [CrossRef]
  5. Molteni, F.; Buizza, R.; Palmer, T.N.; Petroliagis, T. The Ecmwf Ensemble Prediction System: Methodology and Validation. Q. J. R. Meteorol. Soc. 1996, 122, 73–119. [Google Scholar] [CrossRef]
  6. Mel, R.; Lionello, P. Storm Surge Ensemble Prediction for the City of Venice. Weather Forecast. 2014, 29, 1044–1057. [Google Scholar] [CrossRef]
  7. Kristensen, N.M.; Røed, L.P.; Sætra, Ø. A forecasting and warning system of storm surge events along the Norwegian coast. Environ. Fluid Mech. 2022, 23, 307–329. [Google Scholar] [CrossRef]
  8. Flowerdew, J.; Horsburgh, K.; Wilson, C.; Mylne, K. Development and Evaluation of an Ensemble Forecasting System for Coastal Storm Surges. Q. J. R. Meteorol. Soc. 2010, 136, 1444–1456. [Google Scholar] [CrossRef]
  9. Bernier, N.B.; Thompson, K.R. Deterministic and Ensemble Storm Surge Prediction for Atlantic Canada with Lead Times of Hours to Ten Days. Ocean Model. 2015, 86, 114–127. [Google Scholar] [CrossRef]
  10. Cavaleri, L.; Sclavo, M. The calibration of wind and wave model data in the Mediterranean Sea. Coast. Eng. 2006, 53, 613–627. [Google Scholar] [CrossRef]
  11. Signell, R.P.; Carniel, S.; Cavaleri, L.; Chiggiato, J.; Doyle, J.D.; Pullen, J.; Sclavo, M. Assessment of wind quality for oceanographic modelling in semi-enclosed basins. J. Mar. Syst. 2005, 53, 217–233. [Google Scholar] [CrossRef]
  12. Taylor, A.A.; Glahn, B. Probabilistic Guidance for Hurricane Storm Surge. In Proceedings of the 19th Conference on Probability and Statistics, New Orleans, LA, USA, 21 January 2008; Volume 74. [Google Scholar]
  13. Pan, Y.; Chen, Y.P.; Li, J.X.; Ding, X.L. Improvement of wind field hindcasts for tropical cyclones. Water Sci. Eng. 2016, 9, 58–66. [Google Scholar] [CrossRef]
  14. Hasegawa, H.; Kohno, N.; Higaki, M.; Itoh, M. Upgrade of JMA’s storm surge prediction for the WMO Storm Surge Watch Scheme (SSWS). Tech. Rev. 2017, 19, 1–9. [Google Scholar]
  15. Bode, L.; Hardy, T.A. Progress and Recent Developments in Storm Surge Modeling. J. Hydraul. Eng. 1997, 123, 315–331. [Google Scholar] [CrossRef]
  16. Wang, X. User Manual for Comcot Version 1.7 (First Draft); Cornel University: Ithaca, NY, USA, 2009; Volume 65. [Google Scholar]
  17. Wu, T.R.; Tsai, Y.L.; Terng, C.T. The recent development of storm surge modeling in Taiwan. Procedia IUTAM 2017, 25, 70–73. [Google Scholar] [CrossRef]
  18. Wu, T.R.; Huang, H.C. Modeling Tsunami Hazards from Manila Trench to Taiwan. J. Asian Earth Sci. 2009, 36, 21–28. [Google Scholar] [CrossRef]
  19. Holland, G.J. An Analytic Model of the Wind and Pressure Profiles in Hurricanes. Mon. Weather Rev. 1980, 108, 1212–1218. [Google Scholar] [CrossRef]
  20. Harper, B.; Holland, G. An Updated Parametric Model of the Tropical Cyclone. In Proceedings of the 23rd Conference on Hurricanes and Tropical Meteorology, Dallas, TX, USA, 10–15 January 1999. [Google Scholar]
  21. Arakawa, A.; Lamb, V.R. Computational Design of the Basic Dynamical Processes of the UCLA General Circulation Model. Gen. Circ. Model. Atmos. 1977, 17, 173–265. [Google Scholar]
  22. Egbert, G.D.; Erofeeva, S.Y. Efficient Inverse Modeling of Barotropic Ocean Tides. J. Atmos. Ocean. Technol. 2002, 19, 183–204. [Google Scholar] [CrossRef]
  23. Li, C.H.; Hong, J. The Study of Regional Ensemble Forecast: Evaluation for the Performance of Perturbed Methods. Atmos. Sci. 2014, 42, 153–179, (In Chinese with English Abstract). [Google Scholar]
  24. Li, C.H.; Berner, J.; Hong, J.S.; Fong, C.T.; Kuo, Y.H. The Taiwan WRF Ensemble Prediction System: Scientific Description, Model-Error Representation, and Performance Results. Asia-Pac. J. Atmos. Sci. 2020, 56, 1–15. [Google Scholar] [CrossRef]
  25. Regulation on the Centralized Issuance of Weather Forecasts and Warnings. Available online: https://law.moj.gov.tw/ENG/LawClass/LawAll.aspx?pcode=K0100002 (accessed on 14 March 2023).
  26. Skamarock, W.C.; Klemp, J.B.; Dudhia, J.; Gill, D.O.; Barker, D.M.; Duda, M.G.; Powers, J.G.; Huang, X.Y.; Wang, W. A Description of the Advanced Research WRF Version 3; NCAR Tech. Note NCAR/TN-475+ STR; University Corporation for Atmospheric Research: Boulder, CO, USA, 2008. [Google Scholar]
  27. Anderson, J.L. An Ensemble Adjustment Kalman Filter for Data Assimilation. Mon. Weather Rev. 2001, 129, 2884–2903. [Google Scholar] [CrossRef]
  28. Tsai, Y.L.; Wu, T.R.; Terng, C.T.; Chu, C.H. The Development of Storm Surge Ensemble Forecasting System Combing with Meso-Scale Wrf Model. In Proceedings of the 20th EGU General Assembly, EGU2018, Vienna, Austria, 4–13 April 2018; p. 6594. [Google Scholar]
  29. Leroux, M.-D.; Wood, K.; Elsberry, R.L.; Cayanan, E.O.; Hendricks, E.; Kucas, M.; Otto, P.; Rogers, R.; Sampson, B.; Yu, Z. Recent Advances in Research and Forecasting of Tropical Cyclone Track, Intensity, and Structure at Landfall. Trop. Cyclone Res. Rev. 2018, 7, 85–105. [Google Scholar]
  30. Chen, D.-S.; Hsiao, L.-F.; Xie, J.-H.; Hong, J.-S.; Fong, C.-T.; Yeh, T.-C. Improve Tropical Cyclone Prediction of TWRF with the Application of Advanced Observation Data. In Proceedings of the 22nd EGU General Assembly Conference Abstracts, Online, 4–8 May 2020; p. 4327. [Google Scholar]
  31. Normal Distribution. Available online: https://www.mathworks.com/help/stats/prob.normaldistribution.html (accessed on 14 March 2023).
  32. Location-Scale Distribution. Available online: https://www.mathworks.com/help/stats/t-location-scale-distribution.html (accessed on 14 March 2023).
  33. Logistic Distribution. Available online: https://www.mathworks.com/help/stats/prob.logisticdistribution.html (accessed on 14 March 2023).
  34. Jian, G.-J.; Teng, J.-H.; Wang, S.-T.; Cheng, M.-D.; Cheng, C.-P.; Chen, J.-H.; Chu, Y.-J. An Overview of the Tropical Cyclone Database at the Central Weather Bureau of Taiwan. Terr. Atmos. Ocean. Sci. 2022, 33, 26. [Google Scholar] [CrossRef]
  35. WWRP/WGNE Joint Working Group on Forecast Verification Research. Forecast Verification—Issues, Methods and FAQ. Available online: https://www.cawcr.gov.au/projects/verification/verif_web_page.html (accessed on 14 March 2023).
  36. Davis, C.; Wang, W.; Chen, S.S.; Chen, Y.; Corbosiero, K.; DeMaria, M.; Dudhia, J.; Holland, G.; Klemp, J.; Michalakes, J. Prediction of Landfalling Hurricanes with the Advanced Hurricane Wrf Model. Mon. Weather Rev. 2008, 136, 1990–2005. [Google Scholar] [CrossRef]
  37. Liu, P.L.-F.; Cho, Y.S.; Yoon, S.; Seo, S. Numerical Simulations of the 1960 Chilean Tsunami Propagation and Inundation at Hilo, Hawaii. In Tsunami: Progress in Prediction, Disaster Prevention and Warning; Springer: Berlin/Heidelberg, Germany, 1995; pp. 99–115. [Google Scholar]
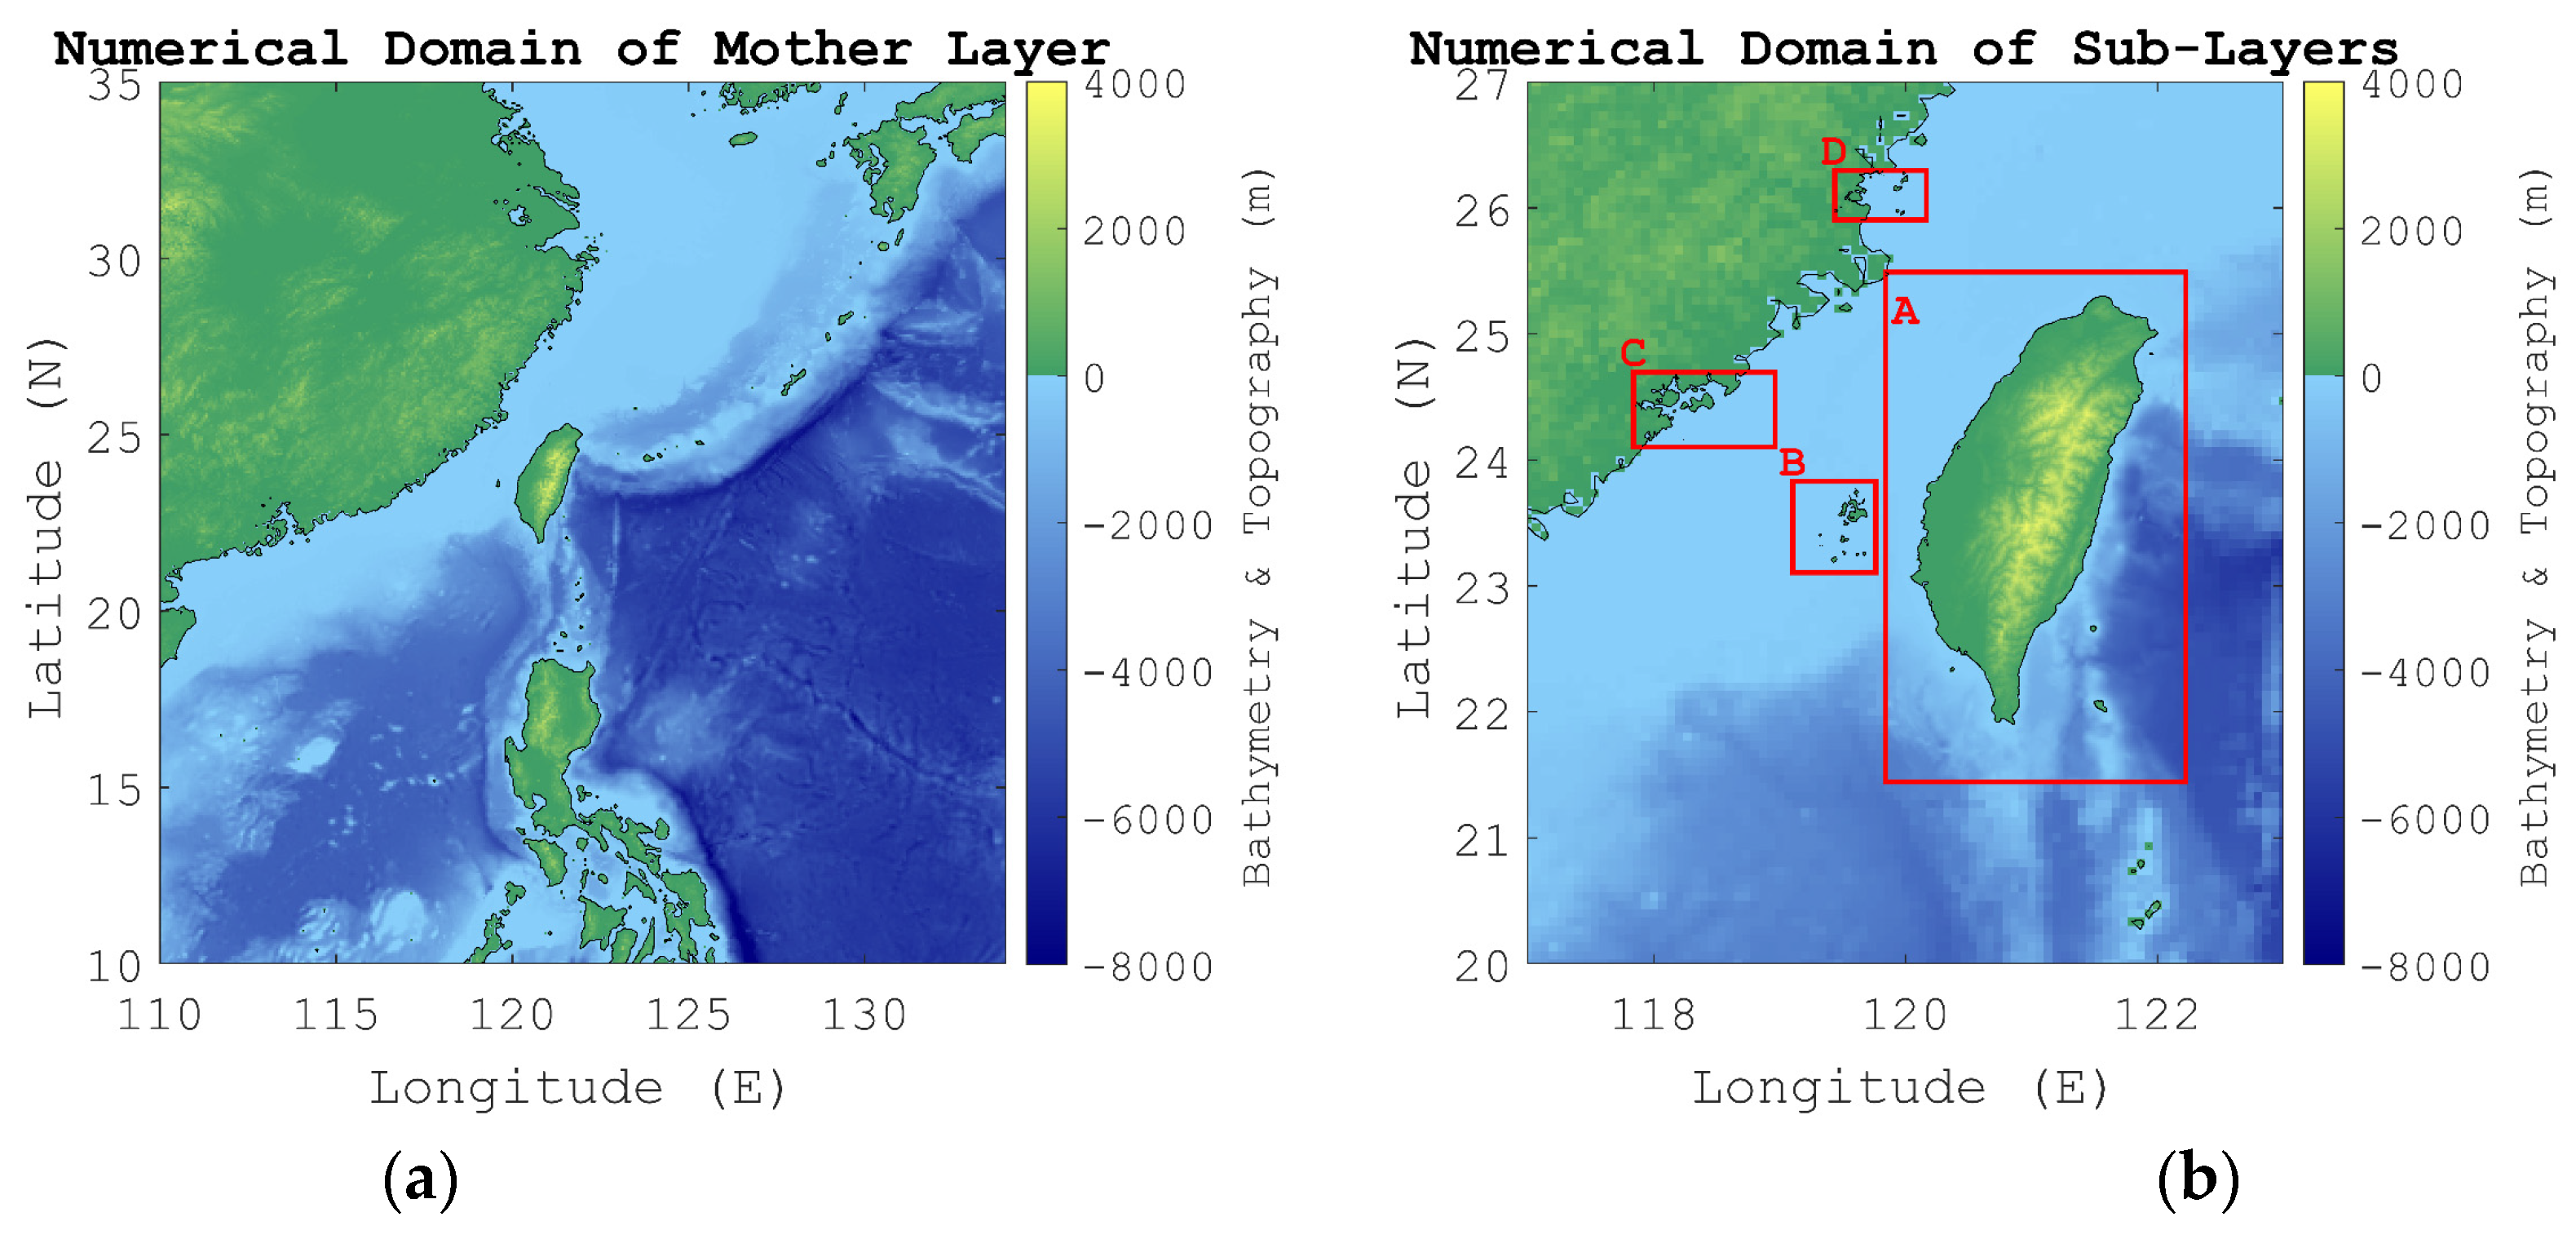
Figure 1. The numerical domain of the model of (a) the mother layer and (b) the sublayers A, B, C and D which details provided in Table 1.
Water 15 01826 g001
Figure 2. Forecast system of numerical tide station location.
Water 15 01826 g002
Figure 3. The distribution of typhoon track errors from 2016 to 2021 and the corresponding distribution fits.
Water 15 01826 g003
Figure 4. A schematic diagram of the generation of ensemble tracks from a PDF. The figure shows the area under the curve is divided into (a) two, (b) four, and (c) six equal parts in sequence with blue, purple and orange lines, respectively. (d) shows the distribution of members of the cluster without duplication from (ac).
Water 15 01826 g004
Figure 5. The best track and intensity of typhoon Maria from the typhoon database of the CWB. The color shows the intensity category defined by CWB with tropical depression in magenta, light intensity in blue, medium in green, and strong in red, respectively. The time is shown in local time (UTC+8).
Water 15 01826 g005
Figure 6. The track distribution of the best track (black), official forecast (blue), and the adjusted track (cyan).
Water 15 01826 g006
Figure 7. Time series storm tide and storm surge. Black circles are observations. Dark blue and light blue lines indicate the results from the official track and the adjusted track, respectively.
Water 15 01826 g007
Figure 8. The track distributions of the ensemble members from (left) WEPS with 20 members in colored lines [23]), and (right) EDF with 25 members in colored lines. The black dot lines in both panels are the best tracks.
Water 15 01826 g008
Figure 9. Time series of ensemble statistical results of storm surge. Black circles are observation. The left shows the statistic results from WEPS, and the right is from EDF, including quartiles, minimum, maximum, and mean of ensembles.
Water 15 01826 g009
Figure 10. Time series of ensemble statistical results of storm tide. Black circles are observation. The left shows the statistic results from WEPS, and the right is from EDF, including quartiles, minimum, maximum, and mean of ensembles.
Water 15 01826 g010
Figure 11. The water elevation distribution of a 10% chance of being exceeded at the 30th forecast hour. The upper panels show the storm surge distributions. The lower panels show the storm tide distributions. The left panels show the results from WEPS. The right panels show the result from EDF.
Water 15 01826 g011
Figure 12. The percent probability distribution of water levels exceeding 0.1 m for storm surge and 1.6 m for storm tide at the 30th forecast hour. The top panels show the storm surge distributions, while the bottom panels show the storm tide distributions. The left panels show results from WEPS, and the right panels are from EDF.
Water 15 01826 g012
Figure 13. The probability of detection of (a) ensemble mean of storm surge, (b) ensemble maximum of storm surge, (c) ensemble mean of storm tide, (d) ensemble maximum value of storm tide. The member ID indicates the composition of an ensemble, where the first two digits show the number of CTE members, and the last two digits show the number of ATE members. WEPS stands for the 20-member WEPS ensemble.
Water 15 01826 g013
Figure 14. The probability of false detection of (a) ensemble mean of storm surge, (b) ensemble maximum of storm surge, (c) ensemble mean of storm tide, (d) ensemble maximum of storm tide. The member ID indicates the composition of an ensemble, the same as Figure 13.
Water 15 01826 g014
Figure 15. The threat score of (a) ensemble means of storm surge, (b) ensemble maximum of storm surge, (c) ensemble means of storm tide, (d) ensemble maximum value of storm tide. The member ID indicates the composition of an ensemble, the same as Figure 13.
Water 15 01826 g015
Figure 16. The bias score of (a) ensemble mean of storm surge, (b) ensemble maximum of storm surge, (c) ensemble mean of storm tide, (d) ensemble maximum of storm tide. The member ID indicates the composition of an ensemble, the same as Figure 13.
Water 15 01826 g016
Figure 17. (a) Model run time for different ensemble sets, and (b) percent inundated area for different ensemble sets for the run initiated at 02:00 local time on 10 July 2018, for Typhoon Maria. The labels on the horizontal axis indicate the composition of the ensemble set.
Water 15 01826 g017
Table 1. The domain region, grid resolution, and the sources of the bathymetry data.
Layer IDRegionResolutionSource
01110.00 E–134.00 E
10.00 N–35.00 N
4 arc minute
(8 km)
ETOPO1
02-A119.80 E–122.25 E
21.40 N–25.50 N
0.5 arc minute
(1 km)
GEBCO 2021
02-B119.09 E–119.80 E
23.05 N–23.89 N
15 arc second
(0.5 km)
GEBCO 2021
02-C117.80 E–118.99 E
24.09 N–24.70 N
15 arc second
(0.5 km)
GEBCO 2021
02-D119.39 E–120.19 E
25.84 N–26.35 N
15 arc second
(0.5 km)
GEBCO 2021
Table 2. The required parameters to recreate the PDF in Figure 3.
TypeForecast HourNormal
Distribution
Logistic
Distribution
T Location-Scale
Distribution
parameter μ σ μ σ μ σ ν
CTE122.46144.9781.44023.7821.09433.8494.473
24−0.99861.019−2.62332.543−3.05047.1084.804
36−1.65476.908−4.21542.352−3.87766.2397.583
482.96499.601−0.65854.746−0.57184.9327.200
ATE12−0.46348.625−2.64326.388−2.98839.5725.772
24−2.66675.400−3.81140.407−4.10958.9294.984
36−6.58897.913−4.55553.688−4.36982.4766.703
48−8.483143.738−1.69277.997−0.682117.5055.997
Table 3. The error members obtained by cutting the area under the T location-scale distribution curve from Figure 4.
TypeForecast HourNumber of Areas
246
CTE (km)121.1−118.6120.8−23.725.9−35.6−14.516.737.8
24−3−164.3158.2−37.431.3−53.7−24.618.547.6
36−3.9−198.3190.5−50.843−72.3−33.625.864.6
48−5.2−253.2252.1−60.959.7−88.6−38.737.687.5
ATE (km)123−129123−31.525.5−44.8−20.91538.8
244.1−202.6194.5−46.938.7−67.2−31.122.859
364.4−254.7246−63.254.4−90.3−41.532.881.6
486.8−369.3369.3−8583.7−124.3−53.952.5123
Disclaimer/Publisher’s Note: The statements, opinions and data contained in all publications are solely those of the individual author(s) and contributor(s) and not of MDPI and/or the editor(s). MDPI and/or the editor(s) disclaim responsibility for any injury to people or property resulting from any ideas, methods, instructions or products referred to in the content.