Article

Analysis of Water Infiltration Characteristics and Hydraulic Parameters of Sierozem Soil under Humic Acid Addition

1
School of Geography and Planning, Ningxia University, Yinchuan 750021, China
2
Breeding Base for State Key Lab of Land Degradation and Ecological Restoration in Northwestern China, Ningxia University, Yinchuan 750021, China
3
School of Ecology and Environment, Ningxia University, Yinchuan 750021, China
*
Author to whom correspondence should be addressed.
Water 2023, 15(10), 1915; https://doi.org/10.3390/w15101915
Submission received: 8 March 2023 / Revised: 4 May 2023 / Accepted: 11 May 2023 / Published: 18 May 2023
(This article belongs to the Section Soil and Water)

Abstract

:
The farmland in Yinchuan is composed of sierozem soil, which is characterized by high sand content and low organic matter content, resulting in poor water-holding capacity and weak soil structure. Humic acid is a natural organic polymer soil amendment. It is critical to study how humic acid affects soil water infiltration in sierozem soil at the microlevel. A one-dimensional vertical infiltration experiment was conducted to explore how adding different amounts of humic acid (0, 1%, 2%, 3% and 4%) affected the infiltration characteristics and hydraulic parameters of the sierozem soil. The results revealed that the wetting front and cumulative infiltration decreased with the increase in humic acid addition. When the infiltration time was 90 min, the wetting front of the 1%, 2%, 3% and 4% treatments was 6.50%, 10.00%, 15.00% and 21.00% lower than CK (0 for CK), and the cumulative infiltration volume was 4.50%, 11.14%, 18.42% and 23.60% lower than CK, respectively. Among the three infiltration models created by Philip, Horton and Kostiakov, the Kostiakov model (R2 > 0.95) could more accurately describe the soil water infiltration process in the study area. After infiltration, the moisture content of each soil layer increased with the increase in humic acid, which improved the water-holding capacity of the sierozem soil. Using Hydrus-1D to calculate soil hydraulic parameters, we found that the humic acid addition affected the hydraulic parameters. With the increase in the amount of humic acid addition, the retention water content θr and saturated water θs were positively correlated with the humic acid addition amount and negatively correlated with the saturated water conductivity Ks and the reciprocal of air-entry α. The results showed that humic acid could increase the water-holding capacity of soil and improve the rapid water loss and poor water-holding capacity of sierozem soil.

1. Introduction

Infiltration is a process in which water penetrates the soil surface, reaching the soil interior. The infiltration performance determines the amount of water entering the soil profile from the surface and the distribution of water [1,2]. The soil water infiltration process was easily affected by soil properties and structure [3]. As a polymer–organic natural soil improvement agent of polymer, humic acid is widely found in soil and water. Humic acid shows strong hydrophilicity [4], cation exchange capacity [5], and complexation ability and adsorption dispersing ability [6], which affects the volume density, porosity, aggregation and hydraulic properties of the soil. Studies have shown that humic acid can influence the number of soil aggregates and their stabilities, and affect the properties and structure of the soil [7].
Some scholars established the influence of the addition of humic acid on soil physical properties based on different soil textures. For example, in Turkey, Amrakh et al. [8] found that humic acid reduced the final infiltration rate in sandy loam soils. In Czechoslovakia in Central Europe, Magdalena et al. [9] showed that soils with a higher clay fraction content contain greater amounts of humic acid. In Yangling, China, He et al. [10] used orthogonal experiments to prove that humic acid had the more obvious effect on the wetting front of clay loam soil compared with the soil bulk density and initial soil water content. The above studies provided a detailed analysis of the water characteristics with humic acid under different soil textures, which was very important for the study of soil water transport law under humic acid addition.
However, the hydrologic variables of humic acid in different soil types changed significantly, and the relationship between factors was complex, which was difficult to monitor dynamically [11]. Therefore, it is necessary to simplify these relationships, and indirectly studying and describing different soil water transport characteristics and hydraulic parameters in different regions through a soil hydrodynamic model has attracted attention from many scholars. Infiltration models based on physical (Philips [12]), semi-empirical (Horton [13]) or empirical models (Kostiakov [14]) were commonly used. The selection of the most appropriate model depends on the data collected. For example, in the Shandong coastal saline area, China, Li et al. [15] revealed that the soil moisture content increased with the increase in humic acid addition using a one-dimensional vertical infiltration experiment, while Philip’s model and algebraic model described the water infiltration characteristics under the condition of humic acid. In Shaanxi farmland [16], humic acid could significantly improve the infiltration capacity of the soil and impede the accumulation of infiltration and the infiltration rate. The Philip model and the Kostiakov model can better simulate the process of moisture in soil moisture infiltration. The above research showed that the one-dimensional vertical infiltration experiment could accurately simulate the water infiltration process and the selection of the most suitable model depended on the soil data in different regions. However, thus far, there have been few studies investigating the water infiltration process, infiltration model analysis and water content distribution simulation of humic acid on sierozem soil, and this gap needs further exploration.
Farmland in Yinchuan is composed of sierozem soil, which is characterized by high sand content and low organic matter content [17], resulting in poor water-holding capacity [18] and weak soil structure [19]. The Yinchuan Plain, an important Yellow River irrigation area in northwest China, has struggled with water and fertilizer leakage of farmland sierozem soil, as well as soil quality degradation and agricultural non-point source pollution, which have become increasingly prominent and affect the development of local agriculture [20]. Considering the weak soil structure characteristics in this region, it was important to study how humic acid affected the soil water infiltration process of sierozem soil at the microscopic level. The objectives of the study were as follows: (1) To simulate the soil water infiltration process via humic acid addition, and to understand the influence of soil water infiltration on farmland in the Yinchuan Plain; (2) to analyze the effects of humic acid addition on hydraulic parameters using the measured cumulative infiltration data and Hydrus-1D software, providing data reference for humic acid to improve the water availability of sierozem soil; and (3) to determine the applicability of the infiltration model of sierozem soil under the humic acid addition in Yinchuan farmland, so as to evaluate and predict the water movement of sierozem soil in different areas.

2. Materials and Methods

2.1. Materials

The test soil was collected in the Yinchuan Plain, Ningxia Hui Autonomous Region (106°7′ E, 38°32′ N). The district is part of the medium-temperature continental climate, with an average annual temperature of 8.1 °C; the daily temperature difference is about 13.5 °C. The annual precipitation is 180 mm, and the annual evaporation is about 2000 mm. The rainfall is mainly concentrated in months 7–9. The soil is a sandy loam, which was collected to a depth of 0–40 cm. The soil bulk density of the collected soil was 1.65 g/cm3 using the cutting ring method, and the initial water content and the retention water content of the air-dried soil was 0.005 cm3/cm3.
The sierozem soil in the Yinchuan Plain is classified as arid soil. The humification process of soil formation is very weak, with little humus content and a low crop yield. The basic properties of sierozem soil in this area are shown in Table 1.
The humic acid used in the experiment originated from Shandong Province, China, Shandong Baishun Chemical Co., LTD. The humic acid pH was 5.5 and the organic carbon content was 60%.

2.2. Methods

The experiment was carried out at the Breeding Base for State Key Lab of Land Degradation and Ecological Restoration in Northwestern China, Ningxia University, in May 2021. A vertical one-dimensional infiltration device was used (Figure 1). The collected soil samples were air-dried and screened at 2 mm. In line with references [10,15], humic acid was mixed with the tested soil at the mass ratios of 0, 1%, 2%, 3% and 4%, and each treatment was repeated 3 times. Each soil column was a cylindrical organic glass column 50 cm in height and 10 cm in diameter, and the exhaust hole with a diameter of 2 mm was evenly distributed at the bottom. Vaseline was evenly applied to the inner wall of the cylinder to reduce the effect of the inner wall on the infiltration. To simulate the infiltration of the soil in the field, we placed a 5 cm layer of quartz sand at the bottom of the cylinder. The mixed soil samples were layered into the soil column with a bulk density of 1.65 g/cm3 every 5 cm and the topsoil was roughened between layers to avoid soil stratification. The filling height of the soil column was 40 cm and the total height was 45 cm. After filling the soil column, a layer of filter paper was used to cover the soil surface, a Mahalanobis bottle with a diameter of 10 cm and a height of 50 cm was used to supply water, and the water head was kept at approximately 3 cm during the water supply process. After the water supply started, the water level and the migration distance of the wetting front in different periods were recorded. The depth of the wetting front and the height of the water surface of the Mahalanobis bottle were recorded at different times, and the recorded values were the mean values of the readings of the four scales uniformly distributed around the soil column and the Mahalanobis bottle. For 0–2 min, the first observation was made at 10 s, the second observation was made at 30 s, and then subsequent observations were made once every 30 s. For the period 2–10 min, observations were made once every minute; for 10–40 min they were made once every 5 min; and for 40–60 min they were made once every 10 min. After 60 min, observations were made every 30 min. When the wetting front reading reached 40 cm, the water supply was stopped and the water was quickly drained. Soil samples were collected at 2.5, 7.5, 12.5, 17.5, 22.5, 27.5, 32.5 and 37.5 cm, and the mass water content was measured using a drying method (105 °C) and converted to the volumetric water content.

2.3. Comparison of Infiltration Model Analysis

In this study we used the Philip model, Horton model and Kostiakov model to simulate the infiltration rate of sierozem soil under humic acid addition and compare the applicability of different infiltration models.
(1)
The Philip model equation [12] is as follows:
i = 0.5 S t 0.5 + i c ,
where i is the infiltration rate (cm/min), S is the sorptivity (cm/min0.5) and ic is the steady infiltration rate (cm/min).
(2)
The Horton model equation [13] is as follows:
i = i c + ( i 1 i c ) e k t ,
where i1 is the initial infiltration rate (cm/min) and k is the infiltration model parameter; other parameters are as previously stated.
(3)
The Kostiakov model equation [14] is as follows:.
i = c t d ,
where c and d are model parameters, c represents the initial infiltration rate (cm/min) and d characterizes the degree of water infiltration rate decline.
(4)
Wetting front fitting.
In this study, we used the power function to fit the variation of the wetting front as follows:
z f = a t b ,
where zf is the wetting front (cm); t is the infiltration time (min); and a and b are the fitting parameters, where a represents the change in the wetting front process after the timing has begun, and b represents the attenuation degree of the wetting front.

2.4. Hydrus-1D Basic Equation

In Hydrus-1D, assuming the same quality soil medium, soil moisture is mainly a drooping movement, and the infiltration is simulated using a non-saturated soil water motion equation (Richards) and fixed solutions [21]. The equation is as follows:
C h h t = z k ( h ) h z 1
The soil moisture characteristic curve Θ(h) and the soil non-saturated water conduction K(h) uses the Van Genuchten–Mualem model [22]. The model is expressed as:
θ ( h ) = θ r + θ s θ r 1 + α h n m h < 0 θ s h 0
K ( h ) = K s S e l 1 ( 1 S e 1 m ) m 2
S e = θ θ r θ s θ r
where C(h) is the ratio of water (cm); Ks is the saturated hydraulic conductivity(cm/min); K(h) is the non-saturated hydraulic conductivity (cm/min); Se is the saturation; θs is the saturated moisture content (cm3/cm3); θr is the retention water content (cm3/cm3); α is a parameter (1/cm) related to the suction power; m and n are the shape coefficient; t is the time (min); z is the soil depth (cm); and h is the pressure water head (cm).
Parameter l was usually set to 0.5, and on this basis, the error between the simulated value and the measured value of soil water content was reduced by adjusting the parameter value for calibration [23]. The simulated soil depth was 40 cm, the spatial step was 0.5 cm, and the observation points were located at depths of 2.5, 7.5, 12.5, 17.5, 22.5, 27.5, 32.5 and 37.5 cm.
During the one-dimensional infiltration experiment, the fixed pressure water head was the upper boundary of the model, and the free drainage was used as the lower boundary of the model.
The initial conditions were:
h = h 0 ( z ) 0 z L t = 0 ,
The terminal condition was:
{ h = h 1 z = 0 t 0 u p p e r   b o u n d a r y h z = 0 z = L t > 0 l o w e r   b o u n d a r y ,
where h0(z) is the initial pressure head (cm), h1 is the upper defined pressure head and z is the depth of water on the soil surface (3 cm). L is the soil column height (cm).

2.5. Model Evaluation

Three error analysis indexes, including coefficient of determination (R2), standardized measure D, root mean square error (RMSE) and mean absolute error (MAE), were used to evaluate the results of forward fitting of parameters obtained via inversion. The specific calculation formula is as follows:
R 2 = 1 i = 1 m ( E i M i ) 2 i = 1 m ( M i M i ¯ ) 2 ,
RMSD = 1 m i = 1 m ( E i M i ) 2 ,
MAE = 1 m i = 1 m E i M i ,  
D = 1 i = 1 m ( E i M i ) 2 i = 1 m ( E i M i ¯ + M i M i ¯ ) 2 ,
where Ei represents the simulated value, Mi represents the measured value, M i ¯ represents the average value of the measured value, and m represents the number of samples. D is a standardized metric whose value ranges from 0 to 1. The closer the D value is to 1, the higher the coincidence between the simulated value and measured value.

3. Results and Analysis

3.1. Effects of Humic Acid Concentration on the Wetting Front

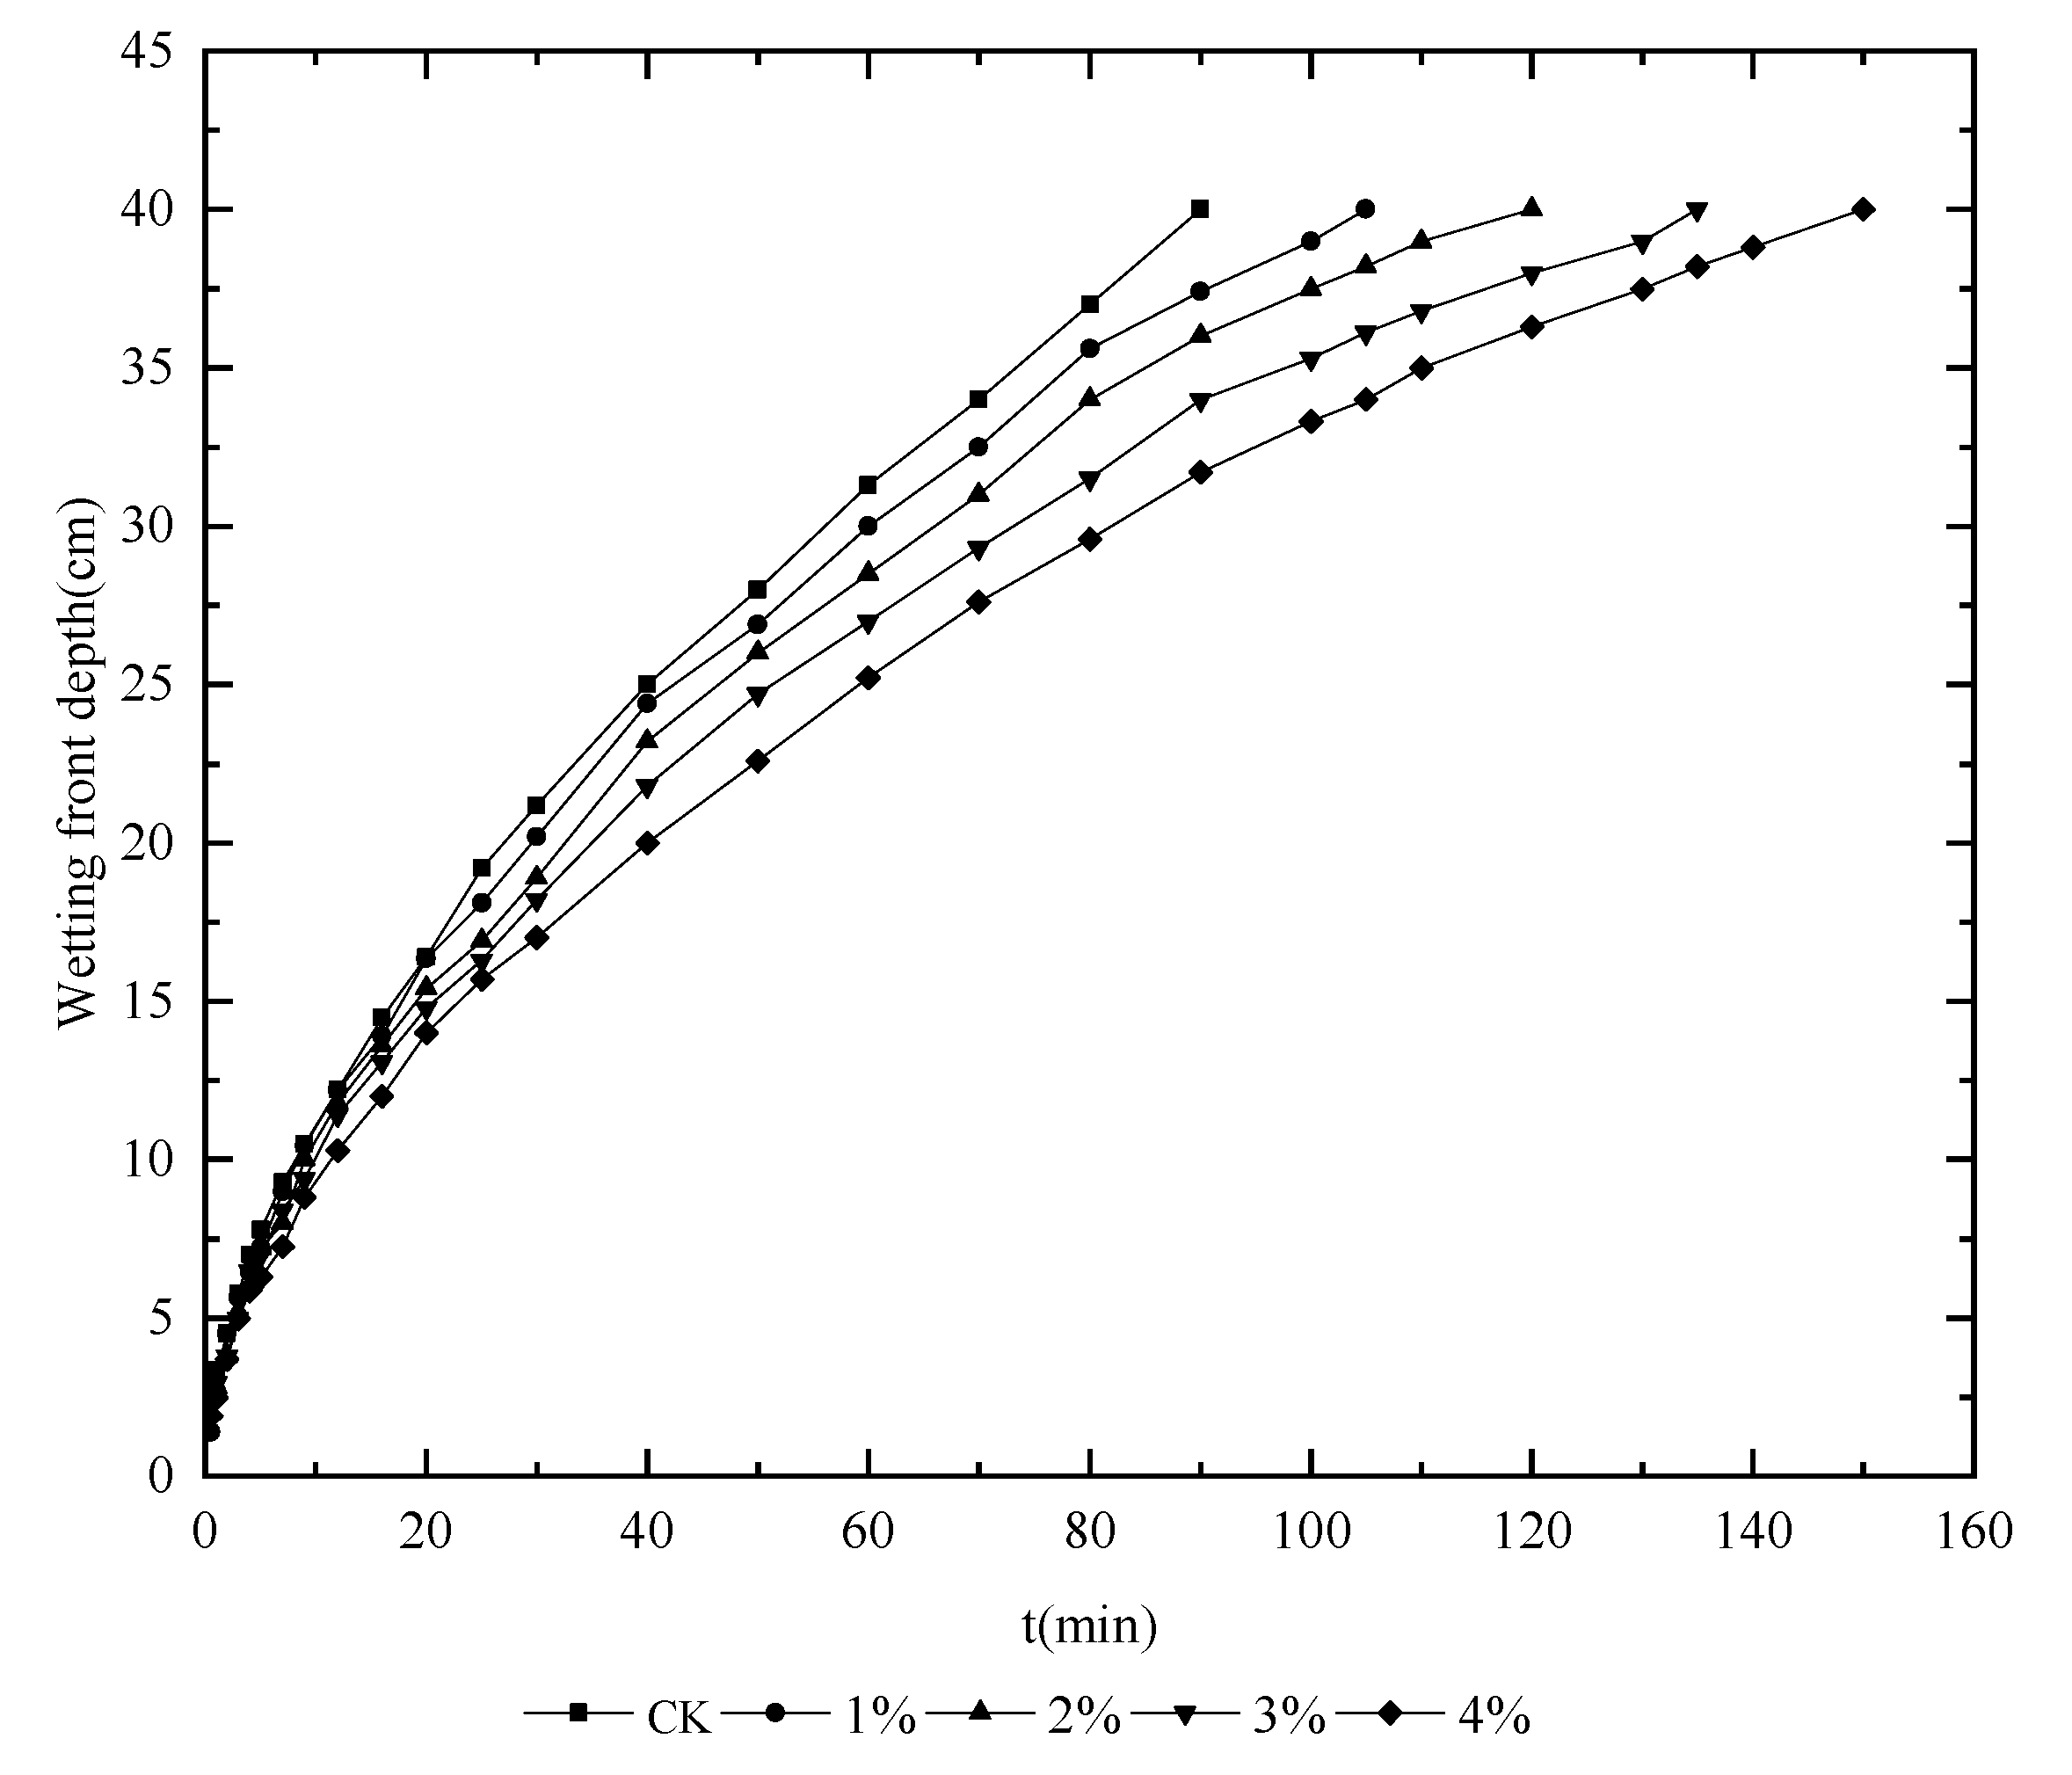
The wetting front is the leading edge of infiltrating water [24]. The movement of water through the soil can be determined by measuring the downward migration of the wetting front over time [25]. The experimental results (Figure 2) showed that the migration distance of the wetting front shortened with the increasing amount of humic acid. In the initial 0–30 min of infiltration, there was little difference in the advance rate of the wetting peak among different treatments, which was due to the dry soil and large soil matrix potential at the initial stage of infiltration, and the minimal interaction between humic acid and sierozem soil [26]. With increasing infiltration time, the migration trend of the wetting front slowed, and the effect of the addition of humic acid on soil water infiltration process became gradually significant. When the infiltration time reached 90 min, compared with CK, the treatment front wetting process of 1%, 2%, 3% and 4% decreased by 6.5%, 10%, 15% and 21%, and the infiltration time was prolonged by 20 min, 40 min, 50 min and 60 min, respectively.
In order to better study the influence law of humic acid addition on the wetting front migration process of sierozem soil, the power function was selected to fit the change process of the wetting front over time according to the wetting front change trend (Table 2). After fitting, it was found that with the increase in humic acid addition, the a value decreased gradually, indicating that the initial moisture peak migration rate also decreased gradually. With the increase in humic acid addition proportion, the b value gradually increased, demonstrating the gradual attenuation of the wetting front. The determination coefficients (R2) of all the treatments were greater than 0.990, indicating that the power function could better fit the variation process of the wetting front under the influence of humic acid over time, and that it could better reflect the migration of wetting front and wetting peak under different humic acid addition proportions.

3.2. Effects of Humic Acid Concentration on the Cumulative Infiltration Amount

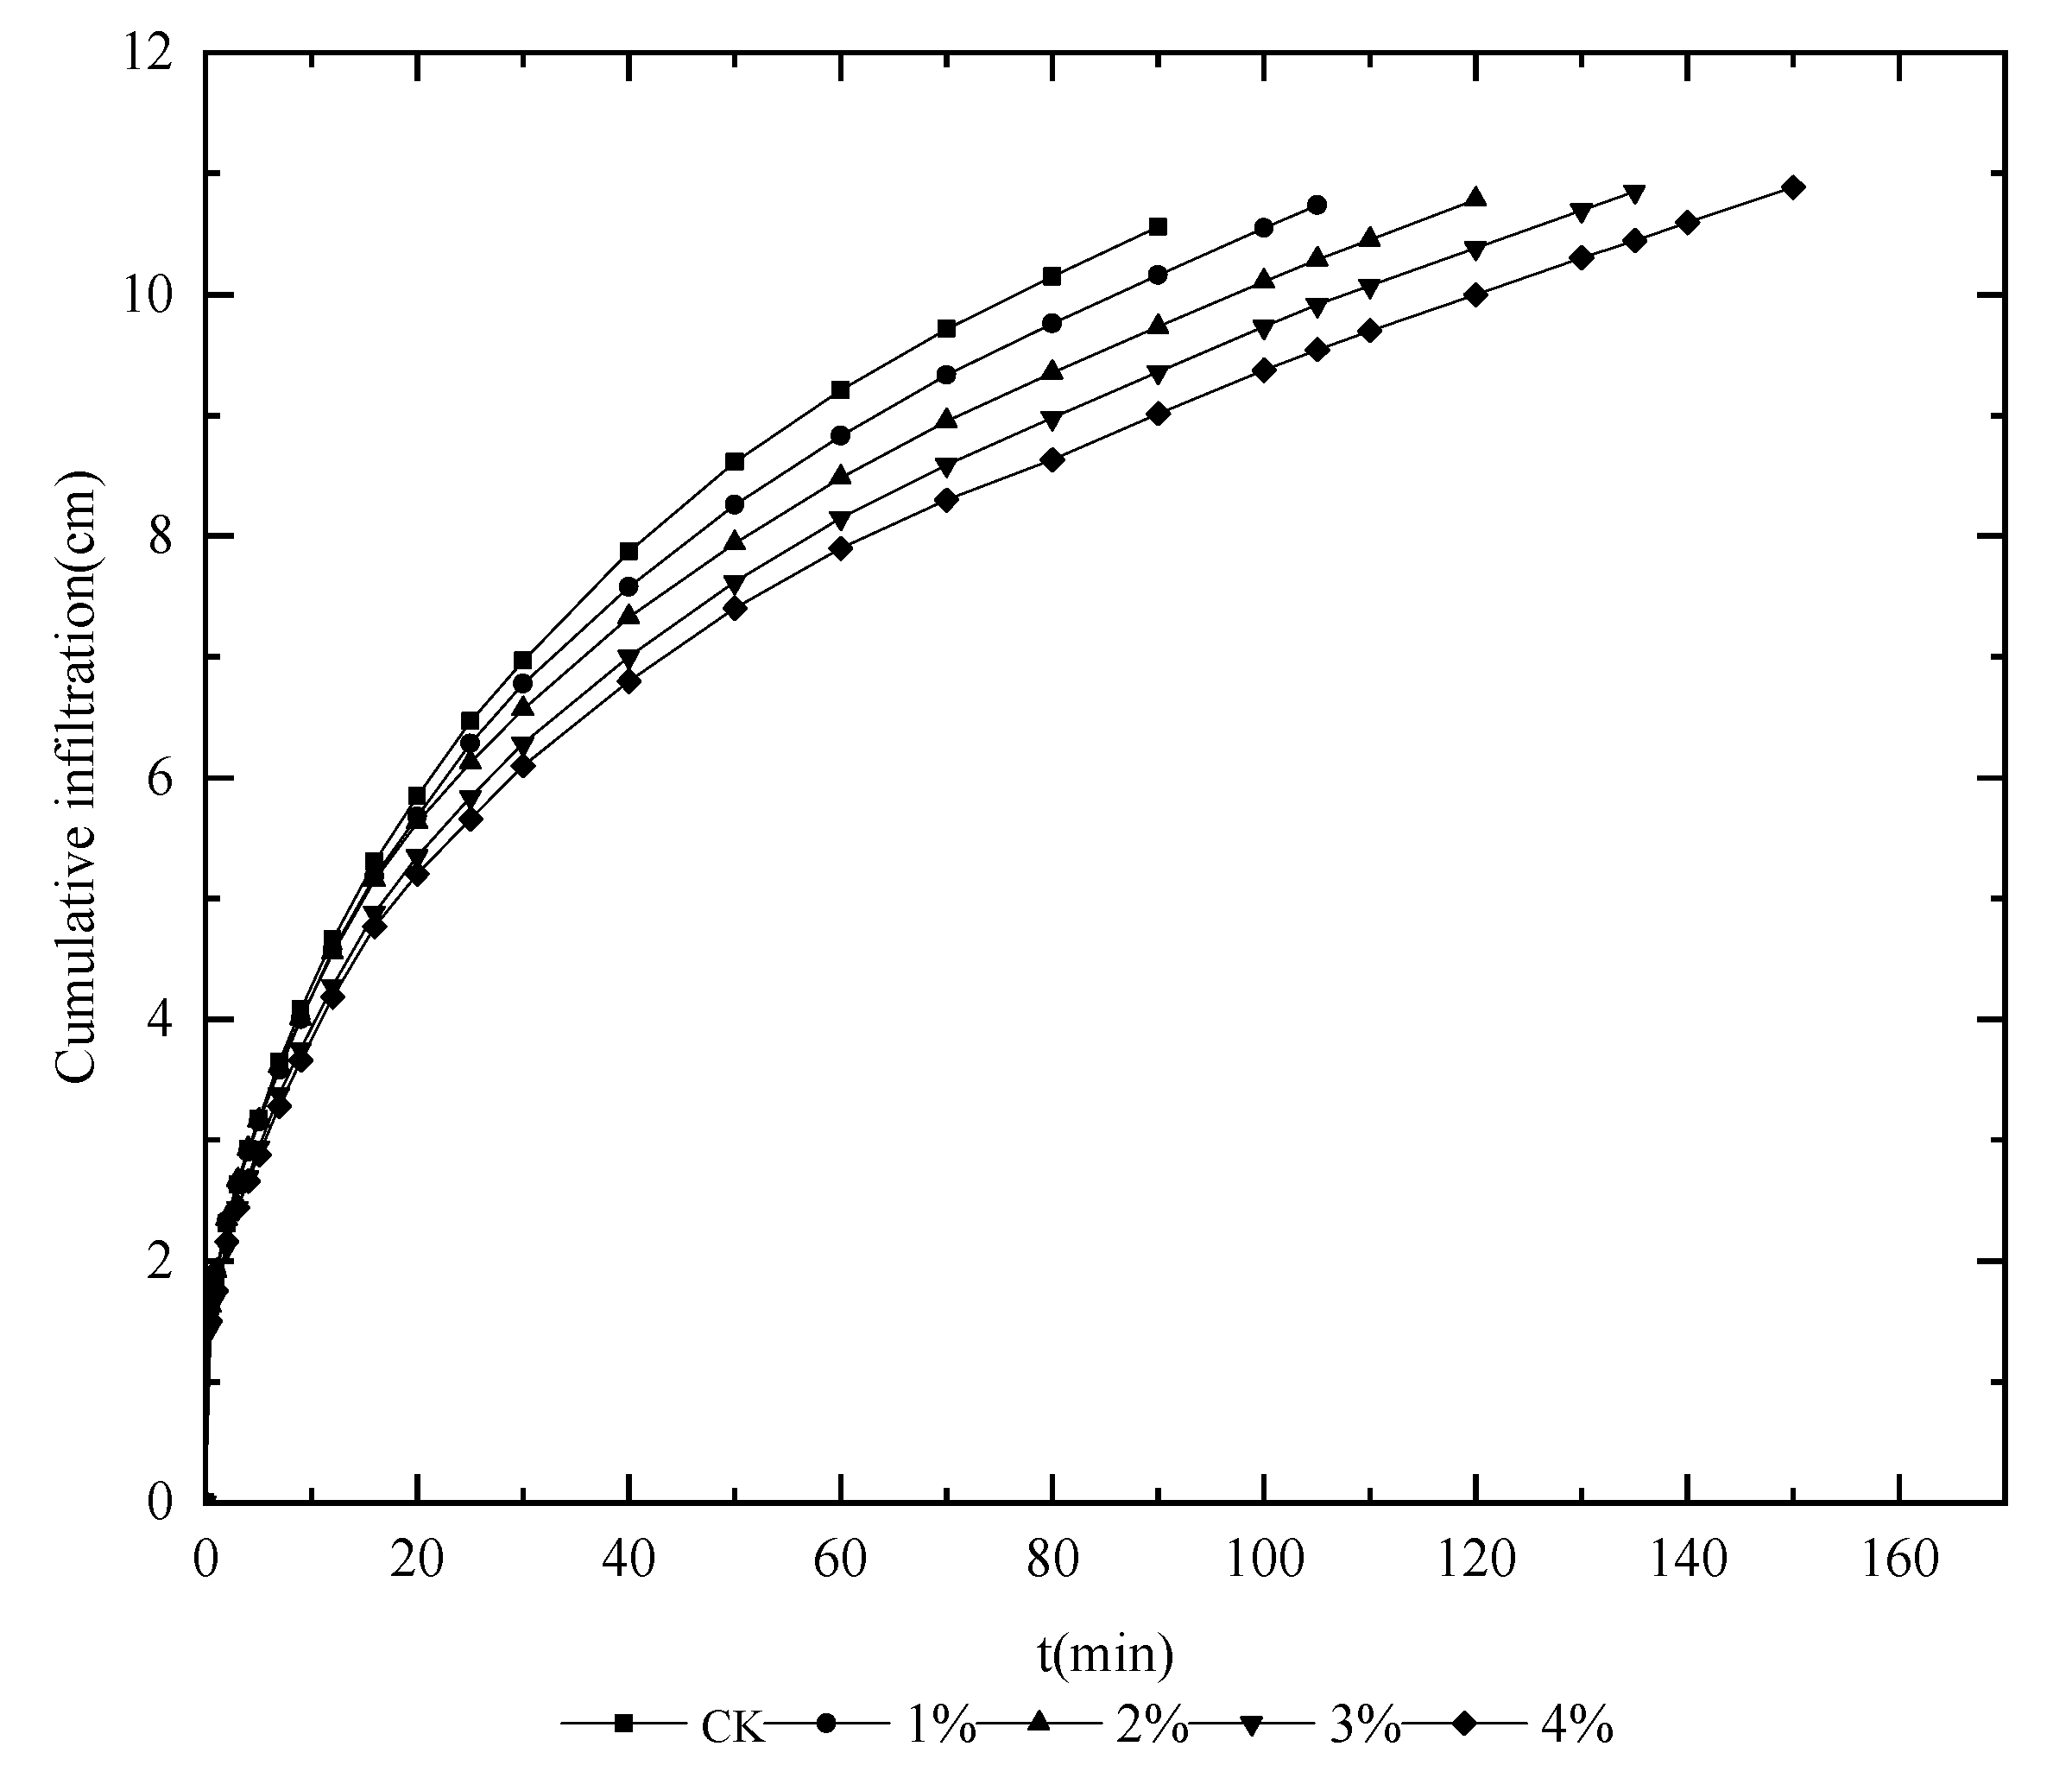
The cumulative amount of infiltration is the main indicator reflecting the characteristics of water infiltration [27]. The infiltration time of CK was the shortest (90 min), while that of 4% treatment was the longest (150 min) (Figure 3). There were no significant differences in cumulative infiltration between treatments with different ratios of addition of humic acid within 0–30 min. When the infiltration time was 90 min, the cumulative infiltration amount of each treatment was clearly different. Compared to CK, the cumulative infiltration amount of 1%, 2%, 3% and 4% treatment decreased by 4.5%, 11.14%, 18.42% and 23.6%, respectively.

3.3. Effect of Humic Acid Concentration on Infiltration Rate

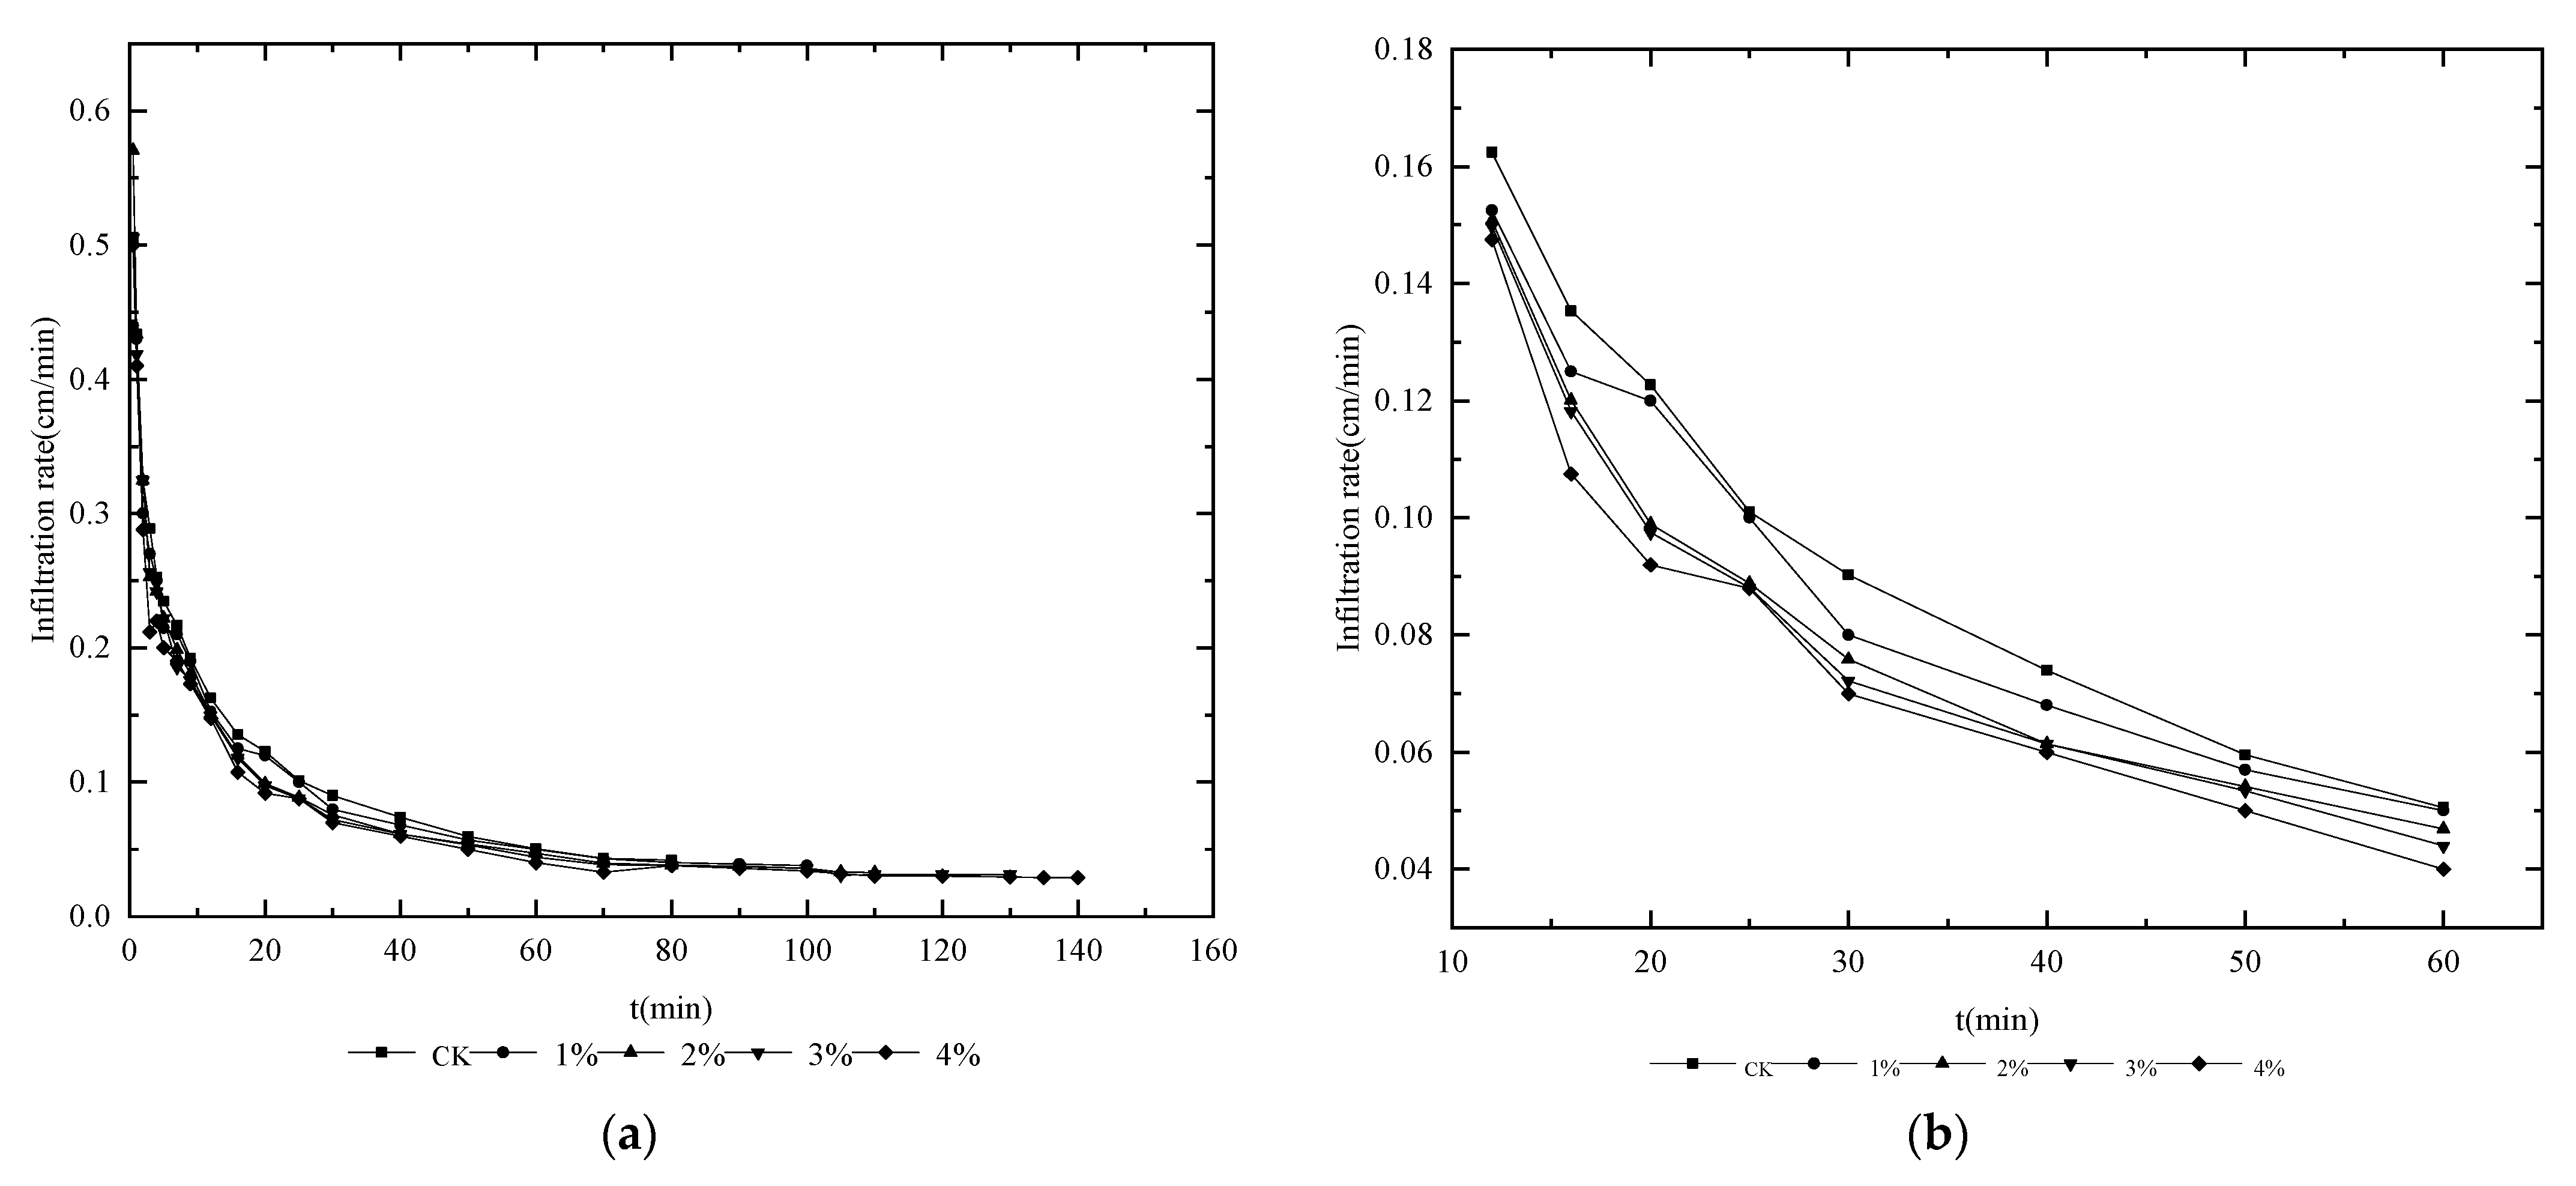
The infiltration rate is the water content of the soil per unit of time, which is a direct indicator of the infiltration capacity of soil water infiltration ability [28]. In the study, the change of soil water infiltration rate with time was generally divided into three stages: the transient stage, the seepage stage and the stable infiltration stage [29]. Figure 4 shows the changes in the soil water infiltration rate based on different proportions of humic acid. To highlight the differences between treatments more obviously, Figure 4a was partially enlarged to obtain Figure 4b, which was the infiltration rate during the period of 10–60 min. As can be seen from Figure 4, the soil infiltration rate gradually decreased with the passage of time. The soil infiltration rate decreased sharply in the first 10 min and continued to decrease rapidly over time; this was a transient stage, which was mainly affected by molecular forces. The infiltration rate gradually decreased with the increase in infiltration time from 10 to 60 min, which was the leakage stage. The infiltration rate of all treatments decreased with the increase in the applied proportion of humic acid, which was mainly affected by capillary force and gravity. After 60 min, the soil infiltration rate did not change significantly, which meant the infiltration state was stable under the action of gravity [30]. Different treatments showed obvious regular changes; that is, the higher the proportion of humic acid addition, the lower the soil water infiltration rate (CK > 1% > 2% > 3% > 4%).

3.4. Model Fitting of Soil Water Infiltration Process

To determine the applicability of the addition of humic acid to the soil water infiltration model, Philip, Horton and Kostiakov models were selected to fit and analyze the soil water infiltration process [1], and the fitting parameters are shown in Table 3. The R2 determination coefficients of the three models were greater than 0.9. In the Philip model, S was between 0.71 and 0.85, indicating that the soil water infiltration process was well fitted. In the Horton model, both i1 and ic showed a decreasing trend with the increase in the humic acid addition ratio, which was consistent with the measured data. In the Kostiakov model, c represented the initial infiltration rate. The value of c ranged from 0.38 to 0.41 and decreased with the increase in the applied proportion of humic acid, indicating that humic acid could effectively prevent soil water infiltration. The value of parameter d was between 0.39 and 0.44, indicating the decline in the degree of soil water infiltration rate. In conclusion, the Philip model has a poor fit effect and was not suitable to simulate the soil infiltration process with humic acid addition, while the Kostiakov model has the best fitting effect (R2 > 0.95); Zhao came to the same conclusion [31].

3.5. Verification of Parameters and Effect of Humic Acid Concentration on Soil Hydraulics Parameters

In addition to the influence of external input conditions such as soil type, complex hydrological change and irrigation management difference, the simulation accuracy of the infiltration model cannot be ignored. Combined with laboratory experiments to determine the hydraulic parameters of the Hydraus-1D model, the factors affecting the water content of sierozem soil in Yinchuan farmland under humic acid addition were explored, which could provide a basis for the accurate simulation of soil moisture and practical production of farmland.
Soil hydraulic parameters are the basic parameters used to analyze the characteristics of soil water movement using a mathematical model and to understand soil water movement quantitatively [32]. Based on the cumulative infiltration data from the one-dimensional vertical infiltration test and combined with the initial and boundary conditions set by the test conditions, the inverse of the hydraulic parameters (θr, θs, α, n, Ks) in the Van Genuchten–Mualem model was carried out using the inverse module of Hydrus-1D [33,34,35].
The results of the forward simulation of the Hydrus-1D inversion parameters and the results of the evaluation index showed that there was little difference between the simulated and measured values. The difference analysis showed (Table 4) that there were significant differences among all treatments with the addition of humic acid. There were significant differences between 1 and 4% treatment and CK (p < 0.05).
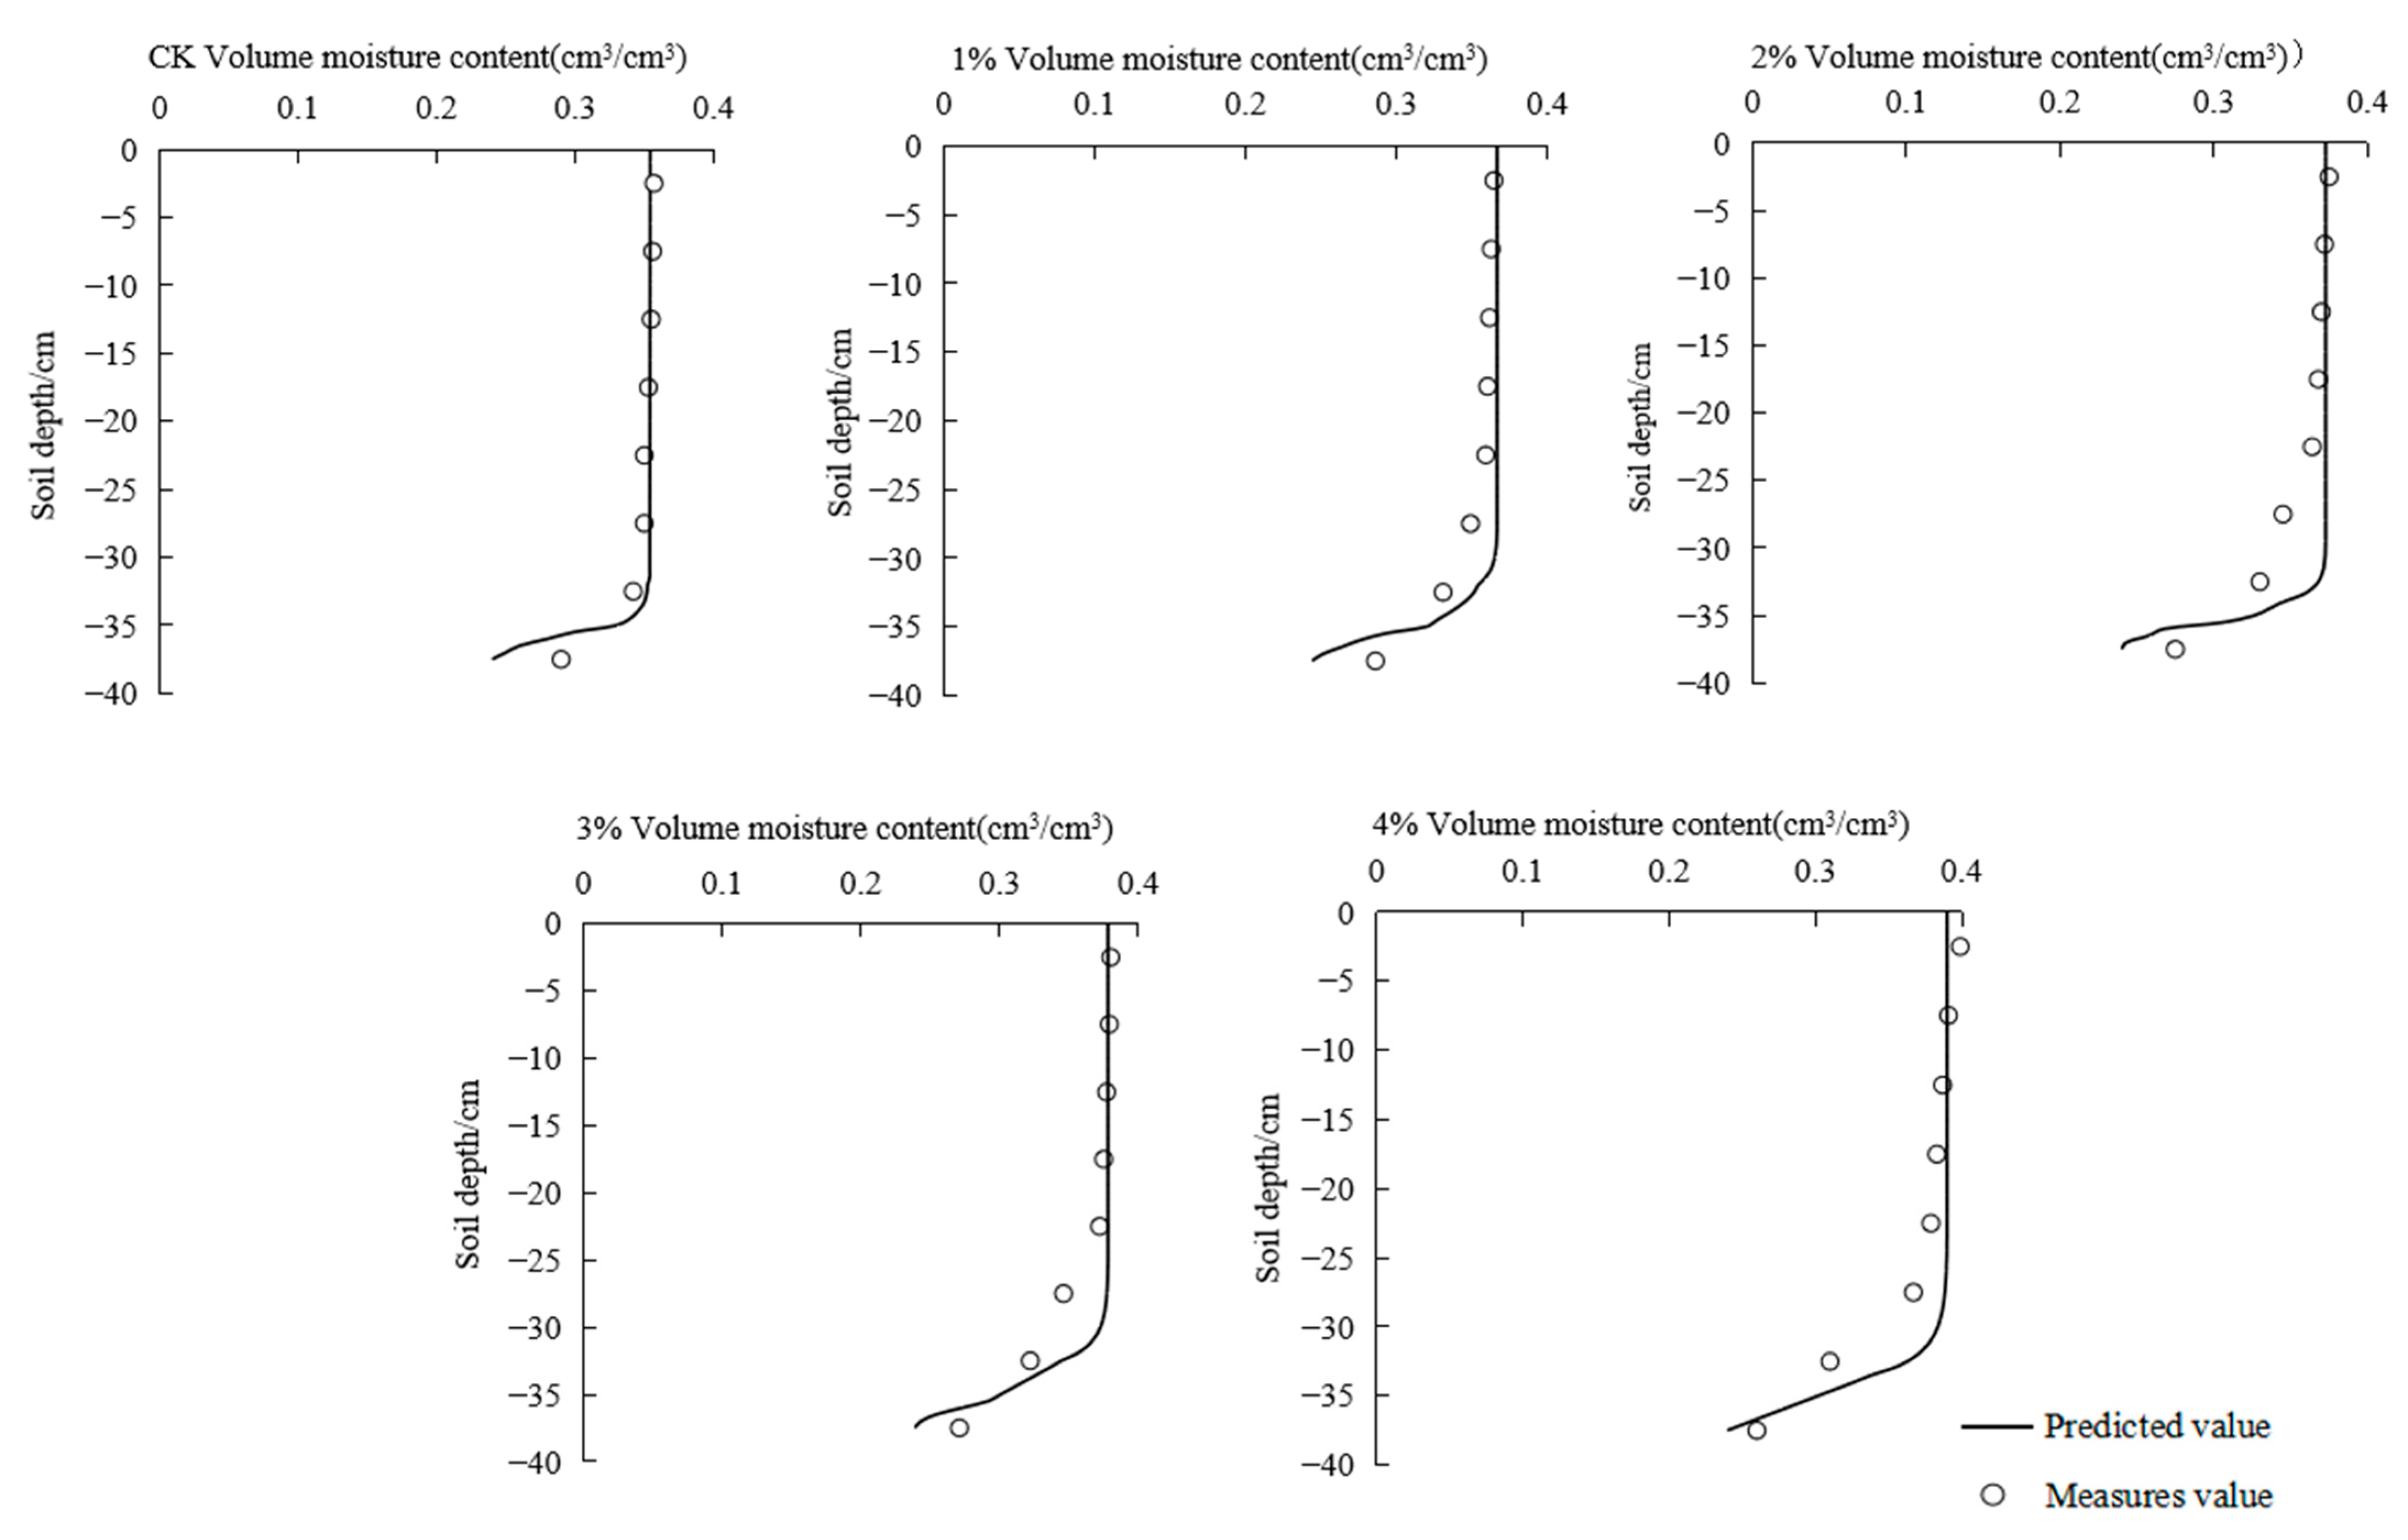
Figure 5 compares the results of measured and simulated water content. MAE, RMSE and D were selected to evaluate the simulation results (Table 5). The MAE and RMSE of soil moisture content was 0.009–0.015 and 0.017–0.022, respectively, indicating that the difference between simulated values and measured values was small. D is 0.970–0.980, with high coincidence and good simulation effect. The results showed that Hydrus-1D could simulate the change in water content at different soil depths with the addition of humic acid.

4. Discussion

4.1. Effects of Humic Acid Concentration on the Wetting Front, the Cumulative Infiltration Amount and Infiltration Rate

With the increase in humic acid, the trend of cumulative infiltration was similar to that of the wetting front. However, the infiltration time required to reach the same depth showed an increasing trend with the addition of humic acid, indicating a reduction effect. The results were consistent with the results of Marián Homolák [36] and Li [15]. The main reason for the decrease in cumulative infiltration amount may be that humic acid molecules dissolved in water increased the solute potential of soil water and decreased the total water potential [37]. Humic acid contained a large number of active hydrophilic groups, offering complexation, adsorption and other ways of promoting the formation of soil aggregate structure [38]. Thus, humic acid changed the soil structure and porosity [39], reduced the fluidity of the infiltration water, slowed down the rate of water infiltration and improved soil water retention.
In the second stage of infiltration, the seepage stage, the infiltration rate is high but the difference is not obvious because of the low soil moisture content and large soil matrix potential, and the compound effect of humic acid and sierozem soil is not significant. Over time, the gradient of soil water pressure and head decreases, and the infiltration rate in the stable stage gradually decreases to zero. The addition of humic acid leads to the hysteresis of the infiltration rate in the seepage stage [40]. The local enlargement of the infiltration rate in Figure 4b more clearly illustrates this phenomenon. The reasons for this phenomenon are as follows: during the infiltration process, soil aggregates disintegrate or break down after encountering water, resulting in the downward leaching of clay and silt, which gradually increases the infiltration resistance. Humic acid can form hydrogen bonds with water molecules, form a network structure, form hydrogels, promote the formation of soil aggregates, block soil pores and reduce the soil infiltration rate. This showed that the humic acid addition weakened the water infiltration capacity of sierozem soil, made the limited soil store more water and enhanced the water-holding performance of soil.

4.2. Effect of Humic Acid Concentration on Soil Hydraulics Parameters

As can be seen in Table 4, the parameter calibration of the parameters showed that the retention water content θr and saturated water content θs were positively correlated with the increase in humic acid, and inversely proportional to the saturated water conductivity Ks and the reciprocal of air-entry α. This was consistent with the research results of Shan and Wang [41,42]. The reason could be that humic acid had a loose “sponge” structure, which changed the soil structure after absorbing water and swelling, and increased the total soil porosity [43]. In addition, during infiltration, the colloidal properties of humic acid were brought into play, and the loose soil particles became stable agglomerates. Finally, the stability of the soil pore structure and channels was enhanced, which increased the effective space for water storage [8]. There was little difference in surface soil water content among different treatments, which may be due to the interaction between the surface soil and external water [44]. The reason for the reduction in Ks is that the complex adsorption capacity of humic acid hydrolysis is strong, and the flocculent gel formed greatly increases the viscosity of water, which greatly weakens the ability of water migration in soil. Furthermore, the positive effect of humic acid addition on the soil was proved.
The main reasons for the error between the simulated and measured values of Hydraus-1D are as follows: (1) the model assumes that the sierozem soil is evenly distributed among all soil layers, but the actual farmland is not a uniform medium; and (2) some errors are inevitable in the sampling process of Yinchuan farmland. Although there is a certain error between the simulated value and the measured value, the simulation results in this study meet accuracy requirements [37] and could be applied to the study of the water infiltration of farmland sierozem soil via the addition of humic acid.

5. Conclusions

This paper studied the effect of humic acid addition on the water infiltration characteristics and hydraulic parameters of sierozem soil in Yinchuan farmland. Based on the findings, several conclusions can be drawn as follows. (1) With the increasing addition of humic acid, the wetting front process, cumulative amount and infiltration rate gradually decreased. The infiltration rate decreased with the increase in the humic acid addition ratio: CK > 1% > 2% > 3% > 4%. Humic acid can effectively reduce the infiltration rate of sierozem soil in farmland, and the infiltration inhibition effect is obvious. (2) In this study, the applicability of the Philip model (R2 > 0.92), Horton model (R2 > 0.93) and Kostiakov model (R2 > 0.95) was compared. It is concluded that the Kostiakov model could more accurately describe the water infiltration of sierozem soil in the Yinchuan Plain. (3) After the infiltration, the moisture content of each soil layer increased with the increase in humic acid, which improved the water-holding capacity of the sierozem soil. The results fully explained that humic acid addition could reduce the infiltration of soil and cause sierozem soil to hold more water. This study thus provides a theoretical basis for the further study of the mechanism of water infiltration and water-holding capacity of sierozem soil in the irrigation area of Yinchuan plain.

Author Contributions

X.M.: Conceptualization, Methodology, Writing—Original draft preparation, acquisition, Validation; Y.B.: Data curation, Investigation, Formal analysis; X.L.: Data analysis, Software operation; Y.W.: Writing—Reviewing. All authors have read and agreed to the published version of the manuscript.

Funding

The research was funded by the National Natural Science Foundation of China (Grant no. 41867003) and Key Research and Development Plan of Ningxia Hui Autonomous Region (Grant no. 2021BEG02011).

Data Availability Statement

The data used to support the findings of this study are available from the corresponding author upon request.

Acknowledgments

The authors would like to acknowledge Xiaohan Ruan (Northwest A&F University) for her constructive suggestions about the preparation of the manuscript. In addition, the Writefull platform helped the author to improve her grammar and spelling during the manuscript submission process. The authors also wish to thank the anonymous reviewers who made comments on an earlier draft of this article.

Conflicts of Interest

The authors declare that there is no of interest with respect to the publication of this article.

References

  1. Sepahvand, A.; Golkarian, A.; Billa, L.; Wang, K.; Rezaie, F.; Panahi, S.; Samadianfard, S.; Khosravi, K. Evaluation of deep machine learning-based models of soil cumulative infiltration. Earth Sci. Inform. 2022, 15, 1861–1877. [Google Scholar] [CrossRef]
  2. Lozano Olivério, G.; dos Santos Batista Bonini, C.; Fernanda Dias Souza, J.; Luís Sanchez Perusso, R.; Meirelles, G.C.; Andrighetto, C.; Carlos Lupatini, G.; Pavan Mateus, G.; Lapaz, A.D.M.; Heinrichs, R.; et al. Water Infiltration, Resistance to Penetration and Soil Moisture in Integrated Agricultural Yield Systems over Time. Commun. Soil Sci. Plant Anal. 2022, 53, 327–336. [Google Scholar] [CrossRef]
  3. Geris, J.; Verrot, L.; Gao, L.; Peng, X.; Oyesiku-Blakemore, J.; Smith, J.U.; Hodson, M.E.; McKenzie, B.M.; Zhang, G.; Hallett, P.D. Importance of short-term temporal variability in soil physical properties for soil water modelling under different tillage practices. Soil Till. Res. 2021, 213, 105132. [Google Scholar] [CrossRef]
  4. Savarese, C.; Drosos, M.; Spaccini, R.; Cozzolino, V.; Piccolo, A. Molecular characterization of soil organic matter and its extractable humic fraction from long-term field experiments under different cropping systems. Geoderma 2021, 383, 114700. [Google Scholar] [CrossRef]
  5. Martin, D.P.; Seiter, J.M.; Lafferty, B.J.; Bednar, A.J. Exploring the ability of cations to facilitate binding between inorganic oxyanions and humic acid. Chemosphere 2017, 166, 192–196. [Google Scholar] [CrossRef]
  6. Wu, X.; Xia, Y.; Yuan, L.; Xia, K.; Jiang, Y.; Li, N.; He, X. Molecular Dynamics Simulation of the Interaction between Common Metal Ions and Humic Acids. Water 2020, 12, 3200. [Google Scholar] [CrossRef]
  7. Liu, M.; Wang, C.; Liu, X.; Lu, Y.; Wang, Y. Saline-alkali soil applied with vermicompost and humic acid fertilizer improved macroaggregate microstructure to enhance salt leaching and inhibit nitrogen losses. Appl. Soil Ecol. 2020, 156, 103705. [Google Scholar] [CrossRef]
  8. Mamedov, A.I.; Bar-Yosef, B.; Levkovich, I.; Rosenberg, R.; Silber, A.; Fine, P.; Levy, G.J. Amending Soil with Sludge, Manure, Humic Acid, Orthophosphate and Phytic Acid: Effects on Infiltration, Runoff and Sediment Loss. Land Degrad. Dev. 2016, 27, 1629–1639. [Google Scholar] [CrossRef]
  9. Magdalena, B.S.; Bozena, D.; Erika, T. Properties of humic acids depending on the land use in different parts of Slovakia. Environ. Sci. Pollut. Res. Int. 2021, 28, 58068. [Google Scholar]
  10. Jing, H. Study on The Effect of Humic Acid on The Migration Distance of Wetting Front during Water Infiltration. IOP Conf. Ser. Earth Environ. Sci. 2021, 30, 8329–8335. [Google Scholar] [CrossRef]
  11. Mendoza, K.V.; Horn, R. Changes in Water Infiltration after Simulated Wetting and Drying Periods in two Biochar Amendments. Soil Syst. 2019, 3, 63. [Google Scholar] [CrossRef]
  12. Philip, R.J. The theory of infiltration: 1. The infiltration equation and its solution. Soil Sci. 1957, 83, 345–358. [Google Scholar] [CrossRef]
  13. Horton, R.E. An Approach Toward a Physical Interpretation of Infiltration-Capacity. Soil Sci. Soc. Am. J. 1941, 63, 399–417. [Google Scholar] [CrossRef]
  14. Hartley, D.M. Interpretation of Kostiakov Infiltration Parameters for Borders. J. Irrigat. Drainage Eng. 1992, 118, 156–165. [Google Scholar] [CrossRef]
  15. Li, X.J.; Shan, Y.Y.; Wang, Q.J.; Ma, C.G.; Yu, L. Effect of humic acid on characteristics of salt and water transport in coastal saline alkali soil. J. Soil Water Conserv. 2020, 34, 288–293. [Google Scholar]
  16. Wu, J.H.; Li, Y.C.; Shao, F.F.; Wang, Z.X. Effects of biochemical fulvic acid on physical properties and water movement characteristics. J. Soil Water Conserv. 2021, 35, 159–164+171. [Google Scholar]
  17. Wang, H.; Yang, Q.; Ma, H.; Liang, J. Chemical compositions evolution of groundwater and its pollution characterization due to agricultural activities in Yinchuan Plain, northwest China. Environ. Res. 2021, 200, 111449. [Google Scholar] [CrossRef] [PubMed]
  18. Zou, Y.; Zhang, S.; Shi, Z.; Zhou, H.; Zheng, H.; Hu, J.; Mei, J.; Bai, L.; Jia, J. Effects of mixed-based biochar on water infiltration and evaporation in aeolian sand soil. J. Arid Land 2022, 14, 374–389. [Google Scholar] [CrossRef]
  19. Wang, Y.Q.; Bai, Y.R.; Zhan, X.L. Spatial Variability of Soil Nutrients at Different Sampling Scales in Farmland in the Yellow River Irrigated Area in Ningxia. Res. Arid Areas 2014, 31, 209–215. [Google Scholar]
  20. Zheng, F.L.; Wang, X.N.; Ge, M.; Li, C.Y.; Tan, J.L. Characteristics of Vertical Water Infiltration in a Sierozem Soil under Gravel-Sand Mulching Condition. Chin. J. Soil Sci. 2021, 52, 314–321. [Google Scholar]
  21. Zhou, X.B.; Luan, Y.X.; Lin, Q.; Xu, S.H. Numerical Inversion-based Simulation of Hydraulic Properties of Stratic Soil. Acta Pedol. Sin. 2021, 58, 1214–1223. [Google Scholar]
  22. Van Genuchten, M.T. A Closed-form Equation for Predicting the Hydraulic Conductivity of Unsaturated Soils. Soil Sci. Soc. Am. J. 1980, 44, 892–898. [Google Scholar] [CrossRef]
  23. Yang, Y.; Chen, Y.; Chen, J.; Zhang, Z.; Li, Y.; Du, Y. The applicability of HYDRUS-1D to infiltration of water repellent soil at different depths. Eur. J. Soil Sci. 2021, 72, 2020–2032. [Google Scholar] [CrossRef]
  24. Liu, Y.F.; Zhang, Z.; Liu, Y.; Cui, Z.; Leite, P.A.; Shi, J.; Wang, Y.; Wu, G.L. Shrub encroachment enhances the infiltration capacity of alpine meadows by changing the community composition and soil conditions. Catena 2022, 213, 106222. [Google Scholar] [CrossRef]
  25. Liu, Y.; Guo, Y.; Long, L.; Lei, S. Soil Water Behavior of Sandy Soils under Semiarid Conditions in the Shendong Mining Area (China). Water 2022, 14, 2159. [Google Scholar] [CrossRef]
  26. Zhang, J.H.; Wang, Q.J.; Mu, W.Y.; Wei, K.; Guo, Y.; Sun, Y. Experimental Investigation of the Different Polyacrylamide Dosages on Soil Water Movement under Brackish Water Infiltration. Polymers 2022, 14, 2495. [Google Scholar] [CrossRef]
  27. Mamedov, A.I.; Levy, G.J.; Shainberg, I.; Letey, J. Wetting rate, sodicity, and soil texture effects on infiltration rate and runoff. Soil Res. 2001, 39, 1293–1305. [Google Scholar] [CrossRef]
  28. Cleophas, F.; Isidore, F.; Musta, B.; Ali, B.M.; Mahali, M.; Zahari, N.Z.; Bidin, K. Effect of soil physical properties on soil infiltration rates. J. Phys. Conf. Ser. 2022, 10, 727–736. [Google Scholar] [CrossRef]
  29. Vand, A.S.; Sihag, P.; Singh, B.; Zand, M. Comparative Evaluation of Infiltration Models. KSCE J. Civil. Eng. 2018, 22, 4173–4184. [Google Scholar] [CrossRef]
  30. Gopi, C.V.; Sambaiah, A.; Rajesh, B.R.A.; Balakrishna, V.; Geetha, B. Effect of Soil, Water Quality and Tillage Dynamics on Infiltration Rate in Different Soil. Int. J. Agric. Sci. 2018, 10, 7428–7431. [Google Scholar]
  31. Zhao, W.J.; Hu, J.Z.; Cui, Z.; Dou, P.X.; Fan, Y.W. Effects of superabsorbent polymers on the vertical infiltration of soil water with sand mulching. Environ. Earth Sci. 2019, 78, 1–6. [Google Scholar] [CrossRef]
  32. Li, Y.B.; Liu, Y.; Nie, W.B.; Ma, X.Y. Inverse Modeling of Soil Hydraulic Parameters Based on a Hybrid of Vector-Evaluated Genetic Algorithm and Particle Swarm Optimization. Water 2018, 10, 84. [Google Scholar] [CrossRef]
  33. Ma, M.M.; Lin, Q.; Xu, S.H. Water Infiltration Characteristics of Layered Soil under Influences of Different Factors and Estimation of Hydraulic Parameters. Acta Pedol. Sin. 2020, 57, 347–358. [Google Scholar]
  34. Wang, X.F.; Li, Y.; Si, B.C.; Ren, X.; Chen, J.Y. Simulation of Water Movement in Layered Water-Repellent Soils using HYDRUS-1D. Soil Sci. Soc. Am. J. 2018, 82, 1101–1112. [Google Scholar] [CrossRef]
  35. Zheng, C.; Lu, Y.; Guo, X.; Li, H.; Sai, J.; Liu, X. Application of HYDRUS-1D model for research on irrigation infiltration characteristics in arid oasis of northwest China. Environ. Earth Sci. 2017, 76, 785. [Google Scholar] [CrossRef]
  36. Homolák, M.; Pichler, V.; Gömöryová, E.; Bebej, J. Effect of surface humus on water infiltration and redistribution in beech forest stands with different density. Central Eur. For. J. 2017, 63, 73–78. [Google Scholar] [CrossRef]
  37. Paul, P.L.C.; Bell, R.W.; Barrett-Lennard, E.G.; Kabir, E. Straw mulch and irrigation affect solute potential and sunflower yield in a heavy textured soil in the Ganges Delta. Agric. Water Manag. 2020, 239, 106211. [Google Scholar] [CrossRef]
  38. Ndzelu, B.S.; Dou, S.; Zhang, X.; Zhang, Y.; Ma, R.; Liu, X. Tillage effects on humus composition and humic acid structural characteristics in soil aggregate-size fractions. Soil Till. Res. 2021, 213, 105090. [Google Scholar] [CrossRef]
  39. Gu, X.; Ren, C.M.; Zhang, H.Y.; Wang, L.N.; Yang, L.; Li, N.; Han, M. Study on water holding capacity of soda saline-alkali soil under application of lignite containing humic acid. China Rural Water Hydropower 2022. Available online: https://kns.cnki.net/kcms/detail/42.1419.TV.20220913.1127.034.html (accessed on 7 March 2023).
  40. Kargas, G.; Soulis, K.X.; Kerkides, P. Implications of Hysteresis on the Horizontal Soil Water Redistribution after Infiltration. Water 2021, 13, 2773. [Google Scholar] [CrossRef]
  41. Wang, X.; Zhao, Y.; Liu, H.; Xiao, W.; Chen, S. Evaluating the Water Holding Capacity of Multilayer Soil Profiles Using Hydrus-1D and Multi-Criteria Decision Analysis. Water 2020, 12, 773. [Google Scholar] [CrossRef]
  42. Shan, Y.Y.; Ma, C.G.; Wang, Q.J.; Li, X.J.; Tao, W.H.; Zhang, J.H.; Su, L.J.; Cao, L. The effect of sodium carboxymethyl cellulose on water movement and soil hydraulic parameters of loamy sand. Acta Pedol. Sin. 2022, 7, 1–12. [Google Scholar]
  43. Ahmad, I.; Ali, S.; Khan, K.S.; Hassan, F.; Bashir, K. Use of Coal Derived Humic Acid as Soil Conditioner to Improve Soil Physical Properties and Wheat Yield. Int. J. Plant Soil Sci. 2015, 5, 268–275. [Google Scholar] [CrossRef] [PubMed]
  44. Bhattacharya, B.K.; Mitra, S.; Datta, M. Identification of Water Deficit and Surplus Periods and Prediction of Profile Water Content from Surface Soil Water Status in Upland of Tripura. J. Indian Soc. Soil Sci. 1997, 45, 698–701. [Google Scholar]
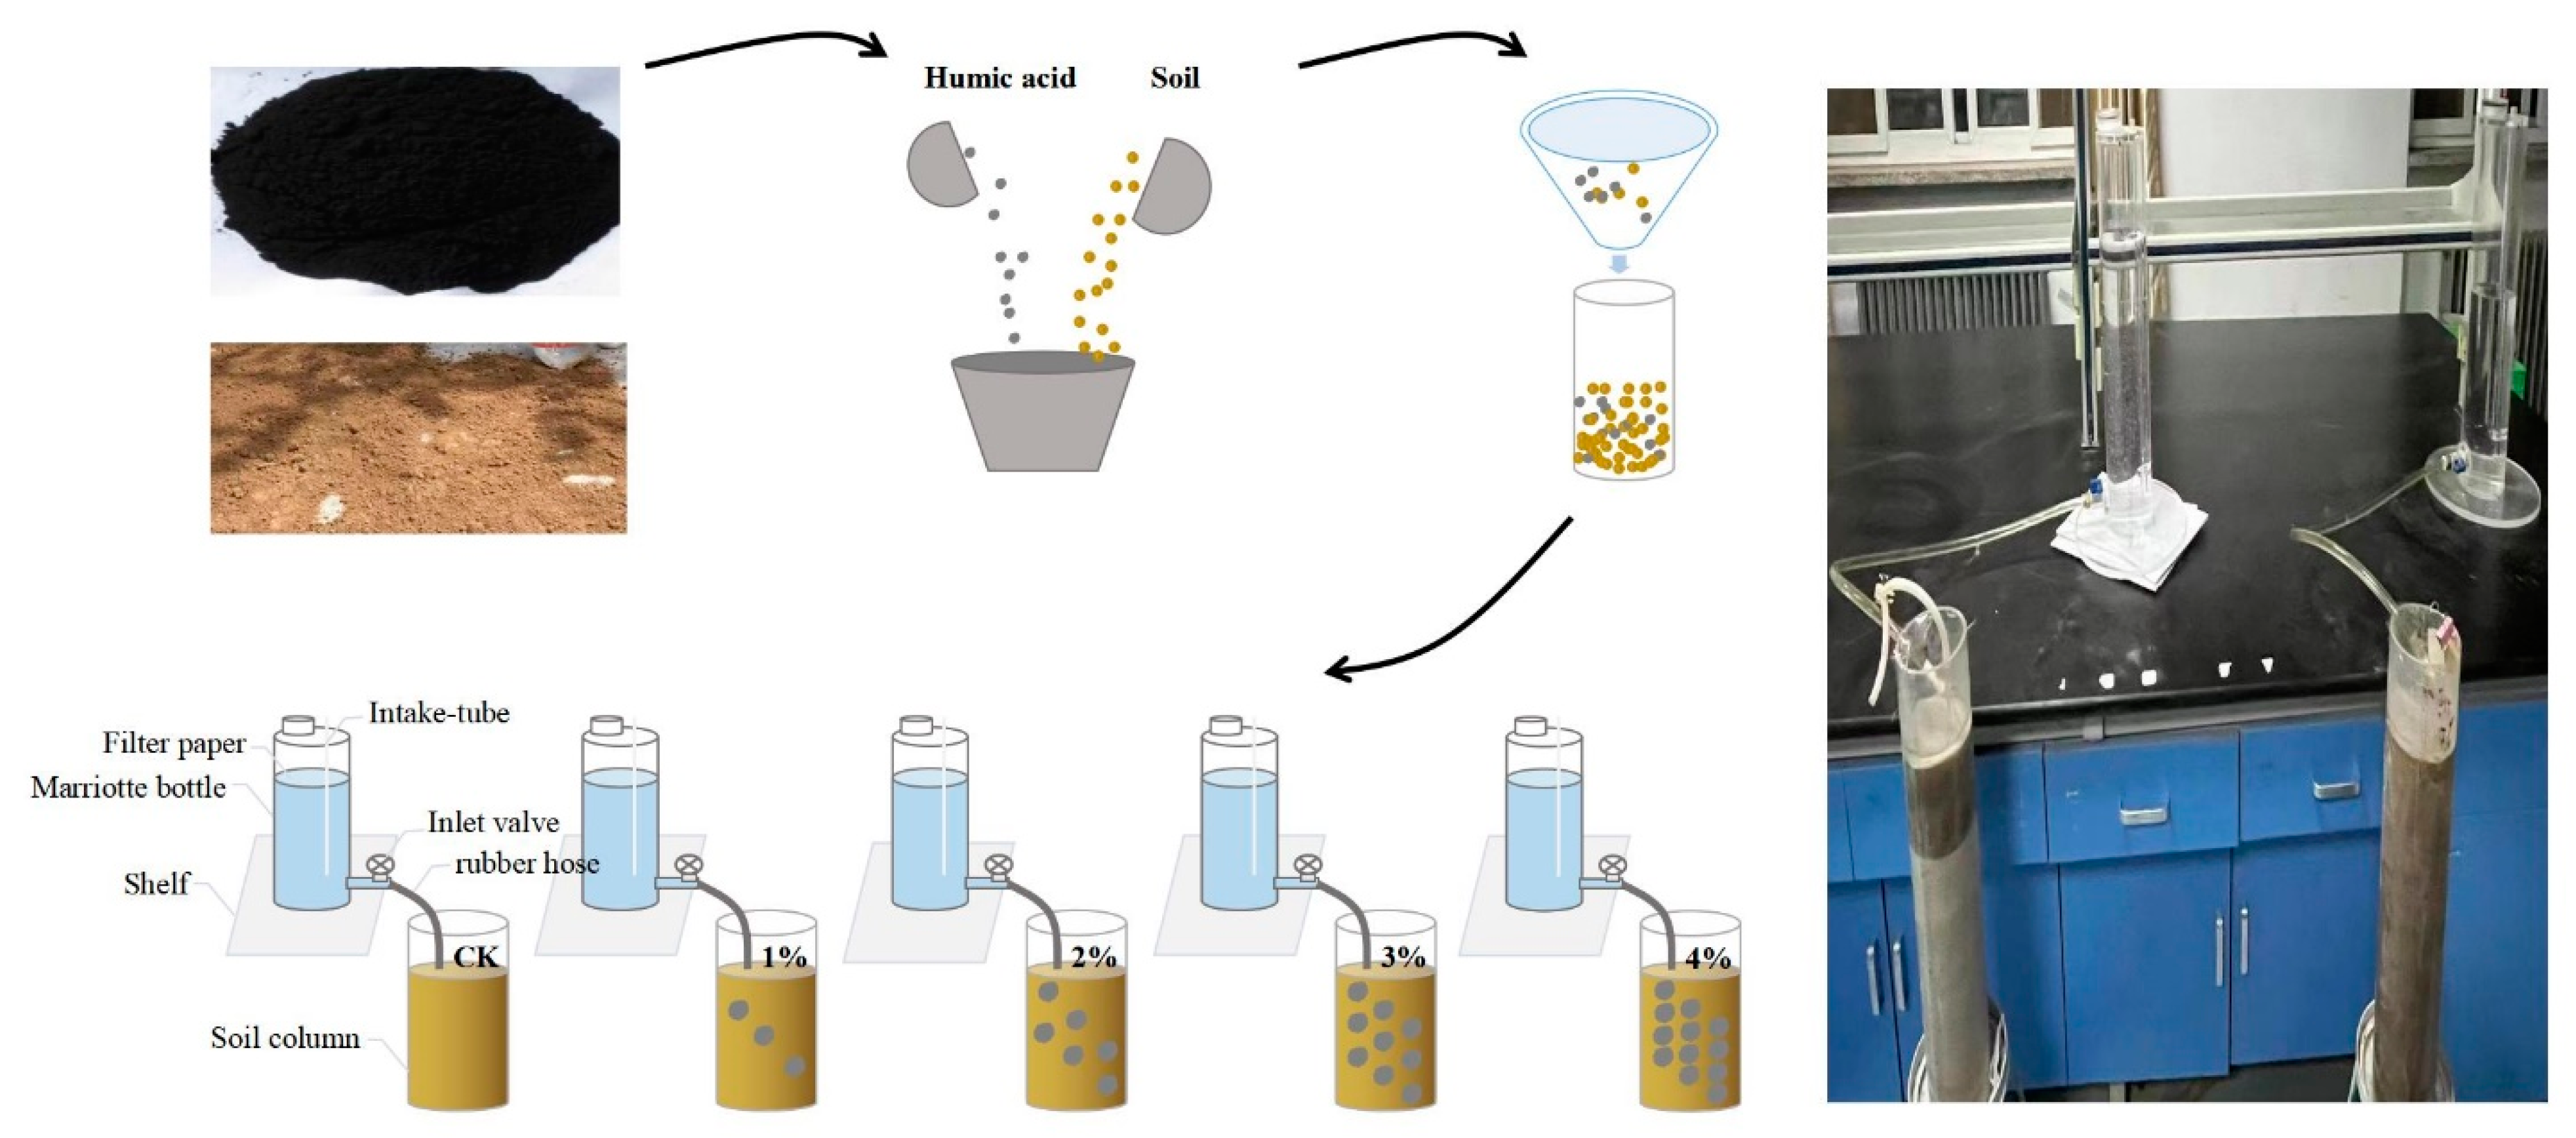
Figure 1. One-dimensional vertical infiltration experiment device.
Water 15 01915 g001
Figure 2. Relationship between the wetting front displacement and infiltration time.
Water 15 01915 g002
Figure 3. Effect of humic acid addition on cumulative infiltration amount.
Water 15 01915 g003
Figure 4. The effect of humic acid addition on the infiltration rate. (a) The effect of humic acid addition on the infiltration rate is described, and (b) a partial enlargement is described.
Water 15 01915 g004
Figure 5. Comparison of the soil water content distribution simulation and the actual measure.
Water 15 01915 g005
Table 1. Basic properties of sierozem soil.
Soil Bulk Density
BD/(g/cm3)
Saturated Moisture Content θs/(cm3/cm3)Initial Moisture Content θr/(cm3/cm3)Saturated Water Conductivity
Ks/(mm/h)
Cation Exchange Capacity
CEC/(cmol/kg)
Sierozem soil1.6500.3530.0051.6248.456
Table 2. Fitting results of the wetting front with time under different humic acid addition ratios.
TreatmentsFitting Parameters
abR2
CK3.0220.5720.999
1%3.0510.5560.999
2%2.9540.5510.999
3%3.0620.5280.999
4%2.7630.5370.999
Table 3. Fitting of infiltration rate under different humic acid addition ratios.
Philip ModelHorton ModelKostiakov Model
S/(cm/min0.5)ic/(cm/min)R2ic/(cm/min)i1/(cm/min)kR2c/(cm/min)dR2
CK0.7610.0340.9480.0740.4830.1640.9520.4120.4000.970
T10.7070.0310.9200.0590.4300.1330.9550.3820.3920.948
T20.8540.0050.9830.0600.5380.2090.9380.4290.4650.986
T30.7950.0090.9660.0510.4780.1650.9570.4010.4450.975
T40.7670.0050.9740.0480.4630.1790.9300.3850.4600.979
Table 4. Calibration results of soil hydraulics parameters.
Humic Acid Application Rate
/(g/kg)
Retained Water Content
/(θr (cm3/cm3))
Saturated Soil Water Content
(θs/(cm3/cm3))
Reciprocal of Air-Entry
/(α (1/cm))
Shape Factor/(n)Saturated Hydraulic Conductivity
/(Ks (cm/min))
CK0.051 ± 0.0020 b0.362 ± 0.0053 b0.140 ± 0.0056 a1.510 ± 0.1127 d0.040 ± 0.0045 a
1%0.052 ± 0.0018 b0.366 ± 0.0199 b0.116 ± 0.0213 ab1.800 ± 0.1044 bc0.033 ± 0.0036 b
2%0.048 ± 0.0008 c0.373 ± 0.0061 bc0.116 ± 0.0062 ab1.700 ± 0.0624 cd0.031 ± 0.0034 b
3%0.052 ± 0.0009 b0.378 ± 0.0061 bc0.103 ± 0.0161 bc2.000 ± 0.1734 ab0.028 ± 0.0019 bc
4%0.059 ± 0.0007 a0.390 ± 0.0105 a0.090 ± 0.0058 c2.100 ± 0.2000 a0.025 ± 0.0005 c
Note(s): Different lowercase letters in the same column indicate significant differences between different treatments (p < 0.05).
Table 5. Evaluation of the effect of soil moisture content.
Evaluation IndicatorsProcessing
CK1%2%3%4%
MAE (%)0.0090.0130.0140.0120.015
RMSE (%)0.0180.0180.0210.0170.022
D0.9790.9700.9720.9800.973
Disclaimer/Publisher’s Note: The statements, opinions and data contained in all publications are solely those of the individual author(s) and contributor(s) and not of MDPI and/or the editor(s). MDPI and/or the editor(s) disclaim responsibility for any injury to people or property resulting from any ideas, methods, instructions or products referred to in the content.