Article

Hydrochemistry of the Geothermal in Gonghe Basin, Northeastern Tibetan Plateau: Implications for Hydro-Circulation and the Geothermal System

1
Chinese Academy of Geological Sciences, Beijing 100037, China
2
Technology Innovation Center of Geothermal and Hot Dry Rock Exploration and Development, Ministry of Natural Resources, Shijiazhuang 050061, China
3
Key Laboratory of Shallow Geothermal Energy, Ministry of Natural Resources of the People’s Republic of China, Beijing 100195, China
*
Author to whom correspondence should be addressed.
Water 2023, 15(11), 1971; https://doi.org/10.3390/w15111971
Submission received: 13 March 2023 / Revised: 28 April 2023 / Accepted: 17 May 2023 / Published: 23 May 2023
(This article belongs to the Special Issue Hydrochemical Characteristics of Geothermal Water)

Abstract

:
The existence of high-temperature geothermal anomalies in the Gonghe Basin on the northeastern margin of the Tibetan Plateau has highlighted a new perspective on the geothermal system of the Himalayan-Tibetan Plateau orogen. In this study, we collected 32 groups of liquid and gas samples from geothermal water, rivers, and boreholes in the Gonghe basin to analyze hydrochemistry, stable isotopes, and geochronology, which allow us to further reveal the geothermal fluid circulations of geothermal reservoirs. The ion contents of liquids identify two distinguished types of water, namely the Na-SO4-Cl type primarily from geothermal water and the Na-SO4-HCO3 and Na-Ca-CO3-SO4 types primarily from cold water. The compositions of the hydrogen and oxygen isotopes of the samples indicate geothermal waters were recharged by atmospheric precipitation and 3000–4600 m high snow mountain meltwater, which may have experienced circulation of 16,300–17,300 years and mixtures of submodern and recent recharge water sources evidenced by isotopes of 3H, 13C, and 14C data. The 3He/4He ratios of these geothermal waters varying from 0.03 to 0.84 Ra further highlighted a crustal-dominated heat source in the region. The deep thermal reservoir temperature in the Gonghe Basin at 160 ± 10 °C and the depth of circulation of geothermal water is 2200–2500 m. Based on this evidence, we have established a geothermal fluid circulation model and refined the exchange processes of fluids and geothermal heat, further enriching the details of the geothermal system in Gonghe Basin.

1. Introduction

The Gonghe Basin, located on the northeastern margin of the Tibetan–Himalaya orogen, is the most concentrated area of geothermal activity in China [1]. The heat flow value in the Gonghe Basin is relatively large with the maximum value reaching 135 mW/m2 [2]. In 2017, the high-temperature dry-hot rock mass of 236 °C was drilled at a depth of 3705 at the Qiabuqia site in the northeastern Gonghe Basin, further arousing the attention of geothermal communities on the heat source mechanism and geothermal origin [3,4,5].
Over the years, geologists from different fields have conducted research in the Gonghe Basin on the outcropping characteristics of hot springs, types of geothermal resources, types of geothermal reservoirs, and mechanisms of geothermal system genesis and have gained a basic understanding of the geothermal conditions in the Gonghe Basin. Examples include the distribution and outcropping characteristics of hot springs in and around the basin [3] and the two types of geothermal resources in the basin: Fault configurations and sedimentary basins [6]. Yan et al. considered that basin thermal reservoirs can be divided into Quaternary Lower Pleistocene geothermal reservoirs and Neoproterozoic geothermal reservoirs [7]. Meanwhile, there are still controversies about the source of heat in the basin [5,8,9,10,11]. Tang et al. presented a ternary polythermal model for hot dry rocks in the Gonghe Basin by analyzing the tectonic background and heat source mechanism of Gonghe Basin [10]. Lang et al. used the silica-enthalpy model to analyze the cold water in the geothermal fluid with 60–68%, and the geothermal reservoir temperature was approximately 222 °C before being cold-water mixed, and the depth of the thermal cycle was approximately 3200 m in the Guide Basin [12]. Li et al. suggested that the geothermal system of the Zhacang geothermal field was a fractured deep-cycle hydrothermal geothermal system and a strongly tectonically active belt-type dry hot rock geothermal system [13]. Based on the water–thermal–rock coupling model, Jiang et al. analyzed the δD change and suggested it is primarily the consequence of advective and dispersive transport, while the δ18O change is controlled by water–rock interactions in the Guide Basin geothermal system [14].All of these studies only concentrated on a single hot spring complex for analysis and ignored the whole-basin expressions and the coupling of deep and shallow water cycles.
In this study, the collected water and gas samples for geochemical and isotopic analysis were employed to test the whole-basin geothermal system and cycling processes of the Gonghe Basin. In addition, the geothermal reservoir temperature and circulation depth are evaluated by the geothermometer to build a model map of the Gonghe Basin geothermal system.

2. Geological Setting

2.1. Geology

The Gonghe Basin belongs to one of the sub-basins on the northeastern margin of the Tibetan Plateau with an average elevation of 300–5000 m and shows a diamond shape with a width of 50 km and a length of 200 km. On the structure, the southern and northern margins are under the control of the positive strike-slip faults of the Kunlun and Haiyuan faults, respectively (Figure 1). Both the western and eastern margins are separated by the Ela Shan fault and Dulan-Chaka highland, respectively, as well as by the Riyue Shan fault of the Waligong Tectonic Magmatic Belt [15]. The Yellow River flowing from southwest to northeast forms a deep canyon in the basin [5,15].
Due to the intensive activities of the Neogene piedmont deep fault, the continuous subsiding basin accumulated huge Neogene and Quaternary deposits that only outcrop on the south bank of the Qiabuqia River. In contrast, Middle-Late Triassic igneous bodies and metasedimentary successions surround the basin where continuous uplift accompanies transgression of the East Kunlun and West Qinling faults [5,16,17].
Figure 1. (a) Schematic structural graph of Gonghe Basin and conjunct area, northeastern margin of the Tibetan Plateau (QHNF: Qinghai Nanshan Fault; DMHF: Gonghe Duomaohe Fault); (b) Gonghe Basin, with details shown in Figure 2; (c) terrestrial heat flow (the heat flow data refers to Jiang et al., 2019 [18]). (After [1,5]).
Water 15 01971 g001

2.2. Geothermal and Geological Conditions

The terrestrial heat flows on the northeastern margin of the Qinghai-Tibet Plateau are obviously greater than the regional crust average (65 mW/m2) [19]. According to the statistical data of geothermal anomalies in the northeastern Tibetan Plateau area (92°–108° E, 33°−41° N; 37 hot springs (groups); 63 geothermal wells), nine sites show high-temperature geothermal anomalies (>90 °C), which are primarily located in the Gonghe Basin and its surrounding areas [5]. There are more than 80 hot springs (40–100 °C) reported in the Gonghe Basin and its surrounding areas, and 17 geothermal wells have been drilled [1,4,5,11] (Figure 2). Geothermal anomaly hot springs are primarily distributed along the Elashan Fault zone and the Riyueshan Fault zone and a few of them are in the blind thrust interior of the basin. Most geothermal wells in the shallow Neogene and Paleogene clastic rocks encountered hydrothermal geothermal reservoirs, and the deep Triassic granites encountered hot dry rocks [7,10,20]. The basin has hydrothermal-type geothermal resources and hot dry rocks [10]. The deep part is dominated by hot dry rock with no or little fluid content and high temperatures (such as the Qiabuqia hot dry rock). In addition, the Gonghe Basin has a high earth heat flow value of up to 134 mW/m2. According to temperature-logging data, the average geothermal gradient of basal granite was 6.7–6.8 °C/100 m, and the gradient value in the fault zone can reach up to 14 °C/100 m (at a depth of 2214–2248 m) [21].
Figure 2. The distribution of spring groups and geothermal drilling wells in the Gonghe Basin and the sampling area, with kriging grid method as the temperature background (spring point and temperature are shown in Table 1) [1].
Water 15 01971 g002
Table 1. Main hot spring distribution locations and temperature statistics (see the above picture for the serial number plane location and the data [1]).
CodeSpring NameLocationTemperature (°C)
LongitudeLatitude
1Bayingou98.93196936.43881343
2Wahong98.82129736.30593646
3Qinggenhe99.12460535.07033068
4Sangchi 199.19864436.05176662
5Sangchi 299.23334136.01696130
6Wenquan99.43052735.40513861
7Ayihai100.70149136.15960232
8Lagan100.55896935.76605238
9Qunaihai101.04063836.14144496
10Zhacang102.63447535.96861193
11Xinjie101.38922235.95850064
12Reshui101.59111336.40165539
13Xiema101.67849736.20089432
14Lancai101.80425835.58787569
15Qukuhu101.97176935.37774149

3. Sampling and Analysis

3.1. Sampling

To understand the geothermal system and cycling process of the Gonghe Basin, 16 sets of water samples and 6 sets of gas samples were collected in the Gonghe Basin between August 2019 and August 2020 (sampling location is shown in Figure 2). The samples were selected from 3 geothermal fields of Qunaihai, Zhacang, and Xinjie distributed along the Riyueshan Fault in the eastern Gonghe Basin for water chemistry and isotopic analysis. Field test indicators such as pH (measurement error is ±0.05) were tested with a multifunctional portable tester (Hach hQ40d). The samples were sealed in 5 L high-density polyethylene bottles. Ten water samples from previous publications were also compiled.

3.2. Methods

We carried out detailed major ionic components and isotope analysis on geothermal water and gas collected from the Gonghe Basin. We also studied the geothermal reservoir temperature and circulation depth. The samples were tested for major ions, trace elements, isotopes, and gases.
The primary tested ions were K+, Na+, Ca2+, Mg2+, SO4, Cl, F, and NO3, where major cations were measured using inductively coupled plasma optical emission spectroscopy (ICP-OES) and inductively coupled plasma mass spectrometry (ICP-MS) with a precision higher than 0.5%, and anions were assayed with a DIONEX-500 Ion Chromatograph with a 0.05 mg/L detection limit.
Water isotopes (δ18O and δD) were analyzed by a laser absorption water isotope analyzer spectrometer, with analytical precisions of ±0.1‰ (1σ) for δ18O and ±0.5‰ (1σ) for δD in the Water Isotope. The results are expressed as δD and δ18O (δ = (Rsample/Rstandard − 1) × 1000) relative to the Vienna Standard Mean Ocean Water (VSMOW) standard.
The isotope 13CDIC and radiocarbon (14CDIC) activity concentrations were analyzed at the Radiocarbon Laboratory of Beta Analytics (Miami, Florida, USA) with an analytical precision of ±0.3‰(1σ) for δ13CDIC and ±0.001–0.004 pMC (1σ) for 14C. The 14CDIC concentrations were expressed as pMC (percent Modern Carbon) using NIST oxalic acid, using SRM 4990C as the standard of reference. The δ13CDIC values were relative to the Pee Dee Belemnite (PDB) standard. Helium and Neon isotopic abundances and the values of 3He/4He and He/Ne were measured with a MAP 215 noble gas mass spectrometer.

4. Results

4.1. Water Chemistry

The results of major ion concentrations are shown in Table 2. Both geothermal water and river water are alkaline, but the pH range of geothermal water of 8.46–8.97 is slightly different from surface water of 8.45–8.58, and the TDS of geothermal water ranging from 478 to 1488 mg/L is also different from surface water ranging from 274 to 330 mg/L. The Piper diagram (Figure 3) shows the differences in the water chemistry types of geothermal water and river water. The geothermal water hydrochemical types are Na-SO4-Cl, Na-Ca-HCO3-SO4, and Na-SO4-HCO3 (Figure 3). The hydrochemical types of river water contain Ca-Na-HCO3, Ca-Mg-HCO3-SO4, Ca-Mg-Na-CO3-SO4, and Ca-Mg-HCO3.

4.2. Fluids and Gas Isotopes

4.2.1. Isotope Compositions of Fluids Samples

The water samples from the Gonghe Basin show that deuterium and oxygen-stable isotopes can effectively determine the source of geothermal water (Table 3) [22,23]. The different isotopic compositions of deuterium and oxygen in different groundwater cycles are caused by the lower water vapor pressure, and the δD and δ18O are enriched in the liquid phase and are depleted in the gas phase. While the δD value primarily depends on the recharge temperature and altitude and is slightly influenced by mixing, the δ18O value is primarily dependent on the degree of exchange in the water–rock interaction and the water–rock ratios. For the geothermal water in this study, the δ18O, δD, and δ13C values range from −12.45‰ to −9.45‰, from −89.89‰ to −65.46‰, and from −15.20‰ to −5.40‰, respectively. In addition, we also collected data on δ18O and δD from previous articles. The tritium values of underground water samples in the study area, except sample S5, are <3. Sr isotopes are extremely important tracers to effectively limit mineral weathering in geothermal water [24]. In addition, Sr isotopes have negligible biological and geological fractionation [25]. The abundance of 87Sr relative to the abundance of stable 86Sr is expressed as the ratio 87Sr/86Sr. 87Sr/86Sr is extensively used in the mixing processes of groundwater, water–rock interactions, the flow paths of groundwater, and so on [25,26,27,28]. The range of the 87Sr/86Sr ratio is 0.711–0.714.

4.2.2. Isotope Compositions of Gas Samples

Helium isotopes are widely used as tracers of volatilities from the crust and mantle in various tectonic environments [33,34]. The source of 3He is the mantle, and 4He is primarily derived from the radioactive decay of U and Th in the crust [35]. Accordingly, the 3He/4He ratio can be used to investigate the contribution rate of crust–mantle material sources in geothermal systems [35,36]. The results of gas isotopes are shown in Table 4.
The 3He/4He ratio is presented as R/Ra, where R is the 3He/4He ratio in the measured sample and Ra is the 3He/4He ratio with a constant of 1.384 × 10⁻⁶ in the atmosphere [37]. The 3He/4He ratios in our samples are between 0.03 and 0.84 and the 4He/20Ne ratios range from 1 to 58. The latter is much higher than air (0.318) and air-saturated water (0.26 at 10 °C), indicating that the isotopic component of helium is excluded from the atmosphere [38,39].

5. Discussion

5.1. Origin and Recharge Source of Geothermal Fluids

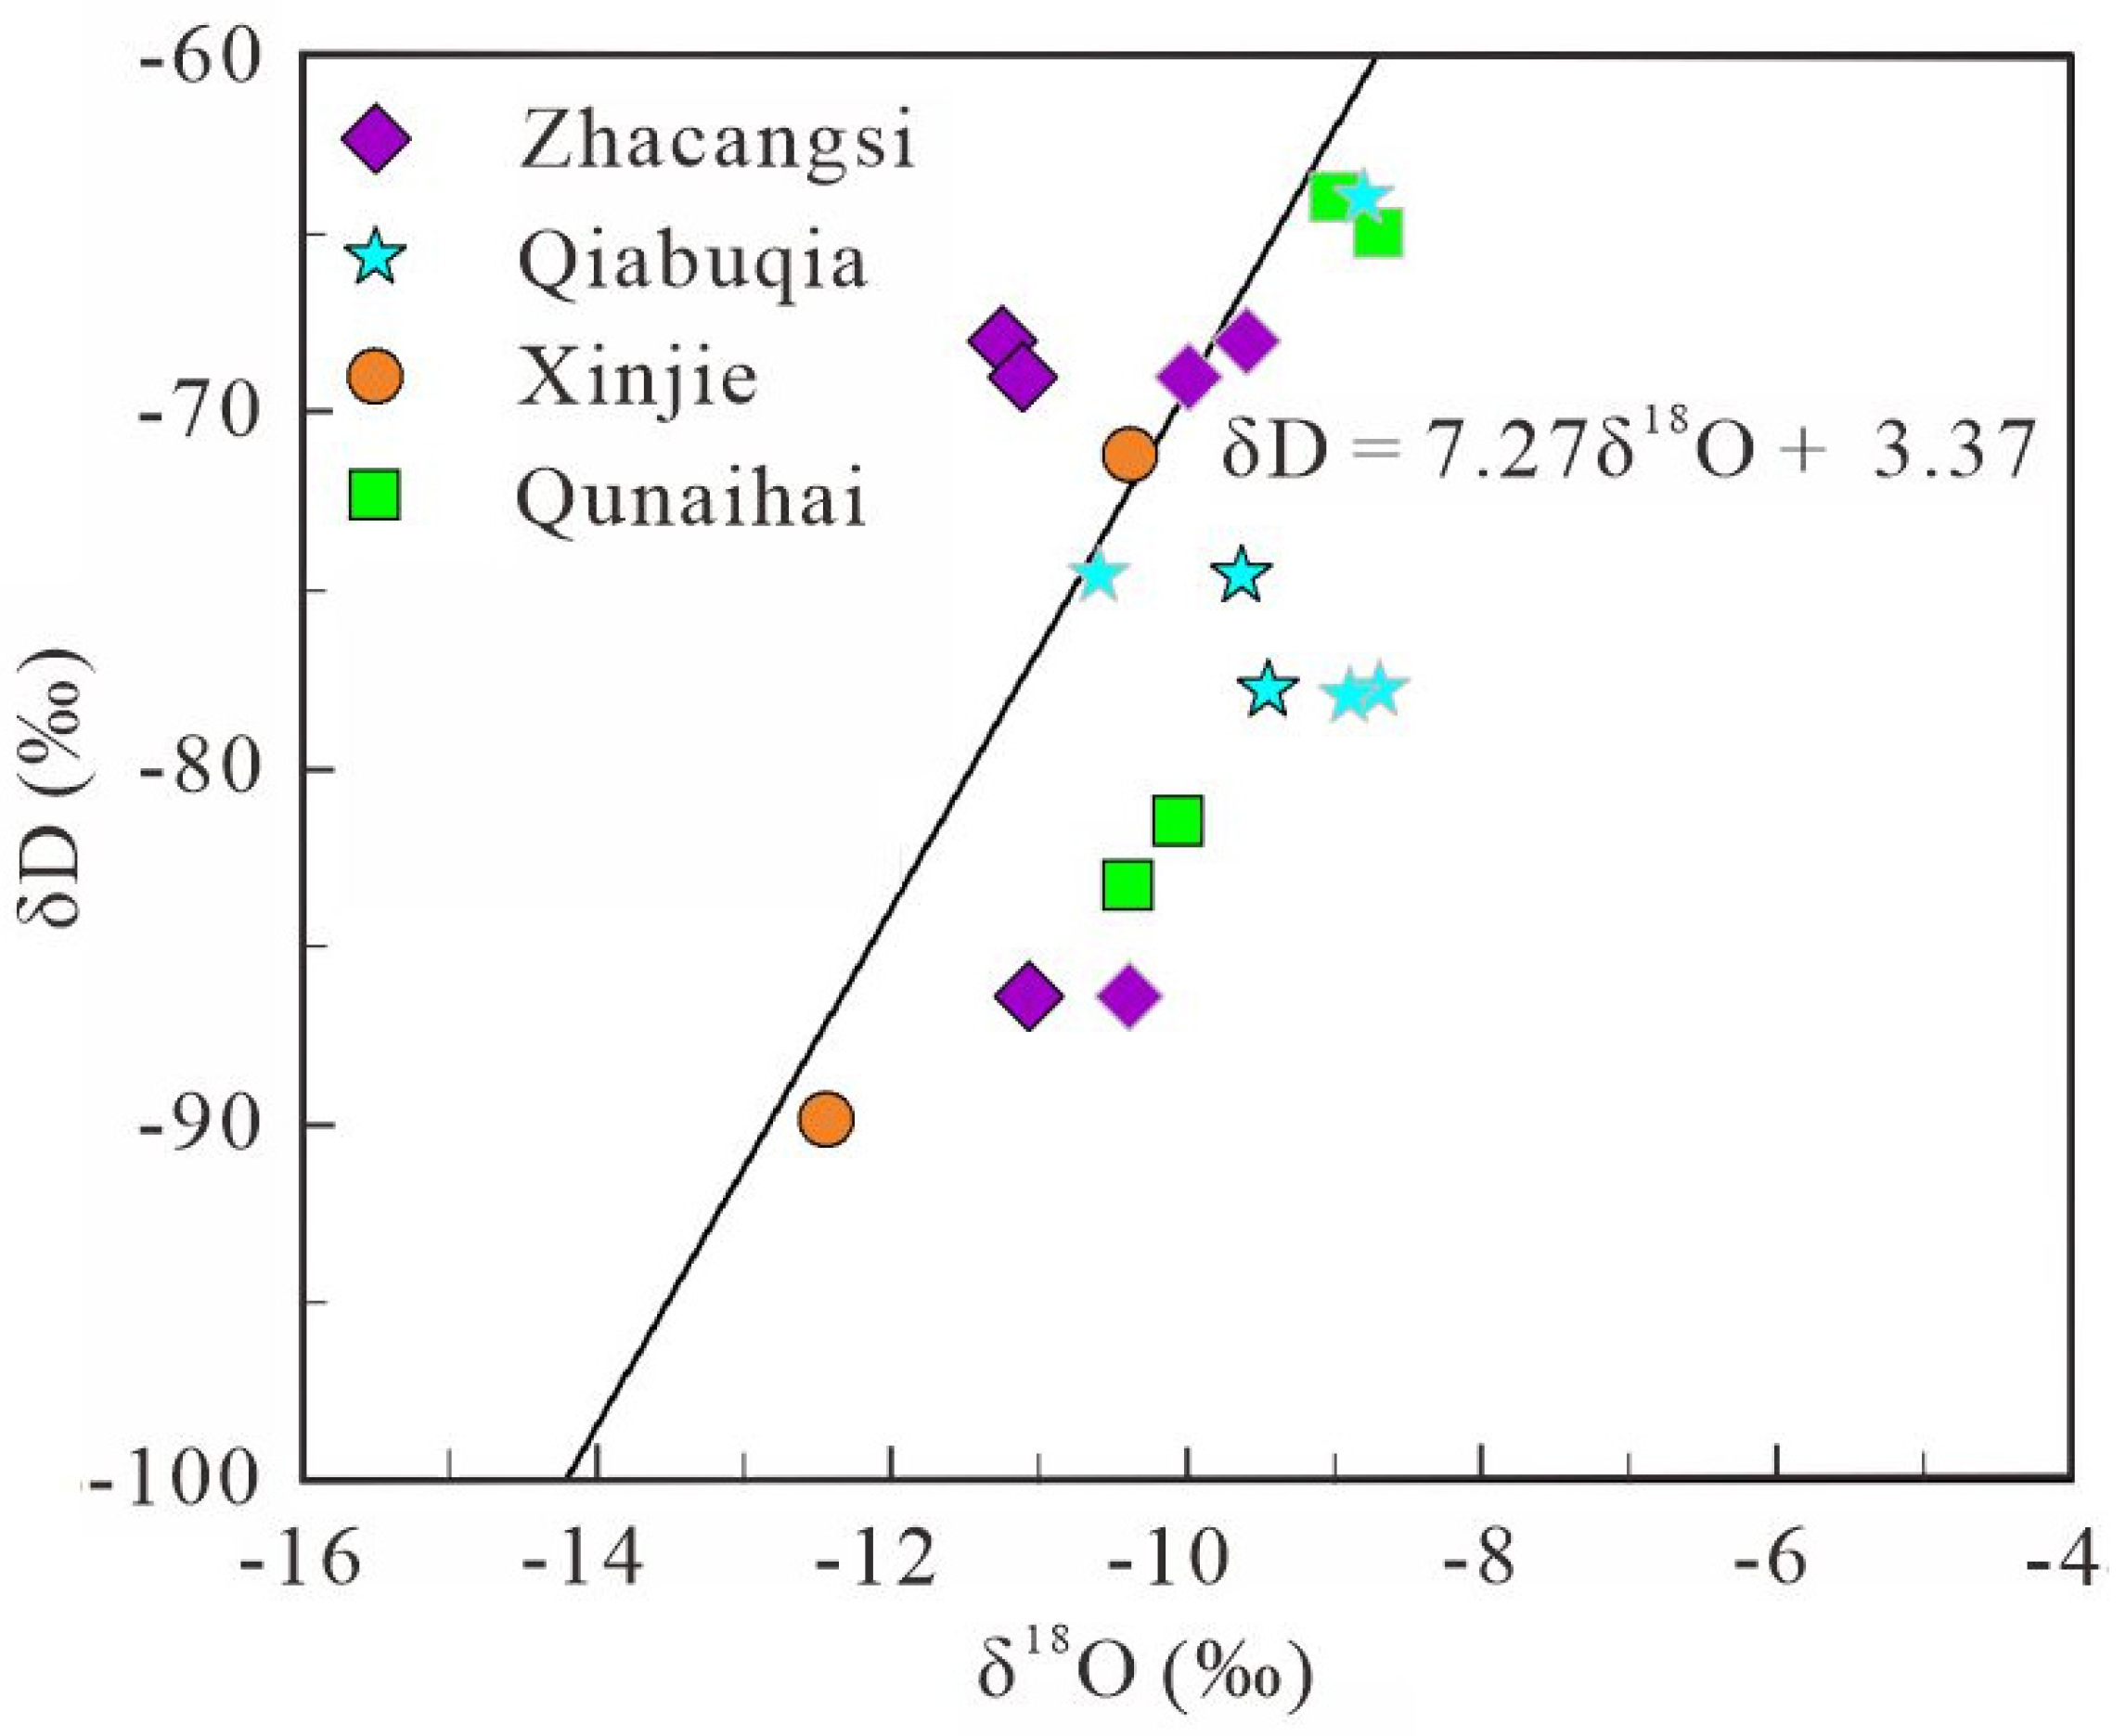
5.1.1. Deuterium and Oxygen Stable Isotopes Characteristics

The deuterium and oxygen isotope results of geothermal water in the study area were compared with the local meteoric water line (LMWL) of δD (‰) = 7.27δ18O + 3.37 [40]. As shown in Figure 4, the collected samples are distributed along the local atmospheric precipitation line similarly to the previous samples. This indicates the recharge source may be alpine snowmelt water or high-altitude atmospheric precipitation. With respect to the LMWL, the positive shift of the oxygen isotope from the geothermal water is interpreted as an exchange of 18O between water and enriched heavy oxygenic rock under high temperatures (>150 °C).

5.1.2. Recharge Elevation

The δD and δ18O values of meteoric precipitations have an elevation effect [41] with a negative correlation between the isotope value and altitude. Therefore, the average elevation of the groundwater recharge zone in the aquifer can be calculated. Since the values of δD and δ18O of atmospheric precipitation near the groundwater samples sites are known, the recharge elevation can be obtained according to the following equation:
H = δ S δ d K + h
where H is the recharge elevation (m), S is the isotopic composition of the water sample (‰), d is the isotopic composition of atmospheric precipitation near the sampling site (‰), K is the isotopic elevation gradient (−n‰/100 m), and h is the elevation of the sampling site (m).
Generally, the isotopic elevation gradient (K) varies from −0.15‰/100 m to −0.5‰/100 m for δ18O and from −1.2‰ to −4‰ for δD [42]. Li et al. obtained an elevation gradient of δD in the eastern Tibetan Plateau of −2.6‰/100 m, and an elevation gradient of δ18O of −0.4‰/100 m [43]. We collected local isotopic data of atmospheric precipitation with δd values of −7.82‰ and −51.3‰ [44]. We then calculated the corresponding recharge elevation of geothermal water (Table 5). The S1, S2, S3, S4, S7, and S8 samples occurred during oxygen transfer, resulting in differences in recharge elevations calculated using δ18O values, so only stable hydrogen isotopes were used to calculate recharge elevations for these samples. The calculated recharge elevations are 3000–4600 m. Therefore, the sources of groundwater recharge are likely atmospheric precipitation from the surrounding hills and meltwater from the western snow-capped mountains.
The O isotope exchange between water and rock can lead to a water body relatively rich in 18O, and was firstly proposed to result from an excess deuterium parameter d = δD − 8δ18O [45]. With greater water–rock interactions, when the exchange of O isotopes between water and rocks is greater, the d value of groundwater is smaller. In addition, deuterium excess (d) is an effective parameter to express the degree of deviation of groundwater isotopes relative to local atmospheric precipitation.
Table 6 shows the deuterium excess values of underground geothermal water are between −1.02‰ and 11.91‰, indicating a normal atmospheric precipitation supply. Specifically, the d values of the S1, S2, S3, S4, S7, and S8 samples are significantly smaller than that of other geothermal water samples, suggesting a strong water–rock interaction to result in oxygen shift and slow the groundwater runoff rate. The retention time in the aquifer is relatively long, and the renewal alternating ability is relatively weak.

5.2. Hydrogeochemical Processes

5.2.1. General Hydrogeochemistry

The principal component contents of the water samples of various types are presented in the Schoeller diagram (Figure 5) to compare the different characteristics of hydrochemistry types between geothermal water and cold water in different areas. There is a similar trend of ion variation in different regions and types of groundwater. It can be seen from Figure 5 that the main performance of river water is Ca2+ > Mg2+ > Na+ + K+ and HCO3 > SO42−> Cl, and geothermal water is Na+ + K+ > Ca2+ > Mg2+, SO42− > Cl > HCO3 and SO42− > HCO3 > Cl. It is indicated that they have experienced similar recharge, runoff, and circulation processes.

5.2.2. Hydrochemical Facies Variation

Generally, Cl is present in almost all groundwater and primarily comes from salt rock dissolutions [46,47]. The strong electrolytes of chloride salt determine its large solubility. Even at high temperatures, it is rare for the water–rock interaction to affect the existence of Cl. Thus, Cl is often used to trace the sources of geothermal water and other substances with good correlations in the system [46,48].
The relationships between the concentration of primary ions and Cl in the water samples are shown in Figure 6. The higher Na+/Cl and K+/Cl of the geothermal water ratios than that of cold water indicate the former participates in longer and deeper regional flow paths. The relatively high Ca2+/Cl ratio in river water may be due to the dissolution of calcite or dolomite from the Neogene sediments, whereas the lower Ca2+/Cl ratio in geothermal water may reflect calcite precipitation along the way. Higher HCO3−/Cl ratios in river water reflect a short flow path and rapid water circulation, whereas the lower HCO3−/Cl ratios in geothermal water indicate that geothermal water flowed through a longer flow path underground. The strong relationship between HCO3− and Cl and SO42− and Cl suggests that geothermal water is diluted by cold water.
The ratio coefficients between different chemical compositions in groundwater can be used to research certain hydrogeochemical processes. By analyzing the characteristic coefficients of geothermal water, the geological environment in which the geothermal fluid is present can be determined, and the hydrochemical characteristic coefficients of geothermal water in the research area are shown in Table 7.
The alteration coefficient γNa+/γCl is used to describe the degree of groundwater metamorphism, the hydrogeochemical environment, and the confinement of the geothermal reservoir. The smaller the metamorphic coefficient, the better the aquifer confinement and the greater the extent of metamorphism. The metamorphic coefficient of Zhacang geothermal water ranges from 1.30 to 1.46 and the metamorphic coefficient of Xinjie geothermal water ranges from 6.74 to 9.83. Therefore, the geothermal reservoir of Zhacang has better confinement, a higher degree of metamorphism, and a more reductive environment. The metamorphic coefficients of both geothermal reservoirs are greater than 1, indicating that the geothermal water formation in these two reservoirs is influenced by the infiltration of atmospheric precipitation, and the Xinjie geothermal reservoir is more influenced by infiltrated water. The desulfurization coefficient 100 × γSO42−/γCl is used to denote the groundwater desulfurization degree. If the desulfurization coefficient is smaller, it means that the environment in which the geothermal water is contained is better and the reduction is higher. If the desulfurization coefficient is less than 1, it means that the environment where the aquifer is located is completely reduced. The 100 × γSO42−/γCl in the Zhacang geothermal reservoir ranges from 165.34 to 181.15 and the 100 × γSO42-/γCl in the Xinjie geothermal reservoir ranges from 595.85 to 1360.47, which indicate that the geothermal water of both reservoirs is desulfated to some degree, and the geological environment is more reductive. The salinization coefficient γCl/(γHCO3 + CO32−) can reflect the salinization degree of groundwater, and the higher the salinization coefficient, the greater the salinization degree of groundwater. The γCl/(γHCO3 + CO32−) of Zhacang geothermal water in the study area ranged from 5.36 to 7.90, with a mean value of 6.52; the γCl/(γHCO3 + CO32−) of Xinjie geothermal water ranged from 0.07 to 0.10, with a mean value of 0.08. This indicates that the runoff path of Zhacang geothermal water is longer than that of Xinjie geothermal water, the water circulation rate is slower, and the salinization rate is stronger.

5.3. Deep Circulation of Geothermal Fluid

The age of the minerals, the value of initial 87Sr/86Sr at the time of rock formation, and the Rb/Sr ratio together determine the ratio of 87Sr/86Sr. The variable amount of radioactive 87Sr is produced by the decay of 87Rb in rocks [49,50]. Nevertheless, the residence time of groundwater is very short compared to the half-life of 87Rb, so the radioactivity of 87Sr can be neglected during groundwater movement. Due to its large mass number, the isotope mass fractionation of strontium isotopes during mineral dissolution and precipitation is also negligible. Thus, isotopes of strontium in water have the advantage of retaining the isotopic properties from rocks of their origin, such as silicates and carbonates. The values of 87Sr/86Sr in the Gonghe Basin are comparatively uniform, in the range of 0.711 to 0.714, which are more positive than that of the homogenous mantle (0.702–0.705) and marine carbonate (0.707–0.709) [51,52]. The geothermal water flows through the aquifer of the Triassic clastic rock and Neogene sandstone and mudstone in the Gonghe Basin, which significantly contribute to increased 87Sr/86Sr values in the geothermal waters.
Radioisotopes are primarily used to determine the age of groundwater in hydrogeology, which refers to the time that water is retained in an aquifer [53,54]. It reflects the closed conditions of the groundwater occurrence environment and its relationship with other water environments, so the determination of groundwater age is helpful to determine the recharge cycle of groundwater resources [55].
This study applies the 14C method to determine the specific age of geothermal water collected from the Gonghe Basin. The upper limit of 14C dating is 50,000–60,000 years, with a maximum of 70,000 years [56]. According to the different hydrogeochemical conditions of the groundwater system, the Pearson model was used to correct the age [57].
Due to the variety of carbon sources in groundwater, there are still difficulties in obtaining the correct ages using 14C. Therefore, 3H has been chosen to assist in determining the age of groundwater. Only six sets of water samples have been tested for tritium (Table 2), and the age of geothermal water is estimated using qualitative methods as listed in Table 8 [30]. According to statistics, most of the geothermal water in the study area has a tritium value of less than 3 and is only one point greater than 5, indicating that the recharge source of geothermal water is essentially a mixture of submodern and recent recharge water. This is consistent with the above analysis of the retention time of geothermal in the aquifer, and the corrected age was approximately 16,300–17,300 years (Table 9).

5.4. Heat Source and Reservoir Temperature

Gas sources are usually identified by plotting the R/Ra ratio versus the 4He/20Ne ratio [58,59,60]. The three end members of the bottom diagram as mixing lines are the atmosphere, the mantle, and the crust. Their coordinates are (R/Ra = 1, 4He/20Ne = 0.318), (R/Ra = 8, 4He/20Ne = 1 × 10³), and (R/Ra = 0.02, 4He/20Ne = 1 × 10³), respectively [61,62]. The 3He/4He ratio is generally denoted as R. The atmospheric 3He/4He ratio Ra is 1.384 × 10⁻⁶ [63,64].
The 3He/4He ratios of the Gonghe Basin geothermal waters range from 0.03 to 0.84 Ra, indicating that no more than 3% of helium originates from the mantle. The air pollution of most gas samples is approximately 1%, except two samples fall in the range between 20% and 50% (Figure 7). We interpret that the two abnormal data were polluted by air when they were sampled. The remaining four data show that in the geothermal system, the mantle material’s contribution to the gas is very weak. Therefore, based on the tritium contents and Helium compositions, we conclude that the major source of heat for the geothermal system in the Gonghe Basin is primarily the crust.
The geothermometer relies on the relationship between the balance temperature of geothermal water and some minerals to estimate the reservoir temperature [65]. It is based on the equilibrium state of minerals and water within the deep geothermal reservoir, meaning that with the flow of thermal water from deep to shallow areas, the temperature decreases but the chemistry remains relatively stable, so it can be used to estimate the temperature of the geothermal reservoir. The selection of various geothermometers to calculate the reservoir temperature requires balance with the minerals in the geothermal reservoir [66,67]. In this study, nine geothermometers (Table 10) are selected for calculating the balance temperature (Table 11). During the upward migration of geothermal water, the content of the chemical components of the thermal fluid will be changed due to boiling and steam escape or dilution and mixing of the geothermal water and river water, which could destroy the original high-temperature equilibrium environment. This reaction leads to an imbalance between the chemical composition of the geothermal temperature and the minerals in the geothermal reservoir. Therefore, before calculating the thermal storage temperature, it is necessary to judge the water–rock mineral balance state of the geothermal water in the ground and analyze the reliability of the use of the geothermal temperature scale.
The Na-K-Mg ternary diagram provides a way to classify geothermal water as fully equilibrated with the rock, partially equilibrated, or immature. This demonstrates whether the solute thermometer is applicable to geothermal water [68,69]. Some water samples of geothermal water from the Gonghe Basin are located near fully equilibrated mineral dissolution lines (Figure 8). Under these conditions, the water–rock reactions reached equilibrium. The temperature of the geothermal reservoir resulting from the Na-K-Mg triangulation is approximately 160 °C. The distribution of water samples along the mixing line suggests a tendency to mix with cold water.
The multi-mineral equilibrium method uses the relationship between the dissolution state of multiple minerals in the geothermal system and the temperature of geothermal water, and when multiple mineral components in the geothermal system reach the dissolution equilibrium at the same time, this temperature is the geothermal reservoir temperature [70]. The solubility state of multiple minerals is drawn as a function of temperature. If some or more minerals are close to equilibrium for a given temperature, the geothermal fluid and the mineral will reach equilibrium, and the equilibrium temperature is the heat storage temperature. The saturation index of each mineral was calculated using PREEQC software. The saturation index (SI) is defined as SI = Log(Q/K), where Q is the anion and cation activity product of a certain mineral in an aqueous solution; K is the mineral equilibrium constant at a certain temperature, which depends on the available thermodynamic database. Since the rocks in the working area of Gonghe Basin are primarily sandstone and granite, minerals such as dolomite, quartz, calcite, K-feldspar, chalcedony, chlorite, and Ca-Montmorillonite were selected for calculation, and the saturation index (SI) and temperature curves were drawn (Figure 9). To remove the influence of CO2 degassing, the geothermal water is supplemented with an equal amount of CO2. In samples S3 and S4, 0.01 mol/L of CO2 was added to the fluid, and 0.05 mol/L of CO2 was added to S5 and S6 [71,72]. It can be seen from the figure that multiple mineral saturation index curves converge at one point simultaneously, so the geothermal reservoir temperature is estimated to be approximately 160–170 °C.
Considering the result of the Giggenbach diagram, Na-K geothermometer, and multi-mineral balance method with excellent concordance, the geothermal reservoir temperature of geothermal water in the Gonghe Basin can be appropriately estimated at 160 ± 10 °C.
Geothermal water is generally heated up by geothermal sources during deep circulation. For a detailed understanding of geothermal water origin in the Gonghe Basin, the circulation depth of the geothermal water was estimated. The circulation depth can be roughly estimated by the following Formula (2). The calculated circulation depth is approximately 2200–2500 m.
H = T T 0 Δ t + h
where H is the depth of circulation (m), T0 is the constant temperature (°C), Δt is the geothermal gradient, and h is the depth of the constant temperature zone.
According to the statistical results of the weather stations in the study area, the annual average temperature in the Gonghe Basin is 3.9 °C. The average geothermal gradient is 6.7–6.8 °C/100 m [21], and we take 6.7 °C/100 m for calculation. The constant temperature zone depth is 20 m based on experience.
For igneous rocks and metamorphic rocks, the aquifers are primarily distributed in strata containing fractures. When fractured zones appear in the strata or fractures develop in the strata, the strata in this section may contain water. Through the analysis of the logging data in the 2280–2400 m interval (Figure 10), we also found that the sound amplitude scanning image of this interval has a relatively obvious strip pattern, and the number of fractures increased sharply, which further indicates that there are cracks in this interval, which is consistent with the calculation results.

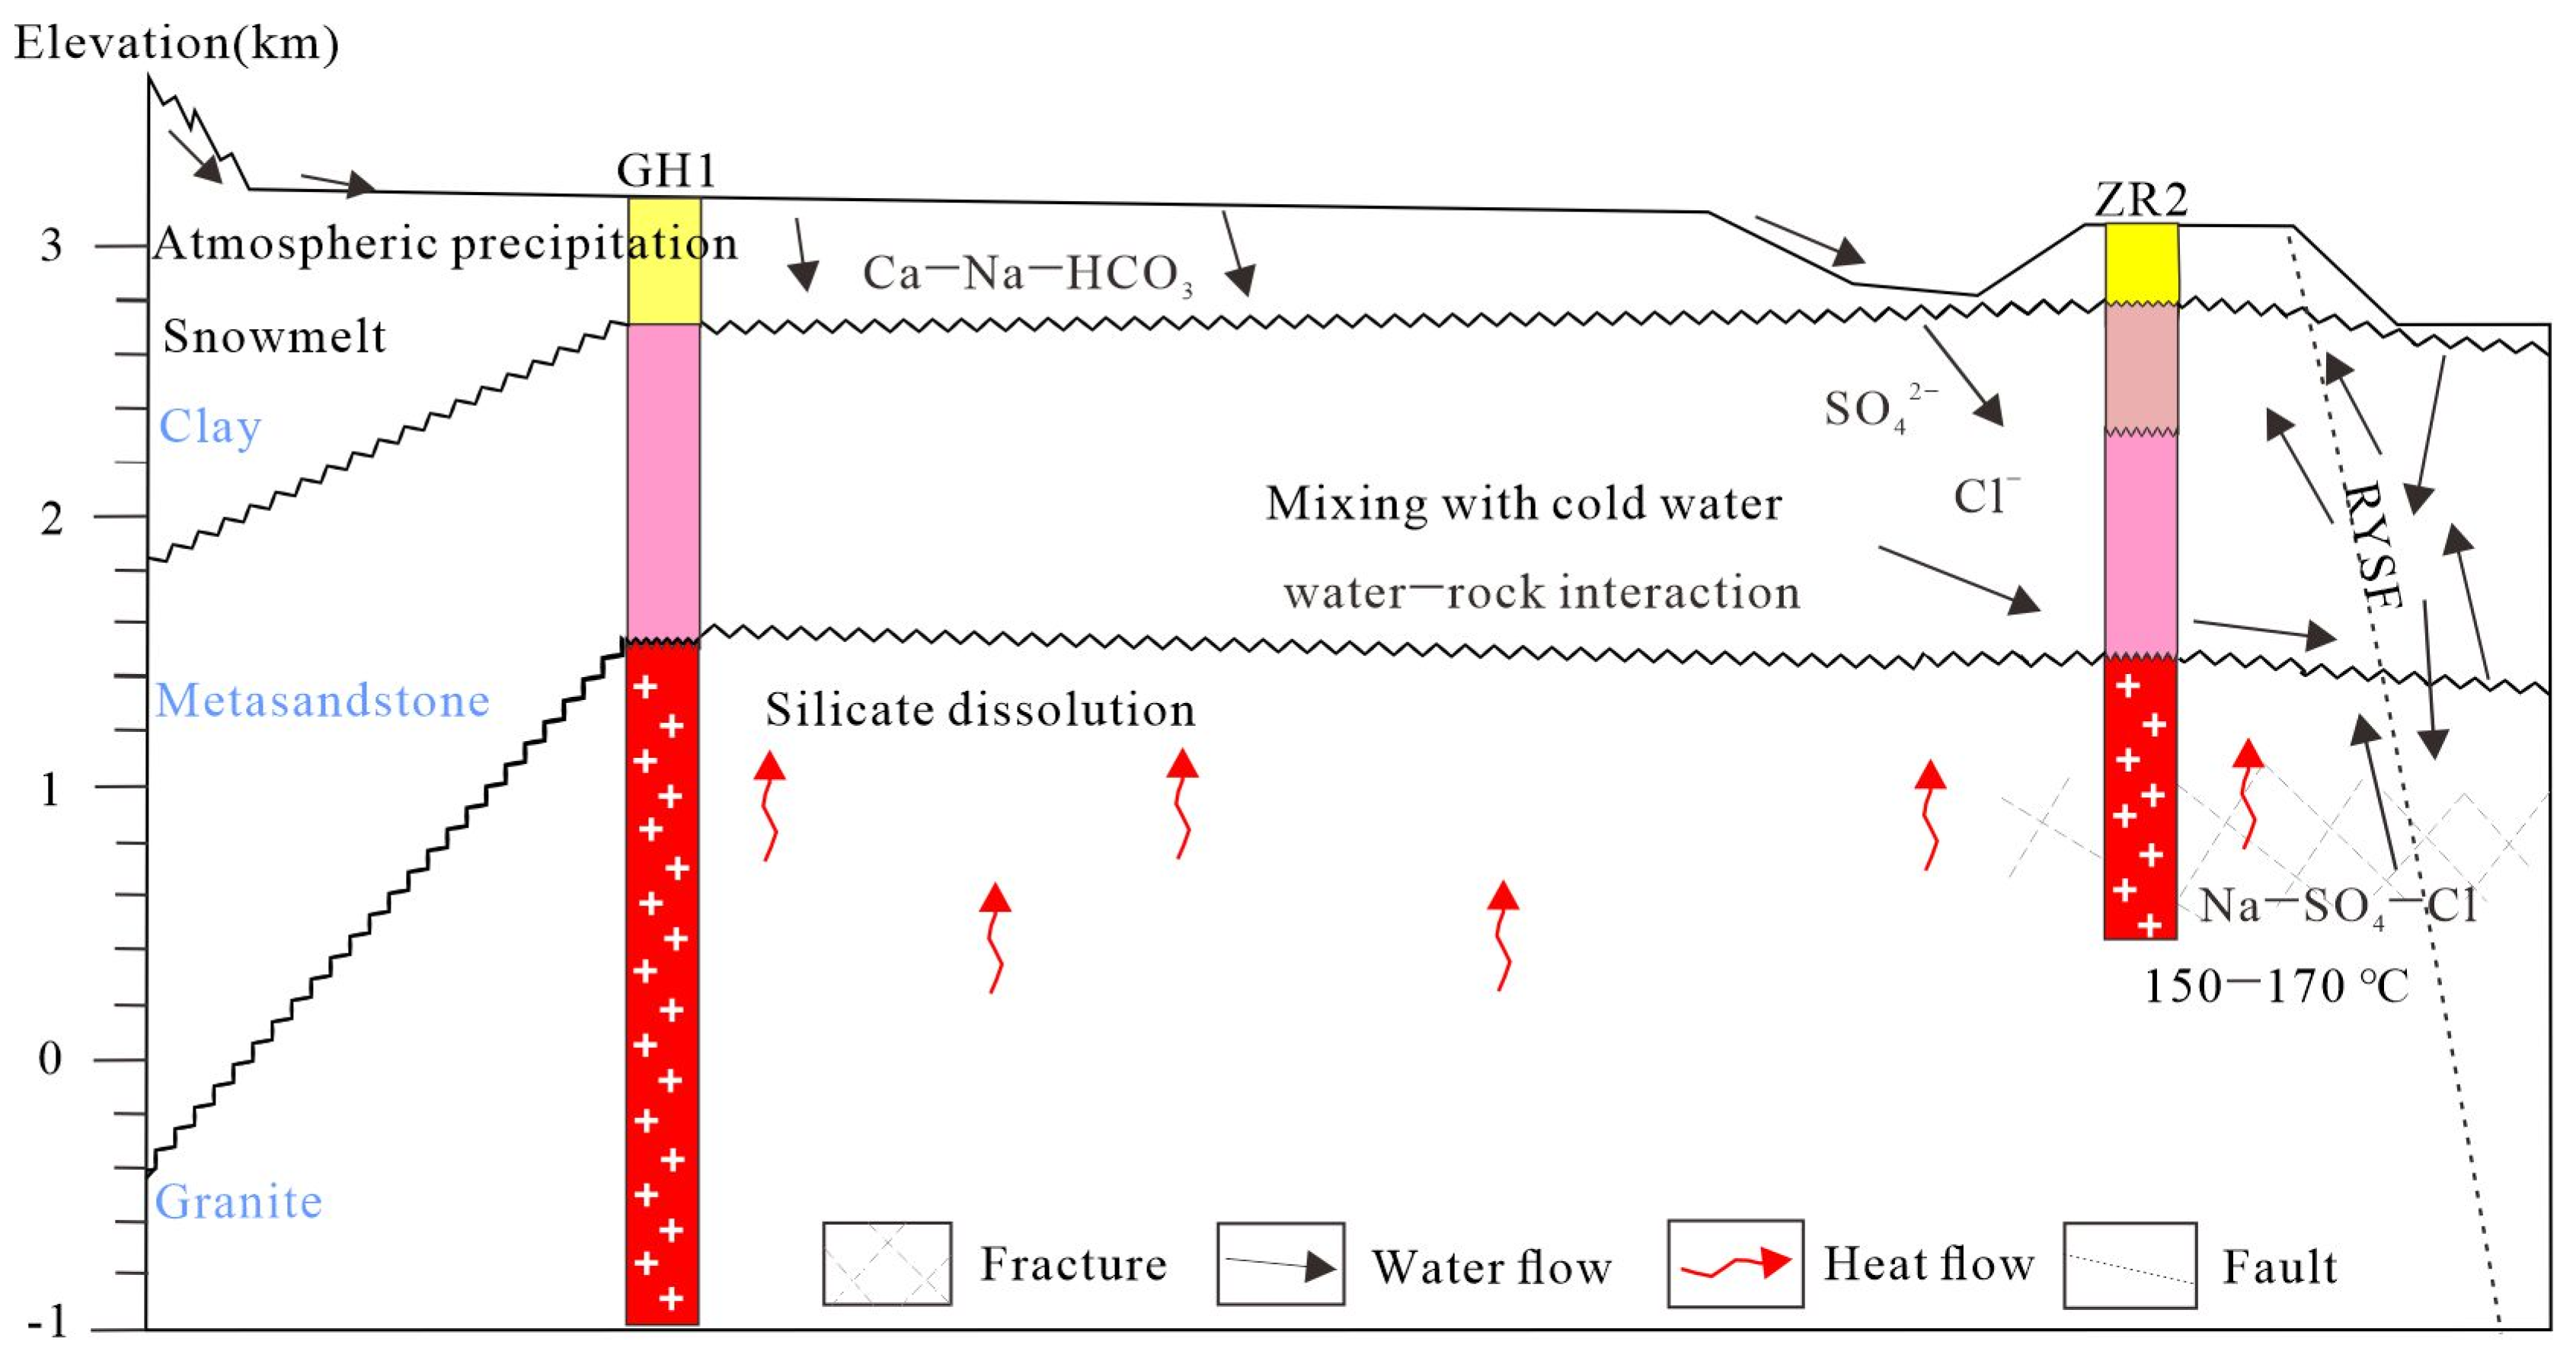
5.5. Conceptual Model of the Gonghe Geothermal System

Based on the discussion of the geological environment and geothermal fluid characteristics, a diagram of the genesis model of the geothermal system in the Gonghe Basin is proposed (Figure 11). Snowmelt from the surrounding high mountains or atmospheric precipitation recharges the geothermal water. According to the elevation effect of hydrogen and oxygen isotopes, the recharge elevation is estimated to be 3000–4600 m. The Gonghe basin is high in the west and low in the east. The mountain snowmelt in the west and atmospheric precipitation infiltrate and migrate laterally along the loose sediment and sandstone, and some of them flow into rivers and migrate with surface water, while the other part migrated along the fault to the deep area. Long-term groundwater with an age of approximately 16,300–17,300 years flows at depth and absorbs heat from the surrounding thermal rocks, resulting in a deeply flowing fluid with a temperature of approximately 160 ± 10 °C. The circulation depth is estimated to be approximately 2–3 km. The low thermal conductivity of the overlying Cenozoic clastic sedimentary rocks in the study area can be considered a good cover for geothermal systems. Geothermal fluids are transported upward to the surface through deep faults and fractures under the effect of a pressure difference, forming an abnormal geothermal water region.

6. Conclusions

Taking the hydrochemistry and isotopic composition (δD, δ18O, δT, δ13C, δ14C, 87Sr/86Sr, and 3He/4He) in the area as the study objects, combined with regional geological information and drilling results, the conclusions are as follows:
The main cations are Na+ and Ca2+ and the main anions are SO42−, Cl, and HCO3 in the geothermal water of the Gonghe Basin, and the hydrochemical chemistry type is primarily Na-SO4-Cl. When the fluid flowed through the Triassic silicate reservoir, the water–rock reaction occurred with the surrounding rocks. During upward flow, deep geothermal water suffered different degrees of the cooling process, alone or simultaneously with the cold-water mixing process and transfer cooling process.
The results of oxygen and hydrogen isotope tests and the elevation effects of hydrogen and oxygen isotopes indicate that the geothermal water originated from atmospheric precipitation or snowmelt water from the high surrounding mountains, and the geothermal fluid experiences oxygen drift under the high-temperature underground environment. The isotopic ratios of helium range from 0.03 to 0.84 Ra, suggesting a predominantly atmospheric and crustal source. According to 14C, 13C, and the tritium isotope, we determined the corrected age of groundwater as approximately 16,300–17,300 years and the result of mixtures of submodern and recent recharge water sources.
The cationic geothermometer, Na-K-Mg geothermometer, and multi-mineral equilibrium methods were used to calculate the geothermal reservoir temperature in the Gonghe Basin to be 160 ± 10 °C with a circulation depth of approximately 2200–2500 m.

Author Contributions

S.L.: Wrote the manuscript and interpreted the results. X.T.: Designed the study, wrote the manuscript, and interpreted and geological application. X.H.: Sampling and data analyses. D.Z.: Field investigation and sampling. G.W.: Direction. All authors have read and agreed to the published version of the manuscript.

Funding

The study was supported by the National Nature Science Foundation of China (Nos. 41877197 and 41602257), China Geology Survey Grants (No. DD20190132 and DD20221677).

Data Availability Statement

All the data are presented in the tables.

Acknowledgments

We thank FT Yang from Jilin University for his help in sample collection and testing.

Conflicts of Interest

The authors declare no conflict of interest.

References

  1. Tang, X.; Liu, S.; Zhang, D.; Wang, G.; Luo, Y.; Hu, S.; Xu, Q. Geothermal Accumulation Constrained by the Tectonic Transformation in the Gonghe Basin, Northeastern Tibetan Plateau. Lithosphere 2022, 2022, 3936881. [Google Scholar] [CrossRef]
  2. Hu, S.; He, L.; Wang, J. Compilation of heat flow data in the China continental area(3rd edition). Chin. J. Geophys. 2001, 44, 611–626. [Google Scholar] [CrossRef]
  3. Xue, J.; Gan, B.; Li, B.; Wang, Z. Geological-geophysical characteristics of enhanced geothermal systems (hot dry rocks) in Gonghe-guide Basin. Geophys. Geochem. Explor. 2013, 37, 35–41. [Google Scholar]
  4. Zhang, S.; Yan, W.; Li, D.; Jia, X.; Zhang, S.; Li, S.; Fu, L.; Wu, H.; Zeng, Z.; Li, Z.; et al. Characteristics of geothermal geology of the Qiabuqia HDR in Gonghe Basin, Qinghai Province. Geol. China 2018, 45, 1087–1102. [Google Scholar]
  5. Tang, X.; Wang, G.; Zhang, D.; Ma, Y. Coupling Mechanism of Geothermal Accumulation and the Cenozoic Active Tectonics Evolution in Gonghe Basin, Northeastern Margin of the Tibetan Plateau. Acta Geosci. Sin. 2023, 44, 7–20. [Google Scholar]
  6. Sun, Z.; Li, B.; Wang, Z. Explortion of the possibility of hot dry rock occurring in the Qinghai Gonghe Basin. Hydrogeol. Eng. Geol. 2011, 38, 119–124+129. [Google Scholar] [CrossRef]
  7. Yan, W.; Wang, Y.; Gao, X.; Zhang, S.; Ma, Y.; Shang, X.; Guo, S. Distribution and Aggregration Mechanism of Geothermal Energy in Gonghe Basin. Northwest. Geol. 2013, 46, 223–230. [Google Scholar]
  8. Zhang, C.; Jiang, G.; Shi, Y.; Wang, Z.; Wang, Y.; Li, S.; Jia, X.; Hu, S. Terrestrial heat flow and crustal thermal structure of the Gonghe-Guide area, northeastern Qinghai-Tibetan plateau. Geothermics 2018, 72, 182–192. [Google Scholar] [CrossRef]
  9. Gao, J.; Zhang, H.; Zhang, S.; Chen, X.; Cheng, Z.; Jia, X.; Li, S.; Fu, L.; Gao, L.; Xin, H. Three-dimensional magnetotelluric imaging of the geothermal system beneath the Gonghe Basin, Northeast Tibetan Plateau. Geothermics 2018, 76, 15–25. [Google Scholar] [CrossRef]
  10. Tang, X.; Wang, G.; Ma, Y.; Zhang, D.; Liu, Z.; Zhao, X.; Cheng, T. Geological model of heat source and accumulation for geothermal anomalies in the Gonghe basin, northeastern Tibetan Plateau. Acta Geol. Sin. 2020, 94, 2052–2065. [Google Scholar] [CrossRef]
  11. Feng, Y.-f.; Zhang, X.-x.; Zhang, B.; Liu, J.-t.; Wang, Y.-g.; Jia, D.-l.; Hao, L.-r.; Kong, Z.-y. The geothermal formation mechanism in the Gonghe Basin: Discussion and analysis from the geological background. China Geol. 2018, 1, 331–345. [Google Scholar] [CrossRef]
  12. Lang, X.; Lin, W.; Liu, Z.; Xing, L.; Wang, G. Hydrochemical Characteristics of Geothermal Water in Guide Basin. Earth Sci. 2016, 41, 1723–1734. [Google Scholar]
  13. Li, X.; Wu, G.; Lei, Y.; Li, C.; Zhao, J.; Bai, Y.; Zeng, Z.; Zhao, Z.; Zhang, S.; Zhao, A. Suggestions for Geothermal Genetic Mechanismand Exploiation of Zhangcang Temple Geothermal Energy in Guide County, Qinghai Province. J. Jilin Univ. 2016, 46, 220–229. [Google Scholar] [CrossRef]
  14. Jiang, Z.; Xu, T.; Mallants, D.; Tian, H.; Owen, D.D.R. Numerical modelling of stable isotope (2H and 18O) transport in a hydrogeothermal system: Model development and implementation to the Guide Basin, China. J. Hydrol. 2019, 569, 93–105. [Google Scholar] [CrossRef]
  15. Zhang, G.; Guo, A.; Yao, A. Western Qinling—Songpan continental tectonic node in China’s continental tectonics. Earth Sci. Front. 2004, 11, 23–32. [Google Scholar]
  16. Zeng, L.; Zhang, K.-J.; Tang, X.-C.; Zhang, Y.-X.; Li, Z.-W. Mid-Permian rifting in Central China: Record of geochronology, geochemistry and Sr-Nd-Hf isotopes of bimodal magmatism on NE Qinghai-Tibetan Plateau. Gondwana Res. 2018, 57, 77–89. [Google Scholar] [CrossRef]
  17. Zhang, K.J. Escape hypothesis for North and South China collision and tectonic evolution of the Qinling orogen, eastern Asia. Eclogae Geol. Helv. 2002, 95, 237–247. [Google Scholar]
  18. Jiang, G.; Hu, S.; Shi, Y.; Zhang, C.; Wang, Z.; Hu, D. Terrestrial heat flow of continental China: Updated dataset and tectonic implications. Tectonophysics 2019, 753, 36–48. [Google Scholar] [CrossRef]
  19. Hu, S.B.; He, L.J.; Wang, J.Y. Heat flow in the continental area of China: A new data set. Earth Planet. Sci. Lett. 2000, 179, 407–419. [Google Scholar] [CrossRef]
  20. Klyuev, R.V.; Golik, V.I.; Bosikov, I.I. Comprehensive assessment of hydrogeological conditions for the formation of mineral water resources of the Nizhne-Karmadon deposit. Bull. Tomsk. Polytech. Univ.-Geo Assets Eng. 2021, 332, 206–218. [Google Scholar] [CrossRef]
  21. Yan, W. Characteristics of Gonghe Basin hot dry rock and its utilization prospects. Sci. Technol. Rev. 2015, 33, 54–57. [Google Scholar]
  22. Chandrajith, R.; Barth, J.A.C.; Subasinghe, N.D.; Merten, D.; Dissanayake, C.B. Geochemical and isotope characterization of geothermal spring waters in Sri Lanka: Evidence for steeper than expected geothermal gradients. J. Hydrol. 2013, 476, 360–369. [Google Scholar] [CrossRef]
  23. Cinti, D.; Tassi, F.; Procesi, M.; Brusca, L.; Cabassi, J.; Capecchiacci, F.; Delgado Huertas, A.; Galli, G.; Grassa, F.; Vaselli, O.; et al. Geochemistry of hydrothermal fluids from the eastern sector of the Sabatini Volcanic District (central Italy). Appl. Geochem. 2017, 84, 187–201. [Google Scholar] [CrossRef]
  24. Fusari, A.; Carroll, M.R.; Ferraro, S.; Giovannetti, R.; Giudetti, G.; Invernizzi, C.; Mussi, M.; Pennisi, M. Circulation path of thermal waters within the Laga foredeep basin inferred from chemical and isotopic (delta 18O, delta D, 3H, 87Sr/86Sr) data. Appl. Geochem. 2017, 78, 23–34. [Google Scholar] [CrossRef]
  25. Elderfield, H. Strontium isotope stratigraphy. Palaeogeogr. Palaeoclimatol. Palaeoecol. 1986, 57, 71–90. [Google Scholar] [CrossRef]
  26. Palmer, M.R.; Edmond, J.M. Controls over the strontium isotope composition of river water. Geochim. Cosmochim. Acta 1992, 56, 2099–2111. [Google Scholar] [CrossRef]
  27. Bottomley, D.J.; Gregoire, D.C.; Raven, K.G. Saline groundwaters and brines in the canadian shield—Geochemical and isotopic evidence for a residual evaporite brine component. Geochim. Cosmochim. Acta 1994, 58, 1483–1498. [Google Scholar] [CrossRef]
  28. Bullen, T.D.; Krabbenhoft, D.P.; Kendall, C. Kinetic and mineralogic controls on the evolution of groundwater chemistry and Sr-87/Sr-86 in a sandy silicate aquifer, northern Wisconsin, USA. Geochim. Cosmochim. Acta 1996, 60, 1807–1821. [Google Scholar] [CrossRef]
  29. Hou, Z.Y.; Xu, T.F.; Li, S.T.; Jiang, Z.J.; Feng, B.; Cao, Y.Q.; Feng, G.H.; Yuan, Y.L.; Hu, Z.X. Reconstruction of different original water chemical compositions and estimation of reservoir temperature from mixed geothermal water using the method of integrated multicomponent geothermometry: A case study of the Gonghe Basin, northeastern Tibetan Plateau, China. Appl. Geochem. 2019, 108, 104389. [Google Scholar] [CrossRef]
  30. Li, Y. Hydrogeochemical Characteristics and Its Origin Analysis of Geothermal Water in the Qia Bu-Qia Area, GongHe Basin. Master’s Thesis, East China University of Technology, Shanghai, China, 2016. [Google Scholar]
  31. Pan, S.; Kong, Y.; Wang, K.; Ren, Y.; Pang, Z.; Zhang, C.; Wen, D.; Zhang, L.; Feng, Q.; Zhu, G.; et al. Magmatic origin of geothermal fluids constrained by geochemical evidence: Implications for the heat source in the northeastern Tibetan Plateau. J. Hydrol. 2021, 603, 126985. [Google Scholar] [CrossRef]
  32. Liu, M.; Guo, Q.; Zhang, X.; Luo, J.; Li, J.; Zhou, C.; Guo, W.; Zhang, C.; Zhu, M. Geochemistry of geothermal waters from the Gonghe region, Northwestern China: Implications for identification of the heat source. Environ. Earth Sci. 2016, 75, 682. [Google Scholar] [CrossRef]
  33. Oxburgh, E.R.; Onions, R.K. Helium loss, tectonics, and the terrestrial heat-budget. Science 1987, 237, 1583–1588. [Google Scholar] [CrossRef] [PubMed]
  34. Taran, Y.A. Geochemistry of volcanic and hydrothermal fluids and volatile budget of the Kamchatka-Kuril subduction zone. Geochim. Et Cosmochim. Acta 2009, 73, 1067–1094. [Google Scholar] [CrossRef]
  35. Klemperer, S.L.; Zhao, P.; Whyte, C.J.; Darrah, T.H.; Crossey, L.J.; Karlstrom, K.E.; Liu, T.; Winn, C.; Hilton, D.R.; Ding, L. Limited underthrusting of India below Tibet: 3He/4He analysis of thermal springs locates the mantle suture in continental collision. Proc. Natl. Acad. Sci. USA 2022, 119, e2113877119. [Google Scholar] [CrossRef]
  36. Tang, X.; Zhang, J.; Pang, Z.; Hu, S.; Tian, J.; Bao, S. The eastern Tibetan Plateau geothermal belt, western China: Geology, geophysics, genesis, and hydrothermal system. Tectonophysics 2017, 717, 433–448. [Google Scholar] [CrossRef]
  37. Gautheron, C.; Moreira, M.; Allegre, C. He, Ne and Ar composition of the European lithospheric mantle. Chem. Geol. 2005, 217, 97–112. [Google Scholar] [CrossRef]
  38. Tardani, D.; Reich, M.; Roulleau, E.; Takahata, N.; Sano, Y.; Perez-Flores, P.; Sanchez-Alfaro, P.; Cembrano, J.; Arancibia, G. Exploring the structural controls on helium, nitrogen and carbon isotope signatures in hydrothermal fluids along an intra-arc fault system. Geochim. Et Cosmochim. Acta 2016, 184, 193–211. [Google Scholar] [CrossRef]
  39. Karakus, H. Helium and carbon isotope composition of gas discharges in the Simav Geothermal Field, Turkey: Implications for the heat source. Geothermics 2015, 57, 213–223. [Google Scholar] [CrossRef]
  40. LIU, J. Research on Water Vapor Sources of Four Provinces in Northwest China Based on Precipitation Stable Isotopes. Master’s Thesis, Shanxi Normal University, Taiyuan, China, 2019. [Google Scholar]
  41. Siegenthaler, U.; Oeschger, H. Correlation of 18O in precipitation with temperature and altitude. Nature 1980, 285, 314–317. [Google Scholar] [CrossRef]
  42. Chamberlain, C.P.; Poage, M.A. Reconstructing the paleotopography of mountain belts from the isotopic composition of authigenic minerals. Geology 2000, 28, 115–118. [Google Scholar] [CrossRef]
  43. Li, J.; Pang, Z. The elevation gradient of stable isotopes in precipitation in the eastern margin of Tibetan Plateau. Sci. China Earth Sci. 2022, 65, 1972–1984. [Google Scholar] [CrossRef]
  44. Xiao, J.; Jin, Z.; Zhang, F. Geochemical and isotopic characteristics of shallow groundwater within the Lake Qinghai catchment, NE Tibetan Plateau. Quat. Int. 2013, 313, 62–73. [Google Scholar] [CrossRef]
  45. Dansgaard, W. Stable isotopes in precipitation. Tellus 1964, 16, 436–468. [Google Scholar] [CrossRef]
  46. Dotsika, E.; Leontiadis, I.; Poutoukis, D.; Cioni, R.; Raco, B. Fluid geochemistry of the Chios geothermal area, Chios Island, Greece. J. Volcanol. Geotherm. Res. 2006, 154, 237–250. [Google Scholar] [CrossRef]
  47. Tarcan, G.; Gemici, U. Water geochemistry of the Seferihisar geothermal area, Izmir, Turkey. J. Volcanol. Geotherm. Res. 2003, 126, 225–242. [Google Scholar] [CrossRef]
  48. Michard, G. Behavior of major elements and some trace-elements (Li, Rb, Cs, Sr, Fe, Mn, W, F) in deep hot waters from granitic areas. Chem. Geol. 1990, 89, 117–134. [Google Scholar] [CrossRef]
  49. Krabbenhoeft, A.; Eisenhauer, A.; Boehm, F.; Vollstaedt, H.; Fietzke, J.; Liebetrau, V.; Augustin, N.; Peucker-Ehrenbrink, B.; Mueller, M.N.; Horn, C.; et al. Constraining the marine strontium budget with natural strontium isotope fractionations (87Sr/86Sr*, delta 88/86Sr) of carbonates, hydrothermal solutions and river waters. Geochim. Cosmochim. Acta 2010, 74, 4097–4109. [Google Scholar] [CrossRef]
  50. Peucker-Ehrenbrink, B.; Fiske, G.J. A continental perspective of the seawater 87Sr/86Sr record: A review. Chem. Geol. 2019, 510, 140–165. [Google Scholar] [CrossRef]
  51. Capo, R.C.; Stewart, B.W.; Chadwick, O.A. Strontium isotopes as tracers of ecosystem processes: Theory and methods. Geoderma 1998, 82, 197–225. [Google Scholar] [CrossRef]
  52. Han, G.L.; Liu, C.Q. Strontium isotope and major ion chemistry of the rainwaters from Guiyang, Guizhou Province, China. Sci. Total Environ. 2006, 364, 165–174. [Google Scholar] [CrossRef]
  53. Cook, P.G.; Solomon, D.K. Recent advances in dating young groundwater: Chlorofluorocarbons, 3H/3He and 85Kr. J. Hydrol. 1997, 191, 245–265. [Google Scholar] [CrossRef]
  54. Edmunds, W.M.; Ma, J.; Aeschbach-Hertig, W.; Kipfer, R.; Darbyshire, D.P.F. Groundwater recharge history and hydrogeochemical evolution in the Minqin Basin, North West China. Appl. Geochem. 2006, 21, 2148–2170. [Google Scholar] [CrossRef]
  55. Jasechko, S. Global Isotope Hydrogeology?Review. Rev. Geophys. 2019, 57, 835–965. [Google Scholar] [CrossRef]
  56. Munnich, K.O. Heidelberg natural radiocarbon measurements-I. Science 1957, 126, 194–199. [Google Scholar] [CrossRef]
  57. Chacha, N.; Njau, K.N.; Lugomela, G.V.; Muzuka, A.N.N. Groundwater age dating and recharge mechanism of Arusha aquifer, northern Tanzania: Application of radioisotope and stable isotope techniques. Hydrogeol. J. 2018, 26, 2693–2706. [Google Scholar] [CrossRef]
  58. Hoke, L.; Hilton, D.R.; Lamb, S.H.; Hammerschmidt, K.; Friedrichsen, H. 3He evidence for a wide zone of active mantle melting beneath the central andes. Earth Planet. Sci. Lett. 1994, 128, 341–355. [Google Scholar] [CrossRef]
  59. Klemperer, S.L.; Kennedy, B.M.; Sastry, S.R.; Makovsky, Y.; Harinarayana, T.; Leech, M.L. Mantle fluids in the Karakoram fault: Helium isotope evidence. Earth Planet. Sci. Lett. 2013, 366, 59–70. [Google Scholar] [CrossRef]
  60. Torgersen, T.; Drenkard, S.; Stute, M.; Schlosser, P.; Shapiro, A. Mantle helium in ground waters of eastern North-America: Time and space constraints on sources. Geology 1995, 23, 675–678. [Google Scholar] [CrossRef]
  61. Ballentine, C.J.; Burnard, P.G. Production, Release and transport of noble gases in the continental crust. Rev. Mineral. Geo-Chem. 2002, 47, 481–538. [Google Scholar] [CrossRef]
  62. Sano, Y.; Wakita, H. Geographical distribution of 3He/4He ratios in Japan: Implications for arc tectonics and incipient magmatism. J. Geophys. Res. -Solid Earth Planets 1985, 90, 8729–8741. [Google Scholar] [CrossRef]
  63. Ma, L.; Castro, M.C.; Hall, C.M. Crustal noble gases in deep brines as natural tracers of vertical transport processes in the Michigan Basin. Geochem. Geophys. Geosystems 2009, 10, Q06001. [Google Scholar] [CrossRef]
  64. Tolstikhin, I.; Waber, H.N.; Kamensky, I.; Loosli, H.H.; Skiba, V.; Gannibal, M. Production, redistribution and loss of helium and argon isotopes in a thick sedimentary aquitard-aquifer system (Molasse Basin, Switzerland). Chem. Geol. 2011, 286, 48–58. [Google Scholar] [CrossRef]
  65. Kharaka, Y.K.; Lico, M.S.; Law, L.M. Chemical geothermometers applied to formation waters, gulf-of-mexico and california basins. Aapg Bull.-Am. Assoc. Pet. Geol. 1982, 66, 588. [Google Scholar]
  66. Ahmad, M.; Akram, W.; Ahmad, N.; Tasneem, M.A.; Rafiq, M.; Latif, Z. Assessment of reservoir temperatures of thermal springs of the northern areas of Pakistan by chemical and isotope geothermometry. Geothermics 2002, 31, 613–631. [Google Scholar] [CrossRef]
  67. Arnorsson, S. The use of mixing models and chemical geothermometers for estimating underground temperatures in geothermal systems. J. Volcanol. Geotherm. Res. 1985, 23, 299–335. [Google Scholar] [CrossRef]
  68. Pirlo, M.C. Hydrogeochemistry and geothermometry of thermal groundwaters from the Birdsville Track Ridge, Great Artesian Basin, South Australia. Geothermics 2004, 33, 743–774. [Google Scholar] [CrossRef]
  69. Chenaker, H.; Houha, B.; Vincent, V. Hydrogeochemistry and geothermometry of thermal water from northeastern Algeria. Geothermics 2018, 75, 137–145. [Google Scholar] [CrossRef]
  70. Reed, M.; Spycher, N. Calculation of ph and mineral equilibria in hydrothermal waters with application to geothermometry and studies of boiling and dilution. Geochim. Cosmochim. Acta 1984, 48, 1479–1492. [Google Scholar] [CrossRef]
  71. Pang, Z.H.; Reed, M. Theoretical chemical thermometry on geothermal waters: Problems and methods. Geochim. Cosmochim. Acta 1998, 62, 1083–1091. [Google Scholar] [CrossRef]
  72. Spycher, N.; Peiffer, L.; Sonnenthal, E.L.; Saldi, G.; Reed, M.H.; Kennedy, B.M. Integrated multicomponent solute geothermometry. Geothermics 2014, 51, 113–123. [Google Scholar] [CrossRef]
Figure 3. Piper diagram of geothermal and river water in the Gonghe Basin.
Water 15 01971 g003
Figure 4. O−δD diagram. The straight line is the LMWL, and the black and gray outlines correspond to samples in this study and from previous data, respectively.
Water 15 01971 g004
Figure 5. Schoeller diagram of water samples from the Gonghe Basin.
Water 15 01971 g005
Figure 6. (a) Na+, (b) K+, (c) Mg2+, (d) Ca2+, (e) SO42−, and (f) HCO3− versus Cl concentration of the geothermal water samples in the Gonghe Basin.
Water 15 01971 g006
Figure 7. Diagram of R/Ra ratio versus 4He/20Ne ratio for gas samples collected from geothermal drilling wells [35,62].
Water 15 01971 g007
Figure 8. Giggenbach diagram for water samples.
Water 15 01971 g008
Figure 9. The SI−T diagram of geothermal water in Gonghe geothermal field.
Water 15 01971 g009
Figure 10. Ultrasonic imaging of microfracture lithofacies characteristics (2280–2400 m) (after [10]).
Water 15 01971 g010
Figure 11. Conceptual model of the Gonghe Basin, which explains geothermal system cycles (RYSF: Riyue Shan Fault).
Water 15 01971 g011
Table 2. Physical and chemical compositions of geothermal and river waters in Gonghe Basin.
Sample IDLongitudeLatitudeSO42−
(mg/L)
Cl
(mg/L)
NO3
(mg/L)
F
(mg/L)
HCO3
(mg/L)
CO32−
(mg/L)
Ca2+
(mg/L)
Mg2+
(mg/L)
Na+
(mg/L)
K+
(mg/L)
TDS
(mg/L)
PH
S1101.302035.96835673130.0054.1915.4024.2055.800.1742917.5014888.97
S2101.301035.96775413070.0054.4724.6018.1053.800.2344817.9014748.87
S3101.301035.96835463290.0054.4955.306.0458.000.4242918.7014708.72
S4101.302035.96815393260.0054.4849.109.0659.900.5443818.7014548.64
S5101.389035.625311519.300.604.542806.0437.906.051305.964788.46
S6101.390035.625323417.201.268.771699.0611.800.531697.355248.57
H1101.389035.625341.703.551.590.552803.0264.9011.8026.202.393028.58
H2101.384036.040370.909.131.840.332493.0261.3023.3028.102.583308.45
H3101.278036.099259.4012.202.200.172213.0249.2016.9030.003.182888.52
H4101.269036.069251.2012.202.160.162183.0247.0017.6030.003.382908.48
H5101.279036.062253.6012.200.780.212376.0444.5023.9024.302.193008.48
H6101.391036.039446.0010.100.800.212276.0442.8023.3020.002.192748.46
Table 3. Isotope ratios of geothermal and cold waters in Gonghe Basin.
Sample IDLongitudeLatitudeSampling
Elevation (m)
δ18O
(‰)
δD
(‰)
δ13C (‰)3H (TU)87Sr/86SrReference
S1101.30166035.9683332511−11.1−84.3−13.80<30.714475
S2101.30138035.9677772511−11.2−85.7−15.20<30.714370
S3101.30111035.9683332509−11.1−84.4−6.00<30.714410
S4101.30194035.9680552508−11.1−84.6−10.40<30.714328
S5101.38944035.6252773240−10.4−71.2−12.109.60.712943
S6101.38972035.6252773242−12.4−89.9−9.10<30.714421
S7101.03643036.1408092557−10.4−83.3−5.400.712577
S8101.03807036.1413052577−10.1−81.5−5.600.712627
S9100.69041036.2078742644−9.6−66.7−10.500.711735
S10100.68349036.2038932655−9.4−65.40.711801
G182700−10.6−74.6[29]
G202886−8.7−77.8[29]
GH182796−8.9−78.0[30]
GH482660−8.8−64.0[30]
G29−10.4−86.4[31]
GD-06−9.6−68.0[32]
GD-07−10.0−69.0[32]
GD-01−9.0−64.0[32]
GD-04−8.7−65.0[32]
GD-05−7.9−59.0[32]
Table 4. Isotope ratios of gas in Gonghe Basin.
Sample IDLongitudeLatitudeR/Ra3He/4He4He/20Ne
G1101.30166635.9683330.057.26 × 10−824.0
G2101.30138835.9677770.496.87 × 10−71.3
G3101.30111135.9683330.045.87 × 10−848.0
G4101.30194435.9680550.071.01 × 10−76.2
G5101.38944435.6252770.841.18 × 10−61.0
G6101.38972235.6252770.034.53 × 10−858.0
Table 5. The recharge elevation of water.
Sample IDSitesElevation (m)δ18OδDRecharge Elevation (m)Recharge Elevation (m)Average (m)
S1Zhacang2511−11.08−84.343782 3782
S22511−11.26−85.673833 3833
S32509−11.12−84.363781 3781
S42508−11.12−84.613789 3789
S5Xinjie3240−10.39−71.213883 4006 3944
S63242−12.45−89.894400 4726 4563
S7Qunaihai2557−10.40−83.313788 3788
S82577−10.06−81.503739 3739
S9Qiabuqia2644.−9.60 −66.70 3097 3236 3166
S102655 −9.50 −65.50 3063 3200 3131
G182700 −10.60 −74.60 3395 3596 3496
G202886 −8.70 −77.80 3905 3905
GH182796 −8.90 −78.00 3823 3823
GH482660 −8.80 −64.00 2905 3148 3027
Table 6. Deuterium excess parameters of geothermal water.
Sample IDδ18O (‰)δD (‰)d
S1−11.08−84.344.30
S2−11.26−85.674.41
S3−11.12−84.364.60
S4−11.12−84.614.35
S5−10.39−71.2111.91
S6−12.45−89.899.71
S7−10.40−83.31−0.11
S8−10.06−81.50−1.02
S9−9.63−66.6910.35
S10−9.45−65.4610.14
Table 7. Geothermal water characteristic coefficients.
Sample IDSitesγNa+/γCl100 × γSO42−/γClγCl/(γHCO3 + CO32−)
S1Zhacang1.37 181.15 7.90
S21.46 176.22 7.19
S31.30 165.96 5.36
S41.34 165.34 5.61
S5Xinjie6.74 595.85 0.07
S69.83 1360.47 0.10
Table 8. An indicative standard of T to judge the age of the groundwater.
Areas3HAge
continental areas<0.8Submodern groundwater, replenished before 1952
0.8–5Mixed water of submodern and recent replenishment
5–15Modern water (5–10 yr)
15–30Groundwater containing some nuclear tritium
30–50Contains significant amounts of water replenished in the 1960s or 1970s
>50Mainly from the 1960s
Table 9. Results of geothermal water age calculation.
Sample ID14C (pMC)Uncorrected AgeCorrected Age
S143.2469313433
S235.0686656097
S3101.40ModernModern
S445.366535217
S585.391306Modern
S638.397915199
S72.3031,18517,332
S82.7329,76816,393
S932.6892463026
Table 10. Different types of chemical geothermometers.
TypeGeothermometerCodeExpression
silica geothermometerSiO2Geothermometer 1T = 1315/(5.205 − lg (SiO2)) − 273.15
SiO2Geothermometer 2T = 1309/(5.19 − lg (SiO2)) − 273.15
SiO2Geothermometer 3T = −1107/(0.0254 + lg (SiO2)) − 273.15
Chalcedonite Geothermometer 4T = 1032/(4.69 − lg (SiO2)) − 273.15
Cation geothermometerNa-K Geothermometer 5T = 856/(0.857 + lg (Na/K)) − 273.15
Na-K Geothermometer 6T = 1217/(1.483 + lg (Na/K)) − 273.15
Na-K Geothermometer 7T = 933/(0.933 + lg (Na/K)) − 273.15
Na-K Geothermometer 8T = 1390/(1.75 + lg (Na/K)) − 273.15
K-Mg Geothermometer 9T = 4410/(13.95 − lg (K2/Mg)) − 273.15
Table 11. Reservoir temperature estimation by chemical geothermometry (°C).
Sample IDGeothermometer 1Geothermometer 2Geothermometer 3Geothermometer 4Geothermometer 5Geothermometer 6Geothermometer 7Geothermometer 8Geothermometer 9
S1163 163 227 139 108 151 129 170 139
S2163 163 227 139 106 149 127 168 135
S3169 169 218 146 113 155 134 174 127
S4171 171 215 149 111 153 132 172 123
S5121 121 311 93 117 158 138 177 61
S6144 144 260 118 113 155 133 174 96
Disclaimer/Publisher’s Note: The statements, opinions and data contained in all publications are solely those of the individual author(s) and contributor(s) and not of MDPI and/or the editor(s). MDPI and/or the editor(s) disclaim responsibility for any injury to people or property resulting from any ideas, methods, instructions or products referred to in the content.

