Article

Influence of Increased Freshwater Inflow on Nitrogen and Phosphorus Budgets in a Dynamic Subtropical Estuary, Barataria Basin, Louisiana

1
The Water Institute of the Gulf, Baton Rouge, LA 70802, USA
2
Independent Researcher, Ottawa, ON K1S 4B6, Canada
*
Author to whom correspondence should be addressed.
Current address: U.S. Geological Survey, Wetland and Aquatic Research Center, Baton Rouge, LA 70808, USA.
Water 2023, 15(11), 1974; https://doi.org/10.3390/w15111974
Submission received: 3 April 2023 / Revised: 15 May 2023 / Accepted: 17 May 2023 / Published: 23 May 2023
(This article belongs to the Section Water Quality and Contamination)

Abstract

:
Coastal Louisiana is currently experiencing high rates of wetland loss and large-scale ecosystem restoration is being implemented. One of the largest and most novel restoration projects is a controlled sediment diversion, proposed to rebuild and sustain wetlands by diverting sediment- and nutrient-rich water from the Mississippi River. However, the impact of this proposed sediment diversion on the nutrient budget of the receiving basin is largely unknown. A water quality model was developed to investigate the impact of the planned Mid-Barataria Sediment Diversion on the nutrient budget of the Barataria Basin (herein referred to as ‘the Basin’). The model results indicate that the planned diversion will increase TN and TP pools by about 38% and 17%, respectively, even with TN and TP loadings that increase by >300%. Water quality model results suggest that the increase of nutrients in the basin will be mitigated by increased advection transport (i.e., decreased residence time from ~170 days to ~40 days, leading to greater flushing) and increased removal via assimilation, denitrification, and settling within the Basin. Advection transport resulted in higher TN removal in the Basin than other processes, such as uptake or denitrification. Approximately 25% of the additional TN loading and 30% of the additional TP loading were processed within the Basin through the assimilation of phytoplankton and wetland vegetation, denitrification, and burial in the sediment/soils. These nutrient budgets help to better understand how the planned large-scale sediment diversion project may change the future ecological conditions within the estuaries of coastal Louisiana and near-shore northern Gulf of Mexico.

1. Introduction

The Mississippi River Deltaic Plain is undergoing rapid change, including the loss of 25% of the total wetlands area since 1932 [1]. The causes of Louisiana’s wetland loss include both natural and anthropogenic drivers, such as sea level rise, storm events, hurricanes, subsidence, hydrological disconnection from riverine sediment delivery due to the development of levees for flood control measures [2,3,4] and the excavation of oil and gas access canals [5] that have impounded water and prevented sheet-flow across the marsh surface [6]. To protect and restore the Mississippi River Deltaic Plain, the Mid-Barataria Sediment Diversion project has been planned to re-establish the natural transport and deposition of sediment carried by the Mississippi River into the Barataria Basin (herein referred to as ‘the Basin’) [7].
The proposed Mid-Barataria Sediment Diversion project will alter the estuarine ecosystem of the Barataria Basin, building and sustaining land and introducing nutrient-rich freshwater to the Basin [8,9]. The proposed sediment diversion will consist of engineered structures that will use a controlled opening and the power of the Mississippi River (planned flow operations are ~2000 m3 s−1 or 75,000 ft3 s−1) to move sediment from the riverine bed to the estuary. The primary ecosystem goal is to sustain and create emergent wetlands in the Barataria Basin. Besides moving sediment, a significant amount of freshwater (equivalent to the annual mean discharge of the Missouri River, 2478 m3 s−1 or 87,520 ft3 s−1) and nutrients [10,11,12] will be introduced into the Basin. This has the potential for large-scale ecosystem changes including changes to the light climate and nutrient concentrations as well as phytoplankton composition of the estuarine open water [11].
Although the large-scale proposed sediment diversion will be unique to the Louisiana coast, the resulting impacts on adjacent estuarine ecosystems are not without precedent. Estuaries globally are changing from various forms of alterations that can influence both fresh-water inflow and nutrient budgets. For example, climate change is affecting precipitation patterns within basins that result in changes to the timing and magnitude of the delivery of diffuse sources of water and nutrients [13,14] to estuaries. River flows can also be altered by drought and precipitation changes, influencing the delivery of fresh water to an estuary and therefore influencing the overall ecology of these systems [15]. For coastal systems with freshwater scarcity, riverine water is sometimes diverted, or reservoirs are built to retain water for drinking purposes [16,17]. These climate and direct anthropogenic changes can significantly influence water input and nutrient dynamics of coastal estuaries, and successful management of these changes requires an understanding of potential changes to basin-wide water and nutrient budgets.
Nutrient budgets serve as a tool for characterizing basin-wide function and changes in estuarine ecosystems. In estuaries, nutrient budgets can be an effective ecosystem planning and assessment technique for major restoration efforts where ecological changes are predicted, or changes to system drivers such as freshwater inflow are planned [18]. Creating a budget in estuarine systems allows for a better understanding of the major inputs, outputs, and changes in nutrient dynamics, and their relative importance [19,20]. Quantification of nitrogen and phosphorus nutrient sinks, sources, and processes is essential because they can be the limiting nutrient for estuarine primary producers [21]. These primary producers include phytoplankton, submerged aquatic vegetation (SAV), benthic microalgae, and emergent vegetation, which influence how organic matter is produced, made available to food webs, and buried [21].
To better predict the potential effect of large freshwater inflows, such as the proposed sediment diversion, on estuarine ecosystems, it is important to understand potential changes in key ecosystem processes. Those changes can be driven by residence time and the exchange of nutrients between and within the water column, sediments/soils, and wetland vegetation. Process-based deterministic models have commonly been used to understand nutrient dynamics in coastal estuarine and continental shelf ecosystems [22,23,24]. This is because these models can dynamically calculate nutrient concentrations in water and sediment/soils by tracking both organic and inorganic nutrients. Ecosystem models allow for the prediction of nutrient concentrations, loadings, and pools in response to nutrient loading changes from altered riverine inflow [25].
Modeling efforts have been previously conducted to understand hydrodynamics and nutrient dynamics in the Barataria Basin. A box model was developed to understand how Davis Pond influenced estuarine flushing time in the northern Barataria Basin [26]. The operation of this freshwater diversion can significantly decrease water residence times in the northern Basin [26]. A box model was used to examine the “Outwelling” hypothesis of total organic carbon (TOC) export to the coastal ocean [27]. It was found that TOC exported from the southern Basin was small compared to the TOC load from the lower Mississippi River to the southern Basin. The “Outwelling” hypothesis was also re-evaluated using a coupled two-dimensional hydrology-hydrodynamic model and confirmed that TOC exported from the southern Basin did not significantly affect hypoxia production in the northern Gulf of Mexico [28]. However, these studies focused on the nutrient export from the southern Basin to the northern Gulf of Mexico. Thus, to the best of our knowledge, there is no currently published work on the nutrient dynamics of the entire Barataria Basin investigating how increased riverine input to the Basin, such as the proposed sediment diversion, could influence the Barataria Basin nutrient budget. The objectives of this study were (1) to calculate the total nitrogen (TN) and total phosphorus (TP) budgets for the Barataria Basin using a water quality model; (2) to analyze interannual flux variation in the southern Basin; (3) to evaluate the effect of increased river input on TN and TP budgets; and (4) to compare the Barataria Basin with other ecosystems.

2. Materials and Methods
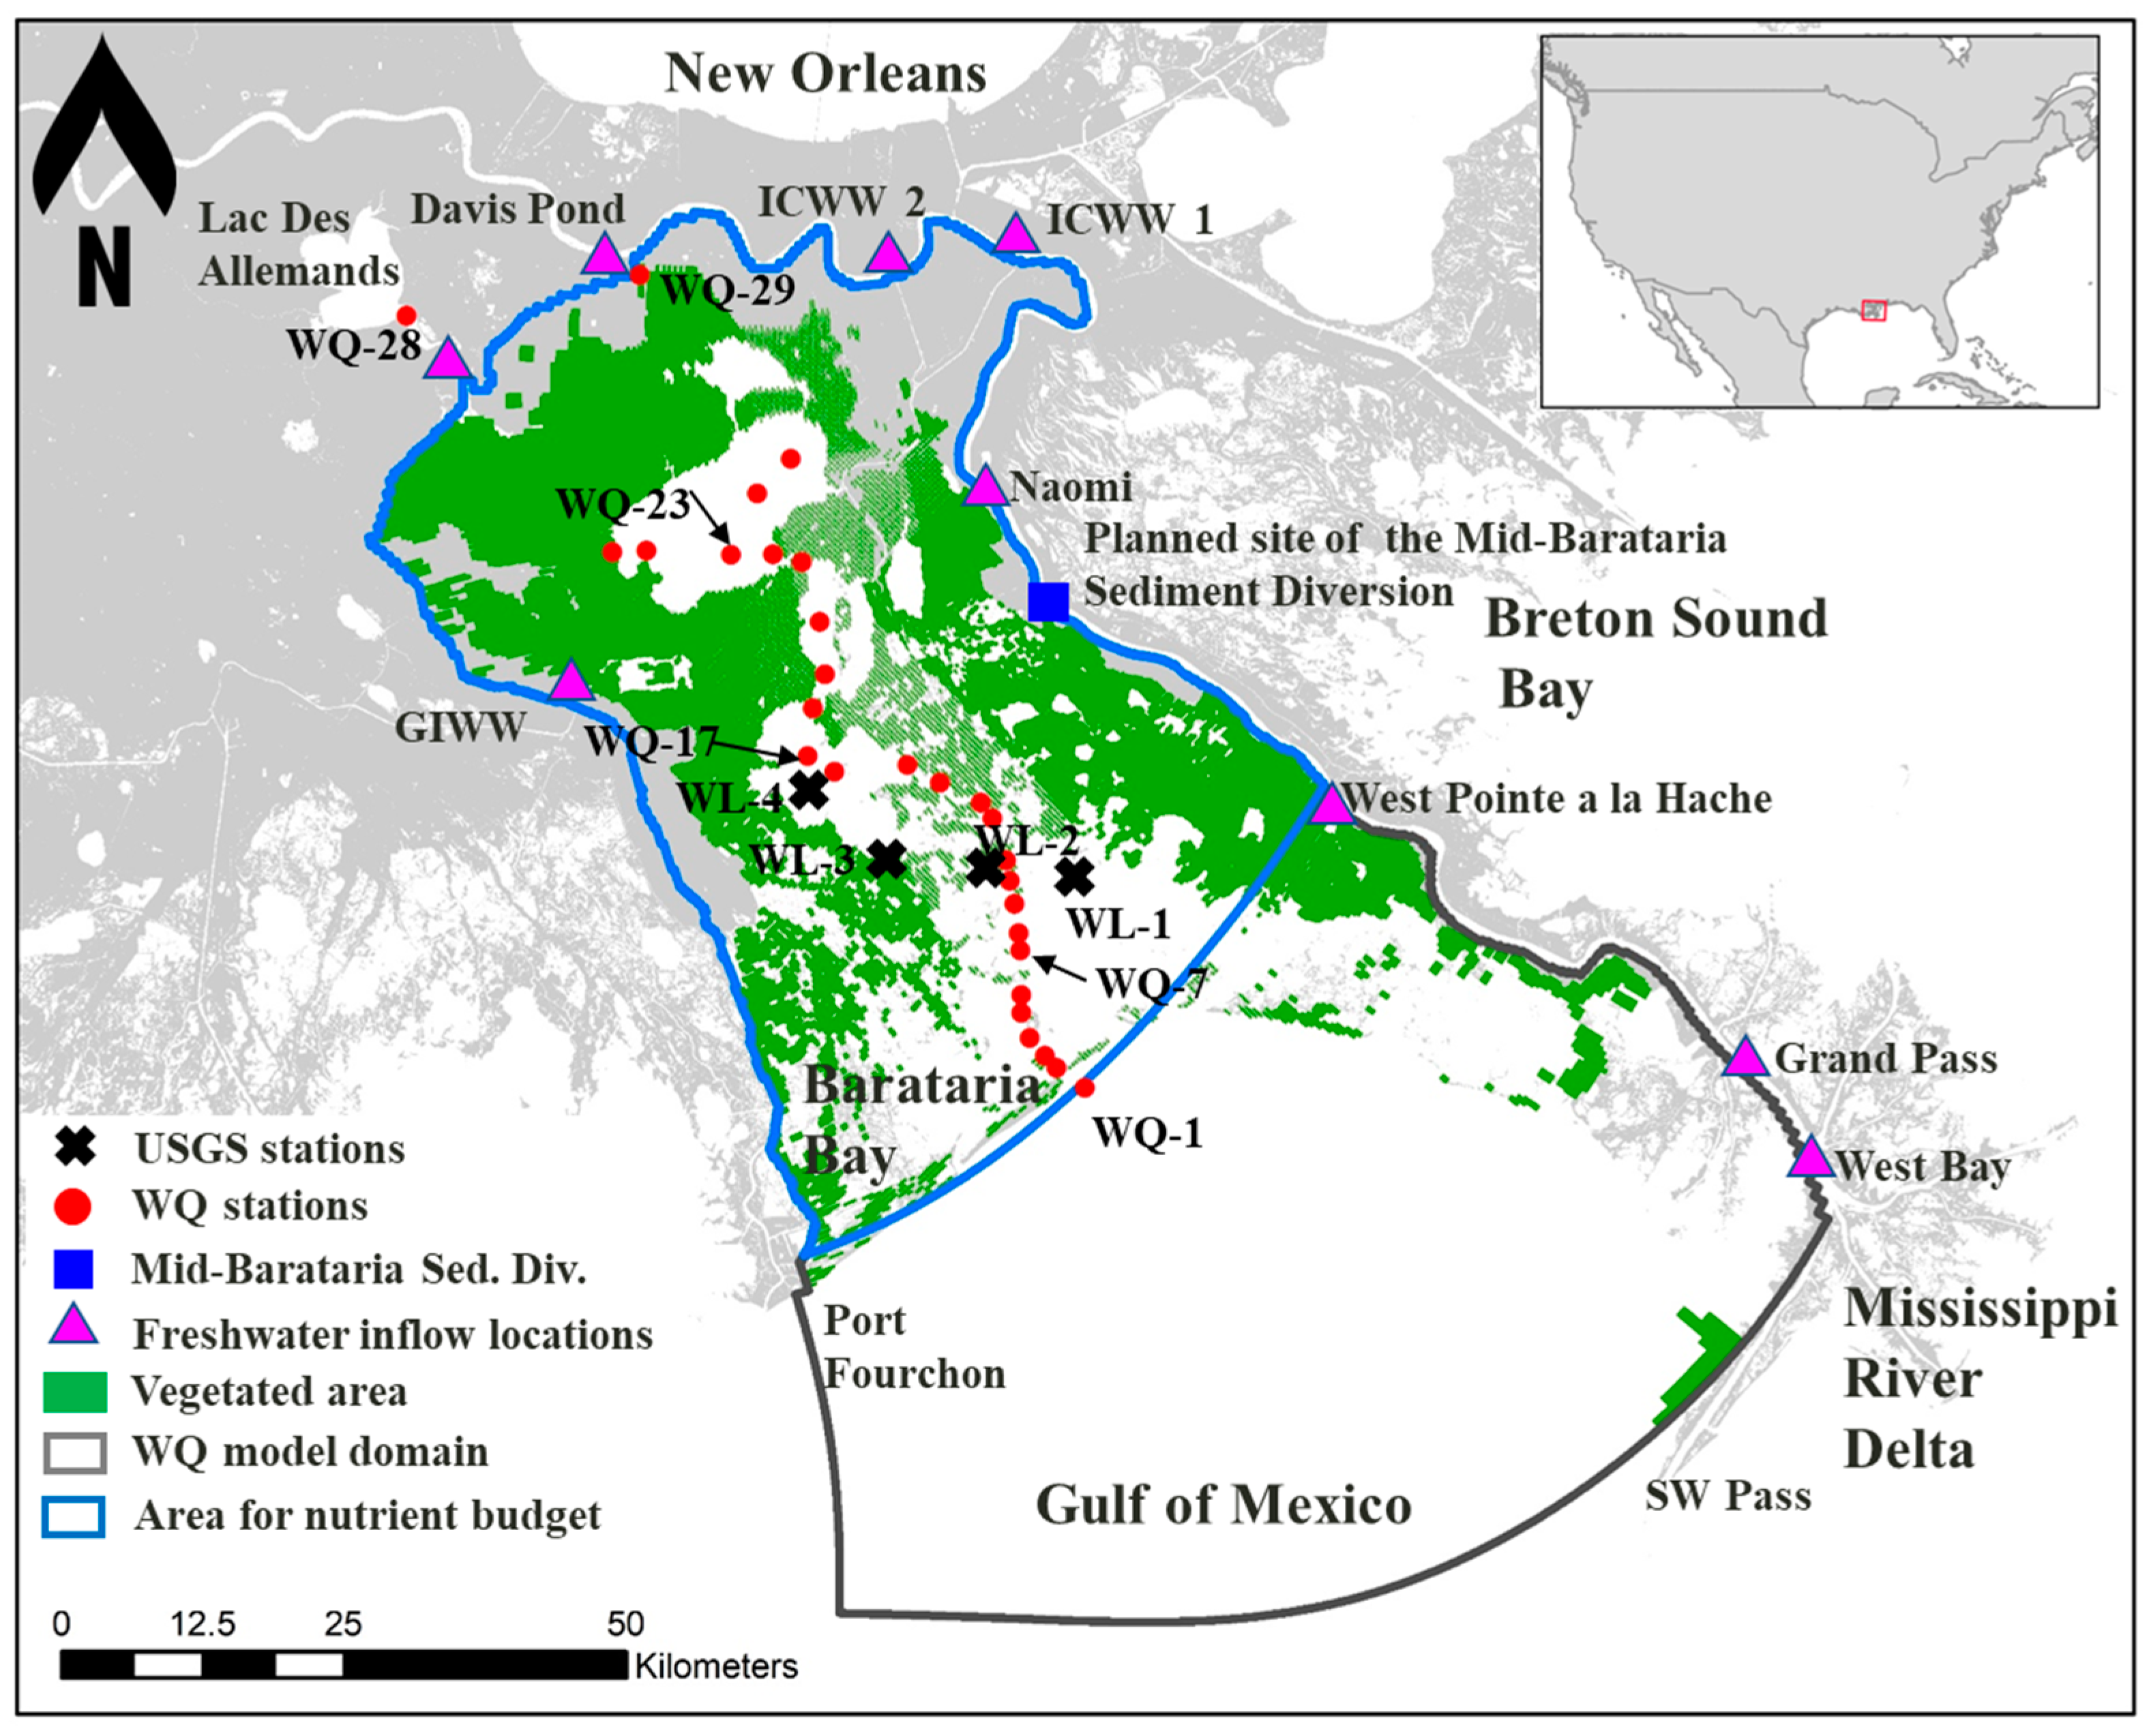
2.1. Study Area

The Barataria Basin is an estuarine wetland system in the Mississippi River Delta in south Louisiana (Figure 1). The Basin is located between the natural levees of the Mississippi River on the east and Bayou Lafourche on the west and is separated from the northern Gulf of Mexico by a chain of barrier islands [29]. The Basin encompasses approximately 6000 km2 of water and wetlands (including fresh to saline marshes) and experienced losses of wetland area at a rate of nearly 23 km2 per year between 1974 and 1990 [1]. The northern Basin includes several large lakes, while the southern Basin consists of tidally influenced marshes connected to a large semi-enclosed embayment behind the barrier islands [30].
The mean water depth in the estuarine open water is ~2 m and the salinity of the Basin ranges from zero in the northeast of the Basin to ~25 at the tidal passes (southeast), with large seasonal variation [27]. Salinity patterns and variability in the Basin have been the subject of several data analyses and modeling studies [33,34,35]. During times of high river flows, rainfall effects become insignificant and salinities in the southern part of the Basin are reduced due to the influence of the river plume on the salinity of coastal waters [36,37]. Salinity increases during times of low river flow, such as the severe drought in 1998–2000, were a primary cause of high salinity that contributed to an extensive die-off of wetland vegetation in the Basin in 2000 [38].

2.2. Model

The Delft3D modeling suite (release: Delft3D 4.02.03) was used to simulate the water quality in the Barataria Basin. The Delft3D modeling suite was developed by Deltares [39] and is used widely in riverine, estuarine, and coastal systems to understand physical and environmental processes [23,40,41]. The Delft3D modeling suite consists of the hydrodynamics (D-FLOW), morphodynamics (D-FLOW-SED-ONLINE), and nutrient dynamics (D-WAQ) models. The D-WAQ model simulates nutrient dynamics through interaction with vegetation (VEGMOD module) as well as phytoplankton (BLOOM module) [42,43,44].
The nutrient dynamics component includes various biogeochemical processes via nitrogen, phosphorus, and carbon pathways and includes interactions between nutrients, organic matter, and the electron-acceptors in the water and sediment/soils [25,42]. Given the wide range of salinities (0 to 25) in the Barataria Basin, both freshwater phytoplankton (e.g., chlorophytes, diatoms, and cyanobacteria including the potentially toxic Microcystis spp. and Dolichospermum, (previously known as Anabaena spp.) and marine phytoplankton (e.g., dinoflagellates) were modeled in the BLOOM module. The VEGMOD simulated change in vegetation biomass of seven key representative taxa. Further information about phytoplankton and vegetation variables can be found in Appendix A. A detailed description of the nutrient dynamics component can be found in [42,43,44].
The model domain was designed to cover the entire Barataria Basin but was limited to Lac des Allemands as the northern boundary and Port Fourchon and Southwest (SW) Pass as the southern open boundary (gray polygon in Figure 1). The model bathymetry and topography were constructed based on the U.S. Geological Survey (USGS) data used for the 2017 Coastal Master Plan [1]. A depth-averaged horizontal two-dimensional model was used for the water because the shallow open water depth (~2 m) inside the Basin was assumed to have thorough vertical mixing. The spatially varying model grids were used to capture complicated bathymetry and topography changes inside the Basin and improve the computational efficiency. A higher grid resolution (~30 m) was used to capture water and mass exchanges through passes between the southern Basin and the northern Gulf of Mexico and through narrow channels in the Basin, whereas a lower grid resolution (~1 km) was used in the northern Gulf of Mexico. The 2010 Land Use Land Cover (LULC) dataset from the 2012 Coastal Master Plan [45] was used to define the vegetated areas on the model grids (Figure 1). Initial vegetation biomass in the vegetated areas was specified using maximum vegetation biomass data representing the winter and spring seasons [44].
The hydrodynamic model grids were aggregated into segments for the nutrient dynamics model based on the characteristics of bathymetry and topography to reduce run time. For example, hydrodynamic grids in vegetated areas were aggregated into several segments to capture the broad characteristics of bathymetry and topography in the vegetated area. Water grids were also aggregated separately in deep water zones (i.e., ≥1 m) and shallow water zones (i.e., <1 m). The sizes of segments range from 5 × 10⁴ m2 to 1 × 10⁸ m2. The total number of segments for the water quality simulation was 2169. Interactions at the sediment/soil-water interface were simulated on seven sediment/soil depth layers representing the top 40 cm of the sediment/soil layer. The upper layers were very thin (1–4 mm) to consider steep concentration gradients at the benthic boundary layer, and the overall thickness of all seven layers was between 1–200 mm.

2.3. Current Freshwater Inflows

Freshwater sources into the Barataria Basin were simulated for the years 2009, 2010, and 2011 (Figure 1). There are seven sources of freshwater that flow directly into the Basin (i.e., Davis Pond Freshwater Diversion, West Pointe a la Hache Siphon, Naomi Siphon, Gulf Intracoastal Waterway (GIWW), Intracoastal Waterway (ICWW 1 & 2), Lac des Allemands), and net precipitation (i.e., precipitation minus evapotranspiration). Discharges at Lac des Allemands and ICCW 1 and 2 were previously calculated for the 2017 Coastal Master Plan—Integrated Compartment Model [46]. The discharges through Grand Pass (with r2 = 0.92) and West Bay (with r2 = 0.94) were estimated using regression equations between the Mississippi River discharge measured at Belle Chasse and discharges from the Grand Pass and West Bay [47]. Discharge data from Davis Pond (295501090190400), GIWW (07381235), and Naomi (07380238) were obtained from the USGS National Water Information System [48]. Discharge data for West Pointe a la Hache was extracted from the 2017 Louisiana Coastal Master Plan [49]. The daily precipitation data were downloaded from the National Oceanic and Atmospheric Administration (NOAA) website: (http://www.esrl.noaa.gov/psd/repository/entry/show?entryid=e578f9-ec09-4e89-93b4-babd5651e7a9 (accessed on 4 May 2015)). Monthly evapotranspiration data were downloaded from the International Water Management Institute’s World Water and Climate Data Atlas (https://www.iwmi.cgiar.org/resources/world-water-and-climate-atlas/download/slow-link/ (accessed on 4 May 2015)).
Based on the compiled measured and modeled data of freshwater inputs, annual total freshwater inflow volumes into the Barataria Basin were calculated for 2009, 2010, and 2011 (Table 1). Freshwater inputs from Grand Pass and West Bay were about 10 to 20 times greater than the total freshwater inputs flowing into the Basin from north to south towards the Gulf of Mexico (Table 1). Some of this freshwater flowing to the north from Grand Pass and West Bay influenced the modeled area of the Barataria Basin, changing both water flow and salinity in the southern Basin. The highest total freshwater inflow volume was 8.11 × 10⁹ m3 in 2009 and the lowest was 3.21 × 10⁹ m3 in 2011. The increase in freshwater inflow in 2009 was mainly caused by increased discharges from Davis Pond (about 41% of total freshwater inflow volume). In terms of freshwater volume, 2009 was a year with a relatively high inflow of freshwater and considered a wet season (rainfall > evapotranspiration) for the Basin. On the other hand, 2011 was a year with relatively low freshwater inflow and considered a low rainfall season (rainfall < evapotranspiration) in the Basin. Although 2010 was the wettest year, the total freshwater inflow was lower than in 2009 because freshwater inflow from Davis Pond was about one-tenth of that in 2009.

2.4. Water Quality Data

Monthly physical, chemical, and ecological data measured in the Barataria Basin were collected from 2009 through 2011 [31,32]. These data include nitrite (NO2) + nitrate (NO3), phosphate (PO4), ammonium (NH4), silicate (Si), TN, TP, chlorophyll-a (Chl-a), salinity, temperature, dissolved oxygen, and total suspended sediment (TSS).
For the northern Gulf of Mexico-open boundary, data measured at station WQ-1 was used (refs. [31,32], Figure 1). Input concentrations to the Basin through Lac des Allemands were specified by data from station WQ-28 (ref. [31,32], Figure 1). For other inflow concentrations, data measured at the WQ-29 station (near the Davis Pond Freshwater Diversion outfall) were used for the model simulation because all those inflows were from the Mississippi River (refs. [31,32], Figure 1). Particulate organic carbon (POC) was estimated by dividing particulate organic matter (POM) by 2.5, which is a dry matter carbon ratio of the particulate detritus fractions [43]. Dissolved organic carbon (DOC) was estimated from DOC = 0.7 × POC using a relationship between TOC = DOC + POC and DOC = 0.6 × TOC (which was found from TOC and DOC measurement data between 2006 to 2016 at USGS Belle Chase (USGS 07374525)). The relationship between DOC and TOC was also assumed for total organic nitrogen (TON) and total organic phosphorus (TOP) to estimate dissolved organic nitrogen (DON) and phosphorus (DOP). For example, TON was estimated from TN–DIN (NO2 + NO3 + NH4), and then DON was estimated from 0.6 × TON. Particulate organic nitrogen (PON) and phosphorus (POP) were calculated by subtracting DON and DOP from TON and TOP, respectively.
Constant atmospheric depositions for nitrogen (70% NH4 and 30% NO3) and phosphorus (PO4) were imposed as 2.5 × 10⁻³ g N m−2 day−1 and 0.2 × 10⁻³ g P m−2 day−1, respectively [50], based on data from the National Atmospheric Deposition Program [51].

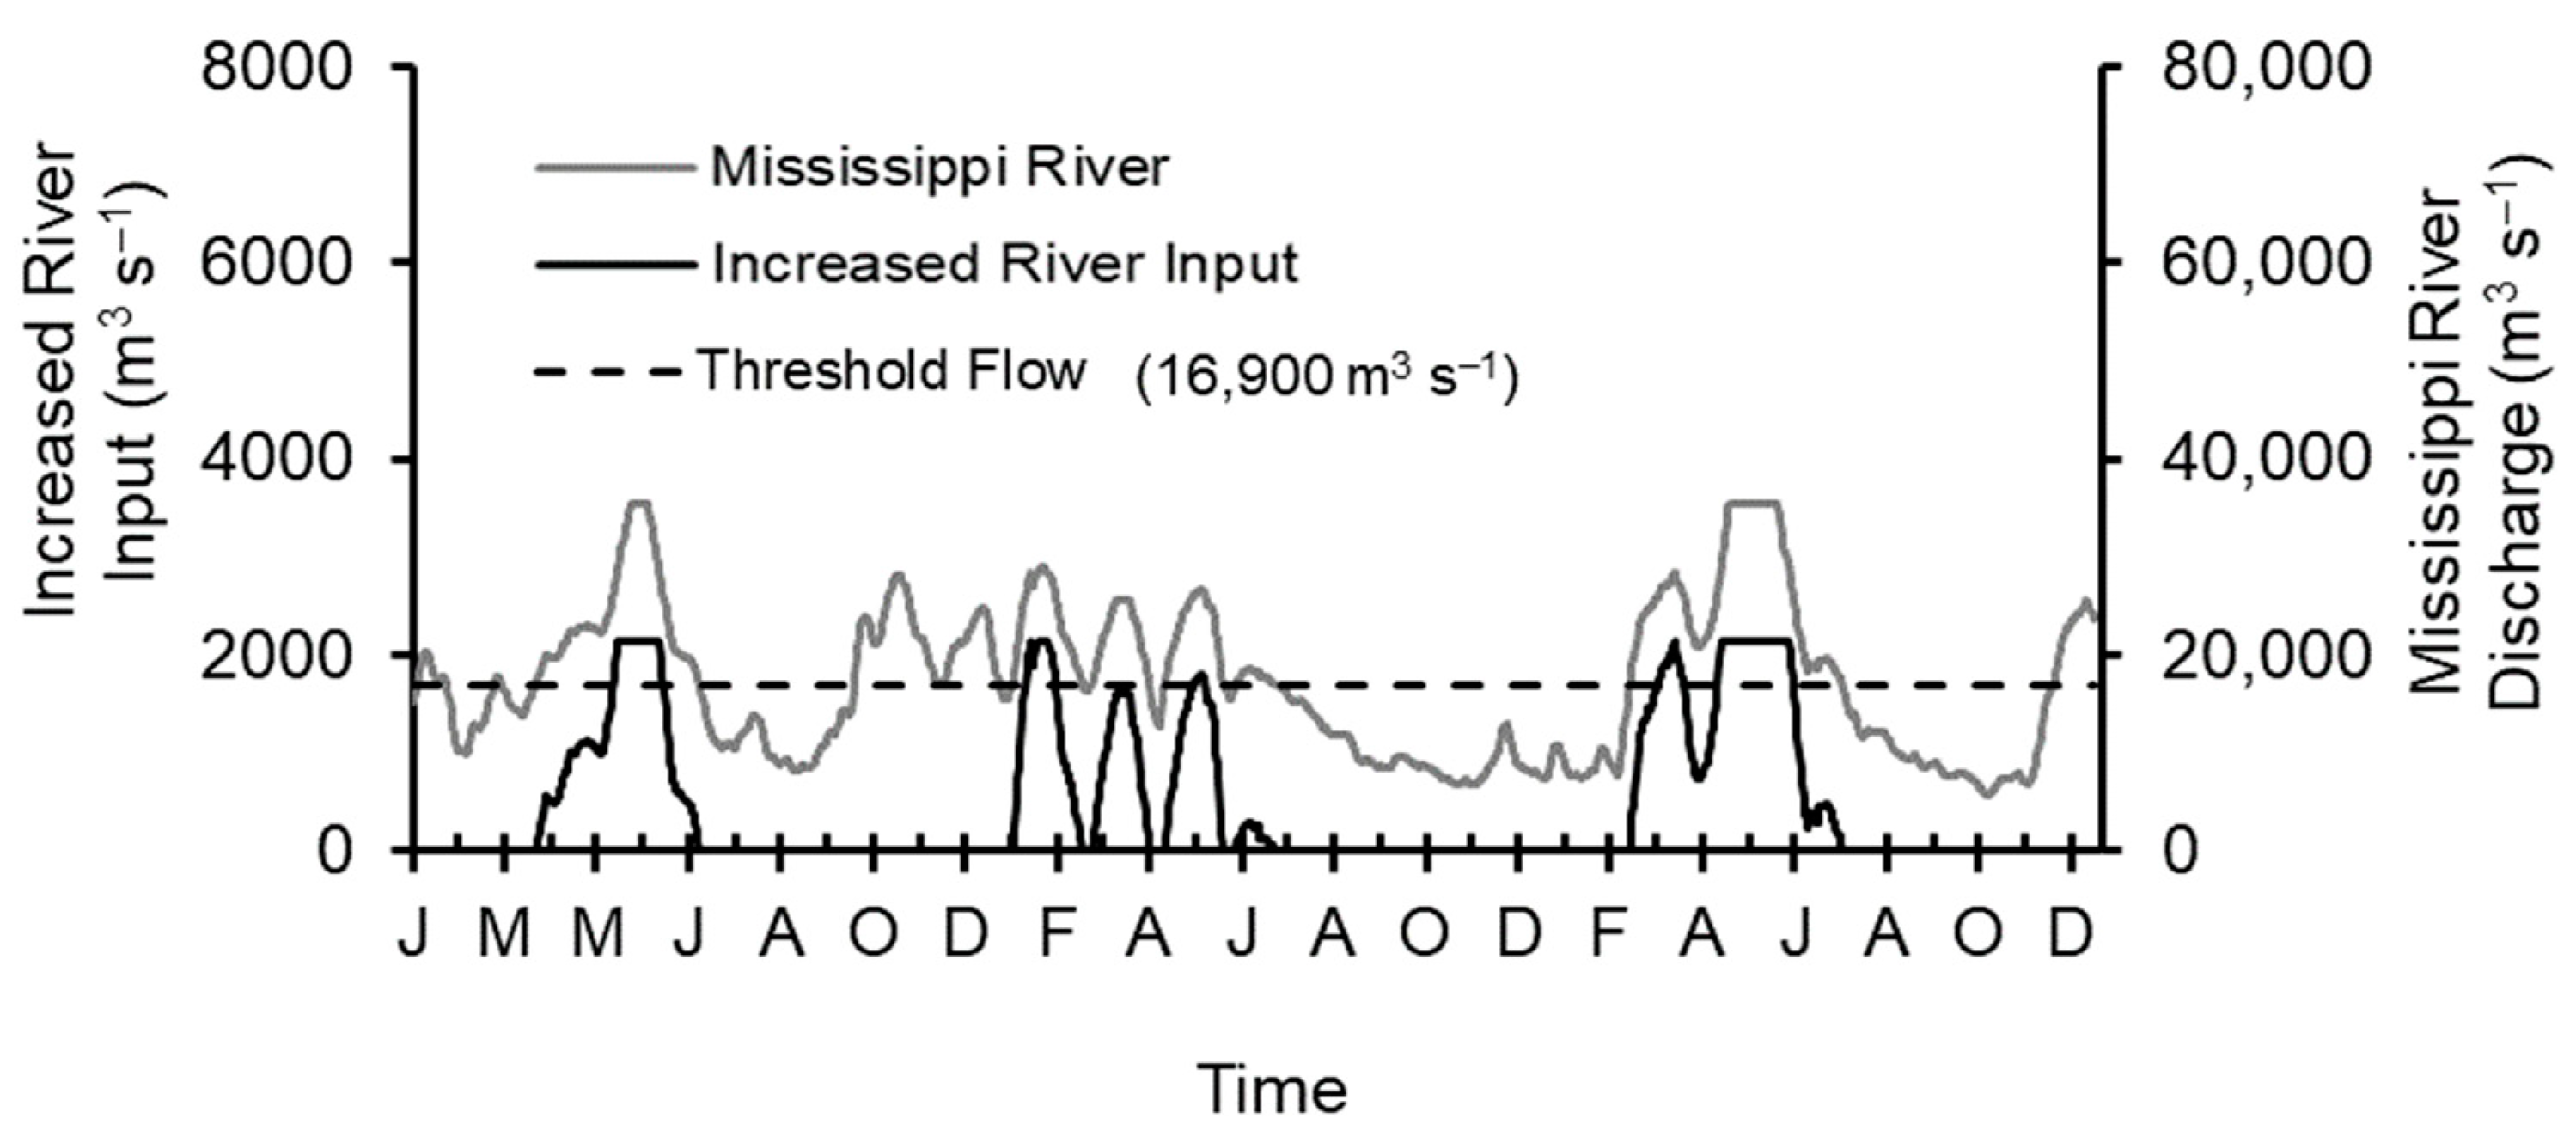
2.5. Increased River Input Scenario

To evaluate the potential impacts of increased river input—simulating operation of the planned sediment diversion—on nutrient budgets in the Basin, the simplified discharge time series data for 2009, 2010, and 2011 were designed for this study based on the proposed sediment diversion operation plan [52]. In the model, freshwater was diverted from the Mississippi River at a rate of up to 2123 m3 s−1 (75,000 ft3 s−1) when the Mississippi River discharge was above 16,900 m3 s−1 (600,000 ft3 s−1) between January to August (Figure 2). All freshwater inflows into the Basin due to the increase in river input for 2009, 2010, and 2011 were 11.4, 13.2, and 16.0 × 10⁹ m3 year−1, respectively (Table 1). The incoming water quality (nutrients, TSS, temperature, salinity, dissolved oxygen) was defined by measured data [31,32] at station WQ-29 (Figure 1) representing water quality conditions in the Mississippi River.

2.6. Nutrient Budget Analysis

The nutrient budget was based on the model results and designed to cover the entire Barataria Basin (spatial extent included within the blue polygon, Figure 1). The southern Basin boundary was defined along the barrier islands. The nutrient budget area was composed of two pools: (1) water and (2) sediment/soils. The two pools were connected to allow for vertical nutrient fluxes or exchanges between water and sediment/soils [44]. The water inflows include all freshwater flows into the Barataria Basin such as Davis Pond, Naomi, West Pointe a la Hache, GIWW, ICWW 1 & 2, and Lac Des Allemands. Increased river water input (i.e., the proposed Mid-Barataria Sediment Diversion) was also considered as water inflow. The exchange with the northern Gulf of Mexico (GOM) indicates nutrient exchanges between the southern Basin and the northern Gulf of Mexico. The atmosphere indicates atmospheric loading into the Basin. Phytoplankton includes various phytoplankton dynamics such as primary production, autolysis, nutrient uptake, mortality, decomposition, and settling of detritus. Internal processes include processes that affect nutrient budgets through reactions with other substances such as absorption/desorption and precipitation of PO4 and mineralization of organic nitrogen and phosphorus. Wetland vegetation refers to the wetland vegetation dynamics such as growth and mortality. Sediment/soils indicate nutrient exchanges between water and sediment/soils. Denitrification refers to the NO3 lost under anaerobic conditions. Release/burial accounts for the transport of nutrients to and from groundwater or the removal of nutrients below the simulated layers. In the nutrient budget calculation, internal transformations of inorganic nutrients (i.e., NH4 to NO3) were not included in the budget calculations. TN is a sum of PON, DON, and DIN (NH4 + NO3). TP is a sum of POP, DOP, and PO4.

3. Results

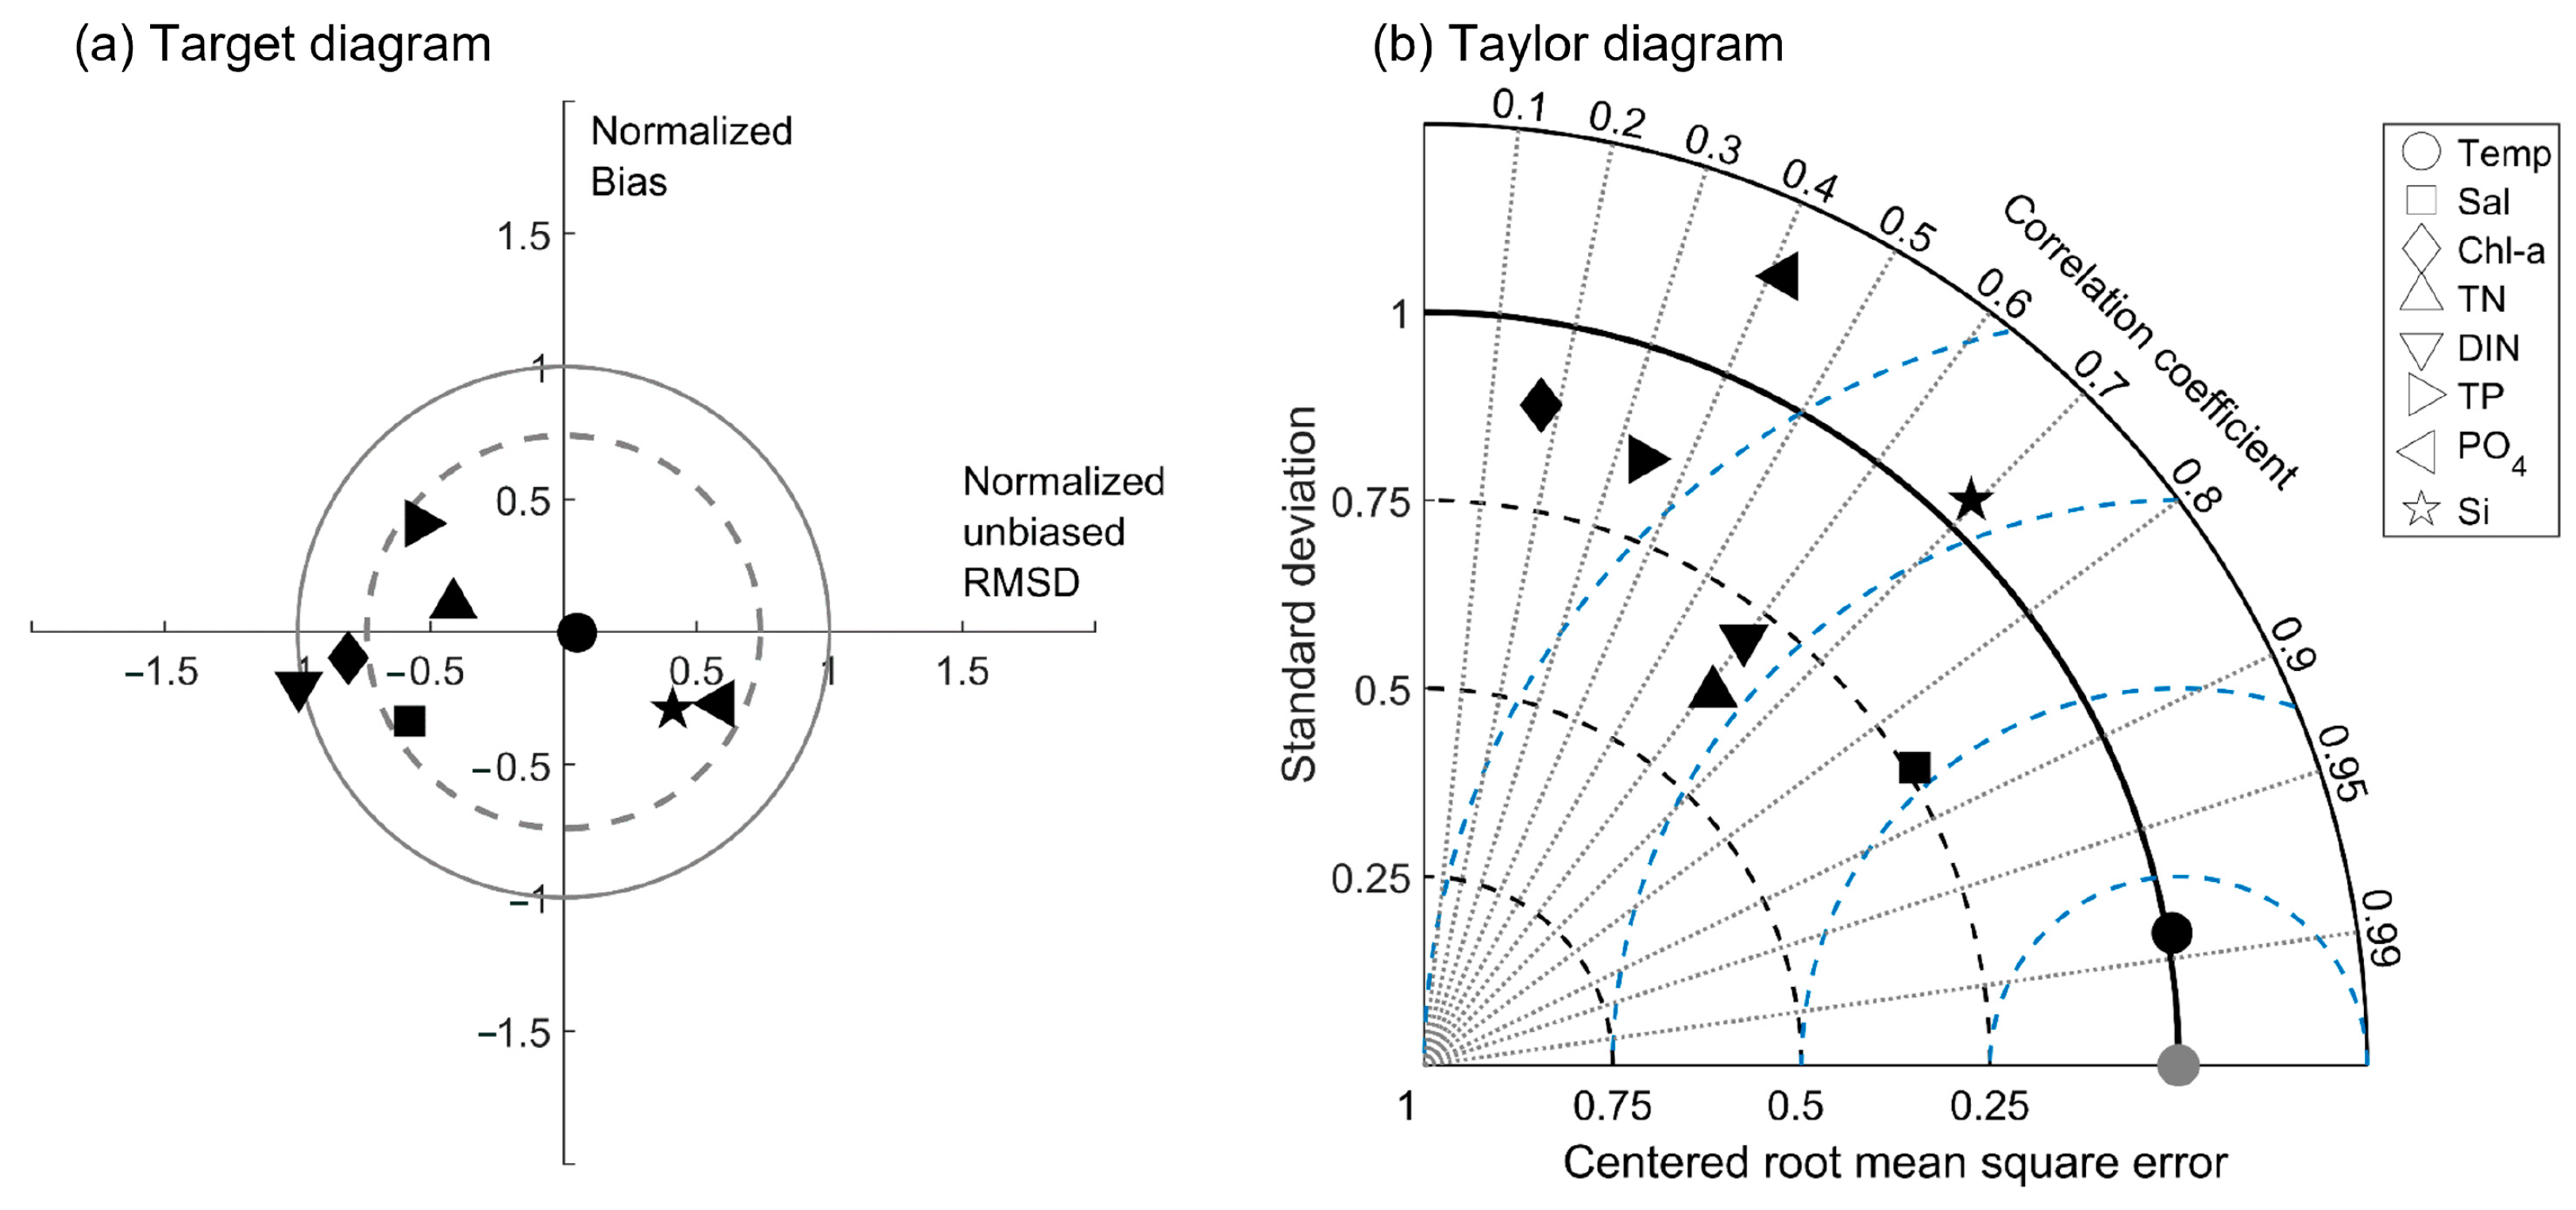
3.1. Model Performance

The hydrodynamic model was calibrated for water elevation using the Chezy bed roughness coefficient (i.e., wetland marsh = 60; shallow and deep open water = 75) from years 2009 and validated for water elevation from 2010 and 2011 at four USGS stations (Figure 1). The water quality model was calibrated (using 2009 data) and validated (using 2010 and 2011 data) from observed water quality variables (i.e., Chl-a, TN, DIN, TP, PO4, and Si) with salinity and temperature at 26 stations (Figure 1). The model was primarily calibrated by adjusting phytoplankton growth and mortality rates, decay rates of POC, and settling velocities of phytoplankton and particulate organic matter. Further information on calibration coefficients for the water quality model is provided in Appendix A.
The model performance for the entire Barataria Basin was visualized on a ‘Taylor diagram’ [53] and a ‘target diagram’ [54] for water quality variables including salinity and temperature (Figure 3). The observed and modeled water quality time series data were collected from all 26 stations in the Basin for the years 2009 through 2011. Statistical metrics, such as correlation coefficients and biases between the modeled and observed data, were calculated for each station. These metrics were then averaged across all stations to evaluate the overall agreement between the model and observed data in the entire Basin. These metrics quantify the degree of agreement between the model and observational data.
The target diagram depicts the difference between modeled and observed data in terms of the bias (B) and the normalized, signed, unbiased root-mean-squared difference (unRMSD). In the target diagram, a circle with a radius of 1 corresponds to a total unRMSD equal to the standard deviation of the observations. The center of the target diagram represents a perfect match of model results to observed data. Model results within the drawn circle with unRMSD = 1 can be considered reasonable and the results within unRMSD = 0.74 can be considered good [55]. The target diagram (Figure 3a) showed that most water quality variables were plotted within a drawn circle with unRMSD = 1, which can be considered reasonable (Figure 3a). The Taylor diagram using a polar coordinate system can show the correlation coefficients (R), normalized standard deviation (σr), and root-mean-squared difference (RMSD), simultaneously. If a model output is perfectly matched with observed data, the point will be plotted on (1, 0) on the normalized Taylor diagram. The Taylor diagram (Figure 3b) showed that temperature, salinity, and Si had relatively high correlation coefficients (>0.7). Most of the water quality variables had correlation coefficients greater than 0.4, with only TP and Chl-a being less than 0.4 (Figure 3b). Overall, the model showed a capability to simulate physical and biogeochemical processes influencing water quality in Barataria Basin. Further comparisons between modeled and measured water elevation and water quality variables are provided in Appendix B.

3.2. TN and TP Budgets with Current River Input

Total nitrogen and phosphorus budgets in the Barataria Basin were calculated using water quality model results for the years 2009 through 2011 (Table 2 and Table 3).
The TN and TP budget diagrams in terms of annual mean net fluxes were constructed for the Barataria Basin (Figure 4) based on model simulation results (Table 2 and Table 3). In this diagram, the changes in nitrogen and phosphorus content of phytoplankton and vegetation were considered in the TN and TP stocks. The fluxes were defined as gain (+) and loss (−) in terms of mass in a pool. Gains occurs with an increased mass of nutrients through advection and internal biogeochemical processes. Loss occurs with a decrease or removal of nutrient mass, such as identification and settling of particulates.

3.2.1. TN Budget

The mean TN budget in water and sediment/soils under the Current River Input condition was calculated from 2009 through 2011 (Table 2 and Figure 4a). Under current conditions nutrients carried by freshwater surface inflows are the predominant source (i.e., 94% of all nutrient inflows were consumed, only 6% of all nutrient inflows were exported) for TN in the Basin. The long-term average exchange with the northern Gulf of Mexico through the mouth of the basin is small by comparison.
Within the Basin, model calculations indicate that internal TN fluxes, due to cycling within the water column and exchanges between the water column, sediment, and vegetation, are large compared with the loading of TN into the Basin from external sources. The major gain of TN in the water column pool was from phytoplankton uptake (34% of total TN gain). Phytoplankton produced TN (132.4 × 10⁹ g N year−1, Table 2) from primary production (57%) via photosynthesis, detritus (30%) via mortality, and autolysis (17%), respectively. Primary production and detritus contributed to TON whereas autolysis produced DIN. However, the DIN uptake (−75.0 × 10⁹ g N year−1) and biomass loss through mortality (−57.0 × 10⁹ g N year−1) of phytoplankton were one of the major TN losses (−132.3 × 10⁹ g N year−1 and 35% of total TN loss) in the water column, resulting in the net TN flux from phytoplankton near zero.
The nitrogen supply (101.6 × 10⁹ g N year−1) from sediment/soils was a significant contributor to the TN gain (26% of total TN gain 388.7 × 10⁹ g N year−1) in the water column (Table 2). The sediment/soil flux provided 40% DIN (51.5 × 10⁹ g N year−1 of total DIN gain 127.9 × 10⁹ g N year−1) to the water column through mineralization of sediment organic matter, which contributed 69% of DIN taken up by phytoplankton (75 × 109 g N year−1). Strong negative flux from water to sediment/soils for TN (−144.3 × 10⁹ g N year−1 and 39% of total TN loss −373.7 × 10⁹ g N year−1) was mainly related to the settling of PON originated from the mortality of phytoplankton and wetland vegetation biomass that contributes to burial or losses.
Wetland vegetation aboveground biomass was an important source of PON produced and was the largest net flux of 33.7 × 10⁹ g N year−1 (about 9% of total TN gain) in the water column whereas settling of organic material was the largest net flux of TN removal (−42.8 × 10⁹ g N year−1) from the water column (Table 2 and Figure 4a).
Inflow and outflow of TN through the southern Basin boundary were 96.6 × 10⁹ g N year−1 and −97.1 × 10⁹ g N year−1, respectively. The direction of net fluxes of TN at the southern Basin boundary were from the Basin to the northern Gulf of Mexico, but the flux difference between inflow and outflow was small (−0.5 × 10⁹ g N year−1, Figure 4a). The nitrogen fluxes through the southern Basin boundary were dominated by TON (i.e., 61% and 69% of inflow and outflow of TN in the water column, respectively, Table 2). However, a significant amount of DIN was imported through the southern Basin boundary (i.e., the inflow of DIN = 37.8 × 10⁹ g N year−1 and outflow flux = −30.5 × 10⁹ g N year−1, Table 2) from the northern Gulf of Mexico to the Basin.
In the sediment/soils pool, the major source of nitrogen was a supply from the water pool (144.3 × 10⁹ g N year−1 and 42% of total TN gain in sediment/soils 345.0 × 10⁹ g N year−1). Assuming all PONs from dead phytoplankton (57.3 × 10⁹ g N year−1 = (132.3−75.0) × 109 g N year−1) and vegetation (33.7 × 10⁹ g N year−1) in the water pool are transported to the sediment/soil pool, these PONs contributed 63% of TN gained from the water pool (144.3 × 10⁹ g N year−1). The PON was transformed into dissolved organic or inorganic forms and the DON and DIN were later released back to the water column (i.e., 49.7 × 10⁹ g N year−1 (=(101.6−51.8) × 109 g N year−1) for DON and 51.8 × 10⁹ g N year−1 for DIN in Table 2). Major DIN loss in soils was primarily related to wetland vegetation uptake (88.3 × 10⁹ g N year−1 and 55% of total DIN loss in sediment/soils, Table 2). Denitrification was an important DIN loss in sediment/soils (21.4 × 10⁹ g N year−1 and 10% of total TN loss in sediment/soils 211.3 × 10⁹ g N year−1). Considering the net flux between water and sediment/soils and denitrification, the TN removal rate in the water pool was about −42.8 × 10⁹ g N year−1 (−12.6 g N/m2 year−1 within an area of 3.45 × 10⁹ m2).
Considering the water and sediment/soils pools together, the importance of the processes related to the DIN loss in the Basin was calculated (Figure 5). Under the Current River Input condition, most DIN in the Basin was assimilated by wetland vegetation (41%) and phytoplankton (35%). Only 14% of the total DIN was exported offshore. DIN loss through denitrification was about 10% of the total DIN.

3.2.2. TP Budget

Mean TP and PO4 fluxes in water and soils were calculated using the numerical model results from 2009 through 2011 (Table 3 and Figure 4b). In general, TP and PO4 fluxes showed similar patterns to TN and DIN. Under current conditions, nutrients carried by freshwater surface inflows are the predominant source (~90% of all inflows) for TP in the Basin. About 33% (=0.3 of 0.9 × 10⁹ g P year−1) of the total TP load into the Basin is exported to the northern Gulf of Mexico through the southern Basin boundary. The remaining 67% is removed within the Basin by processes of nutrient uptake that are used to build organic matter that ultimately becomes buried in the sediments.
Within the Basin, model calculations indicate that internal TP fluxes, due to cycling within the water column and exchanges between the water column, sediment, and vegetation, are large compared with the loading of TP into the Basin from external sources (Table 3). Phytoplankton was not only the largest source of TP, but also the second-largest loss of TP from the water column, resulting in zero net flux of TP to the water column. The phytoplankton produced TP (13.1 × 10⁹ g P year−1, Table 3) from primary production (57%) via photosynthesis, detritus (30%) via mortality, and autolysis (13%), respectively. The nutrient uptake (−7.5 × 10⁹ g P year−1) and phytoplankton biomass loss through mortality (−5.6 × 10⁹ g P year−1) were the major losses (−13.1 × 10⁹ g P year−1 and 35% of TP loss) of TP, causing a near zero net loss of TP flux from phytoplankton.
The phosphorus exchange between water and sediment/soils was a significant contributor of TP to the water pool (Table 3). The PO4 (8.5 × 10⁹ g P year−1) released from the sediment was a major source supporting the primary production of phytoplankton (7.5 × 10⁹ g P year−1). Negative fluxes from water to soil/sediment for TP were mainly related to the settling of POP from the mortality of phytoplankton and wetland vegetation. Based on the mean phosphorus fluxes, the TP removal rate in the Basin was −1.87 × 10⁹ g P year−1 (−0.55 g P m2 year−1 with the nutrient budget area 3.45 × 10⁹ m2) given the net flux between water and sediment/soils.

3.3. Interannual Water, TN, and TP Fluxes Variation with Current River Input

Modeled annual net water fluxes at the southern Basin boundary from 2009 through 2011 were 281, 204, and 168 m3 s−1, respectively, and their directions were from the Basin to the northern Gulf of Mexico (Figure 6a). TN and TP flux results showed that the TN and TP loadings through water inflows in the Basin decreased (Table 4) as freshwater inflows decreased from the year 2009 through 2011 (Figure 6a). Net TN and TP fluxes through the southern Basin boundary varied in terms of net flux direction and magnitude from 2009 through 2011 (Table 4 and Figure 6a). In 2009 the net flux of TN was −2.8 × 10⁹ g N year−1 (from the Basin to the northern Gulf of Mexico) but the net flux in 2011 changed to 1.8 × 10⁹ g N year−1 (from the northern Gulf of Mexico to the Basin). The export TN fluxes through the boundary increased as the freshwater inflows in the Basin increased. However, net fluxes of DIN and PO4 were consistent in the Basin from the northern Gulf of Mexico regardless of freshwater inflows in the Basin under the Current River Input condition (Table 4 and Figure 6a).

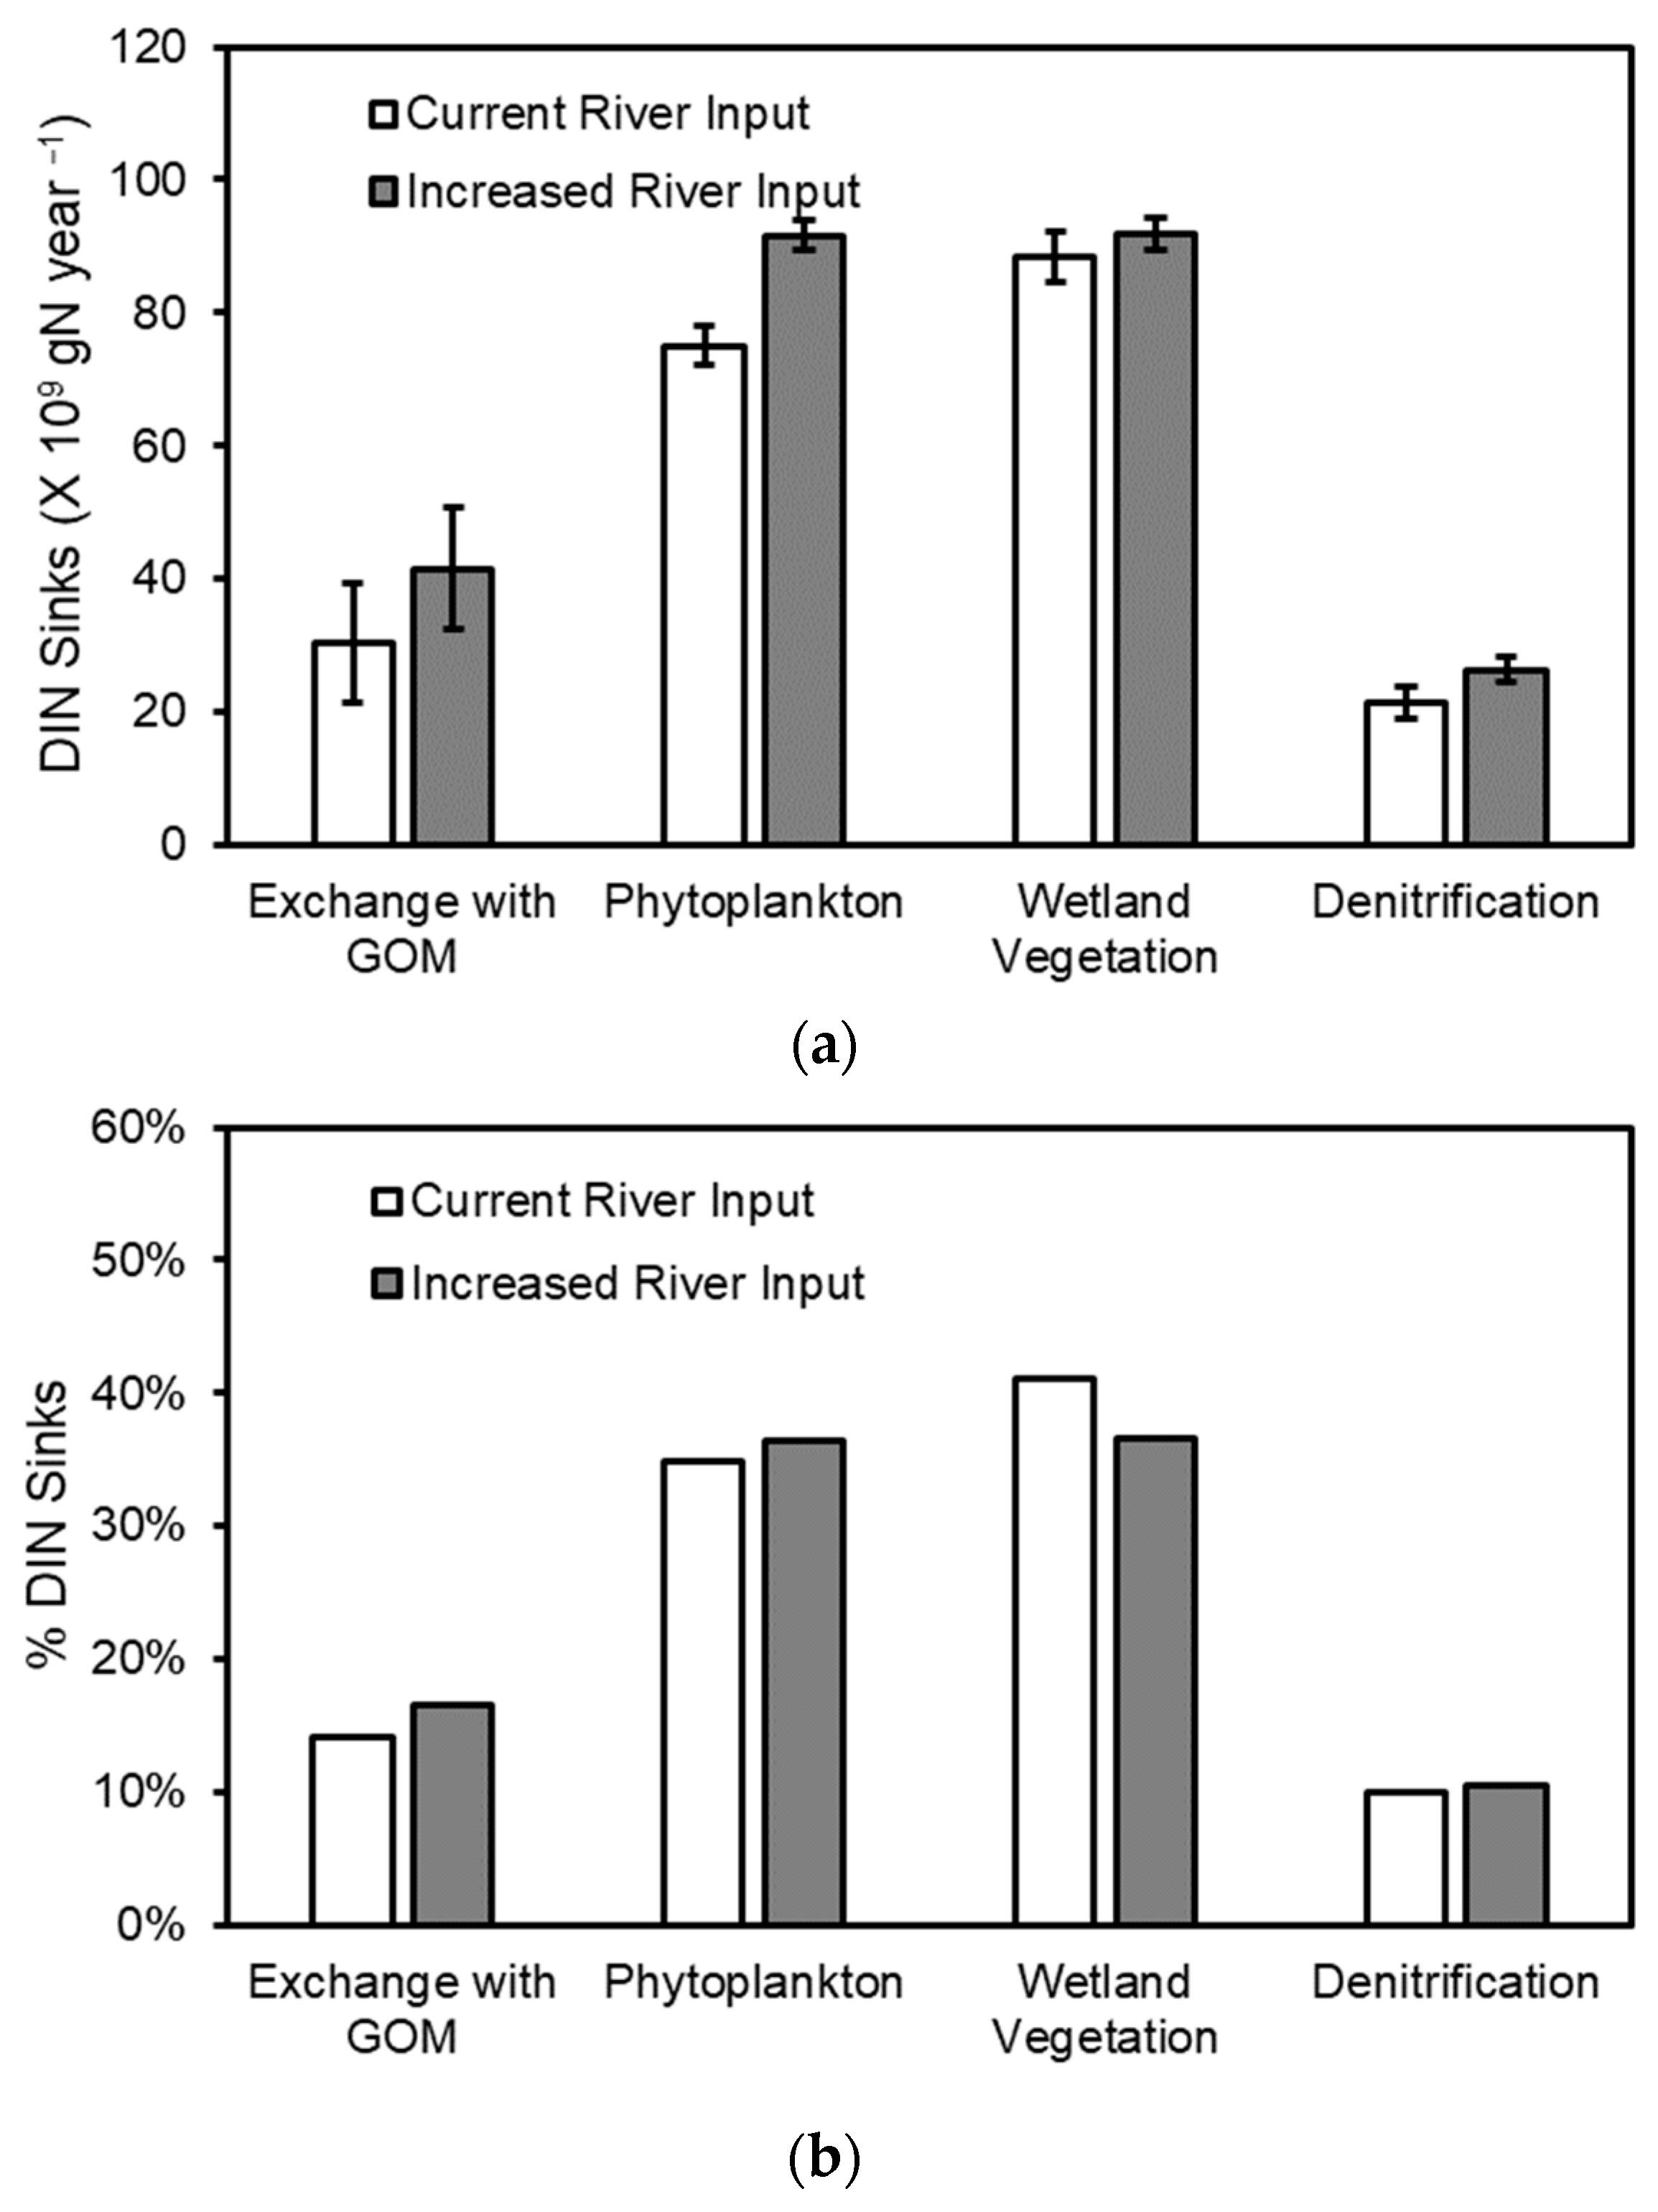
3.4. Effect of Increased River Input on Nutrient Pools and Fluxes within the Basin

Model results (Table 2 and Table 3, and Figure 4) suggest that increased river input would result in large increases in nutrient loading to the Basin, quadrupling (four times increase) the total influx of TN and tripling (three times increase) the total influx of TP. However, TN and TP pools did not increase proportionately with the increased nutrient influxes. Annual mean stocks (Figure 4) of TN and TP in the water pool increased from 2.19 to 3.04 × 10⁹ g N (38% increase) and 0.24 to 0.28 × 10⁹ g P (17% increase), respectively. However, increases in nutrient exports to the northern Gulf of Mexico and into the sediment/soils more closely reflected changes in total nutrient input. For example, the net TN flux to the northern Gulf of Mexico increased from 0.5 × 10⁹ g N year−1 to 20.9 × 10⁹ g N year−1 or about 40 times while the net TP flux to the northern Gulf of Mexico increased from 0.3 to 1.7 × 10⁹ g P year−1 or about six times. In contrast to the relatively high increase in TN and TP exports, net TN and TP transport to sediment/soils were relatively small. Net TN and TP transport to sediment/soils increased by 18% and 32%, respectively.
Under the Increased River Input condition, the total input of TN into the Basin increased by nearly three times the current inputs, an increase of 27.1 × 10⁹ g N year−1 (=35.9 × 10⁹ g N year−1−8.8 × 10⁹ g N year−1) compared to the Current River Input (Table 2). About 75% (=(20.9−0.5)/(35.9−8.8) × 109 g N year−1) of this increase in TN loading was exported to the northern Gulf of Mexico. The remaining 25% of TN loading added by the planned diversion was removed within the Basin by processes of nutrient uptake, denitrification, and settling, hence reducing the nitrogen entering the northern Gulf of Mexico from the Mississippi River water flowing through the sediment diversion by 25% per annum. The total input of TP into the Basin increased by two times the current inputs (Table 3), an increase of 2.0 × 10⁹ g P year−1 (=2.9 × 10⁹ g P year−1−0.9 × 10⁹ g P year−1). About 70% (=(1.7−0.3)/(2.9−0.9) × 109 g P year−1) of this increase in TP loading is exported to the northern Gulf of Mexico. The remaining 30% of TP loading added by the planned diversion is buried in the sediment/soils.
In the sediment/soils pool, TN, particularly nitrate, loss by denitrification slightly increased from 21.4 to 26.4 × 10⁹ g N year−1 or about 12% due to increased organic material input from the water pool (Table 2 and Figure 4a). The net TN and TP fluxes through wetland vegetation did not change significantly with the increased river input compared to the Current River Input conditions (Table 2 and Table 3, and Figure 4).
Considering the water and sediment/soils pools together, DIN under the Increased River Input condition (Figure 5) was taken up by vegetation (37%) and phytoplankton (36%) in similar proportions. Only 17% of the total DIN was exported offshore via the southern Basin boundary. DIN loss through denitrification was about 10% of the total DIN. Compared to the Current River Input conditions, DIN uptake by wetland vegetation decreased to 4%. Instead, export to the offshore and phytoplankton uptake increased by 3% and 1%, respectively. The TN removal rate in the water pool increased by −50.7 × 10⁹ g N year−1 (−14.7 g N m−2 year−1 within an area of 3.45 × 10⁹ m2) by considering the net flux between water and sediment/soils and denitrification.
Under Increased River Input conditions, annual net water fluxes at the southern Basin boundary from 2009, 2010, and 2011 were −670, −634, and −673 m3 s−1, respectively and their directions were from the Basin to the northern Gulf of Mexico (Figure 6b). Net TN and TP fluxes through the southern Basin boundary showed consistent exports of TN and TP to the northern Gulf of Mexico. The exported TN and TP mainly consisted of TON and TOP. However, annual net PO4 fluxes showed a change in the direction and magnitude of net fluxes, while the net DIN fluxes showed a consistent export to the northern Gulf of Mexico.

4. Discussion

A water quality model was constructed to evaluate the impact of increased river input on TN and TP budgets in the Barataria Basin compared to the Current River Input conditions. The quantification of TN and TP budgets allowed assessment of the relative importance of biogeochemical processes as well as physical transport under different river water input conditions to help address four main objectives.

4.1. TN and TP Budgets with Current River Input

One of the main flows of nitrogen and phosphorus in the Barataria Basin was identified as uptake by phytoplankton and wetland vegetation followed by settling of their organic materials. In the sediment/soils, labile organic matter that was deposited from the water column was decomposed and mineralized to inorganic forms. This implies that organic nitrogen is the primary factor influencing the nitrogen cycle in the Basin. Long-term field measurements in the Barataria Basin showed that DON is the dominant nitrogen form and that rapid nitrogen recycling through primary production and phytoplankton decomposition supports stable phytoplankton biomass (as Chl-a concentrations) in the Barataria Bay [31].
The inorganic nitrogen in the sediment/soils was assimilated into wetland vegetation as well as removed from the sediment/soil through denitrification processes in low-oxygen sediment/soils. Field measurements for areal nitrate reduction rates at marsh, fringe, and estuary zones were conducted in the northeastern portion of Barataria Basin [56]. The measured nitrate reduction rates for marsh, fringe, and estuary zones were about 29.29, 18.83, and 10.83 mg N m−2 day−1, respectively. The modeled annual mean denitrification rate of this study was 17.3 mg N m−2 day−1 and was within the range of field observations [56].
The main nitrogen inputs to the Basin included riverine water inflows. Those inputs were assimilated (removed from the water column) by phytoplankton, thus only organic nitrogen was exported to the northern Gulf of Mexico. The calculated current condition annual mean net flux of TN (−0.5 × 10⁹ g N year−1) was less than the estimate (−2.3 × 10⁹ g N year−1) provided by Das et al. [28]. However, it was suggested that the net TN fluxes were not statistically significant from zero because of small gradients of TN concentrations between the southern Basin and the northern Gulf of Mexico even though the net fluxes were from the Basin to the northern Gulf of Mexico [28]. The 7.3 × 10⁹ g N year−1 net flux of DIN into the Basin was similar to values (about 7.0 × 10⁹ g N year−1 for NO3) estimated by Das et al. [27,28].

4.2. Interannual Water, TN, and TP Fluxes with Current River Input

The interannual variability of net water volume, TN, and TP fluxes at the southern Basin boundary were calculated from 2009 through 2011 (Table 4 and Figure 6a). The mean Mississippi River discharges at Belle Chase (USGS 07374525) for 2009, 2010, and 2011 were 18,305, 16,176, and 16,810 m3 s−1, respectively. Considering a positive relationship between the Mississippi River and Grand Pass and West Bay [47] (Figure 1), the net water fluxes at the southern Basin were mainly related to freshwater inflows into the Basin rather than the Mississippi River discharges because these net water fluxes were similar to the freshwater inflows within the Basin (Figure 6a). It seemed that the net water flows’ magnitude and direction were determined by the interaction between freshwater inflows within the Basin and the Mississippi River. When freshwater inflows inside the Basin increased (e.g., from precipitation), net water flows were enhanced from the Basin to the northern Gulf of Mexico.

4.3. Impact of Increased River Input on TN and TP Budgets

Even though the TN and TP load increased from the Mississippi River, the changes in TN and TP stock in the Basin were relatively small. This small change in TN and TP stocks in the Basin might be related to several factors. Firstly, while increased river input greatly increased the total load of imported TN and TP (by three to four times), it also greatly reduced the residence time of the Barataria Basin from ~170 to ~40 days (Table 4). As a result, almost 75% of the increased nutrient loads were exported directly to the northern Gulf of Mexico, similar to other studies showing an inverse relationship between the export rate of nutrients and freshwater residence time [11,57]. Secondly, the increased river inflows and reduced residence time influenced the phytoplankton residence inside the Basin, reducing their primary production potential despite high nutrient availability [58]. Primary production of phytoplankton was additionally limited by the high sediment (TSS) concentrations in the river water, limiting light availability [59]. The relatively low temperature of the river water also influences phytoplankton growth and composition in the Basin [9]. Short residence time in addition to turbid and colder water has the potential to limit the uptake of TN and TP in the estuary under conditions of increased river inputs [9].
There were no significant changes in TN and TP fluxes through wetland vegetation in any of the three simulated years, 2009 through 2011. The small changes in TN and TP fluxes might be related to no simulated change in wetland vegetation types and area. Thus, in the future with more time of increased input of freshwater, nutrients, and sediment that leads to delta building, the nutrient fluxes within the wetlands near the outfall channel could change.

4.4. Comparing to Other Ecosystems

The annual TN and TP loading rates into the Barataria Basin were compared with other coastal, estuarine, and lagoon ecosystems (Figure 7). With Current River Input, TN and TP loading rates (7.4 g N m−2 year−1 and 0.5 g P m−2 year−1) were similar to Buttermilk Bay, MA, and Albemarle Sound, NC, USA. However, with the Increased River Input (24.1 g N m−2 year−1 and 1.5 g P m−2 year−1) the Barataria Basin becomes more similar to the Potomac River, Chesapeake Bay, USA. Regardless of the amount of river input to the Basin, TN:TP ratios remained well above the Redfield ratio of phytoplankton.
Percent (%) net exports of nitrogen and the freshwater residence time for the Current and Increased River Input conditions were compared with other ecosystems (Figure 8). With the Current River Input, the % TN exported (6% = 0.5 of 8.8 × 10⁹ g N year−1) was much lower than other systems with similar residence times (e.g., Potomac River and Delaware Bay). This pattern was also observed in other systems in the Mississippi River Delta (red and blue dots in Figure 8). The lower % TN exported under the Current River Input is due to the high internal removal of nitrogen in the Basin, such as settling of organic nitrogen, uptake of inorganic nitrogen by phytoplankton and wetland vegetation, and denitrification (as shown in Figure 4a). These processes are more active in the Basin due to the shallow water depth and extensive intertidal wetlands, which remove more nitrogen from the system [74]. However, for the Increased River Input condition, the % TN exported (58% = 20.9 of 35.9 × 10⁹ g N year−1) increased as residence time decreased, making the Basin more similar to Narragansett Bay, USA, in terms of nitrogen retention. This suggests that increased river inputs enhance the advection transport of TN to the northern Gulf of Mexico, limiting internal nitrogen removal processes within the Basin.

5. Conclusions

To understand nitrogen and phosphorus dynamics in the Barataria Basin where large-scale diversions of Mississippi River water are planned, nitrogen and phosphorus budgets were evaluated using a water quality model. The model results showed that organic matter production is driven by phytoplankton and wetland vegetation and their primary production is controlled by the nitrogen and phosphorus cycles in the Basin. The TN and TP fluxes at the southern Barataria Basin were determined by interactions between freshwater inflows into the Basin and the Mississippi River discharge. Numerical model simulations of Current River Input and Increased River Input indicated that about 70–75% of the increased nutrient inflows will be exported to the northern Gulf of Mexico. This is an increase from the 6% of TN and 33% of TP with current residence times within the Basin. The Basin with current river water input has a low % TN exported, compared to other estuaries globally. With increased river water input from the planned sediment diversion, the Barataria Basin could transition to an estuary with a high % of TN exported, comparable to other estuaries globally with similar residence time. Even though 75% of the additional TN load (−20.4 of 27.1 × 10⁹ g N year−1) and 70% of the additional TP load (−1.4 of 2.0 × 10⁹ g P year−1) would flow to the northern Gulf of Mexico, phytoplankton and wetland vegetation could assimilate 25% of the additional nitrogen (6.7 × 10⁹ g N year−1) and 30% of the additional phosphorus (0.6 × 10⁹ g P year−1), reducing the nutrient loading to the Gulf of Mexico each year. These model results can help better understand how proposed sediment diversions on the lower Mississippi River may influence the future ecological conditions of Louisiana coastal estuaries and the near shore northern Gulf of Mexico.

Author Contributions

Conceptualization, H.J.; methodology, H.J., W.N., M.M.B. and T.C.; validation, H.J., W.N., M.M.B. and T.C.; formal analysis, H.J., W.N., M.M.B. and T.C.; investigation, H.J., W.N., M.M.B. and T.C.; writing—original draft preparation, H.J., W.N., M.M.B. and T.C.; writing—review and editing, H.J., W.N., M.M.B. and T.C.; visualization, H.J.; supervision, M.M.B.; project administration, T.C.; funding acquisition, M.M.B. All authors have read and agreed to the published version of the manuscript.

Funding

This project was supported in part by the Science and Engineering Program of The Water Institute of the Gulf with funds from the Louisiana Coastal Protection and Restoration Authority (CPRA) and the Baton Rouge Area Foundation (BRAF) as well as efforts conducted from an earlier study (contract CPRA-2015-TO35-SB01-MB) funded by the Louisiana Coastal Protection and Restoration Authority.

Data Availability Statement

Not applicable.

Acknowledgments

We thank R. Eugene Turner and Erick Swenson for providing 20 years of water quality data in Barataria Basin that helped calibrate the water quality model. We also acknowledge Ehab Meselhe for input into the model design and calibration and initial manuscript ideas. Thank you to four anonymous journal reviewers and Hongqing Wang at the U.S. Geological Survey Wetland and Aquatic Research Center for reviewing earlier drafts.

Conflicts of Interest

The authors declare no conflict of interest.

Appendix A

This appendix provides additional information on simulated water quality variables and model calibration coefficient values.
Table A1. The list of phytoplankton and marsh vegetation taxa and water quality constituents simulated in the water quality model (D-WAQ). * 1–4 indicates characteristics of organic matter simulated in the model; 1 means highly labile, and 4 means highly refractory.
TypeConstituents
PhytoplanktonFreshwater diatoms (FDIATOMS), Freshwater flagellates (FFLGELA), Green algae (GREENS), Microcystis spp. (MICROSYSTIS), Anabaena spp. (ANABAENA), Marine diatoms (MDIATOM), Marine flagellates (MFLAGELA), dinoflagellates (DINOFLAG)
Emergent vegetationTypha spp. (TYDO), Phragmites spp. (PHAU7),
Spartina alterniflora (SPAL), Spartina patens (SPPA), Sagittaria lancifolia (SALA), Sagittaria latifolia (SALA2),
Zizaniopsis miliacea (ZIMI)
Particulate organic matterCarbon POC1-4 *, and Dissolved Organic Carbon (DOC); Nitrogen PON1-4 *, and DON; Phosphorus POP1-4 *, DOP; Sulfur POS1-4 *, DOS
Ammonium, nitrateNH4, NO3
Dissolved phosphate, adsorbed phosphate, vivianite-P,
apatite-P
PO4, AAP, VIVP, APATP
Dissolved silicate,
opal silicate
Si, OPAL
Dissolved oxygen OXY
Sulfate, dissolved sulfide,
particulate sulfide
SO4, SUD, SUP
Inorganic sediment types IM1-3
Salinity Salinity
Table A2. Model calibration coefficients for phytoplankton dynamics.
CoefficientsF.
Diatoms
F.
Flagellates
GreensMicro-cystisAnabaenaM.
Diatoms
M.
Flagellates
Dino-
Flagellates
Pmax at 0 °COrig.0.450.350.070.0470.190.070.090.13
Rev.0.090.020.140.060.050.060.100.09
Pmax temp. funct.Orig.Exp.LinearLinearLinearExp.LinearLinearLinear
Rev.LinearLinearLinearLinearLinearLinearLinearLinear
Pmax temp. coeff.Orig.1.060.03.05.01.09−4.5−14.8
Rev.10.0−8.015.010.010.0−10.010.05.5
Resp at 0 °COrig.0.0310.0310.0120.0120.060.060.060.06
Rev.0.0380.040.0340.0300.0420.0380.0380.04
Resp temp. coeff.Orig.1.0721.0721.0721.0721.0721.0661.0661.066
Rev.1.0601.0701.0701.0701.0801.0901.0701.066
Mort at 0 °C/35 ppt Orig.0.420.420.420.540.540.070.070.075
Rev.0.200.200.200.300.200.040.040.04
Mort at 0 pptOrig.0.0350.0350.0350.080.080.420.420.42
Rev.0.0550.0800.0450.060.060.400.400.40
Mort temp. coeff.Orig.1.0801.0801.0801.0801.0801.0721.0721.072
Rev.1.0801.0701.0801.0801.0751.0801.0801.080
Mort stress shape B1Orig.0.0020.0020.0020.0010.0010.0020.0020.003
Rev.0.00080.00080.00060.00060.00060.0010.00150.0015
Mort stress shape B2Orig.8000800011,50060006000600060006000
Rev.7000800010,00010,00011,000400050006000
Table A3. Model calibration coefficients for organic matter decomposition and settling velocity.
ProcessCoefficientsWater Column
OriginalRevised
VegetatedUn-VegetatedVegetatedUn-Vegetated
Organic matterb_poc2docFraction POC2 converted to DOC (-)0.100.100.050.05
b_poc3docFraction POC3 converted to DOC (-)0.100.100.030.03
Settling, other than phytoplanktonV0SedPOCSettling velocity for POC 1 to 4 (m/day)1.00.51.00.15
V0SedIM1Settling velocity for silt (m/day)0.150.0250.30.15
V0SedIM2Settling velocity for clay (m/day)0.050.0050.10.05
V0SedIM3Settling velocity for sand (m/day)3.03.02.01.0

Appendix B

This appendix provides additional comparisons between modeled and measured water level and water quality variables (i.e., temperature, salinity, chlorophyll a (Chl-a), Total Nitrogen (TN), Dissolved Inorganic Nitrogen (DIN = Ammonium (NH4) + Nitrate (NO3)), Total Phosphorus (TP), Phosphate (PO4), and Silicate (Si)).
Figure A1 shows the water elevation comparison between model and observed data at four USGS stations from 2009 to 2011 [48]. Overall, the model showed a good agreement with the observed data.
Figure A2, Figure A3 and Figure A4 show comparison of water quality variables between model and observed data at three water quality stations representing southern, middle, and northern areas of the Basin from 2009 to 2011. Mean statistical values for all stations are shown in Table A4.
Overall, the model results showed acceptable performance with observed data for salinity, temperature, TN, DIN, PO4, and Si. However, relatively low correlation coefficients (i.e., <0.01) values were obtained for Chl-a and TP. These results suggest that the model was unable to capture appropriately interannual variances of these variables, even though the mean modeled values were consistent with the mean observed values in the Basin (Table A4). The low correlations for Chl-a and TP may be attributed to a lack of understanding of nutrient and phytoplankton dynamics in the Basin.
The model used linearly interpolated boundary conditions based on monthly water quality time series data. However, monthly data cannot capture events occurring between measurements, which may lead to an underestimation or overestimation of nutrient loading into the Basin. This in turn can affect nutrient availability for phytoplankton primary production. The model requires additional data related to phytoplankton dynamics such as growth and mortality rates for each phytoplankton species or group dominant in the Basin. Unfortunately, there is not enough data available to adequately reflect the characteristics of phytoplankton in subtropical estuaries like the Barataria estuary. Regarding TP, the model consistently showed high TP concentrations compared to observed data despite adequate performance for PO4. This was due to high TOP, including POP and DOP. Understanding the sources of these high TOP and the ratio of POP to DOP is critical for improving the model performance.
Figure A1. Comparison of water elevation between model and observed data at four stations from 2009 to 2011. WL-1 = USGS 292800090060000 Little Lake near Bay Dosgris E of Galliano, LA; WL-2 = 292859090004000 Barataria Waterway S of Lafitte, LA; WL-3 = USGS 073802512 Hackberry Bay NW of Grand Isle, LA; WL-4 = USGS 291929089562600 Barataria Bay near Grand Terre Island, LA. See Figure 1 for station locations.
Water 15 01974 g0a1
Figure A2. Water quality model calibration (year 2009) and validation (years 2010 through 2011) results at station WQ-7. See Figure 1 for station locations.
Water 15 01974 g0a2
Figure A3. Water quality model calibration (year 2009) and validation (years 2010 through 2011) results at station WQ-17. See Figure 1 for station locations.
Water 15 01974 g0a3
Figure A4. Water quality model calibration (year 2009) and validation (years 2010 through 2011) results at station WQ-23. See Figure 1 for station locations.
Water 15 01974 g0a4
Table A4. Mean statistical analysis of model performance for water quality variables for the years from 2009 through 2011.
Water Quality
Variable
Mean Obs.Mean ModelBias (B)Correlation
Coefficient (R)
Root Mean Square
Error (RMSE)
Salinity6.954.61−2.340.854.71
Temperature (°C)22.722.7−0.050.981.16
Chl-a (ug L−1)16.314.7−1.600.1713.3
TN (mg L−1)0.600.660.060.610.25
DIN (mg L−1)0.220.17−0.040.600.22
TP (mg L−1)0.050.070.020.340.03
PO4 (mg L−1)0.040.03−0.010.410.03
Si (mg L−1)1.841.32−0.530.690.92

References

  1. Couvillion, B.R.; Beck, H.; Schoolmaster, D.; Fischer, M. Land Area Change in Coastal Louisiana from 1932 to 2016. U.S. Geological Survey Scientific Investigations Map 3381; U.S. Geological Survey: Reston, VA, USA, 2017.
  2. Barras, J.A.; Beville, S.; Britsch, D.; Hartley, S.; Hawes, S.R.; Johnston, J.; Kemp, P.; Kinler, Q.; Martucci, A.; Porthouse, J.; et al. Historical and Projected Coastal Louisiana Land Changes: 1978–2050; U.S. Geological Survey Open File Report 03–334; U.S. Geological Survey: Reston, VA, USA, 2003.
  3. Tornqvist, T.E.; Wallace, D.J.; Storms, J.E.A.; Wallinga, J.; van Dam, R.L.; Blaauw, M.; Derksen, M.S.; Klerks, C.J.W.; Meijneken, C.; Snijders, E.M.A. Mississippi Delta subsidence primarily caused by compaction of Holocene strata. Nat. Geosci. 2008, 1, 173–176. [Google Scholar] [CrossRef]
  4. Blum, M.D.; Roberts, H.H. Drowning of the Mississippi Delta due to insufficient sediment supply and global sea-level rise. Nat. Geosci. 2009, 2, 488–491. [Google Scholar] [CrossRef]
  5. Turner, R.E. Intertidal vegetation and commercial yields of penaeid shrimp. Trans. Am. Fish. Soc. 1977, 106, 411–416. [Google Scholar] [CrossRef]
  6. Day, R.H.; Williams, T.M.; Swarzenski, C.M. Hydrology of tidal freshwater forested wetlands of the southeastern United States. In Ecology of Tidal Freshwater Forested Wetlands of the Southeastern United States; Springer: Berlin/Heidelberg, Germany, 2007; pp. 29–63. [Google Scholar]
  7. Coastal Protection and Restoration Authority. Coastal Protection and Restoration Authority: Strategic Plan Fiscal Year 2017–2018 through Fiscal Year 2021–2022; Strategic fiscal plan; Coastal Protection and Restoration Authority: Baton Rouge, LA, USA, 2017.
  8. Twilley, R.R.; Rivera-Monroy, V. Sediment and Nutrient Tradeoffs in Restoring Mississippi River Delta: Restoration vs Eutrophication. J. Contemp. Water Res. Educ. 2009, 141, 39–44. [Google Scholar] [CrossRef]
  9. Bargu, S.; Justic, D.; White, J.R.; Lane, R.; Day, J.; Paerl, H.; Raynie, R. Mississippi River diversions and phytoplankton dynamics in deltaic Gulf of Mexico estuaries: A review. Estuarine Coast. Shelf Sci. 2019, 221, 39–52. [Google Scholar] [CrossRef]
  10. Turner, R.E.; Rabalais, N.N. Changes in Mississippi River Water Quality This Century. Bioscience 1991, 41, 140–147. [Google Scholar] [CrossRef]
  11. Nixon, S.W.; Ammerman, J.W.; Atkinson, L.P.; Berounsky, V.M.; Billen, G.; Boicourt, W.C.; Boynton, W.R.; Church, T.M.; DiToro, D.M.; Elmgren, R.; et al. The fate of nitrogen and phosphorus at the land-sea margin of the North Atlantic Ocean. Biogeochemistry 1996, 35, 141–180. [Google Scholar] [CrossRef]
  12. Rabalais, N.N.; Turner, R.E.; Scavia, D. Beyond Science into Policy: Gulf of Mexico Hypoxia and the Mississippi River. Bioscience 2002, 52, 129–142. [Google Scholar] [CrossRef]
  13. Tao, B.; Tian, H.; Ren, W.; Yang, J.; Yang, Q.; He, R.; Cai, W.; Lohrenz, S. Increasing Mississippi river discharge throughout the 21st century influenced by changes in climate, land use, and atmospheric CO2. Geophys. Res. Lett. 2014, 41, 4978–4986. [Google Scholar] [CrossRef]
  14. Sinha, E.; Michalak, A.M.; Balaji, V. Eutrophication will increase during the 21st century as a result of precipitation changes. Science 2017, 357, 405. [Google Scholar] [CrossRef]
  15. Baustian, M.M.; Clark, F.R.; Jerabek, A.S.; Wang, Y.; Bienn, H.C.; White, E.D. Modeling current and future freshwater inflow needs of a subtropical estuary to manage and maintain forested wetland ecological conditions. Ecol. Indic. 2018, 85, 791–807. [Google Scholar] [CrossRef]
  16. Kingsford, R.T. Ecological impacts of dams, water diversions and river management on floodplain wetlands in Australia. Austral. Ecol. 2000, 25, 19. [Google Scholar] [CrossRef]
  17. Kingsford, R.T. Conservation management of rivers and wetlands under climate change—A synthesis. Mar. Freshw. Res. 2011, 62, 217–222. [Google Scholar] [CrossRef]
  18. D’Elia, C.F.; Boynton, W.R.; Sanders, J.G. A watershed perspective on nutrient enrichment, science, and policy in the Patuxent River, Maryland: 1960–2000. Estuaries 2003, 26, 171–185. [Google Scholar] [CrossRef]
  19. Boynton, W.; Garber, J.H.; Summers, R.; Kemp, W.M. Inputs, Transformations, and Transport of Nitrogen and Phosphorus in Chesapeake Bay and Selected Tributaries. Estuaries 1995, 18, 285–314. [Google Scholar] [CrossRef]
  20. Nixon, S.W. Prehistoric Nutrient Inputs and Productivity in Narragansett Bay. Estuaries 1997, 20, 253. [Google Scholar] [CrossRef]
  21. Williams, M.R.; Fisher, T.R.; Boynton, W.R.; Cerco, C.F.; Kemp, M.W.; Eshleman, K.N.; Kim, S.; Hood, R.; Fiscus, D.A.; Radcliffe, G.R. An integrated modelling system for management of the Patuxent River estuary and basin, Maryland, USA. Int. J. Remote Sens. 2006, 27, 3705–3726. [Google Scholar] [CrossRef]
  22. Laurent, A.; Fennel, K. Simulated reduction of hypoxia in the northern Gulf of Mexico due to phosphorus limitation. Elementa: Sci. Anthr. 2013, 2, 22. [Google Scholar] [CrossRef]
  23. Wang, H.; Chen, Q.; Hu, K.; La Peyre, M.K. A Modeling Study of the Impacts of Mississippi River Diversion and Sea-Level Rise on Water Quality of a Deltaic Estuary. Estuaries Coasts 2017, 40, 1028–1054. [Google Scholar] [CrossRef]
  24. Laurent, A.; Fennel, K.; Ko, D.S.; Lehrter, J. Climate Change Projected to Exacerbate Impacts of Coastal Eutrophication in the Northern Gulf of Mexico. J. Geophys. Res. Oceans 2018, 123, 3408–3426. [Google Scholar] [CrossRef]
  25. Smits, J.G.C.; Van Beek, J.K.L. ECO: A Generic Eutrophication Model Including Comprehensive Sediment-Water Interaction. Edited by Vishal Shah. PLoS ONE 2013, 8, e68104. [Google Scholar] [CrossRef] [PubMed]
  26. Swenson, E.M.; Cable, J.E.; Fry, B.; Justic, D.; Das, A.; Snedden, G.; Swarzenski, C. Estuarine flushing times influenced by freshwater diversions. Coast. Hydrol. Process. 2006, 33, 403–412. [Google Scholar]
  27. Das, A.; Justić, D.; Swenson, E. Modeling estuarine-shelf exchanges in a deltaic estuary: Implications for coastal carbon budgets and hypoxia. Ecol. Model. 2010, 221, 978–985. [Google Scholar] [CrossRef]
  28. Das, A.; Justic, D.; Swenson, E.; Turner, R.E.; Inoue, M.; Park, D. Coastal land loss and hypoxia: The ‘outwelling’ hypothesis revisited. Environ. Res. Lett. 2011, 6, 025001. [Google Scholar] [CrossRef]
  29. Fitzgerald, D.M.; Kulp, M.; Penland, S.; Flocks, J.; Kindinger, J. Morphologic and stratigraphic evolution of muddy ebb-tidal deltas along a subsiding coast: Barataria Bay, Mississippi River delta. Sedimentology 2004, 51, 1157–1178. [Google Scholar] [CrossRef]
  30. Penland, S.; Ramsey, K.E.; McBride, R.A.; Mestayer, J.T.; Westphal, K.A. Relative Sea Level Rise and Delta-Plain Development in the Terrebonne Parish Region; Coastal Geology Technical Report No. 4; Louisiana Geological Survey: Baton Rouge, LA, USA, 1988. [Google Scholar]
  31. Turner, R.E.; Swenson, E.M.; Milan, C.S.; Lee, J.M. Spatial variations in Chlorophyll a, C, N, and P in a Louisiana estuary from 1994 to 2016. Hydrobiologia 2019, 834, 131–144. [Google Scholar] [CrossRef]
  32. Turner, R.E. Water quality data from the Barataria Basin, 1994–2016. In Distributed by: Gulf of Mexico Research Initiative Information and Data Cooperative (GRIIDC); Harte Research Institute, Texas A&M University–Corpus Christi: Corpus Christi, TX, USA, 2017. [Google Scholar] [CrossRef]
  33. Gagliano, S.; Culley, P.; Earle, D., Jr.; King, P.; Latiolais, C.; Light, P.; Rowland, A.; Shlemon, R.; van Beek, J.L. Environmental Atlas and Mulituse Management Plan for South-Central Louisiana; Department of the Army, New Orleans District Corps of Engineers, Office of Sea Grant, National Oceanic and Atmospheric Administration: Washington, DC, USA, 1973.
  34. Wiseman, W.J., Jr.; Swenson, E.M.; Power, J.; Swenson, E.M.; Power, J. Salinity Trends in Louisiana Estuaries. Estuaries 1990, 13, 265–271. [Google Scholar] [CrossRef]
  35. Habib, E.; Larson, B.F.; Nuttle, W.K.; Rivera-Monroy, V.H.; Nelson, B.R.; Meselhe, E.A.; Twilley, R.R. Effect of rainfall spatial variability and sampling on salinity prediction in an estuarine system. J. Hydrol. 2008, 350, 56–67. [Google Scholar] [CrossRef]
  36. Wiseman, W.J., Jr.; Swenson, E.M. Modeling the effects of produced water discharges on estuarine salinity. In Environmental Impacts of Produced Water Discharges in Coastal Louisiana; Boesch, D.F., Rabalais, N.N., Eds.; Louisiana Universities Marine Consortium: Chauvin, Louisiana, 1989. [Google Scholar]
  37. Orlando, S.P.J.; Rozas, L.P.; Ward, G.H.; Klien, C.J. Salinity Characteristics of Gulf of Mexico Estuaries; National Oceanic and Atmospheric Administration, Office of Ocean Resources Conservation and Assessment: Silver Spring, MD, USA, 1993.
  38. McKee, K.L.; Mendelssohn, I.A.; Materne, M.D. Acute salt marsh dieback in the Mississippi River Deltaic Plain: A drought-induced phenomenon? Glob. Ecol. Biogeogr. 2004, 13, 65–73. [Google Scholar] [CrossRef]
  39. Deltares. Delft3D-FLOW User Manual; Deltares: Delft, The Netherlands, 2014. [Google Scholar]
  40. Hu, K.; Chen, Q.; Wang, H.; Hartig, E.K.; Orton, P.M. Numerical modeling of salt marsh morphological change induced by Hurricane Sandy. Coast. Eng. 2018, 132, 63–81. [Google Scholar] [CrossRef]
  41. Tehranirad, B.; Herdman, L.; Nederhoff, K.; Erikson, L.; Cifelli, R.; Pratt, G.; Leon, M.; Barnard, P. Effect of Fluvial Discharges and Remote Non-Tidal Residuals on Compound Flood Forecasting in San Francisco Bay. Water 2020, 12, 2481. [Google Scholar] [CrossRef]
  42. Smits, J. Delft3D-ECO: Model Documentation; Deltares: Delft, The Netherlands, 2013. [Google Scholar]
  43. Deltares. D-Water Quality: Versatile Water Quality Modelling in 1D, 2D or 3D Systems including Physical, (Bio)Chemical and Biological Processes; User Manual Version 4.99.34158; Deltares: Delft, The Netherlands, 2014. [Google Scholar]
  44. Baustian, M.M.; Meselhe, E.; Jung, H.; Sadid, K.; Duke-Sylvester, S.M.; Visser, J.M.; Allison, M.A.; Moss, L.C.; Ramatchandirane, C.; van Maren, D.S.; et al. Development of an Integrated Biophysical Model to represent morphological and ecological processes in a changing deltaic and coastal ecosystem. Environ. Model. Softw. 2018, 109, 402–419. [Google Scholar] [CrossRef]
  45. Visser, J.M.; Duke-Sylvester, S.; Broussard, W.; Carter, J. Vegetation Model Technical Report (Appendix D-4); Techinal Report; CPRA: Baton Rouge, LA, USA, 2012. [Google Scholar]
  46. Brown, S.; Couvillion, B.R.; Dong, Z.; Meselhe, E.; Visser, J.M.; Wang, Y.; White, E.D. 2017 Coastal Master Plan: Attachment C3-23: ICM Calibration, Validation, and Performance Assessment; Version Final. 2017 Coastal Master Plan; Coastal Protection and Restoration Authority: Baton Rouge, LA, USA, 2017.
  47. Allison, M.A.; Demas, C.R.; Ebersole, B.A.; Kleiss, B.A.; Little, C.D.; Meselhe, E.A.; Powell, N.J.; Pratt, T.C.; Vosburg, B.M. A water and sediment budget for the lower Mississippi–Atchafalaya River in flood years 2008–2010: Implications for sediment discharge to the oceans and coastal restoration in Louisiana. J. Hydrol. 2012, 432–433, 84–97. [Google Scholar] [CrossRef]
  48. U.S. Geological Survey. USGS Water Data for the Nation: U.S. Geological Survey National Water Information System Database; U.S. Geological Survey: Reston, VA, USA, 2016. [CrossRef]
  49. Brown, S. 2017 Coastal Master Plan: Attachment C3-26: Hydrology and Water Quality Boundary Conditions; Version Final. Louisiana’s Comprehensive Master Plan for a Sustainable Coast; Coastal Master Plan: Baton Rouge, LA, USA, 2017.
  50. McCorquodale, J.A.; Roblin, R.J.; Georgiou, I.Y.; Haralampides, K.A. Salinity, Nutrient, and Sediment Dynamics in the Pontchartrain Estuary. J. Coast. Res. 2009, 10054, 71–87. [Google Scholar] [CrossRef]
  51. National Atmospheric Deposition Program. NADP/NTN Monitoring Location LA30. NADP (National Atmospheric Deposition Program). 2002. Available online: http://nadp.sws.uiuc.edu/ (accessed on 4 May 2015).
  52. Meselhe, E.A.; Sadid, K.; Xing, F.; Jung, H.; Baustian, M.M.; Smits, J.G.C.; Maren, B.D.S.; Duke-Sylvester, S.M.; Visser, J.M. Mississippi River Hydrodynamics and Delta Management Study (MRHDMS): Assessment and Analysis of Alternatives; Final Report Task Order 36; The Water Institute of the Gulf. Funded by the Coastal Protection and Restoration Authority: Baton Rouge, LA, USA, 2016. [Google Scholar]
  53. Taylor, K.E. Summarizing multiple aspects of model performance in a single diagram. J. Geophys. Res. Atmos. 2001, 106, 7183–7192. [Google Scholar] [CrossRef]
  54. Jolliff, J.K.; Kindle, J.C.; Shulman, I.; Penta, B.; Friedrichs, M.A.; Helber, R.; Arnone, R.A. Summary diagrams for coupled hydrodynamic-ecosystem model skill assessment. J. Mar. Syst. 2009, 76, 64–82. [Google Scholar] [CrossRef]
  55. Los, F.; Blaas, M. Complexity, accuracy and practical applicability of different biogeochemical model versions. J. Mar. Syst. 2010, 81, 44–74. [Google Scholar] [CrossRef]
  56. Vaccare, J.; Meselhe, E.; White, J.R. The denitrification potential of eroding wetlands in Barataria Bay, LA, USA: Implications for river reconnection. Sci. Total. Environ. 2019, 686, 529–537. [Google Scholar] [CrossRef] [PubMed]
  57. Dettmann, E.H. Effect of Water Residence Time on Annual Export and Denitrification of Nitrogen in Estuaries: A Model Analysis. Estuaries 2001, 24, 481. [Google Scholar] [CrossRef]
  58. Peierls, B.L.; Hall, N.S.; Paerl, H.W. Non-monotonic Responses of Phytoplankton Biomass Accumulation to Hydrologic Variability: A Comparison of Two Coastal Plain North Carolina Estuaries. Estuaries Coasts 2012, 35, 1376–1392. [Google Scholar] [CrossRef]
  59. Valdes-Weaver, L.M.; Piehler, M.F.; Pinckney, J.L.; Howe, K.E.; Rossignol, K.; Paerl, H.W. Long-term temporal and spatial trends in phytoplankton biomass and class-level taxonomic composition in the hydrologically variable Neuse-Pamlico estuarine continuum, North Carolina, U.S.A. Limnol. Oceanogr. 2006, 51, 1410–1420. [Google Scholar] [CrossRef]
  60. Boynton, W.R.; Murray, L.; Hagy, J.D.; Stokes, C.J.; Kemp, W.M. A comparative analysis of eutrophication patterns in a temperate coastal lagoon. Estuaries 1996, 19, 408–421. [Google Scholar] [CrossRef]
  61. Smith, S.V. Responses of Kaneohe Bay, Hawaii, to relaxation of sewage stress. In Estuaries and Nutrients; Neilson, B.J., Cronin, L.E., Eds.; Humana: Clifton, NJ, USA, 1981; pp. 391–410. [Google Scholar]
  62. Yurkovskis, A.; Wulff, F.; Rahm, L.; Andruzaitis, A.; Rodrigues-Medina, M. A nutrient budget of Gulf of Riga; Baltic Sea. Estuar. Coast. Shelf Sci. 1993, 37, 113–127. [Google Scholar] [CrossRef]
  63. Nixon, S.W.; Oviatt, C.A.; Frithsen, J.; Sullivan, B. Nutrients and the productivity of estuarine and coastal marine systems. J. Limnol. Soc. South Afr. 1986, 121, 43–71. [Google Scholar]
  64. Engqvist, A. Long-term nutrient balances in the eutrophication of the Himmerfjarden estuary. Estuar. Coast. Shelf Sci. 1996, 42, 483–507. [Google Scholar] [CrossRef]
  65. Valiela, I.; Costa, J.E. Eutrophication of Buttermilk Bay, a Cape Cod coastal embayment: Concentrations of nutrients and watershed nutrient budgets. Environ. Manag. 1988, 124, 539–553. [Google Scholar] [CrossRef]
  66. Eyre, B.D.; McKee, L.J. Carbon, nitrogen, and phosphorus budgets for a shallow subtropical coastal embayment (Moreton Bay, Australia). Limnol. Oceanogr. 2002, 474, 1043–1055. [Google Scholar] [CrossRef]
  67. Degobbis, D.; Gilmartin, M. Nitrogen, phosphorus, and biogenic silicon budgets for the northern Adriatic Sea. Oceanol. Acta 1990, 13, 31–45. [Google Scholar]
  68. National Oceanographic and Atmospheric Administration/Environmental Protection Agency (NOAA/EPA). Strategic Assessment of Near Coastal Waters, Susceptibility of East Coast Estuaries to Nutrient Discharges: Passamaquoddy Bay to Chesapeake Bay; Strategic Assessment Branch, NOS/NOAA: Rockville, MD, USA, 1989.
  69. Nixon, S.W.; Granger, S.L.; Nowicki, B.L. An assessment of the annual mass balance of carbon, nitrogen and phosphorus in Narragansett Bay. Biogeochemistry 1995, 31, 15–61. [Google Scholar] [CrossRef]
  70. Hager, S.W.; Schemel, L.E. Sources of nitrogen and phosphorus to Northern San Francisco Bay. Estuaries 1992, 15, 40–52. [Google Scholar] [CrossRef]
  71. Mortazavi, B.; Iverson, R.L.; Huang, W.; Lewis, F.G.; Caffrey, J. Nitrogen budget of Apalachicola Bay, a bar-built estuary in the northeastern Gulf of Mexico. Mar. Ecol. Process Ser. 2000, 195, 1–14. [Google Scholar] [CrossRef]
  72. Stammerjohn, S.E.; Smith, E.; Boynton, W.R.; Kemp, W.M. Potential Impacts from Marinas and Boats in Baltimore Harbor; Chesapeake Research Consortium Publication Number 139: Chesapeake Research Consortium: Solomons, MD, USA, 1991. [Google Scholar]
  73. Boynton, W.R.; Burger, N.H.; Stankelis, R.M.; Rohland, F.M.; Hagy, J.D., III; Frank, J.M.; Matteson, L.L.; Weir, M.M. An Environmental Evaluation of Back River with Selected Data from Patapsco River; Ref. No. [UMCES]CBL 98-112b; Chesapeake Biological Laboratory: Solomons, MD, USA, 1998; 90p. [Google Scholar]
  74. Day, J.W.; Conner, W.H.; DeLaune, R.D.; Hopkinson, C.S.; Hunter, R.G.; Shaffer, G.P.; Kandalepas, D.; Keim, R.F.; Kemp, G.P.; Lane, R.R.; et al. A Review of 50 Years of Study of Hydrology, Wetland Dynamics, Aquatic Metabolism, Water Quality and Trophic Status, and Nutrient Biogeochemistry in the Barataria Basin, Mississippi Delta—System Functioning, Human Impacts and Restoration Approaches. Water 2021, 13, 642. [Google Scholar] [CrossRef]
Figure 1. Map of the Barataria Basin showing discrete sampling stations and model domain for water quality modeling. Water quality (WQ) sampling stations [31,32] are indicated by red-filled circles. U.S. Geological Survey (USGS) hydrodynamic stations are indicated by black Xs. Freshwater inflows are indicated by magenta triangles. The planned site of the Mid-Barataria Sediment Diversion is indicated by a blue square. Vegetated wetlands are indicated by green shading. The area used for nutrient budget calculations is contained within the blue polygon. GIWW = Gulf Intracoastal Waterway. ICWW 1&2 = Intracoastal Waterway 1&2. SW Pass = Southwest Pass.
Water 15 01974 g001
Figure 2. Mississippi River discharge, including the Increased River Input scenario, and the threshold flow based on measurements from Belle Chase, LA (USGS 07374525) from 2009 through 2011.
Water 15 01974 g002
Figure 3. Target (a) and Taylor (b) diagrams to describe water quality model performance. Symbols represent water quality variables including temperature and salinity. A dotted circle in (a) represents unRMSD = 0.74. A gray dot in (b) Taylor’s diagram represents a perfect score. Temp is temperature. Sal is salinity. Chl-a is chlorophyll a, TN is total nitrogen, DIN is dissolved inorganic nitrogen, TP is total phosphorus, PO4 is phosphate, and Si is Silicate.
Water 15 01974 g003
Figure 4. Modeled annual mean net TN (a) and TP (b) budgets with Current River Input and with Increased River Input (underlined) in the Barataria Basin. Arrows indicate the net fluxes (×109 g N year−1 or P year−1) and shapes indicate the pools (×109 g N or 109 g P). Positive and negative values indicate the net flux in and out of the pools, respectively.
Water 15 01974 g004
Figure 5. Modeled dissolved inorganic nitrogen (DIN) loss/uptake estimate with Current River Input and Increased River Input. GOM represents the Gulf of Mexico. (a) DIN loss in the Basin. Error bars represent the standard deviation among years. (b) % of DIN loss based on total DIN loss (i.e., a total of the exchange with GOM, Phytoplankton uptake, wetland vegetation uptake, and denitrification).
Water 15 01974 g005
Figure 6. Modeled net flux of water, nitrogen, and phosphorus between the southern Barataria Basin and the Gulf of Mexico with Current River Input (a) and Increased River Input (b). A negative sign indicates that the net flux flows out from the Basin to the northern Gulf of Mexico.
Water 15 01974 g006
Figure 7. Comparison of annual total nitrogen (TN) and total phosphorus (TP) loading rates between the Barataria Basin and other coastal, estuarine, and lagoon ecosystems including the Current River Input and Increased River Input. The solid line represents the Redfield ratio of TN:TP inputs (in mass). 1 Sinepuxent Bay MD [60], 2 Kaneohe Bay HI [61], 3 Isle of Wight Bay MD [60], 4 Baltic Sea [11], 5 Chincoteague Bay MD [60], 6 Kaneohe Bay HI [61], 7 Narragansett Bay RI, prehistoric [20], 8 Gulf of Riga [62], 9 Albemarle Sound NC [63], 10 Himmerfjarden Estuary Sweden [64], 11 Guadalupe Bay TX [11], 12 Buttermilk Bay MA [65], 13 Moreton Bay Australia [66], 14 Seto Inland Sea Japan [63], 15 Newport Bay MD [60], 16 N. The Adriatic Sea [67], 17 Mobile Bay AL [68], 18 Chesapeake Bay MD [19], 19 Delaware Bay DE [11], 20 Narragansett Bay RI, current [69], 21 N. San Francisco Bay CA [70], 22 Potomac River Estuary MD [19], 23 St Martins River MD [60], 24 Apalachicola Bay FL [71], 25 Patapsco River Estuary MD [72], 26 Tokyo Bay Japan [63], 27 Back River MD [73], 28 Boston Harbor [11], 29 Western Scheldt Netherlands [11].
Water 15 01974 g007
Figure 8. Residence time and percent (%) total nitrogen exported from different estuarine and coastal systems with the Barataria Basin represented with Current River Input and Increased River Input (Modified from [74]). Red and blue dots represent systems with shallow, open water areas and large areas of emergent vegetation.
Water 15 01974 g008
Table 1. Annual freshwater inflows into the Barataria Basin model domain for the water quality model simulation period (2009 through 2011). Those in bold indicate the total freshwater inflow in the Basin for the current River input and Increased River input, respectively.
Freshwater Inflows (×109 m3 year−1)Years
200920102011
Davis Pond Freshwater Diversion3.540.360.09
Intracoastal Waterway (ICWW) 1 and 20.100.100.10
Lac des Allemands1.411.411.41
Naomi Siphon0.110.360.09
Gulf Intracoastal Waterway (GIWW)1.841.841.84
West Pointe a la Hache Siphon0.400.650.28
Net precipitation0.710.74−0.60
All in Barataria Basin8.115.463.21
All in Barataria Basin with Increased River Input11.413.216.9
Grand Pass54.449.951.5
West Bay34.231.032.2
Table 2. Modeled annual mean total nitrogen (TN) and dissolved inorganic nitrogen (DIN) fluxes of the Barataria Basin for a scenario with Current River Input and Increased River Input for years 2009 through 2011. Note that grey highlighted cells (bold numbers) are summarized in Figure 4. GOM represents the Gulf of Mexico. Positive and negative values indicate the net flux in and out of the pools, respectively.
Water Column PoolGains (×109 g N year−1)Losses (×109 g N year−1)Net (×109 g N year−1)
Current River InputIncreased River InputCurrent River InputIncreased River InputCurrent River InputIncreased River Input
TNDINTNDINTNDINTNDINTNDINTNDIN
Water inflows8.85.735.925.50.00.00.00.08.85.735.925.5
Exchange with GOM96.637.899.739.597.130.5120.741.6−0.57.3−20.9−2.1
Sediment/Soils101.651.8118.666.2144.322.8169.336.5−42.829.0−50.729.7
Atmosphere0.60.60.60.60.00.00.00.00.60.60.60.6
Internal process15.015.017.517.50.00.00.00.015.015.017.517.5
Phytoplankton132.417.0159.920.2132.375.0159.891.70.1−58.00.1−71.5
Wetland vegetation33.70.035.10.00.00.00.00.033.70.035.10.0
Denitrification0.00.00.00.00.00.00.00.0−0.0−0.0−0.0−0.0
Sediment/Soils PoolGains (×109 g N year−1)Losses (×109 g N year−1)Net (×109 g N year−1)
Current River InputIncreased River InputCurrent River InputIncreased River InputCurrent River InputIncreased River Input
TNDINTNDINTNDINTNDINTNDINTNDIN
Water column144.322.8169.336.5101.651.8118.666.242.8−29.050.7−29.7
Atmosphere2.52.52.52.50.00.00.00.02.52.52.52.5
Wetland vegetation54.60.056.80.088.388.391.991.9−33.7−88.3−35.1−91.9
Internal process133.7133.7143.3143.30.00.00.00.0133.7133.7143.3143.3
Denitrification0.00.00.00.021.421.426.426.4−21.4−21.4−26.4−26.4
Seepage/Burial9.92.58.32.200009.92.58.32.2
Table 3. Modeled annual mean total phosphorus (TP) and phosphate (PO4) fluxes of the Barataria Basin for a scenario with Current River Input and Increased River Input for years 2009 through 2011. Note that grey highlighted cells (bold numbers) are summarized in Figure 4. GOM represents the Gulf of Mexico. Positive and negative values indicate the net flux in and out of the pools, respectively.
Water Column PoolGains (×109 g P year−1)Losses (×109 g P year−1)Net (×109 g P year−1)
Current River InputIncreased River InputCurrent River InputIncreased River InputCurrent River InputIncreased River Input
TPPO4TPPO4TPPO4TPPO4TPPO4TPPO4
Water inflows0.90.42.91.30.00.00.00.00.90.42.91.3
Exchange with GOM9.43.89.63.79.73.411.33.7−0.30.4−1.70.0
Sediment/Soils12.38.513.08.814.14.715.54.9−1.93.8−2.53.9
Atmosphere0.10.10.10.10.00.00.00.00.10.10.10.1
Phytoplankton13.11.714.51.813.17.514.18.40.0−5.80.4−6.6
Internal process0.01.20.01.30.00.10.00.10.01.10.01.2
Wetland vegetation1.20.01.20.00.00.00.00.01.20.01.20.0
Sediment/Soils PoolGains (×109 g P year−1)Losses (×109 g P year−1)Net (×109 g P year−1)
Current River InputIncreased River InputCurrent River InputIncreased River InputCurrent River InputIncreased River Input
TPPO4TPPO4TPPO4TPPO4TPPO4TPPO4
Water 14.14.715.54.912.38.513.08.81.9−3.82.5−3.9
Atmosphere0.20.20.20.20.00.00.00.00.20.20.20.2
Internal process0.011.20.011.60.04.40.04.60.06.80.07.0
Wetland vegetation2.00.02.10.03.23.23.33.3−1.2−3.2−1.2−3.3
Seepage/Burial0.00.00.00.00.80.01.50.0−0.80.0−1.50.0
Table 4. Modeled annual water volume, residence time, net total nitrogen (TN), and total phosphorus (TP) fluxes (×109 g N year−1) for Current River Input and Increased River Input in the Barataria Basin for years 2009, 2010, and 2011. The net fluxes in the parenthesis represent dissolved inorganic nitrogen (DIN) and phosphate (PO4), respectively. The positive sign represents gains of nitrogen into the Basin. GOM represents the Gulf of Mexico.
Water Volume
(×109 m3)
Residence Time (Days)TN (DIN)
×109 g N year−1
TP (PO4)
×109 g P year−1
Water
Inflows
Exchange with GOMWater
Inflows
Exchange with GOM
Current River
Input
20092.1387.712.8 (8.5)−2.8 (6.2)1.3 (0.55)−0.5 (0.3)
20102.08117.87.9 (5.5)−0.5 (7.5)0.8 (0.37)−0.3 (0.4)
20112.07142.25.9 (3.3)1.8 (8.2)0.5 (0.29)0.0 (0.6)
Increased River
Input
20092.1537.135.5 (26.1)−20.2 (−1.6)3.1 (1.3)−1.8 (0.0)
20102.4544.833.8 (25.3)−19.0 (−3.0)2.8 (1.4)−1.8 (−0.3)
20112.0935.938.5 (25.1)−23.6 (−1.7)2.8 (1.2)−1.6 (0.3)
Disclaimer/Publisher’s Note: The statements, opinions and data contained in all publications are solely those of the individual author(s) and contributor(s) and not of MDPI and/or the editor(s). MDPI and/or the editor(s) disclaim responsibility for any injury to people or property resulting from any ideas, methods, instructions or products referred to in the content.

