Article

Internal Erosion Stabilization of Cohesionless Soil Using Lime

Department of Civil Engineering, American University of Sharjah, Sharjah P.O. Box 26666, United Arab Emirates
*
Author to whom correspondence should be addressed.
Water 2023, 15(11), 1992; https://doi.org/10.3390/w15111992
Submission received: 20 April 2023 / Revised: 10 May 2023 / Accepted: 19 May 2023 / Published: 24 May 2023
(This article belongs to the Special Issue Soil Erosion Measurement Techniques and Field Experiments)

Abstract

:
Soil embankments are valuable for the adequate reserve and supply of water to multiple industries. However, they are susceptible to internal soil erosion, which may ultimately lead to structural collapse. To counteract this issue, soil stabilization is practiced in the construction industry. This paper proposes the internal erosion stabilization of cohesionless soil using quicklime. For this research, two cohesionless soil types were investigated and treated with quicklime: poorly graded and well-graded cohesionless soils. For poorly graded soil, the lime percentage varied from 0.0% to 6.0% based on the soil’s weight, while for well-graded soil, it ranged from 0.0% to 3.0%. All the soil specimens were cured for 24 h and tested using the hole erosion test (HET) to replicate the internal erosion effortlessly. The analyzed results demonstrated the efficiency of quicklime as an internal erosion stabilizer for cohesionless soils. The optimum lime content for poorly graded cohesionless soils was 5.0%; for well-graded, the percentage was approximately 3.0%. Moreover, adding lime significantly improved the strength, critical shear stress, and erosion rate index of the soil.

1. Introduction

The adequate availability and supply of water is essential for the effective operation of industries such as construction and agriculture. Earthen embankment structures generally provide proper water sources to these industries by alternating, averting, or reserving water [1]. Thus, the structural failure of earthen embankments can lead to a catastrophe, destroying multiple lives and properties [2]. Luthi [3] argued that approximately 30–50% of embankment failures and mishaps are caused by the internal erosion of the soil. Even Hanneman [4] and Foster et al. [5] found that internal erosion is the most prominent reason for embankment failures. Internal soil erosion is triggered by soil particle erosion due to water penetration through the structure [3,6]. A continuous flow of water through the soil leads to the formation of holes in the structure, resulting in structural failure. Hence, seepage is considered a threat to earthen structures during construction’s design and operation stages. Therefore, engineers are advised to be cautious and aware of the properties of materials used in earthen structures [2]. Due to the gravitas of this issue, recent studies [7,8] have emphasized the effects of internal erosion of soil on earthen structures and their counteractive measures. Many studies [9,10,11,12] have investigated the factors affecting internal soil erosion, such as soil type, water, and material properties, and soil-piping resistance relationships. For dispersive soil, soil resistance against erosion rate increases with higher salt content in the water [9]. To measure the embankment soil erosion parameters, hole erosion test (HET) and slot erosion test (SET) methods were established by Wan and Fell [13]. Soil investigation determined that factors such as fine soil and clay content, clay mineralogy, dry density, compaction water content, dispersity, degree of saturation, plasticity, and cementing materials (such as iron oxides) affect their shear strength parameters, permeability, settlement, and erosion rate values [14,15,16]. In addition, it was concluded that higher erosion with reduced critical shear stress occurs in non-cohesive and coarse-grained soils compared to fine-grained soils.
To prevent embankment dam failure, stabilization techniques are performed on the soil, increasing the soil strength and restricting the formation of holes in the structure. Soil stabilization may be performed by physical or chemical means [17]. Many research studies [18,19,20,21,22,23,24,25,26,27] have focused on the effect of adding stabilization materials to the soil. Lemaire et al. [18] investigated the inclusion of a cement–lime mix in silty soils. The silty soil was stabilized by adding 5.0% and 1.0% of cement and lime, respectively. Moreover, a significant increase in the structure’s unconfined compressive strength and microporosity filling was noticed. In addition, stabilization with a lime and micro silica admixture of silty sand soils was investigated by Karimi et al. [19] in the presence of sulfates. The results demonstrated a significant increase in the soil’s California Bearing Ratio (CBR) value and reduced swelling properties. Thus, micro silica waste material successfully improved the silty sand soil resistance. Khemissa and Mahamedi [20] mixed cement and lime in over-consolidated clay and determined that the addition of 8.0% of cement and 4.0% of lime into the clay improved its bearing capacity, durability, and shear strength. Al-Aghbari, Mohamedzein, and Taha [21] tested the stabilization effects of Portland cement and cement kiln dust on desert sands. The results showed remarkable improvements in the shear strength, maximum dry density, and unconfined compressive strength of the soil. Hence, the study concluded that combining cement and cement kiln dust enhances desert sand’s shear strength and compressibility properties [21]. They also investigated the impact of utilizing municipal solid waste incinerator ash to strengthen desert sand soil. Incinerator ash enhanced the shear and unconfined compressive strength characteristics with lower permeability [22]. Recently, Soundarya [23] studied the effects of fly ash and ground granulated blast-furnace slag (GGBS) on lime-stabilized mud blocks. Approximately 5% of lime was added, and the fly ash and GGBS contents varied from additions of 0% to 10% (with a 2% increment). The results demonstrated a positive correlation between the amount of fly ash and GGBS and the compressive strength of the mud blocks. Wet compressive strength was significantly affected by the increase in the GGBS amount compared to the fly ash amount. Additionally, fly ash improved water absorption rates more than GGBS since fly ash is more efficient in producing cementitious materials with lime and reducing pore interconnectivity. Stabilized compressed earth blocks were also tested with lime and a combination of cement and lime by Malkanthi, Balthazaar, and Perera [24]. It was found that the cement and lime addition provided higher compressive strength than the addition of just lime. Ten percent lime gave one of the best performances, and it was concluded that lime-stabilized blocks might be used for single-story buildings. However, for Grade 2 block strength with 15% and 10% of clay and silt, respectively, a mix of 5% of cement and 5% of lime was required. For blocks with 5% clay and silt, approximately 7% cement and 3% lime were required. Studies have also used a combination of cement and rice husk ash [28] or cement and fly ash [29] to stabilize the soil. Attom and Shatnawi determined that clayey soil is strengthened with the inclusion of wheat husk [30]. Internal erosion soil stabilization using chemicals was investigated by Vinod et al. [25] and Vakili et al. [26]. Vinod et al. [25] found that adding lignosulfonate to dispersive soils results in better soil erosion coefficients and critical shear stress, ultimately providing higher soil strength and stabilization. In comparison, Vakili et al. [26] mixed lignosulfonate and reinforced polypropylene in dispersive soil to stabilize it against internal erosion. Other studies emphasizing soil stabilization include [31,32,33,34,35,36,37,38,39]. Although significant research has been performed using lime to stabilize clayey soils, a lack of research exists on using lime to stabilize cohesionless soils such as sand. One of the few studies on the effect of lime stabilization on cohesionless (sandy) soil with different curing times was conducted by the authors [40]. For this study, poorly and well-graded soil types were mixed with quicklime and tested after 1, 2, and 7 days of curing. Using the hole erosion test (HET), the soil types were determined to be stabilized to an optimum level with a minimum of 2 days of curing. Another study on the effect of lime stabilization of coarse sandy soil against internal erosion was performed by Elandaloussi et al. [41]. The erosion test results showed that the lime stabilization effect begins with a curing time of only 24 h due to the agglomeration of fine particles. Moreover, as per their reported results, longer curing times, such as 3 months, did not significantly increase the efficiency of lime treatment.
Thus, this research studies the effect of different lime percentages at a single curing time, and this emphasizes the effect of the internal erosion stabilization of cohesionless soils with different lime percentages and a short (24 h) curing time. As mentioned, the authors performed a similar investigative study on the effect of curing time on lime-stabilized cohesionless (sandy) soil in [40]. Poorly and well-graded soils were examined with quick lime in these studies. Different lime percentages were mixed with the soil based on the soil weight. The soil samples were compacted and prepared in a standard proctor mold with a relative compaction rate of 95.0%. Lime addition resulted in improvement in the soil strength and erosion rate index. The rest of the paper has been organized in the following manner: Firstly, the research significance is presented. Next, the methodology used to prepare and test the soil samples is provided. Following this, the results and their detailed discussion are presented, including the addition of lime effect on water flow path, critical shear stress, erosion rate index, and internal soil erosion. Lastly, the conclusion of the study is provided.

2. Research Significance

Soil embankments are essential for providing, diverting, and retaining water for different purposes. Since the primary component of any soil embankment is sand, it is vital to stabilize the sand being used for the effective and successful operation of the structure. Based on the reviewed literature, lime is found to be an efficient and cost-effective stabilizer for clayey soil. However, to the best of the author’s knowledge, there has been insufficient research investigating the stabilization effect of the addition of lime to cohesionless soil. Hence, this study tries to increase the knowledge base by studying the internal erosion stabilization of cohesionless soil using lime and promoting its utilization with confidence in the industry. This research studied two cohesionless soil types (poorly and well-graded), which were cured for 24 h. The poorly graded soil was mixed with lime in percentages from 0.0% to 6.0% (based on the soil’s weight), and well-graded soil was mixed with lime in percentages from 0.0% to 3.0%. The hole erosion test (HET) was adopted to replicate the internal erosion of the soil scenario. This study assists in analyzing lime-stabilized cohesionless soil properties. It also supports the raising of awareness about internal soil erosion in earth-fill dams and counteractive measures using soil stabilization. Further studies may be performed on this topic using other stabilization materials, such as solid waste and bitumen.

3. Experimental Program and Methodology

The experimental program of this study is inspired by [13] and the authors performed a similar investigation previously [40] to study the curing time effect.

3.1. Material Properties

The material properties of the soil studied are displayed in Table 1. Specific tests were performed to determine the initial soil properties in accordance with ASTM standard procedures. Based on the results in Table 1, it is clear that Soil A was poorly graded while Soil B was well-graded cohesionless soil. The manufacturer provided the quick lime properties (which can be found in [40]).

3.2. Specimen Preparation

Lime percentages from 0.0% to 6.0% were added for Soil A, while, for Soil B, lime percentages from 0.0% to 3.0% were used. Thus, three soil specimens were prepared and cured for each lime percentage for 24 h. The soil specimen preparation included the following steps: Firstly, the amount of soil, lime, and water (based on optimum moisture content) was measured and mixed. Then, compaction of the prepared mix in a mold was performed with a relative compaction rate of 95%. Following this, a hole was drilled with a diameter of 6 mm through the compacted soil specimen’s cross-section, as shown in Figure 1a (this step was conducted to initiate soil piping erosion). Lastly, the specimen was labeled and stored for its curing time. An average of two specimens for each lime percentage was considered for higher accuracy of the results. The final results are discussed in this paper for each lime percentage. As mentioned, this study adopted the hole erosion test, HET (by Wan and Fell [13]) to analyze the soil resistance against internal erosion. This method is preferred because of its simplicity, ease, and lower cost. Moreover, it is considered the best method to replicate piping erosion behavior [42]. The HET apparatus and schematic diagram are displayed in Figure 1b,c, respectively.

3.3. Specimen Testing Process

The upstream chamber of the HET apparatus was filled with gravel particles of 20 mm in diameter to regulate and filter the water flow. Subsequently, the prepared specimen was fitted between the inlet and outlet chambers with the help of O rings and bolts (as shown in Figure 1b). The water head ranged between 800 and 1200 mm, and the test was initiated by allowing the water to flow through the hole of the specimen. At different intervals of test run time, the rate of flow was measured using the outlet pipe. The test ran until the specimen’s failure, with a minimum of 45 min. At the end of the test, the water flow was stopped, and the specimen was extracted. Finally, the final hole diameter was determined, and the test apparatus was cleaned before reusing it for other specimens. It is advised that future researchers interested in researching this topic should ensure that the HET apparatus is built to be leakproof to avoid any water leaks during the testing process. Additionally, during the test, the flow rate (water volume and time) must be determined accurately by measuring them at multiple time intervals throughout the test. Furthermore, the final hole diameters are advised to be measured using a vernier caliper for higher accuracy.

3.4. Process for Analysing the Data

The HET test data helped determine the soil’s shear stress at the start of erosion and the erosion rate index. Erosion occurs when the water force outpaces the hydraulic shear stress [13]. The soil erosion rate index ( I ) parameter is a good indicator of the soil’s internal erosion resistance. Stronger soil internal erosion resistance provides a higher erosion rate index. The soil erosion descriptions for different erosion rate indices are provided in Table 2.
Initially, Reynold’s number ( R ) was utilized to determine the type of water flow as per Equations (1) and (2):
V t = Q t π φ t 2 4
R = V φ t ρ w ν
where V t denotes the average velocity of water flowing through the hole (m/s) at time t, Qt is the flow rate at time t (m3/s), φ t is the water flow path (hole) diameter at time t (m), ρ w is the water density (kg/m3), and ν denotes the absolute water viscosity (Pa·s) = 1.00 × 10⁻³ [40,43]. Using the flow type, flow rate, and initial and final measured hole diameters, the friction factors ( f T t or f L t ) were determined at the start and end of the test with the help of Equations (3) and (4) [13,40]:
T u r b u l e n t   F l o w : φ t = [ 64 Q t 2 f T t π 2 ρ w g s t ] 1 / 5
L a m i n a r   F l o w : φ t = [ 16 Q t f L t π ρ w g s t ] 1 / 3
where f T t or f L t is the turbulent or laminar friction factors at any time, respectively, ρ w is the water density, g is the acceleration due to gravity, and s t is the soil sample hydraulic gradient. Based on the calculated initial and final friction factors, the friction factor versus the time curve was plotted, giving the friction factor value at any time ( f T t or f L t ). Then, the hole diameter at any time ( φ t ) was calculated by reusing Equations (3) or (4) with the evaluated friction factors at any time ( f T t or f L t ). Further, knowing the φ t values, the rate of diameter change with time d φ t d t was determined. Next, using the evaluated values, soil dry density ( ρ d ) and Equations (5) and (6), hydraulic shear stress ( τ t ) and erosion rate per unit surface area ( ε t · ) at time t were determined [13,40]:
τ t = ρ w g s t φ t 4
ε t · = ρ d 2 d φ t d t
ε t · = C e ( τ t τ c )
I = l o g ( C e )
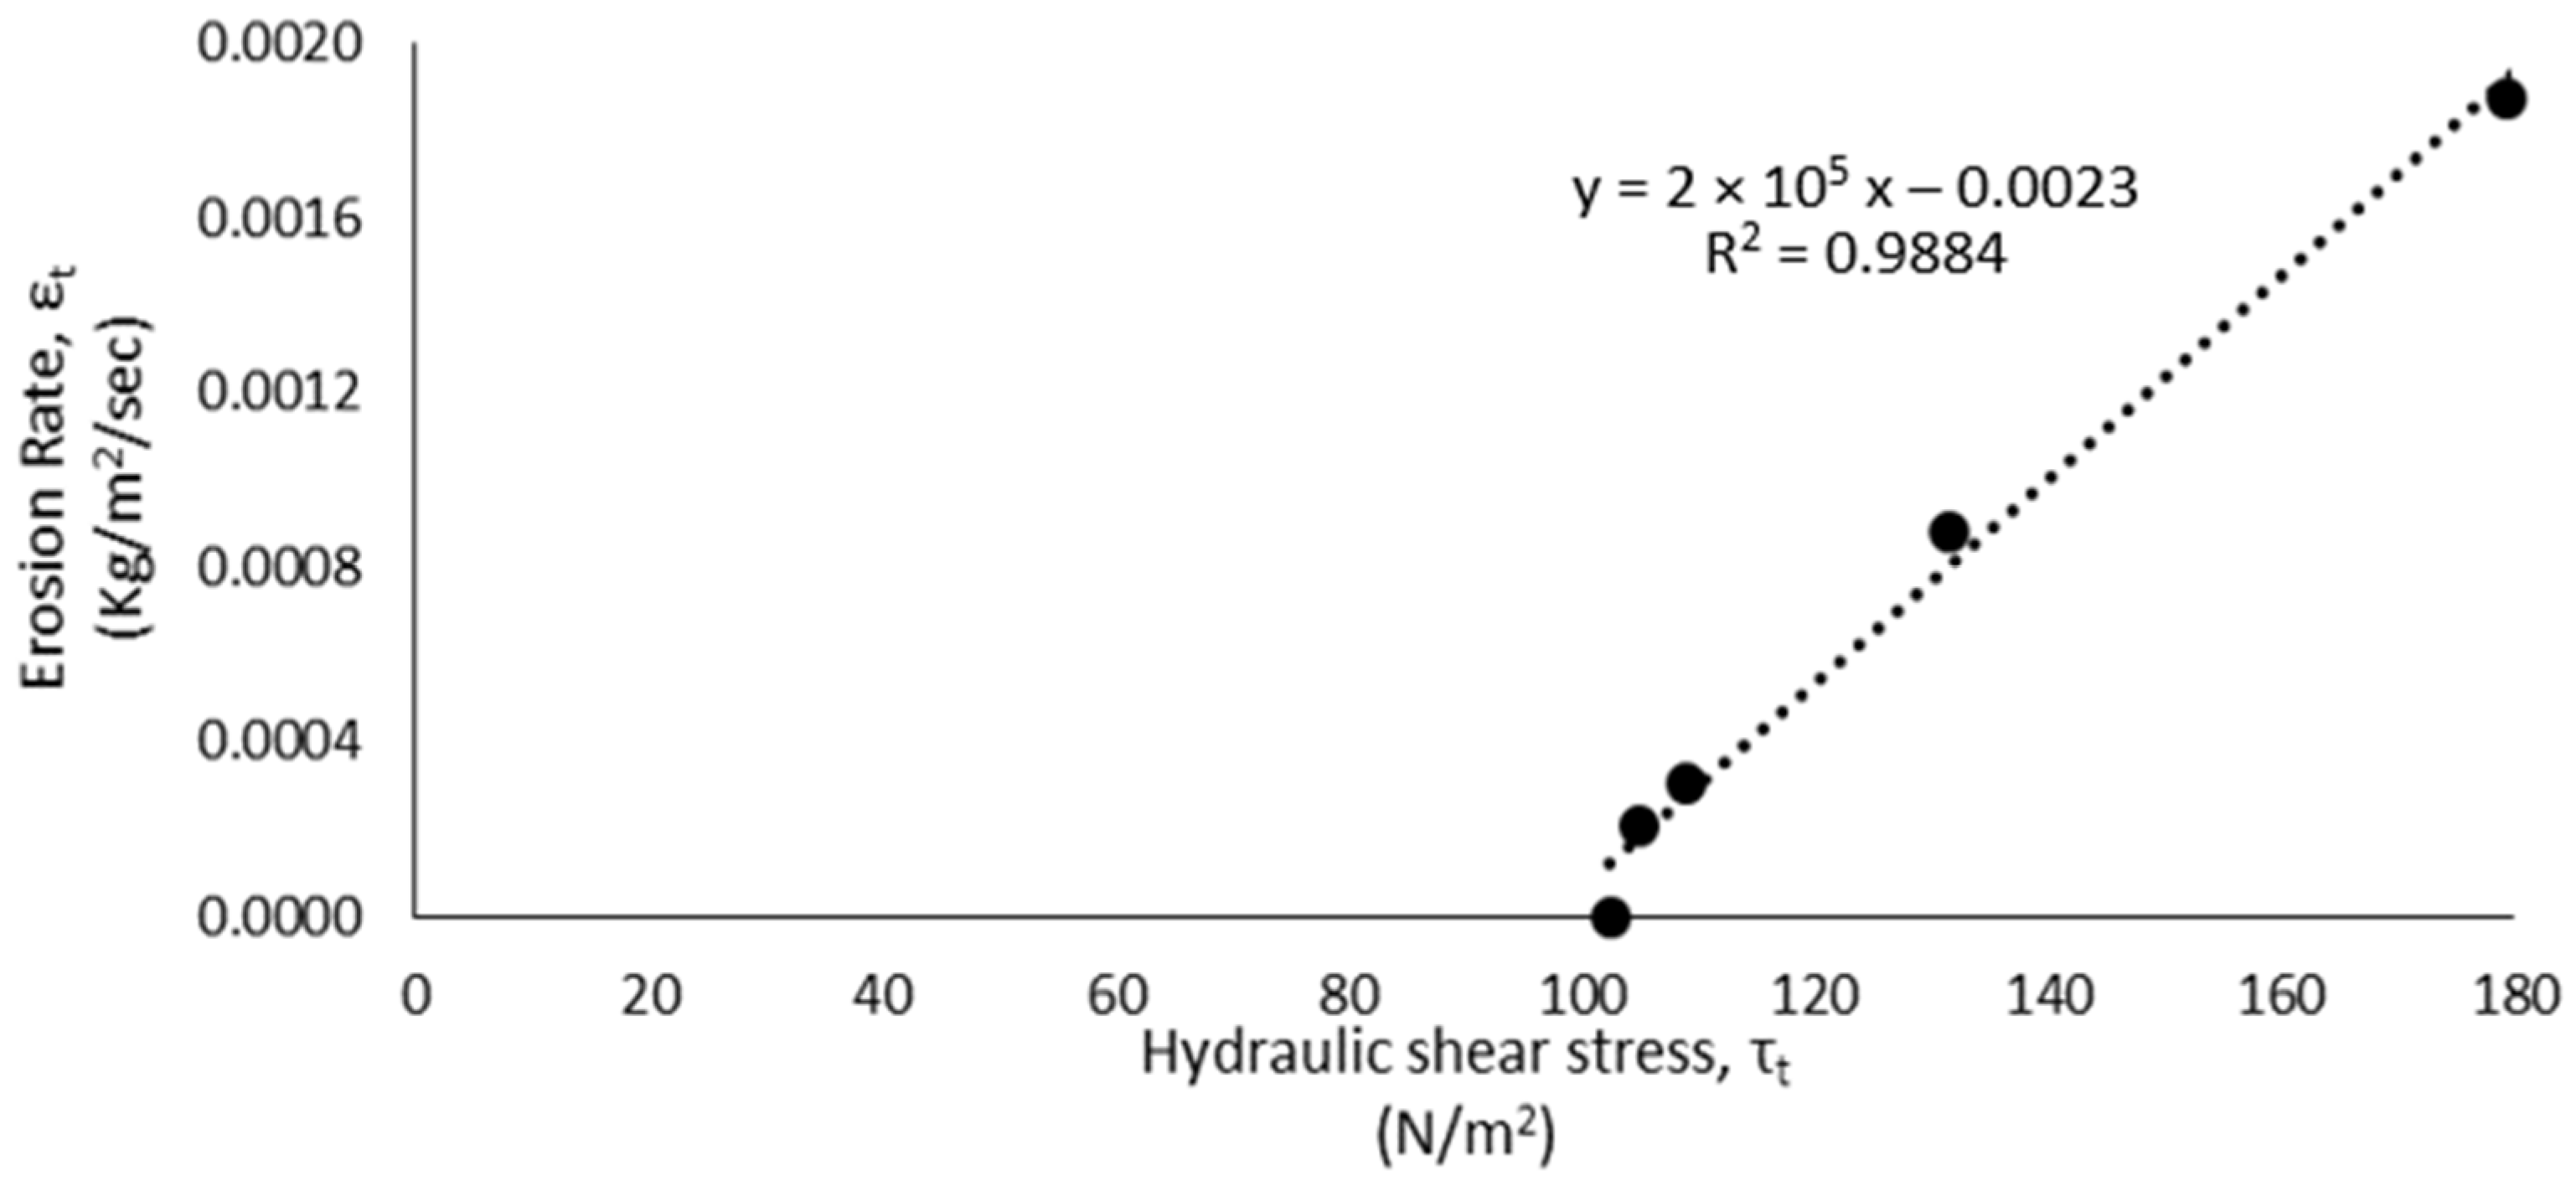
Subsequently, as illustrated in Figure 2, the erosion rate ( ε t · ) was plotted against hydraulic shear stress ( τ t ) to obtain the soil erosion coefficient ( C e ) (as per Equation (7)). Lastly, utilizing the C e value and Equations (7) and (8), the critical shear stress ( τ c ) and soil erosion rate index ( I ) values were respectively determined. The I value was then compared with the details in Table 2 to describe the soil erosion type [13,40].

4. Results and Discussion

4.1. Addition of Lime Effect on Water Flow Path

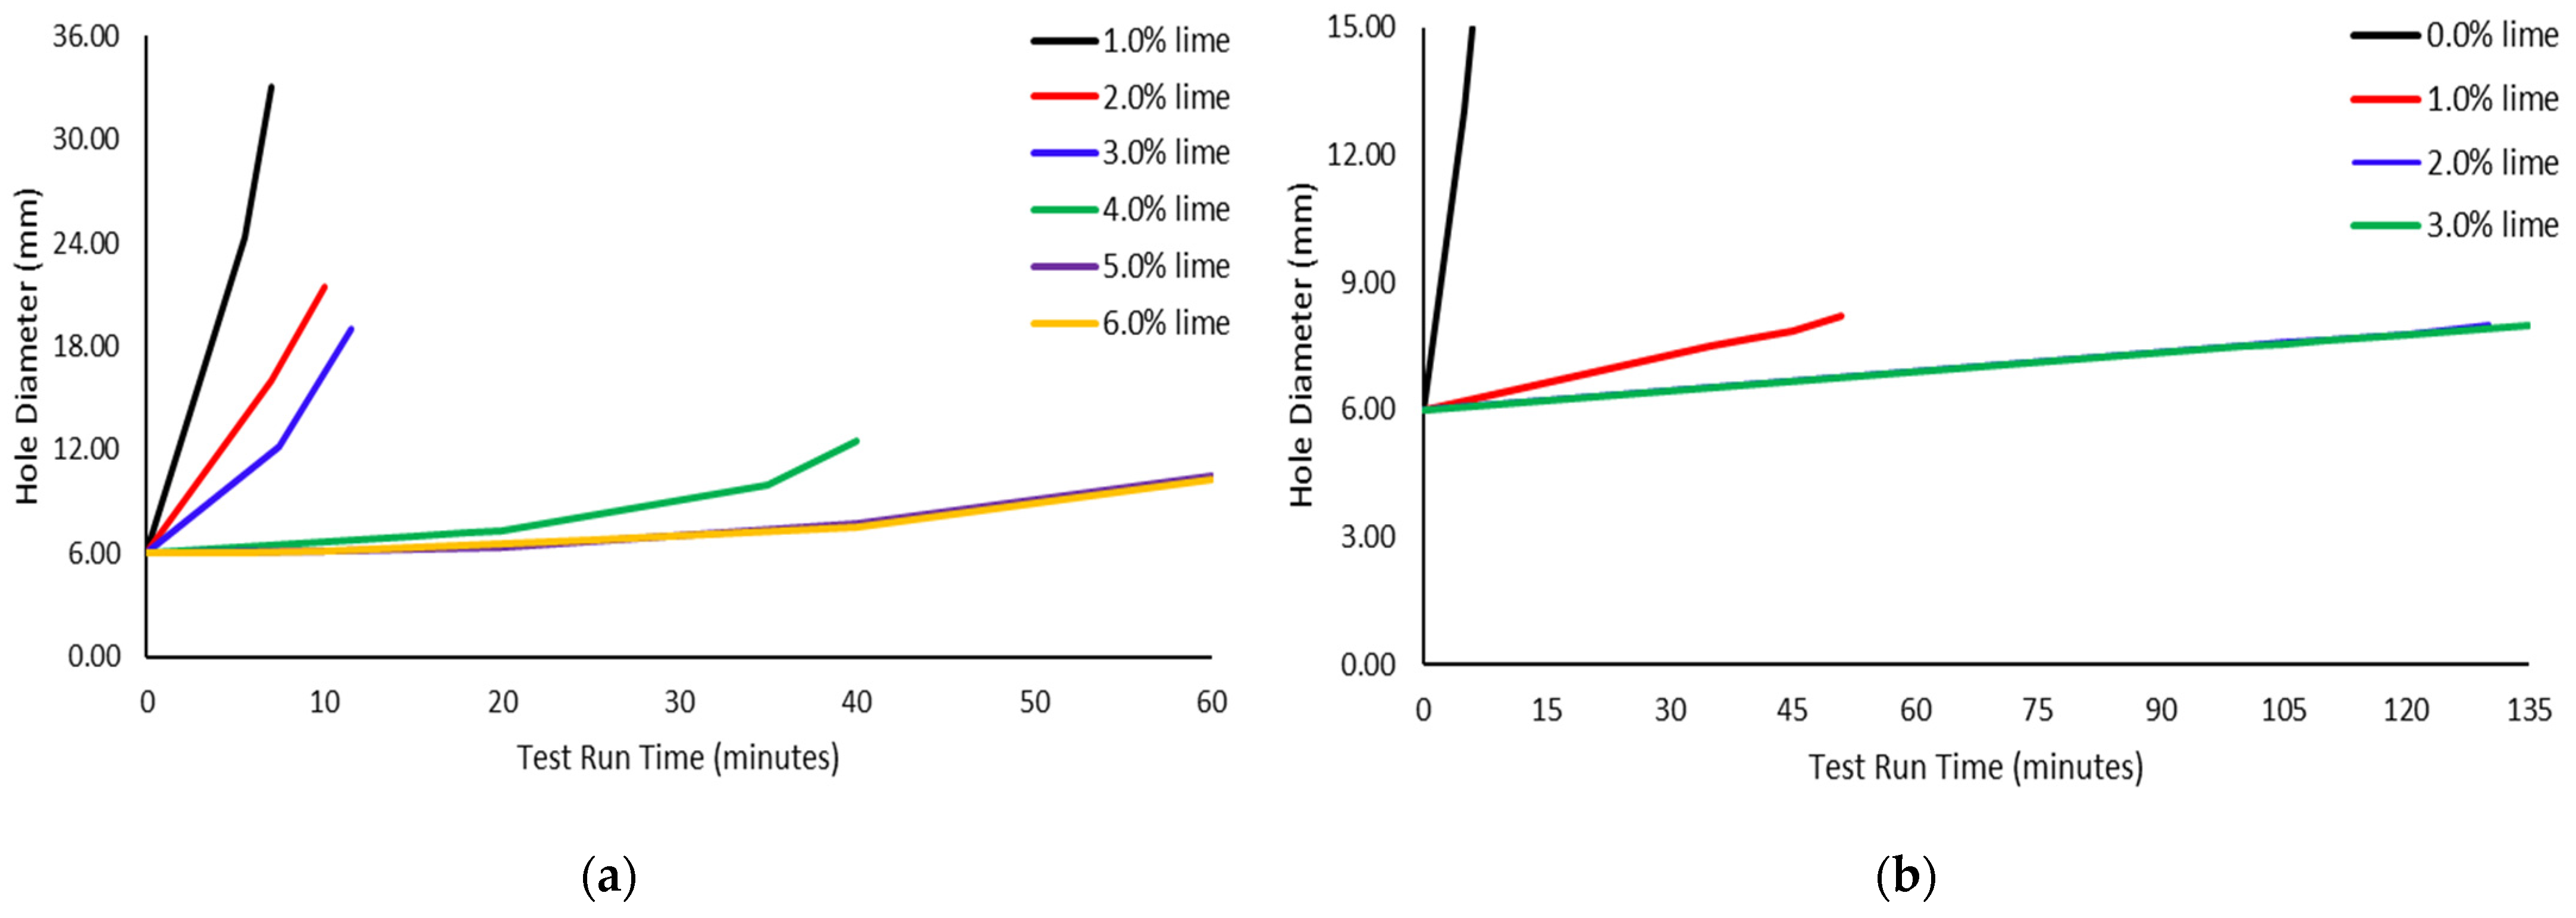
The effect of lime percentage on the water flow path (hole) diameter over their test run time (in minutes) for Soils A and B with 24 h curing time is illustrated in Figure 3. For Soil A, with an initial hole diameter of 6.0 mm, an increase in hole diameter of approximately 27.0 mm (33.0–6.0 mm) was observed at 1.0% of lime, with a test run time of approximately 7 min. However, at 2.0% of lime, the increase in the hole diameter was approximately 15.5 mm (21.5–6.0 mm), with a test run time of 10 min. Therefore, a 42.6% reduction in hole diameter occurred with the increase in lime content from 1.0% to 2.0%, along with a longer test run time. This demonstrates that the internal erosion resistance of the soil improved with the increase in the addition of lime. Moreover, it is evident from Figure 3a that with a further increase in lime percentage, the change in water flow path (hole) diameter reduces, with the lowest change and longest test run time occurring at 6.0% lime for Soil A. At 6.0% lime, only a 4.3 mm increase (10.3–6.0 mm) in the hole diameter was observed with a test run time of approximately an hour (60 min). Thus, an 84.1% reduction in the change in diameter was obtained with the increase in lime from 1.0% to 6.0%. Hence, the soil strength improved significantly with a higher lime content and reduced the internal erosion rate by resisting the change in the water flow path (hole) diameter. The results for 0.0% of lime in Soil A are not provided since the soil specimen collapsed within a few seconds of the test run time; thus, data could not be derived for this specimen. Therefore, it was noted as a failure point and was deemed insignificant. Similarly, Soil B portrayed that a higher lime percentage decreased the change in water flow path diameter (as shown in Figure 3b). An increase of 9.0 mm (15.0–6.0 mm) was noted at 0.0% lime with a test run time of 6 min. At 1.0% of lime, the hole diameter change was approximately 2.2 mm (8.2–6.0 mm), with a test run time of 51 min. Thus, the water flow path diameter change was decreased by 75.6% with a longer test run time. A minimalistic change in water flow path diameter of 2.0 mm (8.0–6.0 mm) was noticed at 3.0% lime with a test run time of more than 2 h (approximately 135 min). Hence, the inclusion of 3.0% lime in Soil B and 24 h of curing time decreased the diameter change by 77.8% compared to the Soil B specimen without any lime. Therefore, a higher amount of lime strengthened the cohesionless soil and significantly improved its internal erosion resistance ability.
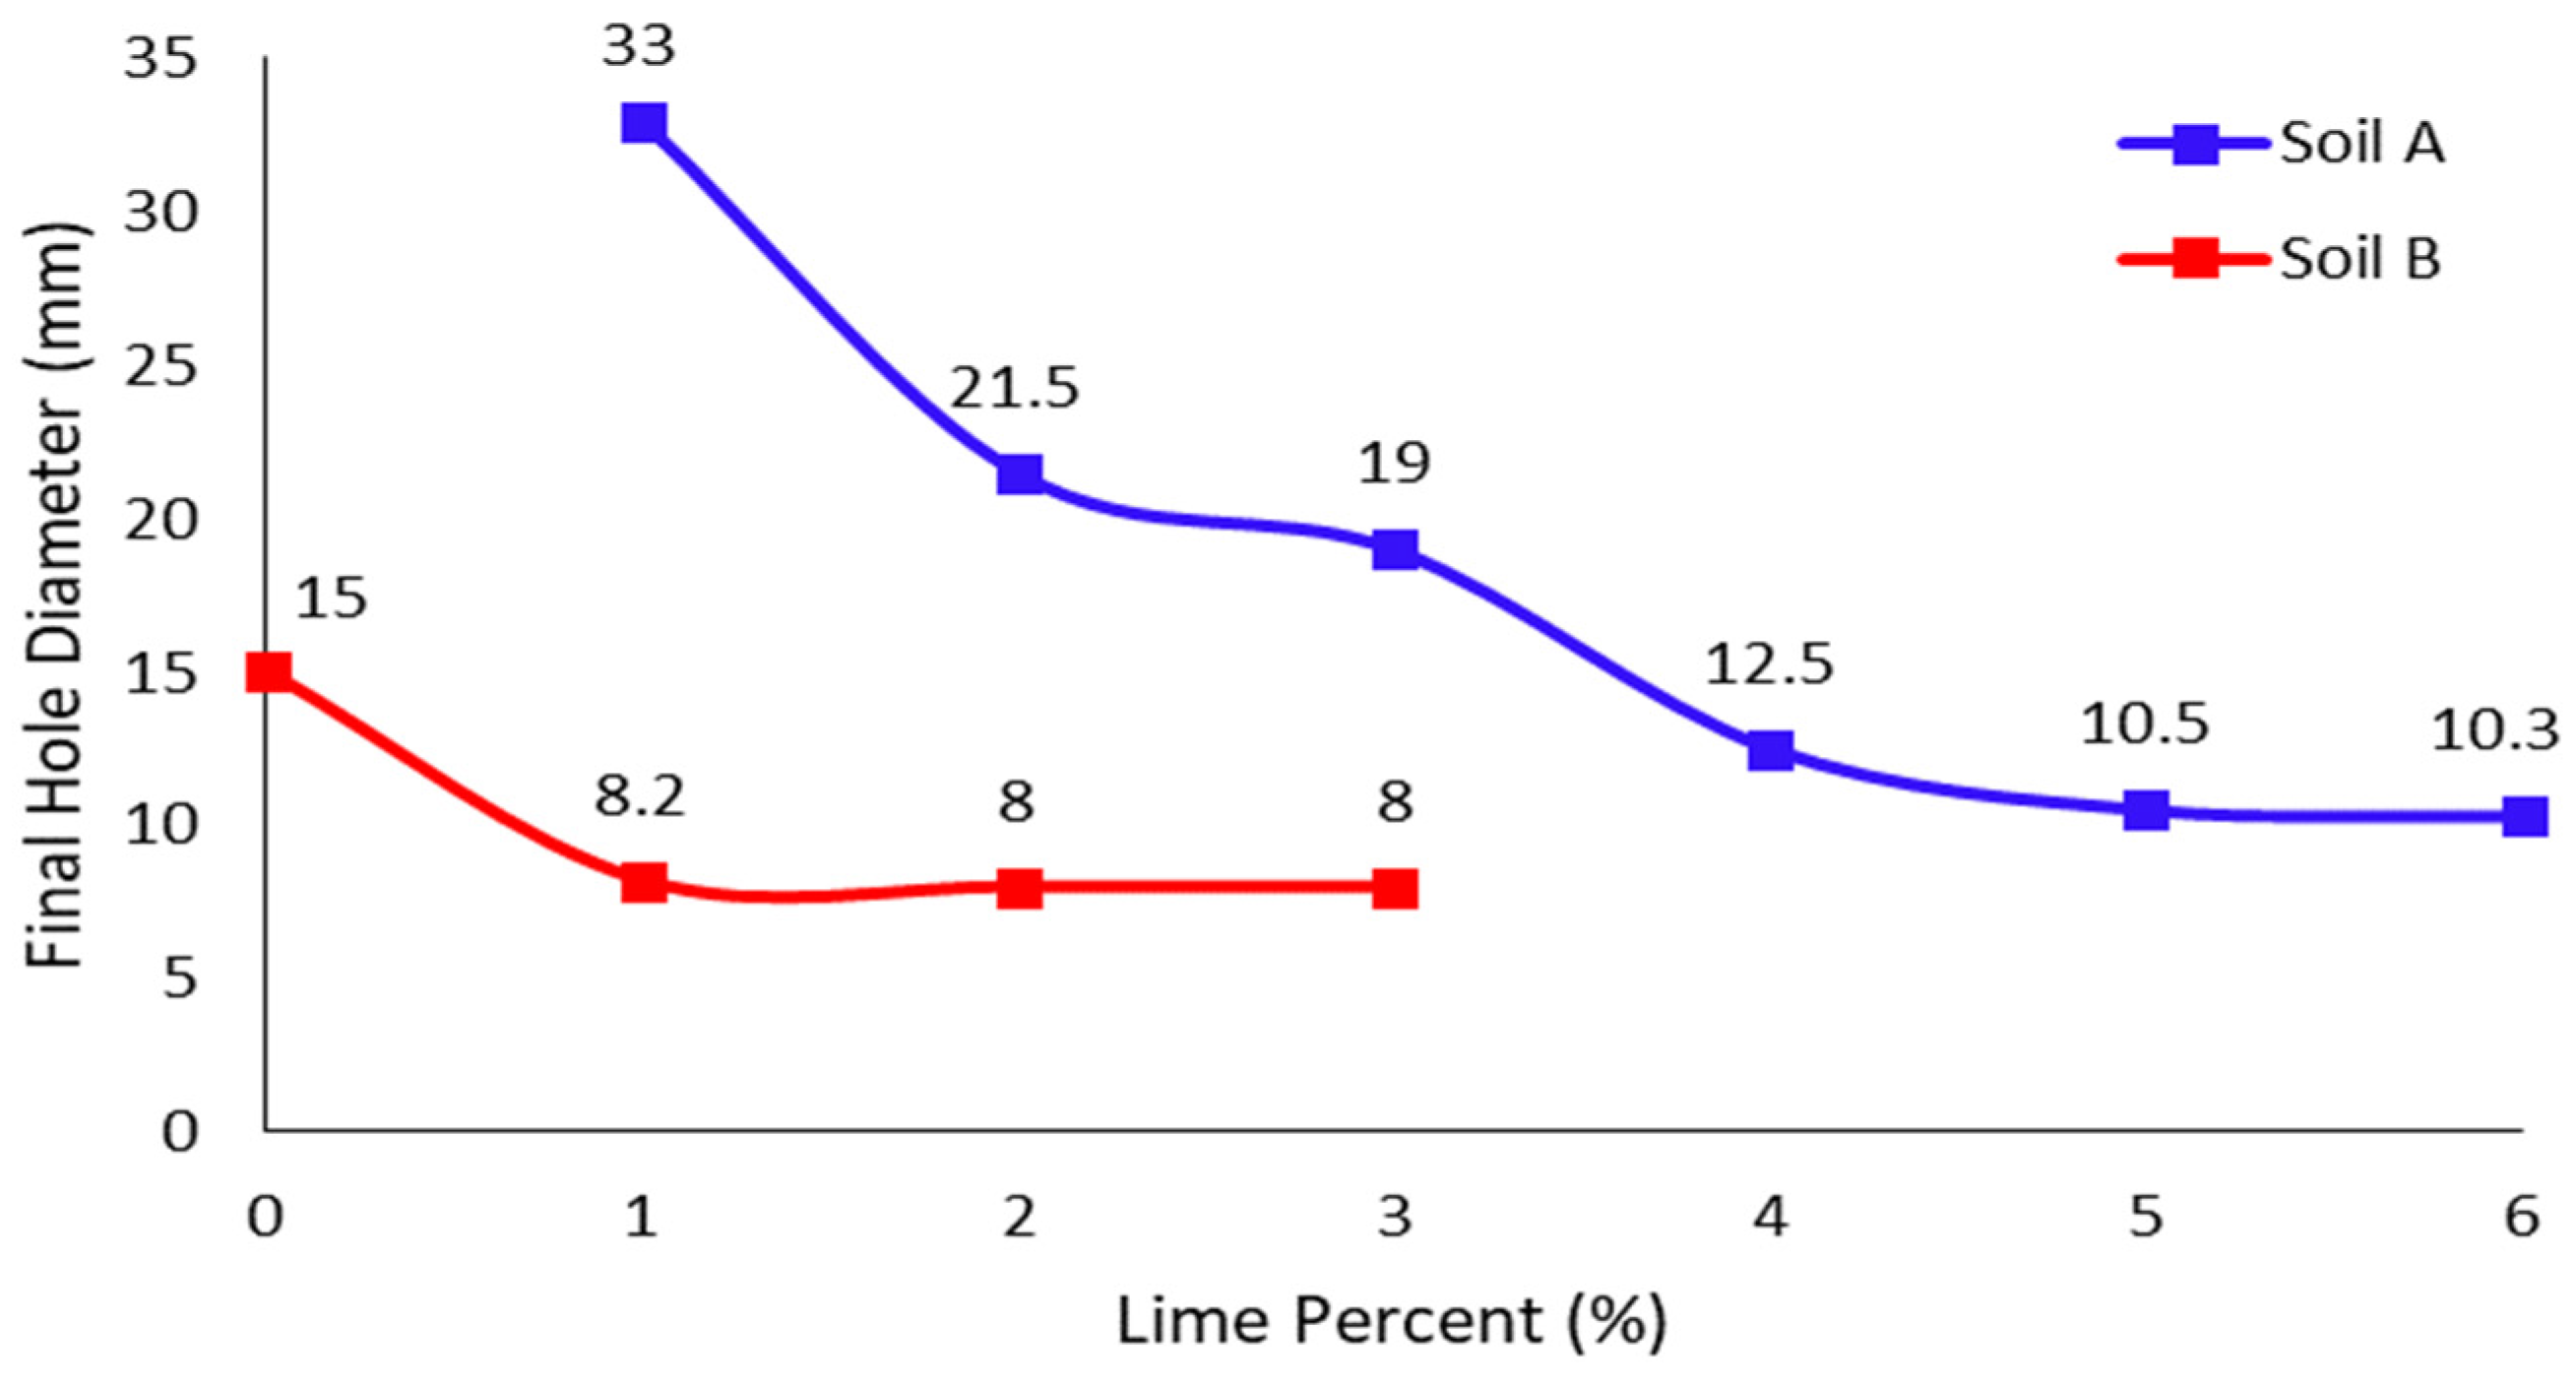
Additionally, Figure 4 illustrates the water flow path (hole) diameter (mm) at the end of the test against their lime percentages (%) for Soils A and B. It displays that the final hole diameter reduced with more lime. Furthermore, it demonstrates that Soil B specimens at 24 h curing time performed considerably better than Soil A specimens. Since 0.0% of lime in Soil B did not fail instantly, unlike Soil A, it resisted internal erosion briefly. Additionally, the final diameter of the hole for all lime percentages was lower in Soil B when compared to Soil A. This occurred due to the soil’s physical properties. Soil A was a poorly graded cohesionless soil with lower strength due to the absence of clayey and silty soil elements, resulting in lower stability. On the other hand, Soil B (well-graded cohesionless soil) showed a significant amount of silt and clay (which react well with lime) and, therefore, had slightly higher strength and stability, and thus it showed better resistance against internal erosion. In addition, Soil A required double the amount of lime (approximately 6.0% of lime) compared to Soil B (which required only approximately 3.0% lime) to significantly reduce the change in diameter. Hence, Soil B reacted and stabilized better with lime in comparison with Soil A. Similar findings were deduced in [40].

4.2. Addition of Lime Effect on Critical Shear Stress

Figure 5 displays the critical shear stress values for Soils A and B with their respective lime contents (%) and 24 h curing time. Higher lime percentages resulted in an increase in critical shear stress values for both Soil A and Soil B, as illustrated in Figure 5. Although an increase in lime from 1.0% to 2.0% in Soil A did not improve the critical shear stress value (=85 N/m2), a further increase in lime to 3.0% slightly improved the value to 97 N/m2. Thus, an approximately 14.1% increase in critical shear stress occurred at 3.0% lime, compared to 1.0% lime in Soil A. According to the results, the highest critical shear stress of 115 N/m2 for Soil A was obtained at 5.0% lime. Thus, increasing the lime from 1.0% to 5.0% resulted in 35.3% higher critical shear stress. Moreover, a further increase in lime did not increase the shear stress value, it can thus be deduced that Soil A was optimally stabilized at 5.0% lime and 24 h of curing time. In contrast, the critical shear stress of Soil B rose from 100.5 to 105 N/m2 with an increase in lime from 0.0% to 1.0%, respectively. Therefore, for Soil B, the stress increased by 4.5% with the addition of 1.0% lime in comparison to the Soil B specimen without any lime. Moreover, a further increase in lime to 3.0% improved the critical shear stress value to 140 N/m2, which was approximately 39.3% higher compared to the critical shear value of 0.0% lime. A lime percentage greater than 3.0% was not performed since the soil was observed to be optimally stabilized at 3.0% lime and 24 h curing time. Hence, higher lime percentages resulted in improving the critical shear stress of the soil. Previous researchers also deduced these findings [34,40,44,45]. In addition, the critical shear stress values of Soil B were determined to be higher in comparison with Soil A. As mentioned, this is attributed to the fact that Soil A was a poorly graded cohesionless soil with lower strength and stability, while Soil B was a well-graded cohesionless soil with slightly higher strength and stability due to the presence of clay and silt. Due to this, Soil B required only approximately 3.0% of lime to reach a shear stress value of 140 N/m2, while Soil A required approximately 5.0% lime to reach a shear stress value of 115 N/m2. Hence, it is evident that Soil B reacted well with lime, providing higher critical shear stress and strength to resist internal erosion compared to Soil A, similar to the reported results in [40].

4.3. Addition of Lime Effect on Erosion Rate Index (IHET)

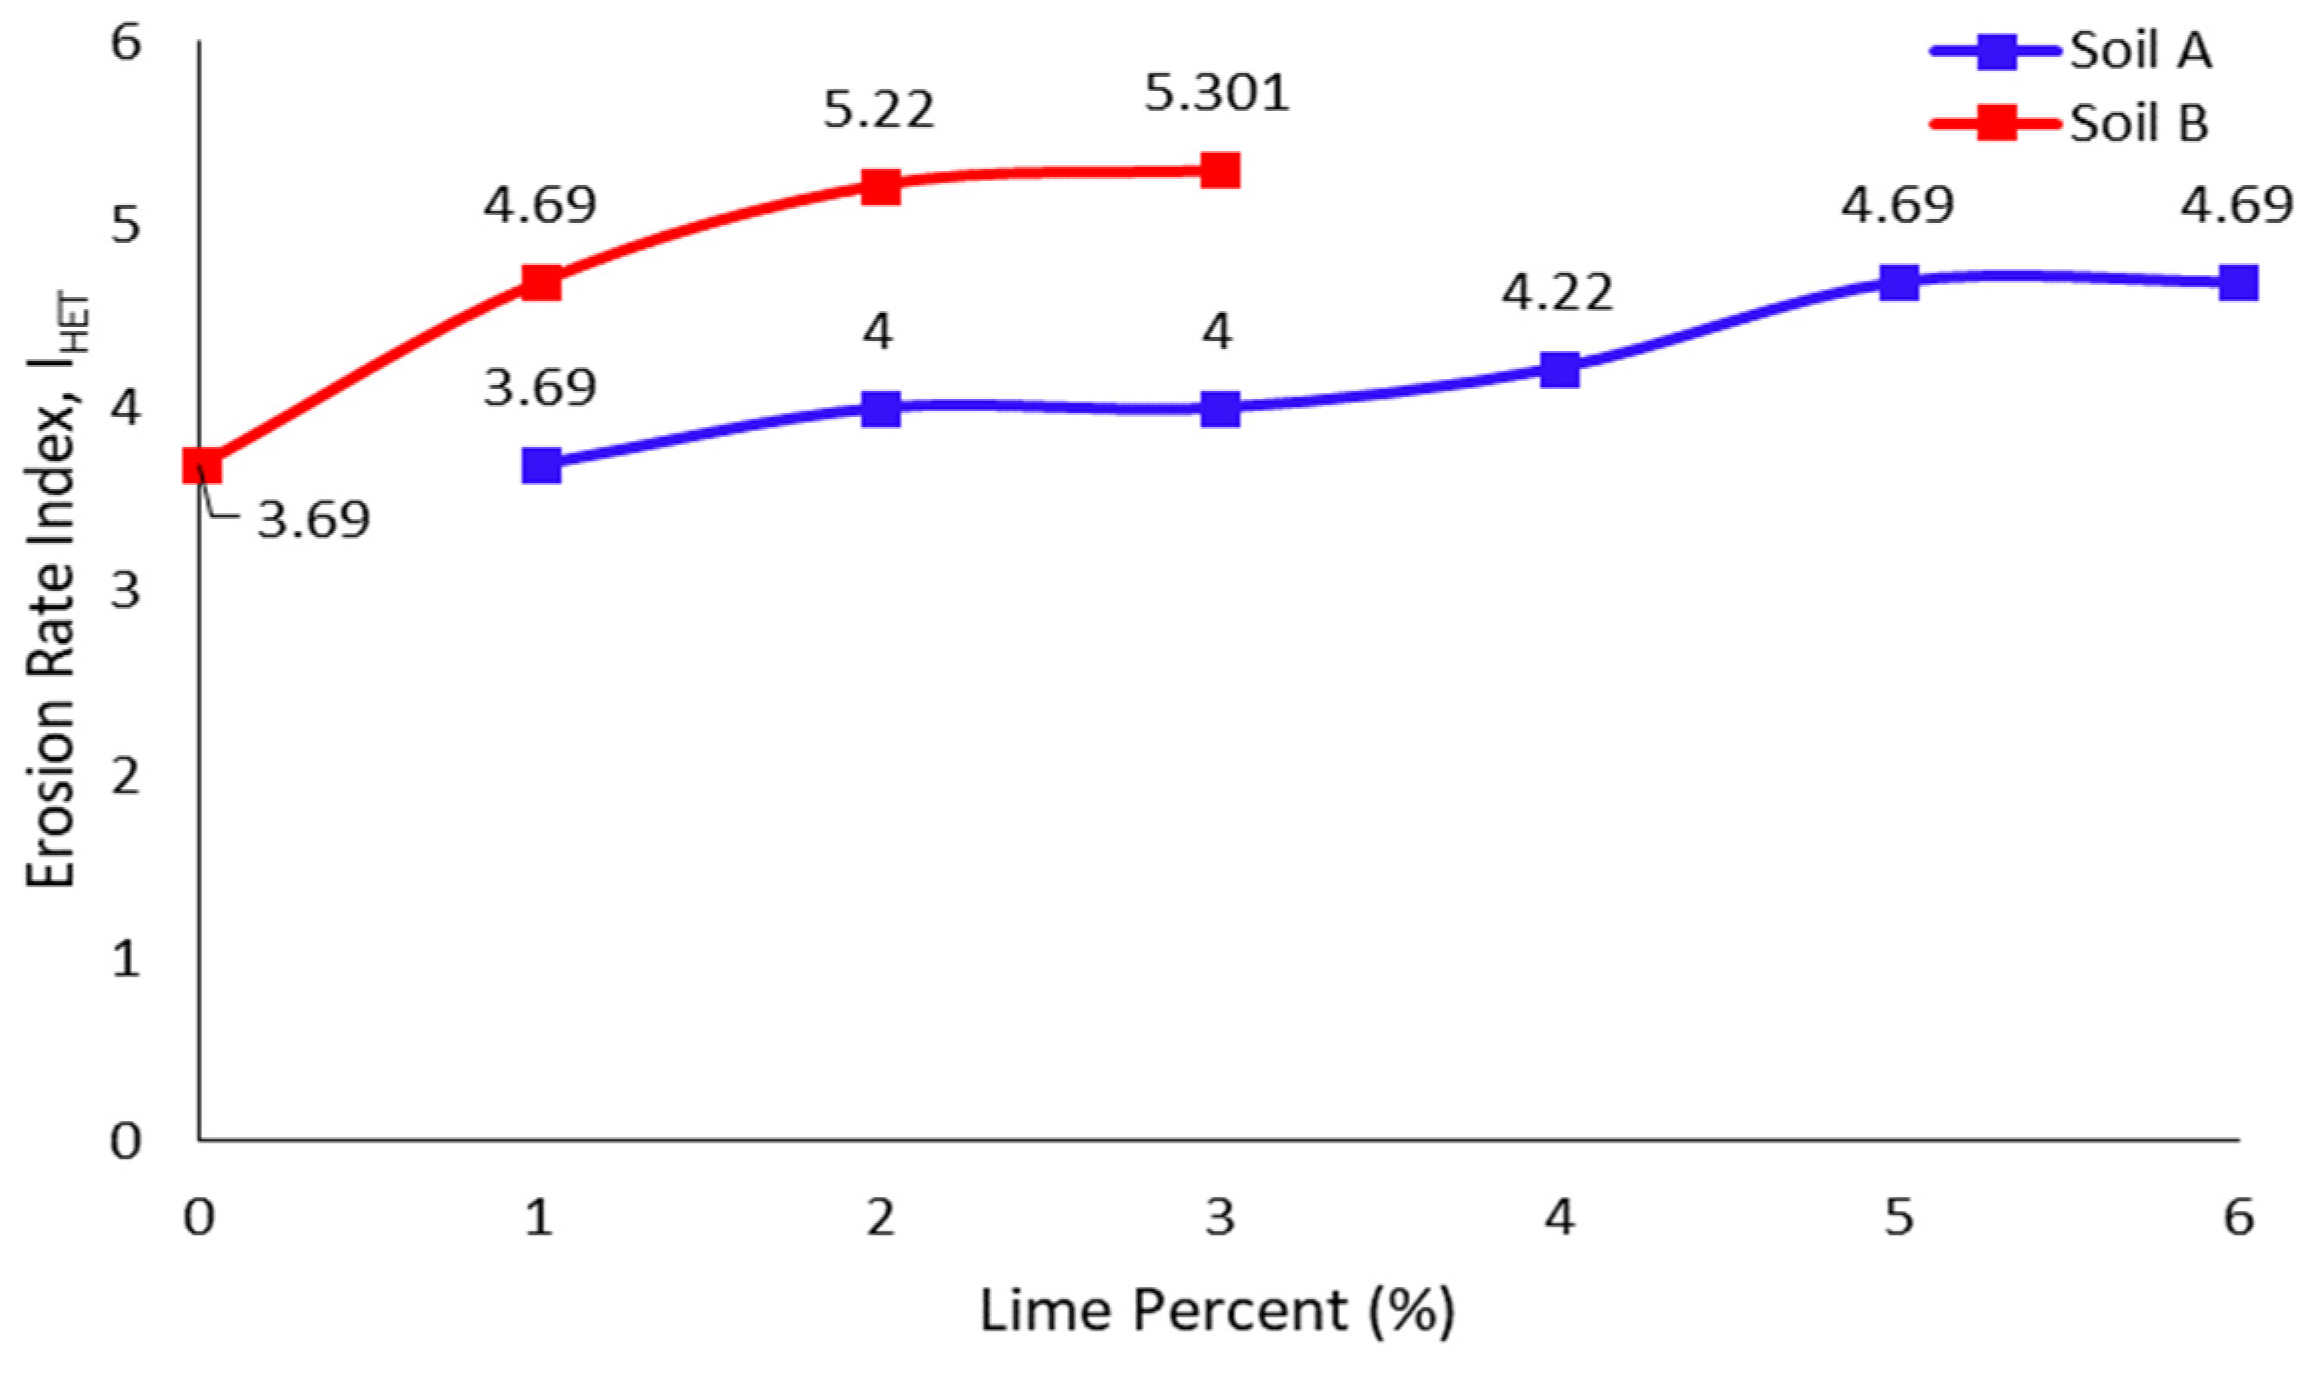
To adequately represent the effectiveness of the internal erosion stabilization of cohesionless soil using lime, the erosion rate index (IHET) value was evaluated for the two soil types. Figure 6 provides the erosion rate indices for different lime percentages in Soils A and B within 24 h of curing. This figure demonstrates that higher lime percentages result in improving the IHET value until the effective lime stabilization of the soil occurs. For Soil A with 1.0% lime and 24 h curing, the IHET was 3.69, representing a moderately rapid erosion type, as per Table 2. Increasing the amount of lime to 2.0% increased the IHET to 4.00, a moderately slow erosion type, as per Table 2. Therefore, increasing the lime percentage increased the IHET value (by 8.4%) and the soil’s internal erosion resistance ability. With higher lime percentages such as 5.0% (or 6.0%) and 24 h of curing, the IHET of Soil A improved to a value of 4.69, which is considered to be a moderately slow erosion type, as per Table 2. Therefore, increasing lime from 1.0% to 5.0% led to a 27.1% improvement in the IHET value (as shown in Figure 6). This validates that an increase in Soil A’s lime content caused the internal erosion stabilization of the soil. For Soil B at 0.0% lime and 24 h curing time, the IHET was determined to be 3.69, a moderately rapid erosion type, as per Table 2. With the addition of 1.0% lime, the IHET increased by 27.1%, changing the soil erosion resistance from a moderately rapid to a moderately slow erosion type. A further increase in lime to 3.0% increased the IHET to a value of 5.301, representing a very slow erosion type, as per Table 2. Therefore, increasing the lime from 0.0% to 3.0% resulted in improving the IHET value by 43.7%. These results also validate that increasing the lime content improves the internal erosion resistance of soil, similar to the deductions reported in [34,40,44]. Moreover, Soil B again demonstrated better results, with comparatively higher erosion rate indices with respect to Soil A (refer to Figure 6). Soil B reached a 13.0% higher IHET value with a lime content of only 3.0%, in comparison to Soil A with a higher lime content of 5.0%, demonstrating the significance of the initial soil properties.

4.4. Internal Erosion Types of Soil A and Soil B

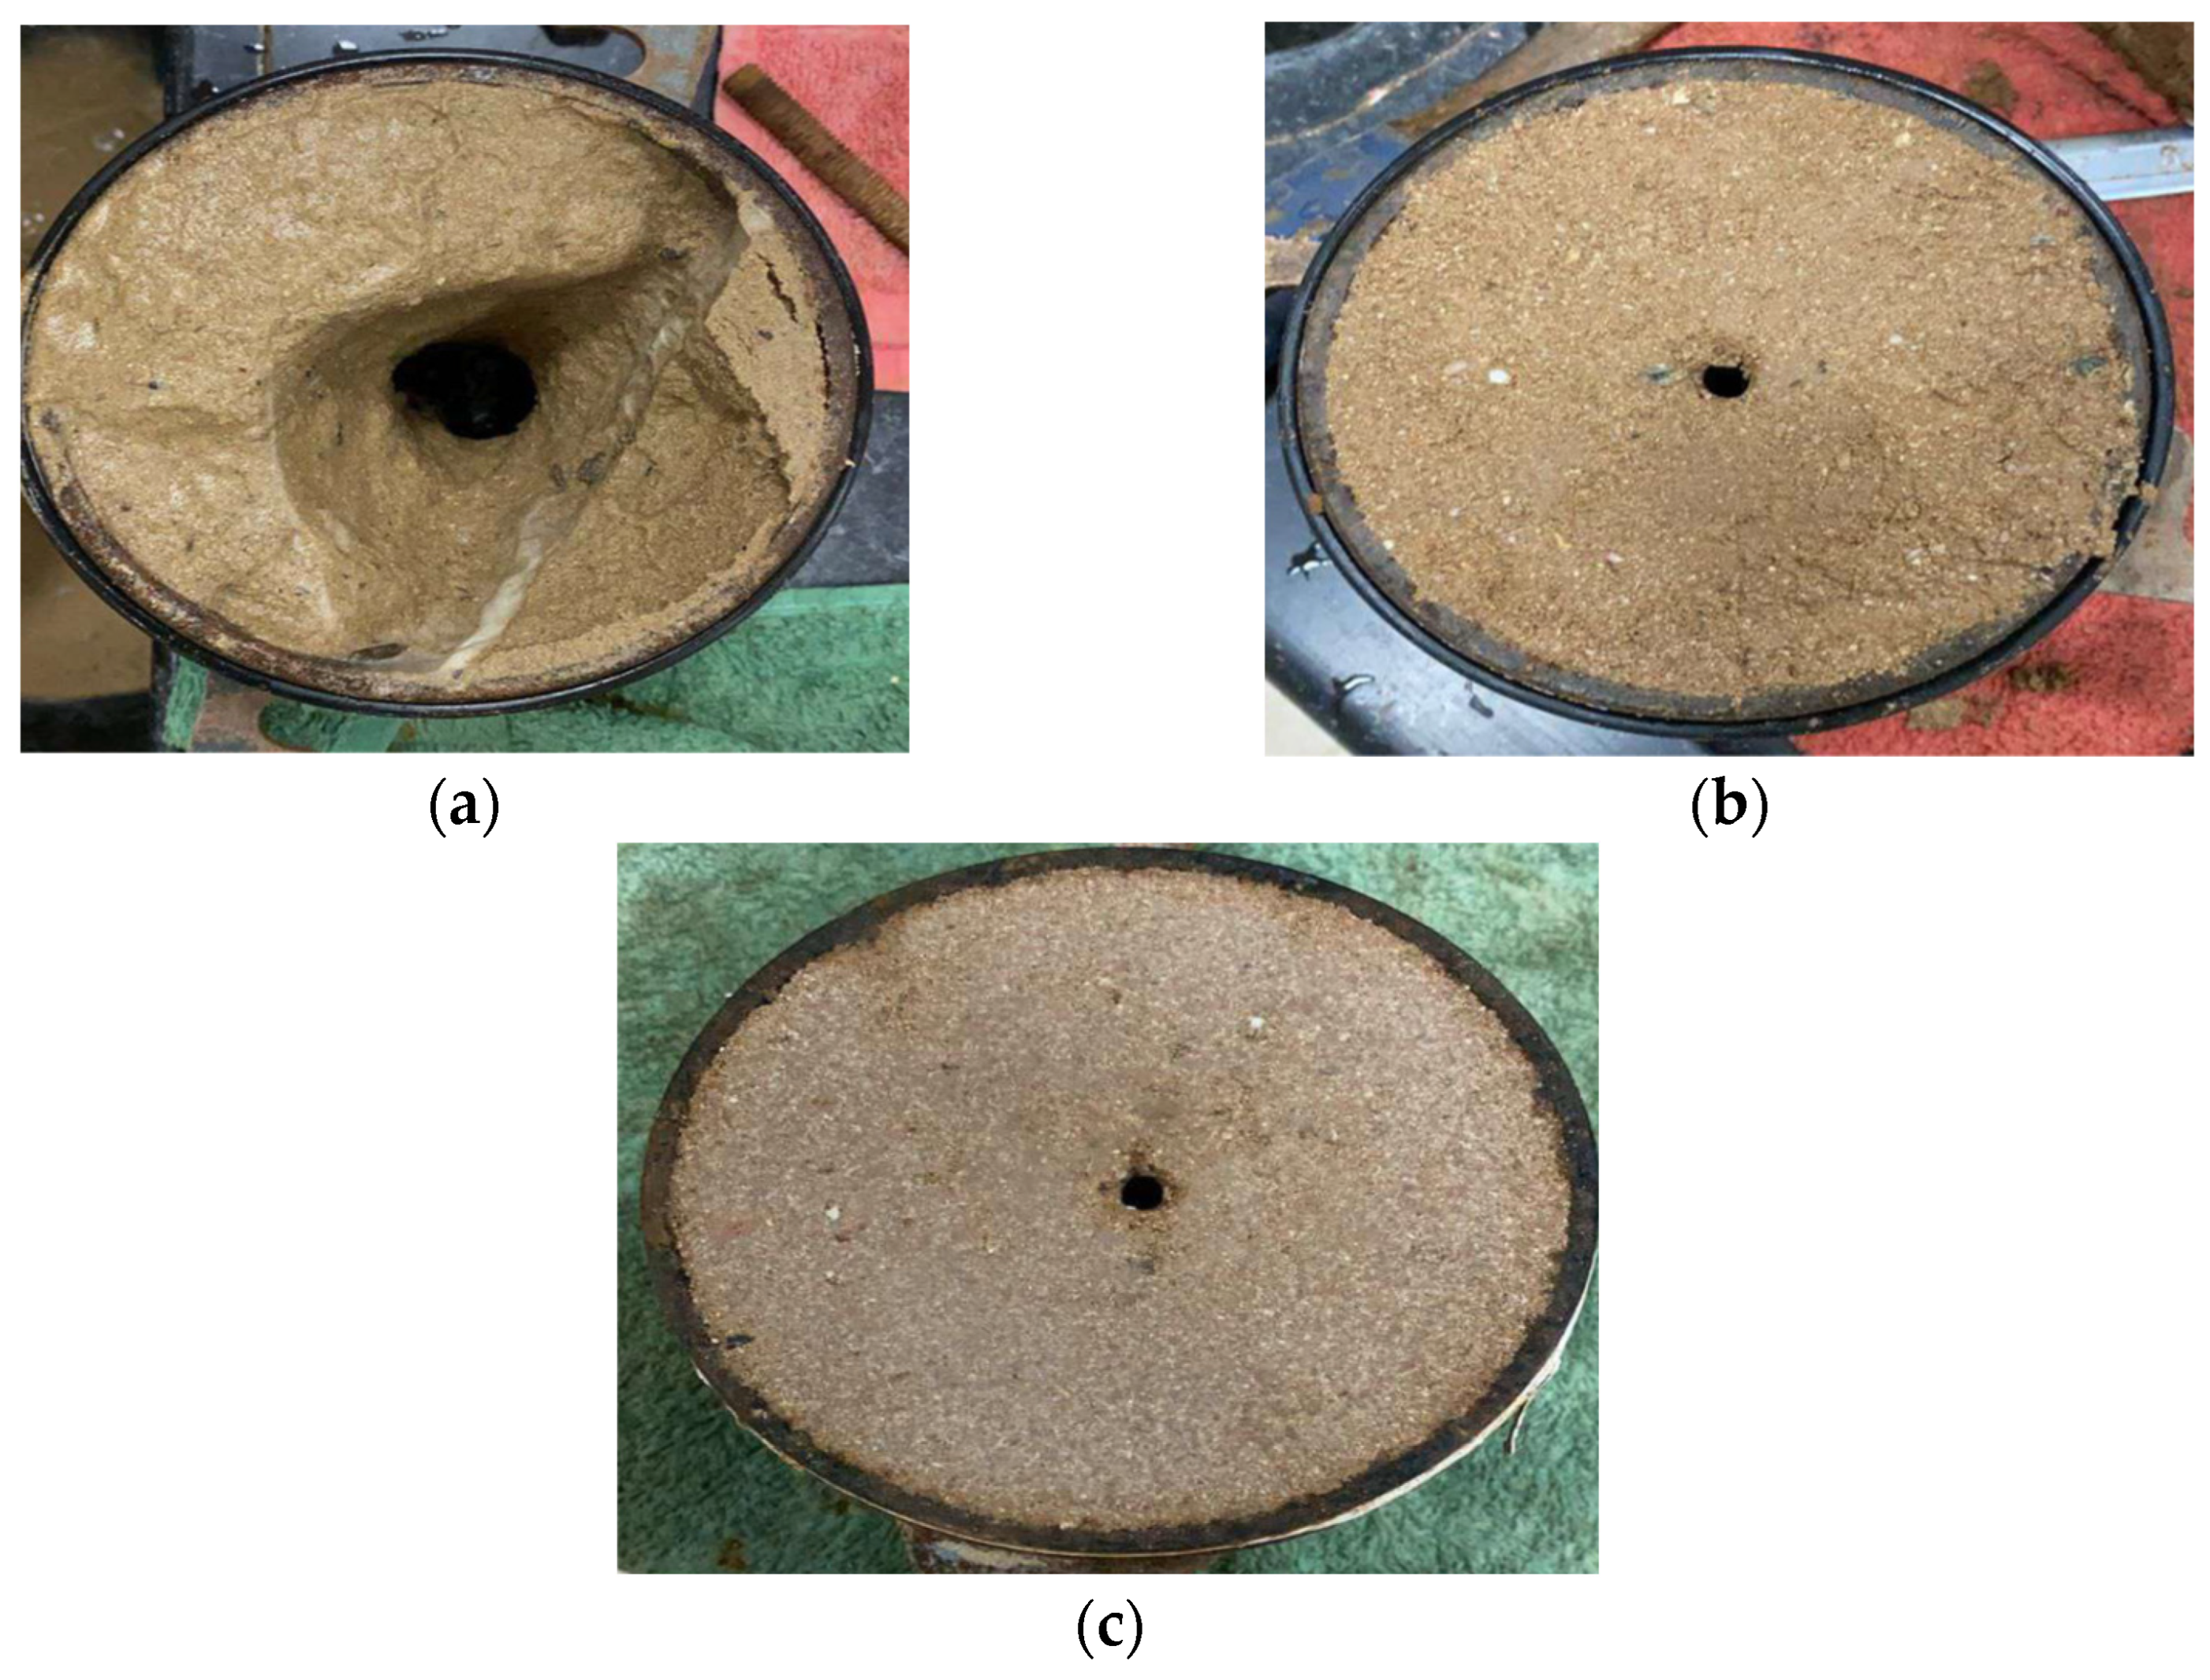
The erosion parameters for Soils A and B at different lime percentages are displayed in Table 3. Increasing the lime percentage caused a reduction in the final water flow path diameter and an increase in the critical shear stress (τc) and erosion rate index (IHET) values. Thus, higher IHET means stronger soil, higher shear strength, and lower internal erosion hole diameter values. Based on the results in Table 3, Soil A required approximately 5.0% of lime to effectively stabilize against internal erosion. As Soil A achieved the highest IHET and τc values of 4.69 and 115 N/m2, respectively, at 5.0% lime, and as per Table 2, this soil demonstrated a moderately slow erosion type. Moreover, Soil A showed a significantly small rise in water flow path diameter at 5.0% lime with a test run time of 60 min (1 h). Table 3 shows that a further increase in lime does not improve the strength and internal erosion resistance of the soil. Thus, Soil A was optimally stabilized with the addition of 5.0% lime and curing of 24 h. For Soil B, approximately 3.0% of lime was required for its optimum stabilization with curing of 24 h. At 3.0% lime in Soil B, the IHET and τc were equal to 5.301 and 140 N/m2, respectively. This IHET value represents a very slow erosion type, as per Table 2. In addition, Soil B displayed a minimal increase in the water flow path of 2.0 mm with a constant pressure head of 1200 mm and a test run time of 135 min (more than 2 h). Thus, it can be deduced that the soil was stabilized. Hence, Soil B was stabilized with 3.0% lime with curing of 24 h. Similar conclusions were drawn by [40]. For an illustration of some soil specimens’ final water flow path holes, refer to Figure 7.
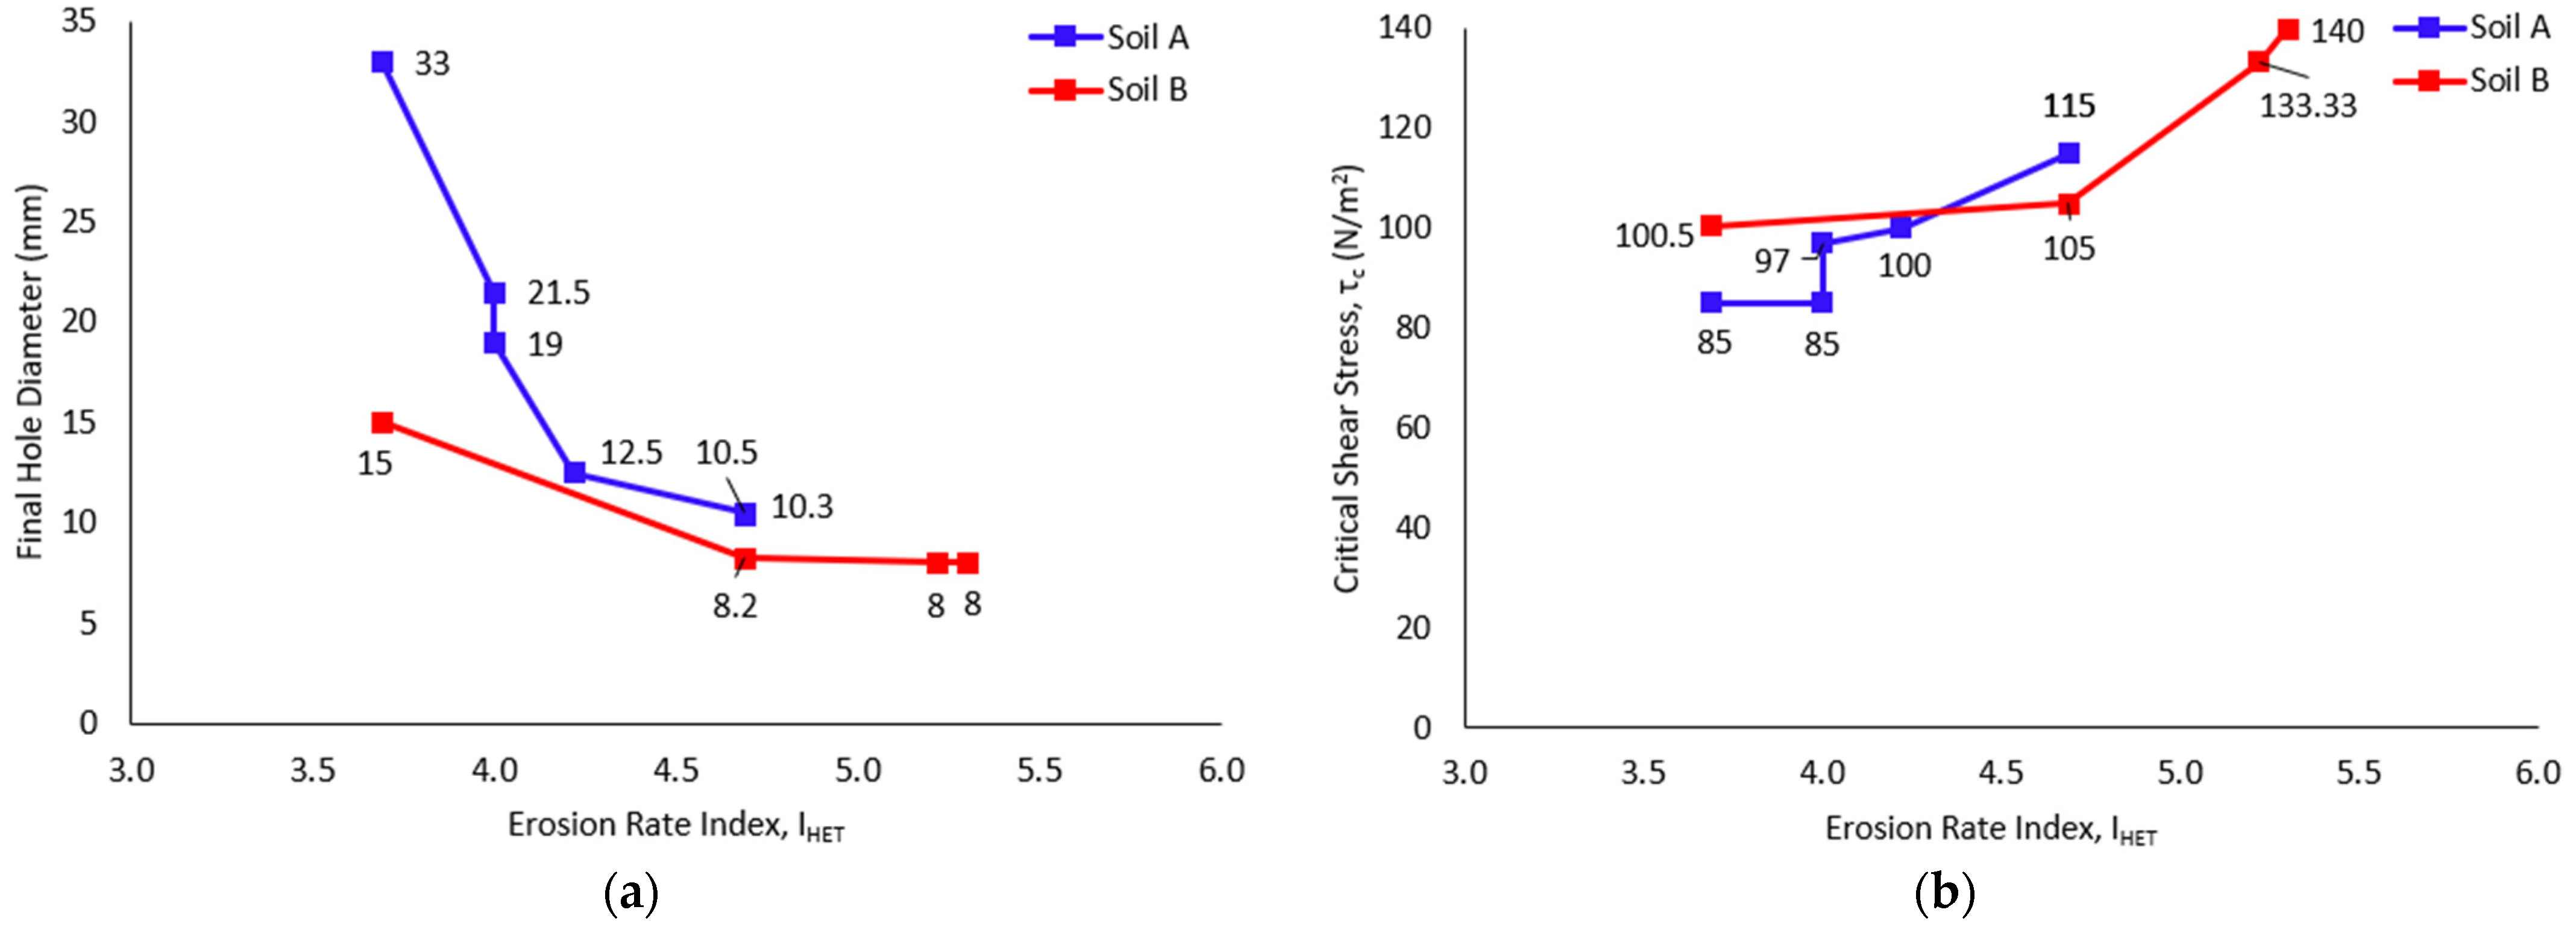
Figure 8 demonstrates the relationship between the obtained final hole diameter (φf) and τc against the IHET values of Soils A and B with different lime percentages and 24 h of curing. It displays that a higher erosion rate index lowered the final internal erosion hole diameter and increased the critical shear stress (τc) values for both soil types. For Soil A, adding 5.0% lime resulted in a 68.2% lower final hole diameter, 35.3% higher τc value, and 27.1% higher IHET value. For Soil B, the addition of only 3.0% lime resulted in a 46.7% lower final hole diameter, 39.3% higher τc value, and 43.7% higher IHET value. Thus, Soil B reacted significantly better with lime than Soil A. Again, this was because Soil B contained clay and silt (refer to Table 1). Since clay and silt are binding materials and lime reacts much better with soils with binding materials, Soil B showed better results. In contrast, Soil A was poorly graded with an absence of clay and silt; consequently, it showed lower shear strength and a relatively weaker reaction with lime. Hence, Soil A required a higher lime content (5.0%) for stabilization than Soil B. Nevertheless, even with a higher lime percentage, Soil A (due to its weak properties) resulted in lower IHET and τc values by 11.5% and 17.9%, respectively, compared to Soil B. Additionally, the internal erosion type of Soil A with 5.0% lime (moderately slow) was inferior than Soil B with only 3.0% lime (very slow). Therefore, it was determined that the initial soil type, properties, and gradation played a vital role in the internal erosion stabilization effect of the soil using lime.

5. Conclusions

The internal erosion stabilization of cohesionless soil using lime was investigated in this paper. The hole erosion test (HET) was adopted and conducted to execute the experimental testing of the study, as it best replicated the soil’s internal erosion. Two cohesionless soil types, poorly graded and well-graded, were tested with various lime percentages and 24 h of curing time. HET test results were analyzed, and different erosion parameters, including water flow path diameter, critical shear stress (τc), and erosion rate index (IHET), were evaluated. Based on the findings, the following conclusions were drawn:
  • Quick lime is an adequate internal erosion stabilizer for cohesionless soils;
  • The water flow path diameter can be reduced and controlled with a higher amount of lime for both types of cohesionless soil;
  • An increase in lime content leads to stronger critical shear stress (τc) and higher erosion rate index (IHET) values for cohesionless soil;
  • The inclusion of 5.0% lime in poorly graded soil resulted in a 68.2% lower final hole diameter, 35.3% higher critical shear stress (τc), and 27.1% higher erosion rate index (IHET) value. In contrast, for Soil B, the addition of only 3.0% lime resulted in a 46.7% lower final hole diameter, 39.3% higher τc, and 43.7% higher IHET value;
  • For poorly graded cohesionless soil, with 5.0% optimum lime content, the internal erosion improved from a moderately rapid erosion type to a moderately slow erosion type, and for well-graded soil, with only 3.0% of lime, the internal soil erosion improved from a moderately rapid to a very slow erosion type;
  • Lower lime is required to stabilize well-graded cohesionless soil as opposed to poorly graded soil. Moreover, stabilized well-graded soil demonstrated comparatively better erosion parameters than stabilized poorly graded soil. This is related to the clay and silt (binding materials) present in well-graded soil, which gives higher strength and better supports the lime reaction. Hence, well-graded soil is preferred in construction compared to poorly graded cohesionless soil.

6. Recommendations for Future Work

This study was performed at the American University of Sharjah (AUS) as part of their research program to investigate the internal erosion stabilization of cohesionless soil using lime. Based on the experience, it is highly recommended to ensure that the testing apparatus is built to be leakproof and that multiple flow rates are noted at various time intervals to increase the accuracy of the results. Moreover, due to the limited scope of this study, not all factors could be investigated. Thus, further research may be performed to investigate internal soil erosion with different (1) soil properties such as clay, silt, and sand contents; cohesions; angles of internal friction; optimum moisture contents; maximum dry densities; and gradations; (2) hole erosion test factors such as the pressure head and test run time; and (3) internal erosion testing methods such as the slot erosion test (SET), rotating cylinder test, jet erosion test (JET), and soil dispersity tests (such as pinhole, Emerson crumb, and double hydrometer tests). Additionally, studies related to other soil stabilizers (bitumen, oil shale, fly ash) can be conducted on this topic.

Author Contributions

Conceptualization, S.B. and M.A.; methodology, S.B. and M.A.; software, S.B. and M.A.; validation, S.B. and M.A.; formal analysis, S.B. and M.A.; investigation, S.B. and M.A.; resources, S.B. and M.A.; data curation, S.B. and M.A.; writing—original draft preparation, S.B.; writing—review and editing, S.B. and M.A.; visualization, S.B. and M.A.; supervision, M.A.; project administration, M.A.; funding acquisition, M.A. All authors have read and agreed to the published version of the manuscript.

Funding

This research was financially supported by the American University of Sharjah (AUS) through the Faculty Research Grant program (FRG20-M-E61) and Open Access Program (OAP).

Data Availability Statement

Not applicable.

Acknowledgments

The authors would like to acknowledge the support and contributions of the American University of Sharjah (AUS), their Civil Engineering Department staff, and the Open Access Program (OAP) during this research. This paper represents the opinions of the authors and does not represent the opinions or position of the American University of Sharjah.

Conflicts of Interest

The authors declare no conflict of interest.

Notations

AUSAmerican University of Sharjah
CBRCalifornia Bearing Ratio
CcCoefficient of Curvature
C e Soil Erosion Coefficient
CuCoefficient of Uniformity
f L t Laminar Friction Factors at any time, t
f T t Turbulent Friction Factors at any time, t
g Gravitational Acceleration (m/s2)
GGBSGround Granulated Blast-furnace Slag
GsSpecific Gravity of Soil
HETHole Erosion Test
I Soil Erosion Rate Index
IHETErosion Rate Index determined using Hole Erosion Test
JETJet Erosion Test
OAPOpen Access Program
QtFlow Rate at time, t (m3/s)
RReynold’s Number
SETSlot Erosion Test
s t Soil Sample Hydraulic Gradient
V t Average Water Flow Velocity at time, t (m/s)
ε t · Erosion Rate per Unit Surface Area at time, t (kg/m2/s)
ν Absolute Water Viscosity (Pa·s)
ρ d Soil Dry Density (kg/m3)
ρ dmaxMaximum Dry Density (kg/m3)
ρ w Water Density (kg/m3)
τ c Critical Shear Stress (N/m2)
τ t Hydraulic Shear Stress at time, t (N/m2)
φfFinal hole (water flow path) diameter
φ t Water Flow Path (Hole) Diameter at time t (m)
d φ t d t Rate of Diameter Change with Time (m/s)
ωopOptimum Moisture (or Water) Content

References

  1. Chen, S.H. Introduction. In Hydraulic Structures; Springer: Berlin/Heidelberg, Germany; Wuhan, China, 2015; pp. 1–39. [Google Scholar]
  2. Kuriqi, A.; Ardiçlioglu, M.; Muceku, Y. Investigation of seepage effect on river dike’s stability under steady state and transient conditions. Pollack Period. 2016, 11, 87–104. [Google Scholar] [CrossRef]
  3. Lüthi, M. A Modified Hole Erosion Test (HET-P) to Study Erosion Characteristics of Soil. Master’s Thesis, The University of British Columbia, Vancouver, BC, Canada, 2011. [Google Scholar]
  4. Hanneman, D. Recent examples of backward erosion piping, internal erosion along a conduit, and embankment cracking at Bureau of Reclamation dams. In Proceedings of the Internal Erosion in Embankment Dams and Their Foundations, Brno, Czech Republic, 26–29 April 2011. [Google Scholar]
  5. Foster, M.; Fell, R.; Spannagle, M. A method for assessing the relative likelihood of failure of embankment dams by piping. Can. Geotech. J. 2000, 37, 1025–1038. [Google Scholar] [CrossRef]
  6. Robbins, B.; Griffiths, D. Internal Erosion of Embankments: A review and Appraisal. In Proceedings of the Rocky Mountain Geo-Conference 2018, Golden, CO, USA, 2 November 2018; ASCE Library: Reston, VA, USA, 2018. [Google Scholar]
  7. Klipalo, E.; Besharat, M.; Kuriqi, A. Full-Scale Interface Friction Testing of Geotextile-Based Flood Defense Structures. Buildings 2022, 12, 990. [Google Scholar] [CrossRef]
  8. Kuriqi, A.; Hysa, A. Multidimensional Aspects of Floods: Nature-Based Mitigation Measures from Basin to River Reach Scale. In Nature-Based Solutions for Flood Mitigation; Springer: Cham, Switzerland, 2021; Volume 107, pp. 11–33. [Google Scholar]
  9. Cao, Y.; Wang, J.L.; Chen, H.C.; Li, Y.; Nurtjahyo, P. EFA tests and the influence of various factors on the erodibility of cohesive soils. In Proceedings of the 1st International Conference on Scour of Foundations, College Station, TX, USA, 17–20 November 2002. [Google Scholar]
  10. Hanson, G.I.; Tejral, S.H.; Temple, D. Internal Erosion and Impact of Erosion Resistance USDA Small Watershed Program. Collab. Manag. Integr. Watersheds Trans. ASABE 2007, 5, 773–784. [Google Scholar]
  11. Briaud, J.-L. Case Histories in Soil and Rock Erosion: Woodrow Wilson Bridge, Brazos River Meander, Normandy Cliffs, and New Orleans Levees. J. Geotech. Geoenviron. Eng. 2008, 134, 1425–1447. [Google Scholar] [CrossRef]
  12. Sherard, J.L.; Richard, S.D.; Woodward, J.; Stanley, N.S.; Gizenski, F.; Willaim, M.S.; Clevenger, B.S. Earth and Earth Rock Dams; Chapter 2; John Wiley and Sons: New York, NY, USA, 1963. [Google Scholar]
  13. Wan, C.F.; Fell, R. Investigation of Rate of Erosion of Soils in Embankment Dams. J. Geotech. Geoenviron. Eng. 2004, 130, 373–380. [Google Scholar] [CrossRef]
  14. Yamin, M.; Attom, M.F.; Atabay, S.; Vandanapu, R. The Effect of Compaction Effort on Shear Strength Parameters of Low/High Plasticity Clay Soils. Geotech. Eng. J. SEAGS AGSSEA 2021, 52, 1–8. [Google Scholar]
  15. Attom, M.F.; Khan, Z.; Vandanapu, R. Efficacy of sand columns to increase the sub-soil moisture content of clay. SN Appl. Sci. 2020, 2, 1–6. [Google Scholar] [CrossRef]
  16. Vandanapu, R.; Omer, J.R.; Attom, M.F. Laboratory simulation of the influence of groundwater rise and drip irrigation on the settlement of a sample of collapsible desert soil. Int. J. Geotech. Eng. 2018, 15, 760–766. [Google Scholar] [CrossRef]
  17. Negi, A.S.; Faizan, M.; Siddharth, D.P.; Singh, R. Soil stabilization using lime. International Journal of Innovative Research in Science. Eng. Technol. 2013, 2, 1–6. [Google Scholar]
  18. Lemaire, K.; Deneele, D.; Bonnet, S.; Legret, M. Effects of lime and cement treatment on the physicochemical, microstructural and mechanical characteristics of a plastic silt. Eng. Geol. 2013, 166, 255–261. [Google Scholar] [CrossRef]
  19. Karimi, M.; Ghorbani, A.; Daghigh, Y.; Kia, S. Stabilization of Silty Sand Soils with lime and Microsilica Admixture in presence of Sulfates. In Proceedings of the 2011 Pan-Ame CGS Geotechnical Conference–14th Pan-American Conference on Soil Mechanics and Geotechnical Engineering, Toronto, ON, Canada, 2–6 October 2011. [Google Scholar]
  20. Khemissa, M.; Mahamedi, A. Cement and lime mixture stabilization of an expansive overconsolidated clay. Appl. Clay Sci. 2014, 95, 104–110. [Google Scholar] [CrossRef]
  21. Al-Aghbari, M.; Mohamedzein, Y.E.A.; Taha, R. Stabilisation of desert sands using cement and cement dust. Proc. Inst. Civ. Eng. Ground Improv. 2009, 162, 145–151. [Google Scholar] [CrossRef]
  22. Mohamedzein, Y.E.-A.; Al-Aghbari, M.Y.; Taha, R.A. Stabilization of desert sands using municipal solid waste incinerator ash. Geotech. Geol. Eng. 2006, 24, 1767–1780. [Google Scholar] [CrossRef]
  23. Soundarya, N. Effect of fly ash and GGBS on lime stabilized mud block. Mater. Today Proc. 2021, 47, 4636–4640. [Google Scholar] [CrossRef]
  24. Malkanthi, S.; Balthazaar, N.; Perera, A. Lime stabilization for compressed stabilized earth blocks with reduced clay and silt. Case Stud. Constr. Mater. 2019, 12, e00326. [Google Scholar] [CrossRef]
  25. Vinod, J.S.; Indraratna, B.; Al Mahamud, M.A. Stabilisation of an erodible soil using a chemical admixture. Proc. Inst. Civ. Eng. Ground Improv. 2010, 163, 43–51. [Google Scholar] [CrossRef]
  26. Vakili, A.H.; Ghasemi, J.; bin Selamat, M.R.; Salimi, M.; Farhadi, M.S. Internal erosional behaviour of dispersive clay stabilized with lignosulfonate and reinforced with polypropylene fiber. Constr. Build. Mater. 2018, 193, 405–415. [Google Scholar] [CrossRef]
  27. Indraratna, B.; Mahamud, M.; Vinod, J.S.; Wijeyakulasuriya, V. Stabilization of an erodible soil using a chemical admixtures. In Proceedings of the 2nd International Conference on Geotechnical Engineering, Hammamet City, Tunisia, 25–27 October 2010. [Google Scholar]
  28. Basha, E.A.; Hashim, R.; Mahmud, H.B.; Muntohar, A.S. Stabilization of residual soil with rice husk ash and cement. Constr. Build. Mater. 2005, 19, 448–453. [Google Scholar] [CrossRef]
  29. Kolias, S.; Kasselouri-Rigpoulou, V.; Karahalios, A. Stabilization of clayey soils with high calcium fly ash and cement. Cem. Concr. Compos. 2005, 27, 301–313. [Google Scholar] [CrossRef]
  30. Attom, M.; Shatnawi, M.Y. Stabilization of clayey soils using hay material. J. Solid Waste Technol. Manag. 2005, 31, 84–92. [Google Scholar]
  31. Baldovino, J.d.J.A.; Izzo, R.L.d.S.; Moreira, E.B.; Rose, J.L. Optimizing the evolution of strength for lime-stabilized rammed soil. J. Rock Mech. Geotech. Eng. 2019, 11, 882–891. [Google Scholar] [CrossRef]
  32. Nagaraj, H.; Sravan, M.; Arun, T.; Jagadish, K. Role of lime with cement in long-term strength of Compressed Stabilized Earth Blocks. Int. J. Sustain. Built Environ. 2014, 3, 54–61. [Google Scholar] [CrossRef]
  33. Burns, B.; Barker, R.; Ghataora, G.S. Investigating internal erosion using a miniature resistivity array. NDT E Int. 2006, 39, 169–174. [Google Scholar] [CrossRef]
  34. Herrier, G.; Chevalier, C.; Froumentin, M.; Cuisinier, O.; Bonelli, S.; Fry, J. Lime treated soil as an erosion-resistant material for hydraulic earthen structures. In Proceedings of the 6th International Conference on Scour and Erosion, Paris, France, 27 August–1 September 2012. [Google Scholar]
  35. Rahman, M.; Rashiduzzaman, M.; Akhand, F.Z.; Kabir, K.B. Compressed Stabilized Earth Block: A Green Alternative for Non-load Bearing Building Block in Developing Countries like Bangladesh. Am. Chem. Sci. J. 2016, 12, 1–10. [Google Scholar] [CrossRef]
  36. Estabragh, A.; Soltannajad, K.; Javadi, A. Improving piping resistance using randomly distributed fibers. Geotext. Geomembr. 2014, 42, 15–24. [Google Scholar] [CrossRef]
  37. Consoli, N.C.; da Silva Lopes, L., Jr.; Prietto, P.D.M.; Festugato, L.; Cruz, R.C. Variables Controlling Stiffness and Strength of Lime-Stabilized Soils. J. Geotech. Geoenviron. Eng. 2011, 137, 628–632. [Google Scholar] [CrossRef]
  38. Consoli, N.C.; Bittar Marin, E.J.; Quiñónez Samaniego, R.A.; Heineck, K.S.; Johann, A.D.R. Use of Sustainable Binders in Soil Stabilization. J. Mater. Civ. Eng. 2019, 31, 06018023. [Google Scholar] [CrossRef]
  39. Consoli, N.C.; da Silva Lopes, L., Jr.; Heineck, K.S. Key Parameters for the Strength Control of Lime Stabilized Soils. J. Mater. Civ. Eng. 2009, 21, 210–216. [Google Scholar] [CrossRef]
  40. Banu, S.A.; Attom, M.F. Effect of Curing Time on Lime-Stabilized Sandy Soil against Internal Erosion. Geosciences 2023, 13, 102. [Google Scholar] [CrossRef]
  41. Elandaloussi, R.; Bennabi, A.; Dupla, J.C.; Canou, J.; Benamar, A.; Gotteland, P. Effectiveness of Lime Treatment of Coarse Soils Against Internal Erosion. Geotech. Geol. Eng. 2018, 37, 139–154. [Google Scholar] [CrossRef]
  42. Benaissa, K.; Angel, P.V.M.; Dolores, R.; Larbi, E.; Abdellatif, K.; Bezzazi, M.; Dubujet, P. Effect of Wall Roughness and Con-centration of Clay on Erosion in the Hole Erosion Test. Am. J. Eng. Appl. Sci. 2010, 3, 734–739. [Google Scholar]
  43. Marine Propellers and Propulsion, “Reynolds’ Number”, Science Direct. 2019. Available online: https://www.sciencedirect.com/topics/engineering/reynolds-number (accessed on 1 June 2020).
  44. Baecque, M.D.; Chevalier, C.; Lopes, S.P.; Feuvre, M.L.; Reiffsteck, P.; Charles, I.; Herrier, G. Resistance to erosion of lime treated soils and perspectives for coastal dikes. In Proceedings of the 25th Meeting of the European Working Group on Internal Erosion, Delft, The Netherlands, 4–7 September 2017; pp. 133–142. [Google Scholar]
  45. Bonelli, S.; Benahmed, N. Piping flow erosion in water retaining structures. Int. J. Hydropower Dams 2011, 18, 94–98. [Google Scholar]
Figure 1. (a) Specimen top view before curing (with an initial hole diameter of 6 mm), (b) laboratory apparatus, and (c) schematic diagram (adapted from [13]) of hole erosion test (HET) (similar to [40]).
Water 15 01992 g001
Figure 2. Erosion rate (εt) plot against hydraulic shear stress (τt) for Soil A with 5.0% lime.
Water 15 01992 g002
Figure 3. Hole diameter (mm) versus test run time (mins) plot with their lime contents (%) in (a) Soil A and (b) Soil B.
Water 15 01992 g003
Figure 4. Final hole (water flow path) diameter (φf) plot against lime percentage (%) for Soils A and B with 24 h curing time.
Water 15 01992 g004
Figure 5. Critical shear stress (τc) plot against lime percentage (%) for Soils A and B with 24 h of curing time.
Water 15 01992 g005
Figure 6. Erosion rate index (IHET) plot against lime percentage (%) for Soils A and B with a curing time of 24 h.
Water 15 01992 g006
Figure 7. Hole diameters at the end of the test (φf) for (a) Soil A with 1.0% lime and Soil B with (b) 1.0% and (c) 2.0% lime (similar to [40]).
Water 15 01992 g007
Figure 8. (a) Final hole diameter (φf) and (b) critical shear stress (τc) versus erosion rate index (IHET) relationship with the increase in lime percentages for 24 h curing time.
Water 15 01992 g008
Table 1. Soil Properties (similar to [40]).
PropertySoil ASoil B
Specific Gravity, Gs of soil2.602.67
Amount of Clay (%)0.004.00
Amount of Silt (%)0.608.00
Amount of Sand (%)99.4088.00
Coefficient of Uniformity, Cu1.6011.05
Coefficient of Curvature, Cc0.902.26
Optimum Moisture (or Water) Content, ωop (%) 11.9513.00
Maximum Dry Density, ρ dmax (kg/m3)1690.001908.00
ClassificationPoorly GradedWell Graded
Table 2. Internal Erosion Descriptions for Various Erosion Rate Indices [13,40].
Group NumberErosion RateDescription
1Less than 2Extremely Rapid Erosion
22 to 3Very Rapid Erosion
33 to 4Moderately Rapid Erosion
44 to 5Moderately Slow Erosion
55 to 6Very Slow Erosion
6Greater than 6Extremely Slow Erosion
Table 3. Final hole erosion test results of Soils A and B.
Lime PercentageErosion ParametersSoil ASoil B
0.0%Final Hole Diameter, φf (mm)-15
Critical Shear Stress, τc (N/m2)-100.5
Erosion Rate Index, IHET-3.69
Soil Erosion TypeFailed InstantlyModerately Rapid
1.0%Final Hole Diameter, φf (mm)338.2
Critical Shear Stress, τc (N/m2)85105
Erosion Rate Index, IHET3.694.69
Soil Erosion TypeModerately RapidModerately Slow
2.0%Final Hole Diameter, φf (mm)21.58
Critical Shear Stress, τc (N/m2)85133.33
Erosion Rate Index, IHET45.22
Soil Erosion TypeModerately SlowVery Slow
3.0%Final Hole Diameter, φf (mm)198
Critical Shear Stress, τc (N/m2)97140
Erosion Rate Index, IHET45.301
Soil Erosion TypeModerately SlowVery Slow
4.0%Final Hole Diameter, φf (mm)12.5-
Critical Shear Stress, τc (N/m2)100-
Erosion Rate Index, IHET4.22-
Soil Erosion TypeModerately Slow-
5.0%Final Hole Diameter, φf (mm)10.5-
Critical Shear Stress, τc (N/m2)115-
Erosion Rate Index, IHET4.69-
Soil Erosion TypeModerately Slow-
6.0%Final Hole Diameter, φf (mm)10.3-
Critical Shear Stress, τc (N/m2)115-
Erosion Rate Index, IHET4.69-
Soil Erosion TypeModerately Slow-
Disclaimer/Publisher’s Note: The statements, opinions and data contained in all publications are solely those of the individual author(s) and contributor(s) and not of MDPI and/or the editor(s). MDPI and/or the editor(s) disclaim responsibility for any injury to people or property resulting from any ideas, methods, instructions or products referred to in the content.