Abstract
Ensuring the sustainability of modern cities is based on creating comfortable living conditions, including reducing negative environmental impacts. The effects of various types of anthropogenic activity are manifested in a particular decrease in the quality of soils. This study aimed to assess the co-contamination of urban topsoils in Tyumen, Russia, with potentially toxic elements (PTEs), priority polycyclic aromatic hydrocarbons (PAHs), and the associated ecological and health risks. A set of 241 soil samples were analyzed using X-ray fluorescence and high-performance liquid chromatography to identify PTEs and PAHs, respectively. The most hazardous substances were Ni, As, Pb, naphthalene (NAP), fluoranthene, and high-molecular-weight PAHs causing low-to-very-high individual pollution. In general, the contribution of PAHs to soil pollution was higher than that of PTEs. It was found that 96% of the samples could be classified as clean according to the total pollution index (Zc), widely used in Russia. At the same time, one-third of the samples were characterized by low-to-high contamination according to the Nemerov pollution index (NPI). Thus, the NPI was more informative for estimating total soil pollution than the Zc. The As, Pb, NAP, and benzo[a]pyrene (BaP) contents exceeded the maximum permissible concentrations in soils by an order of magnitude, reaching an extremely dangerous level. However, the average ecological risk was assessed as minimal. Non-carcinogenic risks were predominantly due to PTE exposure and were moderate for children and low for adults. Throughout the city, carcinogenic risks exceeded the threshold but generally corresponded to a low level. The main source of carcinogenic risk was exposure to Co, As, and Pb. In general, the quality of Tyumen soils in terms of the content of PTEs and PAHs can be described as satisfactory. A spatial analysis of soil pollution and associated risks identified hot spots requiring further monitoring.
1. Introduction
Ongoing urbanization has resulted in a constant increase in cities and smaller settlements; the growth and concentration of urban populations; and the intensification of production and services, transport, trade, and information flow [1]. All these processes affect natural landscapes, and environmental pollution can be distinguished as one of the most dangerous consequences of urbanization worldwide [2,3,4]. The issues mentioned above significantly increase the relevance of urban geochemistry, which studies the abundance, forms of occurrence, origins, potential migration routes, and spatial distribution patterns of pollutants in various transit and depositional media [5,6,7,8,9].
The soil cover of cities and towns is one of the most intensively transformed components of urban ecosystems as a result of various anthropogenic activities [10,11]. Urbanization affects the morphology of soils, often replacing them with artificial soil-like bodies, as well as their chemical composition, increasing the number of potentially toxic elements (PTEs) and other substances [12]. Therefore, soil pollution is a significant threat to the urban environment and, finally, has a negative effect on human health and quality of life [13,14]. The importance of soils and soil-like bodies as study objects for geochemical studies is determined by a number of features that distinguish them from other components of the urban environment. Urban soils have a dual nature, as they can act as both sinks and sources of pollutants and provide a number of ecological services [15,16,17]. The geochemical status of urban soils reflects long-term anthropogenic impacts and urbanization histories [18,19,20,21].
Polycyclic aromatic hydrocarbons (PAHs) and PTEs are considered among the most common and dangerous pollutants, with high toxicity, carcinogenicity, and bioaccumulation potential [22,23,24]. The pollution of urban soils with PTEs and PAHs not only poses a direct environmental hazard to living organisms and adjacent components of natural and anthropogenic landscapes but also acts as a risk factor in public health [5,25,26,27]. Though these two groups of pollutants differ in their nature and geochemical behavior in soils, they both often come from similar sources and accompany industrialization and urbanization [28,29,30,31].
Studies of the combined pollution of PTEs and PAHs in urban soils and associated ecological and human health risks have been carried out in some megacities and large cities of the world [32,33,34,35,36,37,38,39,40], as well as in a number of old industrial cities [27,41,42,43,44]. Examples of studies of metal–PAH soil co-contamination in Russia are limited to a small number of cities [45,46,47,48,49]. The lack of such studies can be explained by the fact that Russia has not adopted national soil quality standards for a number of PTEs (e.g., Cr, Co, and Sr) and most PAHs (except for BaP) [50].
Tyumen is the oldest city in Western Siberia; founded in 1586, the city remained a major transport and trade center for four centuries. The basis of the city’s economy is the manufacturing industry, which, along with transportation, is the main potential source of PTEs and PAHs. The levels, patterns of spatial distribution, potential sources, and factors determining the accumulation of PTEs and PAHs in the soils of Tyumen, Russia, were previously studied in detail separately in [51,52]. The presented study assesses the status of soils based on the combined levels of PTEs and PAHs and their potential effects on the environment and population. The novelty of the proposed research is related to the application of geochemical and risk-based approaches adopted in Russia and in international practice for the assessment of combined pollution and its potentially negative effects. The specific objectives of this study were the following: (1) to assess metal-PAH soil pollution in urban topsoils of Tyumen; (2) to evaluate possible ecological risks of PTEs and PAHs; and (3) to identify the potential health risks to residents related to PTEs and PAHs.
2. Materials and Methods
2.1. Study Area
The city of Tyumen (56°59′–57°18′ N; 65°15′–65°51′ E), with an area of 698.5 km2 [53], is located southwest of the West Siberian Plain west of the Tyumen Oblast (Figure 1). The city occupies the Tura River Valley, and the marginal part of the Tura–Pyshma interfluve presents a combination of high fluvial terraces, complicated by aeolian and erosional relief. In the northern part of the city, there is a large Tarman swamp massif. The climate of the territory is continental with long cold winters and warm humid summers. The average monthly temperatures are −16.2 °C in January and 18.9 °C in July. The average annual precipitation is 545 mm [54]. North and northwesterly winds prevail during the year. Natural landscapes are represented by birch and aspen–birch forests and dry meadows on drained interfluves with Luvic Phaeozems on loess-like loams and clays; pine forests on aeolian sandy terraces with Albic or Brunic Arenosols; grass meadows in the floodplain with Eutric Fluvisols; and disturbed wetlands with Supric Drainic Hystosols and Histic Gleysols [51].
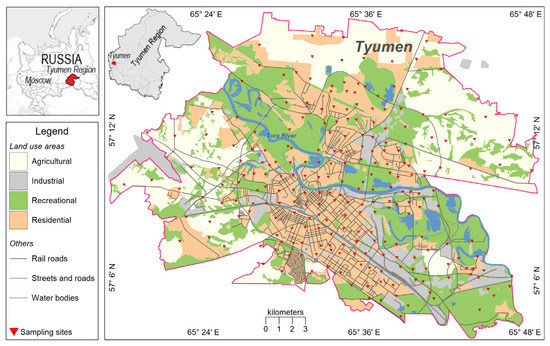
Figure 1.
Land use areas of the city of Tyumen with the soil sampling sites.
Large industrial enterprises began to operate in Tyumen beginning in the middle of the 19th century, and the most intensive growth in production occurred in the 1950–1980s of the 20th century. At present, the basis of the manufacturing industry is electric arc furnace steelmaking, petroleum refining, power generation, the production and disposal of hybrid and lead–acid batteries, mechanical engineering, metalworking, and construction material production. The trend in recent decades has been to reduce the number of industrial enterprises, especially medium and precision engineering, and to transfer production sites to the periphery of the urban area. As a result, deconstructed sites appear in the existing urban development, which are then built up into new residential areas [55]. The need for such planning decisions is due to the constant growth of the urban population, which reached 828,575 people in 2022 [53]. According to the forecast of the municipal authorities, Tyumen will become a city with a million-plus population by 2040 [56].
2.2. Soil Sampling and Soil Physical–Chemical Properties
Field surveys were performed from June to September 2016 within the boundaries of Tyumen. The city’s territory was divided into 1 km2 cells within highly urbanized areas and 4 km2 cells within unbuilt areas, and 241 sampling sites were selected (Figure 1). Five topsoil subsamples were collected at a 0–10 cm depth, from the corners and center of each sampling site with a 5 m side. Collected mixed soil samples were air-dried, cleared of debris and plant residues, ground, and sieved through a 1 mm sieve [57].
Since Russian soil quality standards take into account differences in the resistance of soils to chemical pollution depending on their physical and chemical properties, the main parameters were determined in the topsoil samples: pH at a soil-to-water ratio of 1:2.5 using a multi-parameter meter [57] and the physical clay fraction (<0.01 mm), consisting of clay and fine and medium silt [58], using a laser diffraction analyzer, LS 13 320 (Beckman Coulter, Indianapolis, IN, USA), with preliminary dispersion in 4% Na4P2O7 solution (JSC “LenReactiv”, Saint Petersburg, Russia).
Urban topsoils ranged in acidity from very strongly acidic to strongly alkaline (pH = 4.8–8.9). The content of a fraction less than 0.01 mm ranged from 4.5 to 61.6%, which indicated soils from sandy to sandy–clayey according to the East European texture classification system [58], and soils with a light texture generally dominated. The share of sandy and sandy–loamy soils, the least resistant to pollution, was 24.5%; the largest share (75.1%) was loamy and clayey soils with acidities from medium acidic to alkaline (pH > 5.5), for which the highest threshold values were established [50]. The results of determining the other basic physical–chemical properties of urban topsoils and a more detailed discussion are described in previously published studies [51,59].
2.3. Soil Analysis
Vanadium, Cr, Co, Ni, Cu, Zn, As, Sr, and Pb were determined by analyzing dried and finely ground (to a 200-mesh particle size) soil samples with a vacuum wavelength-dispersive scanning X-ray fluorescence spectrometer (Spectroscan “MAX-GV”, Spectron, Saint Petersburg, Russia) [60]. Quantitative PTE analysis was carried out automatically using the Kvant software (Spectron, Saint Petersburg, Russia). Limits of quantification (LOQ; mg kg−1) were as follows: 3 for As; 7 for Co; 10 for V, Ni, and Cu; 14 for Zn; 16 for Pb; 25 for Cr; and 50 for Sr. Elements with concentrations below the LOQ were taken as half of one [51].
For quality assurance and quality control (QA/QC) purposes, duplicates, blanks, internal standards, and GSS 10412–2014-certified reference material (CRM) were used. Accuracy and precision corresponded to the internal standards of the certified method [60].
Sample preparation for the PAH analysis was performed according to the procedure [61]. A dried soil sample supplemented with a PAH standard solution (Sigma-Aldrich, Saint Louis, MO, USA) was mixed with 2% KOH in ethanol (JSC “LenReactiv”, Saint Petersburg, Russia) and heated to reflux in a water bath to remove soil lipid components. The percolate was extracted three times with n-Hexane (Cryochrom, Saint Petersburg, Russia) and distilled water in a mechanical shaker and cleaned with distilled water through anhydrous Na2SO4 (JSC “LenReactiv”, Saint Petersburg, Russia) in a separatory funnel. The extract was then concentrated in a rotary evaporator and dissolved in acetonitrile (Sigma-Aldrich, Saint Louis, MO, USA).
Priority PAHs were determined via high-performance liquid chromatography using a 1260 Infinity system (Hypersil BDS C18 reversed-phase column, 5 μm, 125 mm × 4.6 mm; Thermo Fisher Scientific, Waltham, MA, USA) with a fluorescence detector (Agilent, Santa Clara, CA, USA) following the ISO 13859:2014 method [62]. Compounds were identified by comparing the retention times to those of an authentic standard solution (Sigma-Aldrich, Saint Louis, MO, USA) containing anthracene (ANT), benzo[a]anthracene (BaA), benzo[a]pyrene (BaP), benzo[b]fluoranthene (BbF), benzo[g,h,i]perylene (BghiP), benzo[k]fluoranthene (BkF), dibenzo[a,h]anthracene (DBA), fluoranthene (FLT), fluorene (FLU), naphthalene (NAP), phenanthrene (PHE), and pyrene (PYR). Quantification was performed by using the standard external method.
QA/QC procedures were performed according to the Agilent Application Solution [63]. A random component of the measurement error was estimated, which, for a concentration range of 2–200 μg kg−1, was 3.5–14%. Calibration curves and CRM were used for the calculation of the limits of detection (LOD) and LOQ, which were presented previously [52].
2.4. Data Analysis
The software package STATISTICA 12 (StatSoft, Tulsa, OK, USA) was used to analyze the data. Univariate analysis was conducted for the concentrations of PTEs and PAHs, pollution, and risk parameters. The median value was preferred as a robust measure of the central tendency of the dataset. Data visualization was performed using Grapher 17 (Golden Software, Golden, CO, USA). Maps illustrating the spatial distribution of the calculated pollution and total risk parameters were created in Surfer 15 (Golden Software, Golden, CO, USA) using ordinary kriging.
2.5. Soil Pollution and Risk Assessment
The system of individual and total geochemical indices and parameters of associated ecological and human health risks was used for a comprehensive assessment of the state of the urban topsoils using the level of inorganic and organic pollutants (Figure 2).
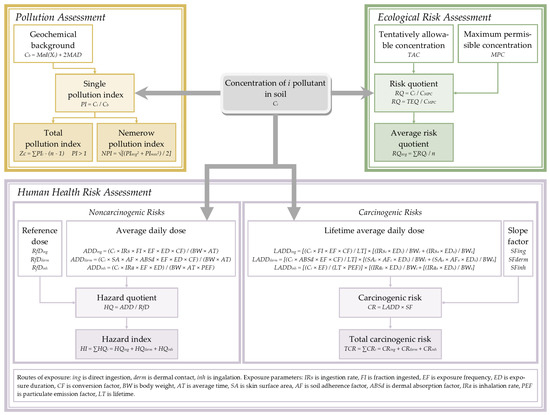
Figure 2.
Principal scheme of urban soil pollution and ecological and human health risk assessment.
The assessment of soil pollution is based on the analysis of the excess content of elements and compounds in urban soils (Ci) over the geochemical background (Cb). The background corresponds to the threshold separating the normal concentrations of pollutants typical of the study area from anomalous ones [64]. In this study, the Cb values of PTEs and PAHs (Table A1) were determined using the statistical method proposed by Reimann et al. [65,66]. Thresholds were calculated as the median plus twice the median absolute deviation (Med + 2MAD) from log-transformed data followed by inverse transformation to reduce the effect of outliers and extremes in skewed datasets [48]. Soil contamination by individual elements was assessed with a single pollution index (PI) [67]. This indicator was used to calculate complex indicators of pollution (Figure 2), which are most widely adopted for geochemical studies [47,51,68,69]. For environmental control of the state of soils in Russia, the total pollution index (ZC) is used [50]. In addition, the Nemerov pollution index (NPI) was calculated [67], which identifies multicomponent anomalies in cases of high concentrations of one or more pollutants at low levels of most of the analyzed substances. Classification values of the PI, ZC, and NPI are listed in Table 1.

Table 1.
Criteria for classifying soil pollution and ecological and human health risks.
The assessment of the ecological risks of soil pollution posed by individual substances was carried out by comparing their contents in urban soils (Ci) with quality standards (CMPC) based on the calculation of the risk quotient (RQ) (Figure 2). As limiting estimates, soil screening levels (SSLs) of Sr [76], maximum permissible concentrations (MPCs), and tentatively allowable concentrations (TACs) of other pollutants are used (Table A1). Since the MPCs of Cr, Co, and PAHs (except for BaP) in the soils of Russia are not defined [50], Canadian Soil Quality Guidelines for the Protection of Environmental and Human Health were chosen [77]. The total ecological risk of metal–PAH contamination was estimated as the average risk quotient (RQavg). The risk classes of the RQ and the RQavg are presented in Table 1.
The health risk to the urban residents associated with soil pollutants was assessed using the quantitative model [73]. It is assumed that pollutants enter the human body with soil particles via ingestion (ing), through skin contact (derm), and via inhalation (inh) (Figure 2). To assess the non-carcinogenic risk, namely, the risk of general toxic effects, the average daily doses (ADD; mg/kg-day) depending on the route of exposure were calculated separately for adults and children under 6 years of age [73,78,79] and compared with reference doses (RfD; mg/kg-day). The obtained values characterized the hazard quotient (HQ) of each substance for each of the routes of entry [73,80]. The lifetime average daily doses (LADD; mg/kg-day) were calculated to evaluate cancer risks caused by long-term exposure [26,71] and multiplied by the slope factor (SF; (mg/kg-day)−1) for an appropriate carcinogen to obtain the individual carcinogenic risk (CR) for each exposure pathway. Multi-pathway and multi-chemical non-carcinogenic and carcinogenic risks were assessed using the total hazard index (HI) and the total carcinogenic risk (TCR), respectively. The exposure parameters used in the calculations are listed in Table A2. The RfD and SF of the studied pollutants used for risk assessment are presented in Table A3. Classes of individual and cumulative non-carcinogenic (HQ and HI) and carcinogenic risks (CR and TCR) are presented in Table 1.
3. Results and Discussion
3.1. PTE and PAH Levels in Soils and Geochemical Background
Figure 3 illustrates the variability of PTE and PAH content in the urban soils of Tyumen. Pollutants are characterized by a skewed distribution with a significant number of outliers. This fact is due to the intense influence of local sources of pollutants [51,52]. A more detailed discussion of the results of the determination of PTEs and PAHs in the soils of the city of Tyumen is available in previously published studies [51,59].
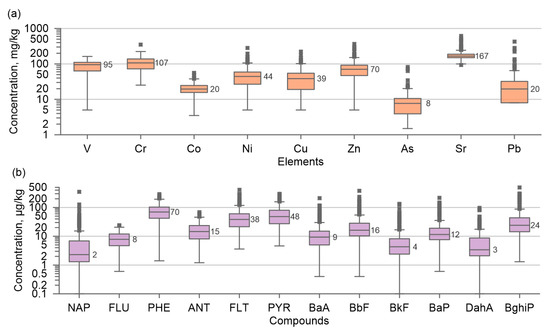
Figure 3.
Boxplots of concentrations of (a) PTEs and (b) PAHs in urban topsoils of Tyumen. The boxes are the interquartile range (IQR), the lines inside the boxes and values correspond to the median, the whiskers are rated as IQR × 1.5, and outliers (>IQR × 1.5) are shown with asterisks.
Calculated Cb values are shown in Table A1. A comparison of the Cb of PTEs and PAHs in Tyumen soils with the global background reveals a number of characteristic features. The threshold values of Pb, Cr, Ni, Co, As, Cu, and Zn slightly exceed the world soil average (by 1.9–4.4 times), which indicates the significant role of the anthropogenic factor in their accumulation. The background of V and Sr practically does not differ from the global values [81], and these elements are predominantly of natural origin [51]. There are no data in the literature on the average global content of individual PAHs in soils; therefore, Cb values calculated for urban topsoils are compared with the average content of PAHs in natural forest soils in the temperate zone [82]. The thresholds of ANT, FLU, PHE, and PYR slightly exceed the global background by 2.0–4.8 times. Previously, it was shown that the entry of these compounds into urban soils is associated with biomass combustion [52]. The urban background of BghiP, DahA, FLT, BaP, and BaA is comparable to the average for forest soils, and the background of NAP, BbF, and BkF is significantly lower than the global one (2.2–12.7 times).
It should be noted that the Cb values calculated for Cr, Ni, As, and BaP exceed the established soil quality standards (Table A1); therefore, the risk of contamination by these substances may be underestimated.
3.2. Urban Soil Pollution
Boxplots illustrating the PI values for PTEs and PAHs in the urban soils of Tyumen are shown in Figure 4. The pollutants form three groups depending on the potential hazard to the soil environment. The first group includes the least dangerous, V, Cr, Co, FLU, PHE, and ANT, which are characterized by a PI of up to 1.8 with a median of 0.4–0.7. Consequently, clean (92.1–99.2%) and slightly polluted soils (0.8–7.9%) were determined.
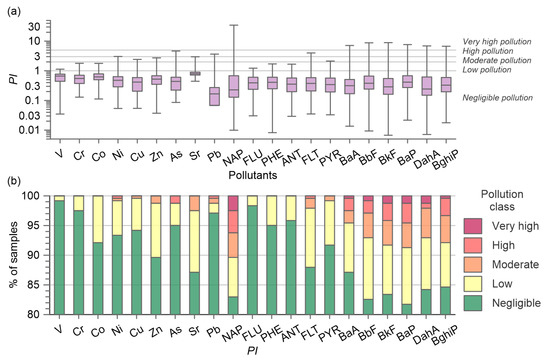
Figure 4.
Boxplots of (a) the single pollution index (PI) of PTEs and PAHs in urban topsoils of Tyumen and (b) soil pollution class percentages. The boxes are the median ± quartile; the whiskers are the minimum and maximum.
The second group consists of Cu, Zn, Sr, and PYR with higher PI values (0.03–2.7; median 0.3–0.8). In most soils, contamination is negligible (89.6–94.2%), and insignificant proportions of samples are characterized by low (5.4–10.4%) and moderate pollution (0.4–2.5%) (Figure 4).
The last group is the most numerous and identifies the priority pollutants of urban soils in Tyumen, which form the following series of increasing median PIs: Pb < NAP < DahA < BkF < BaA < BghiP < FLT < BbF < BaP < As < Ni < Zn. The PI values for Ni, As, Pb, and FLT reach 3.0, 4.6, 3.7, and 4.0, respectively, and pollution classes are distinguished from low (1.7–10%) and moderate (0–4.1%) to high (0.4–1.2%) (Figure 4). Although most samples are characterized as unpolluted (83–87%) or slightly polluted (6.6–10.4%) by NAP, BaA, BbF, BkF, BaP, DahA, and BghiP. High and very high pollution with these substances was detected in 0.8–3.7% and 0.4–2.5% of the samples, respectively.
The results obtained are consistent with the data of a number of studies [45,46,48], indicating a high accumulation of a number of PTEs, in particular, Ni, Zn, As, Pb, and BaP in urban soils because of industrial and vehicle emissions of these substances.
The ZC values ranged from 1.0 to 45.6, with a median of 1.2. The distribution of soils by pollution classes according to ZC values is shown in Figure 5a. The vast majority of soils are uncontaminated (90.9%), and high pollution is noted in single samples (0.8%). The NPI varies from 0.4 to 24.6 with a median of 0.9. Two-thirds of the soils are uncontaminated, a quarter is characterized by low pollution, and 6.2% and 7.9% have moderate and high pollution, respectively (Figure 5b). According to the ZC, separate areas of moderately and highly hazardous pollution are distributed mainly in the impact zones of enterprises and near large traffic interchanges, while, according to the NPI, moderately and highly polluted soils occupy significant areas of industrial and residential areas of the urban core and remote areas beyond its borders (Figure 5).
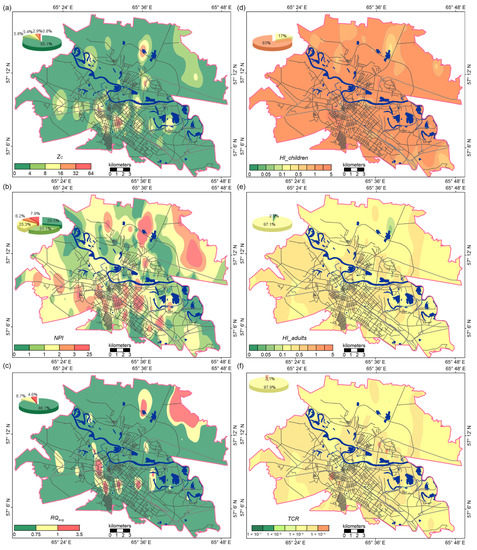
Figure 5.
Spatial distribution of total pollution and cumulative ecological and health risks of PTEs and PAHs in urban topsoils of Tyumen: (a) total pollution index (ZC); (b) Nemerov pollution index (NPI); (c) average risk quotient (RQavg); (d) hazard index for children (HI_children); (e) hazard index for adults (HI_adults); and (f) total carcinogenic risk (TCR).
The choice of an integral indicator in the analysis of combined soil contamination with PTEs and PAHs has a number of features. At first glance, the assessment of soil pollution by the NPI seems to be overestimated; however, it makes it possible to identify single-component anomalies. At the same time, the ZC is distinguished by a more detailed scale of soil pollution (Table 1) and corresponding hazard levels. Thus, significant differences in estimates of metal-PAH soil contamination by the ZC and the NPI lead to the conclusion that the pollution assessment should be carried out not by itself but jointly with the assessment of ecological risks, which allows us to choose the most representative indicator.
It should be noted that, in general, the territory of Tyumen is characterized by a minimum level of total pollution, which is mainly due to industrial specialization and the location of industries. Most of the enterprises are of local and regional significance, concentrated in clusters on the periphery of the main urban area. For example, in the soils of the Eastern District of Moscow, with a similar industrial specialization, a higher medium-hazardous PTE pollution was noted [46], which is associated with a more intense anthropogenic input because of pollutants that come from the emissions of large enterprises.
3.3. Ecological Risks of Soil Pollution
The ecological risks of soil pollution were assessed using the RQ to determine the excess of the concentrations of substances in the studied soils over the MPCs and TACs, as presented in Figure 6. The levels of V, Co, Sr, FLU, ANT, FLT, BaA, BbF, BkF, and DahA in the soils of Tyumen did not exceed the standards (RQ < 1); therefore, there are no risks associated with these pollutants. By increasing the median RQ values, the remaining substances form a series: PYR (0.004) < NAP = Pb (0.2) < Cu (0.3) < Zn (0.4) < BaP = Ni (0.6) < As (0.9) < PHE (1.5) < Cr (1.6). In the majority of samples (91.3–99.6%), the levels of Ni, Cu, Zn, and PYR do not exceed the MPCs and TACs; in a small proportion of samples, risks ranging from low to high are noted. The largest proportion of soils with a low risk of individual pollution is typical for Cr (24.1%) and PHE (21.6%), and the RQ values for these pollutants reach 5.4 and 6.3. Arsenic, Pb, NAP, and BaP represent a significant ecological hazard, the contents of which in some samples exceed the soil quality standards by an order of magnitude (by 41, 13, 27, and 11 times, respectively); moderate and high ecological risks were noted in 9.5%, 0.8%, 3.3%, and 7.5% of samples, respectively.
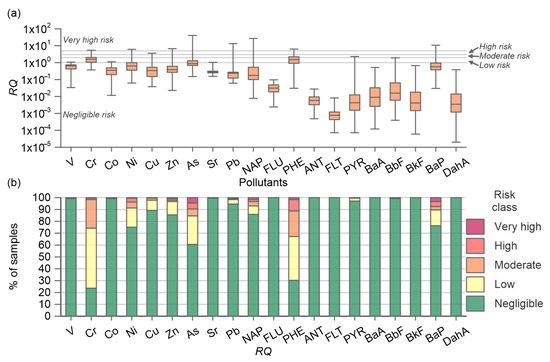
Figure 6.
Boxplots of (a) the risk quotient (RQ) of PTEs and PAHs in urban topsoils of Tyumen and (b) the percentages of ecological risk classes. The boxes are the median ± quartile; the whiskers are the minimum and maximum.
In other cities of Russia, such as Vorkuta [45], Moscow [46], and St. Petersburg [48], there are also significant excesses in the permissible concentrations of As, Pb, and BaP in soils. It is likely that these pollutants can be considered key indicators of the impact of urbanization on soil quality.
The average total risk of combined contamination in urban soils with PTEs and PAHs (RQavg) ranges from 0.1 to 3.4 with a median of 0.5. The total risk was insignificant in 86.7% of the samples, hence the soils were considered clean. In 8.7% of the samples, the risk corresponded to the warning limit. The remaining 4.6% of the samples were characterized as contaminated (Figure 5c).
Areas of high total ecological risk are confined to the influence zones of mechanical engineering and metalworking enterprises and are located mainly within residential areas, so soil pollution poses a significant danger to the population. It should be noted that the location of the zones of combined soil contamination with PTEs and PAHs according to the RQavg is similar to those obtained with the ZC (Figure 5).
3.4. Human Health Risks of Soil Pollution
All studied PTEs cause long-term toxic effects, as do most priority PAHs, except for BaA, BbF, BkF, and BghiP. Descriptive statistics on the HQ and HI for children and adults are presented in Figure 7.
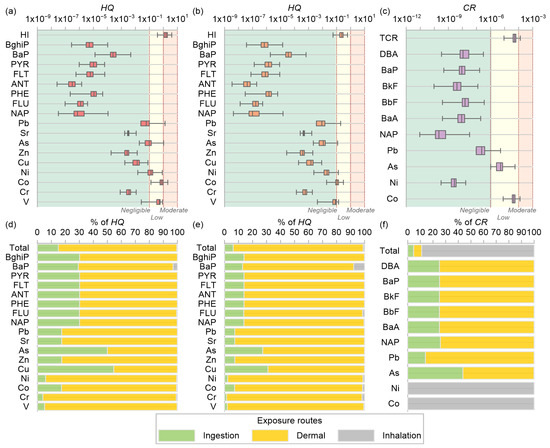
Figure 7.
Boxplots of hazard quotients (HQs) for (a) children, (b) adults, and (c) the cancerogenic risks (CR) of pollutants in urban topsoils of Tyumen and the contribution of exposure routes to the HOs to (d) children, (e) adults, and (f) the CR for the general population. The boxes are the median ± quartile; the whiskers are the minimum and maximum.
A number of soils are characterized by the presence of a significant general toxic risk to children (HQ > 0.1) (Figure 7a) associated with the oral intake of Co, As, and Pb and skin contact with V, Co, Ni, As, and Pb. In cases of inhalation, the HQ was < 0.1 for all pollutants (Figure 7d). Low risks to adults are posed by dermal exposure to V, Co, Ni, and Pb (0.3 > HQ > 0.1) (Figure 7b,e). When all routes of intake are taken into account, there are no non-carcinogenic risks to all age groups from exposure to Cr, Cu, Zn, Sr, or any individual PAHs since even the maximum values of HQ are < 0.1.
HI values for children range from 0.38 to 3.94, with a median of 1.54 (Figure 7a). A significant proportion of samples is characterized by moderate risk (83%), and a small part is characterized by low risk (17%). The risks of developing non-carcinogenic effects under the combined exposure to PTEs and PAHs for adults (Figure 7b) are an order of magnitude lower (HI: 0.06–0.6; median: 0.23); in 97.1% of samples, the risk is low, and in 2.9% of samples, the risk is negligible. The maximum HI values for children and adults are observed in soils near the machine-building cluster in the central part of the city, although risks do not exceed moderate or low levels, respectively (Figure 5d,e).
Only some of the studied pollutants are carcinogenic (Table A3). The least hazardous are Ni, NAP, BaA, BbF, BkF, BaP, and DahA. Their presence in none of the samples does not lead to a risk (CR ≤ 1 × 10⁻⁶), both when taking into account individual routes of entry and when assessing the combined effect (Figure 7a,c). The acceptable level of risk is exceeded in some samples with the ingestion of As, the transdermal intake of As and Pb, and the inhalation of Co. The significance of the routes of the total intake of pollutants for the occurrence of carcinogenic risks (Figure 7f) increases in a series (by increasing the median CR values): ingestion (2.3 × 10⁻⁶) < dermal contact (3.2 × 10⁻⁶) < inhalation (4.4 × 10⁻⁵).
Values of TCR range from 9.1 × 10⁻⁶ to 1.3 × 10⁻⁴, with a median of 5.2 × 10⁻⁵ (Figure 7c). Soils are divided by risk level into classes characterized by a low and moderate carcinogenic risk from Co (98.3 and 1.7% of samples) or an insignificant and low risk from As (0 and 100% of samples) and Pb (95 and 5% of samples). In the vast majority of samples (97.9%), a low risk of combined carcinogenic effects from PTEs and PAHs was determined; only 2.1% showed a moderate risk level. Areas of increased total carcinogenic risk are confined to the industrial clusters of the urban core (Figure 5f).
The greatest concern is caused by the medium-risk zone, which mainly occupies residential areas in the southwest of the city. This level of risk is acceptable for outdoor workers but unacceptable for the general population [73,79]. Consequently, this territory requires a more detailed study in order to plan measures to reduce carcinogenic risks arising from the interaction of the population with contaminated soils.
4. Conclusions
The comprehensive assessment of the state of soils in Tyumen allows us to conclude that the situation is quite favorable for most of the city, which is in good agreement with current trends of urbanized area development. The spatial patterns of soil pollution significantly differ from each other. When choosing an indicator characterizing the total level of pollution, it is necessary to accurately take into account the soil and geochemical features of the urban area.
The combined assessment of soil pollution revealed that Ni, As, Pb, naphthalene, and high-molecular-weight PAHs are the priority pollutants. In general, PAHs contribute much more to combined pollution levels than PTEs.
The ZC pollution assessment indicates areas of moderate and highly hazardous pollution near enterprises and large transport hubs, while, according to the NPI, moderately and heavily polluted soils occupy large areas of both industrial and residential areas of the urban core and slightly urbanized areas beyond.
It has been established that, at elevated levels of PTEs and PAHs, when interacting with soils, significant general toxic risks to the health of residents arise.
An ecological risk assessment of soil quality in Tyumen showed that the soil contamination with NAP, BaP, As, and Pb is of greatest concern, while human health risks are mainly due to soil contamination with PTEs. The maximum values of the combined metal–PAH risks were characteristic of the industrial and residential areas in the city center.
Author Contributions
Conceptualization, E.K.; methodology, E.K. and A.K.; validation, E.K., E.A. and A.S.; laboratory analysis, E.A. and A.S., formal analysis, E.K.; investigation, E.K. and A.K.; resources, S.S. and S.M.; data curation, E.K. and T.M.; writing—original draft preparation, E.K. and A.K.; writing—review and editing, T.M., V.D.R., and S.M.; visualization, E.K.; supervision, T.M.; project administration, S.S.; funding acquisition, E.K. All authors have read and agreed to the published version of the manuscript.
Funding
This research was funded by Russian Science Foundation, Project No. 22-77-00099.
Data Availability Statement
The data presented in this study are available upon request from the corresponding author.
Conflicts of Interest
The authors declare no conflict of interest. The funders had no role in the design of the study; in the collection, analyses, or interpretation of the data; in the writing of the manuscript; or in the decision to publish the results.
Appendix A
Table A1.
Parameters used to assess soil pollution caused by PTEs (mg/kg) and PAHs (μg/kg) and the associated ecological risks.
Table A1.
Parameters used to assess soil pollution caused by PTEs (mg/kg) and PAHs (μg/kg) and the associated ecological risks.
| Parameter | V | Cr | Co | Ni | Cu | Zn | As | Sr | Pb | NAP | FLU | PHE | ANT | FLT | PYR | BaA | BbF | BkF | BaP | DahA | BghiP | Reference | |
|---|---|---|---|---|---|---|---|---|---|---|---|---|---|---|---|---|---|---|---|---|---|---|---|
| Cb | 143.4 | 194.3 | 31.3 | 93.0 | 92.3 | 134.8 | 17.5 | 209.0 | 117.6 | 10.1 | 19.8 | 170.0 | 41.1 | 102.5 | 140.5 | 29.6 | 42.7 | 14.9 | 27.8 | 14.0 | 73.5 | This study | |
| MPC | T | 150 | – | – | – | – | – | – | – | – | – | – | – | – | – | – | – | – | – | 20 | – | [50] | |
| A | – | 64 | 40 | – | – | – | – | – | – | 13 | 250 | 46 | 2500 | 50,000 | 100 | 100 | 100 | 100 | – | 100 | – | [77] | |
| R | – | 64 | 50 | – | – | – | – | – | – | 13 | 250 | 46 | 2500 | 50,000 | 10,000 | 1000 | 1000 | 1000 | – | 1000 | – | ||
| I | – | 87 | 300 | – | – | – | – | – | – | 13 | 250 | 46 | 32,000 | 180,000 | 100,000 | 10,000 | 10,000 | 10,000 | – | 10,000 | – | ||
| TAC | SS | – | – | – | 20 | 33 | 55 | 2 | – | 32 | – | – | – | – | – | – | – | – | – | – | – | – | [50] |
| AL | – | – | – | 40 | 66 | 110 | 5 | – | 65 | – | – | – | – | – | – | – | – | – | – | – | – | ||
| NL | – | – | – | 80 | 132 | 220 | 10 | – | 130 | – | – | – | – | – | – | – | – | – | – | – | – | ||
| SSL | – | – | – | – | – | – | – | 600 | – | – | – | – | – | – | – | – | – | – | – | – | – | [76] | |
Notes: Land use areas: A is the agricultural area, R is the residential or recreational area, I is the industrial area, T is the total area. SS is sandy soils with PM10 < 20%, AL is loamy soils with a PM10 > 20% and a pH < 5.5, NL is loamy soils with a PM10 > 20% and a pH > 5.5.
Table A2.
Exposure parameters used for the human health risk assessment.
Table A2.
Exposure parameters used for the human health risk assessment.
| Parameter | Unit | Children | Adults | Reference |
|---|---|---|---|---|
| ABSd | - | V, Co, Cu, Zn, Sr, Pb 0.03; Cr 0.02; Ni 0.04; As 0.06; PAHs 0.013 | [83] | |
| AF | mg/cm2 | 0.2 | 0.07 | [79] |
| AT | Days | 2190 | 7300 | [73] |
| BW | kg | 15 | 80 | [79] |
| CF | kg/mg | 1 × 10⁻⁶ | [73] | |
| ED | years | 6 | 20 | [79] |
| EF | days/year | 350 | [79] | |
| FI | - | 1 | [73] | |
| IRa | m3/day | 8.1 | 15.6 | [78] |
| IRs | mg/day | 30 | 10 | [84] |
| LT | days | 25550 | [79] | |
| PEF | m3/kg | 1.36 × 10⁹ | [80] | |
| SA | cm2 | 2373 | 6032 | [79] |
Table A3.
Reference doses (RfD, mg/kg-day) and slope factors (SF, (mg/kg-day)−1) of the studied elements and compounds.
Table A3.
Reference doses (RfD, mg/kg-day) and slope factors (SF, (mg/kg-day)−1) of the studied elements and compounds.
| Pollutant | RfDing | RfDderma | RfDinhb | SFing | Sfdermc | SFinhd | Reference |
|---|---|---|---|---|---|---|---|
| V | 7.0 × 10⁻³ | 1.82 × 10⁻⁴ | 2.86 × 10⁻⁵ | - | - | - | [85,86] |
| Cr(III) | 1.5 | 1.95 × 10⁻² | 1.43 × 10⁻³ | - | - | - | [86,87] |
| Co | 3.0 × 10⁻⁴ | 3.0 × 10⁻⁵ | 1.7×10⁻⁶ | - | - | 3.15 × 10⁴ | [88] |
| Ni | 1.1 × 10⁻² | 4.4 × 10⁻⁴ | 2.57 × 10⁻⁵ | - | - | 0.84 | [86,87,89] |
| Cu | 1.0 × 10⁻² | 5.7 × 10⁻³ | - | - | - | - | [86] |
| Zn | 0.3 | 3.0 × 10⁻² | - | - | - | - | [87] |
| As | 3.0 × 10⁻⁴ | 2.85 × 10⁻⁴ | 4.29 × 10⁻⁴ | 1.5 | 1.58 | 15.05 | [87,89] |
| Sr | 0.6 | 6.0 × 10⁻² | - | - | - | - | [87] |
| Pb | 3.6 × 10⁻³ | 3.6 × 10⁻⁴ | - | 8.5 × 10⁻³ | 8.5 × 10⁻² | 4.2 × 10⁻² | [89,90] |
| NAP | 2.0 × 10⁻² | 1.78 × 10⁻² | 8.57 × 10⁻⁴ | 0.12 | 0.13 | 0.12 | [87,89] |
| FLU | 4.0 × 10⁻² | 3.56 × 10⁻² | 4.57 × 10⁻⁴ | - | - | - | [87,91] |
| PHE | 4.0 × 10⁻² | 3.56 × 10⁻² | - | - | - | - | [90] |
| ANT | 0.3 | 0.267 | 0.34 | - | - | - | [87,91] |
| FLT | 4.0 × 10⁻² | 3.56 × 10⁻² | - | - | - | - | [87] |
| PYR | 3.0 × 10⁻² | 2.67 × 10⁻² | 3.4 × 10⁻² | - | - | - | [87,91] |
| BaA | - | - | - | 1.2 | 1.35 | 0.39 | [89] |
| BbF | - | - | - | 1.2 | 1.35 | 0.39 | [89] |
| BkF | - | - | - | 1.2 | 1.35 | 0.39 | [89] |
| BaP | 3.0 × 10⁻⁴ | 2.67 × 10⁻⁴ | 5.7 × 10⁻⁷ | 1.0 | 1.12 | 2.1 | [89] |
| DahA | - | - | - | 4.1 | 4.61 | 4.1 | [89] |
| BghiP | 3.0 × 10⁻² | 2.67 × 10⁻² | - | - | - | - | [90] |
Notes: Subscripts indicate the entry paths of elements: ing, ingestion; derm, dermal contact; inh, inhalation. a , where ABSgi is a fraction of the element absorbed in the gastrointestinal tract: [92]. b , where RfC is a reference concentration [73]. c , where ABSgi is a fraction of the contaminant absorbed in the gastrointestinal tract [92]. d , where UR is the risk-per-unit content of the substance [73].
References
- United Nations (UN). World Population Prospects 2022: Summary of Results; United Nations: New York, NY, USA, 2022; 38p. [Google Scholar]
- Timofeev, I.; Kosheleva, N.; Kasimov, N. Health risk assessment based on the contents of potentially toxic elements in urban soils of Darkhan, Mongolia. J. Environ. Manag. 2019, 242, 279–289. [Google Scholar] [CrossRef] [PubMed]
- Seleznev, A.A.; Yarmoshenko, I.V.; Malinovsky, G.P. Urban geochemical changes and pollution with potentially harmful elements in seven Russian cities. Sci. Rep. 2020, 10, 1668. [Google Scholar] [CrossRef] [PubMed]
- Liang, L.; Gong, P. Urban and air pollution: A multi-city study of long-term effects of urban landscape patterns on air quality trends. Sci. Rep. 2020, 10, 18618. [Google Scholar] [CrossRef] [PubMed]
- Charlesworth, S.; De Miguel, E.; Ordonez, A. A review of the distribution of particulate trace elements in urban terrestrial environments and its application to consideration of risk. Environ. Geochem. Health 2011, 33, 103–123. [Google Scholar] [CrossRef] [PubMed]
- Demetriades, A.; Birke, M. Urban Topsoil Geochemical Mapping Manual (URGE II); EuroGeoSurveys: Brussels, Belgium, 2015; 52p. [Google Scholar]
- Chambers, L.G.; Chin, Y.P.; Filippelli, G.M.; Gardner, C.B.; Herndon, E.M.; Long, D.T.; Lyons, W.B.; Macpherson, G.L.; McElmurry, S.P.; McLean, C.E.; et al. Developing the scientific framework for urban geochemistry. Appl. Geochem. 2016, 67, 1–20. [Google Scholar] [CrossRef]
- Birke, M.; Rauch, U.; Stummeyer, J.; Lorenz, H.; Keilert, B. A review of platinum group element (PGE) geochemistry and a study of the changes of PGE contents in the topsoil of Berlin, Germany, between 1992 and 2013. J. Geochem. Explor. 2018, 187, 72–96. [Google Scholar] [CrossRef]
- Yarmoshenko, I.; Malinovsky, G.; Baglaeva, E.; Seleznev, A.A. Landscape Study of Sediment Formation and Transport in the Urban Environment. Atmosphere 2020, 11, 1320. [Google Scholar] [CrossRef]
- Greinert, A. The heterogeneity of urban soils in the light of their properties. J. Soils Sediments 2015, 15, 1725–1737. [Google Scholar] [CrossRef]
- Jiménez-Ballesta, R.; De Soto-García, I.S.; García-Navarro, F.J.; García-Giménez, R. Recognizing the Importance of an Urban Soil in an Open-Air City Museum: An Opportunity in the City of Madrid, Spain. Land 2022, 11, 2310. [Google Scholar] [CrossRef]
- Martin, A.P.; Lim, C.; Kah, M.; Rattenbury, M.S.; Rogers, K.M.; Sharp, E.L.; Turnbull, R.E. Soil pollution driven by duration of urbanisation and dwelling quality in urban areas: An example from Auckland, New Zealand. Appl. Geochem. 2023, 148, 105518. [Google Scholar] [CrossRef]
- Huang, Y.; Chen, Q.Q.; Deng, M.H.; Japenga, J.; Li, T.Q.; Yang, X.; He, Z.L. Heavy metal pollution and health risk assessment of agricultural soils in a typical peri-urban area in southeast China. J. Environ. Manag. 2018, 207, 159–168. [Google Scholar] [CrossRef] [PubMed]
- Brevik, E.C.; Slaughter, L.; Singh, B.R.; Steffan, J.J.; Collier, D.; Barnhart, P.; Pereira, P. Soil and human health: Current status and future needs. Air Soil Water Res. 2020, 13, 1178622120934441. [Google Scholar] [CrossRef]
- Blanchart, A.; Séré, G.; Cherel, J.; Warot, G.; Stas, M.; Noël, C.J.; Morel, J.L.; Schwartz, C. Towards an operational methodology to optimize ecosystem services provided by urban soils. Landsc. Urban. Plan. 2018, 176, 1–9. [Google Scholar] [CrossRef]
- Sarkar, B.; Mukhopadhyay, R.; Ramanayaka, S.; Bolan, N.; Ok, Y.S. The role of soils in the disposition, sequestration and decontamination of environmental contaminants. Philos. Trans. R. Soc. B 2021, 376, 20200177. [Google Scholar] [CrossRef]
- O’Riordan, R.; Davies, J.; Stevens, C.; Quinton, J.N.; Boyko, C. The ecosystem services of urban soils: A review. Geoderma 2021, 395, 115076. [Google Scholar] [CrossRef]
- Liu, Y.; Su, C.; Zhang, H.; Li, X.; Pei, J. Interaction of Soil Heavy Metal Pollution with Industrialization and the Landscape Pattern in Taiyuan City, China. PLoS ONE 2014, 9, e105798. [Google Scholar] [CrossRef]
- McClintock, N.A. Critical Physical Geography of Urban Soil Contamination. Geoforum 2015, 65, 69–85. [Google Scholar] [CrossRef]
- Li, F.; Yang, H.; Ayyamperumal, R.; Liu, Y. Pollution, sources, and human health risk assessment of heavy metals in urban areas around industrialization and urbanization-Northwest China. Chemosphere 2022, 308, 136396. [Google Scholar] [CrossRef]
- Tešić, M.; Stojanović, N.; Knežević, M.; Đunisijević-Bojović, D.; Petrović, J.; Pavlović, P. The Impact of the Degree of Urbanization on Spatial Distribution, Sources and Levels of Heavy Metals Pollution in Urban Soils—A Case Study of the City of Belgrade (Serbia). Sustainability 2022, 14, 13126. [Google Scholar] [CrossRef]
- Chen, H.; Teng, Y.; Lu, S.; Wang, Y.; Wang, J. Contamination Features and Health Risk of Soil Heavy Metals in China. Sci. Total Environ. 2015, 512–513, 143–153. [Google Scholar] [CrossRef]
- Wu, H.; Sun, B.; Li, J. Polycyclic Aromatic Hydrocarbons in Sediments/Soils of the Rapidly Urbanized Lower Reaches of the River Chaohu, China. Int. J. Environ. Res. Public Health 2019, 16, 2302. [Google Scholar] [CrossRef] [PubMed]
- Patel, A.B.; Shaikh, S.; Jain, K.R.; Desai, C.; Madamwar, D. Polycyclic Aromatic Hydrocarbons: Sources, Toxicity, and Remediation Approaches. Front. Microbiol. 2020, 11, 562813. [Google Scholar] [CrossRef] [PubMed]
- Cachada, A.; Ferreira da Silva, E.; Duarte, A.C.; Pereira, R. Risk assessment of urban soils contamination: The particular case of polycyclic aromatic hydrocarbons. Sci. Total Environ. 2016, 551–552, 271–284. [Google Scholar] [CrossRef]
- Asante-Duah, K. Public Health Risk Assessment for Human Exposure to Chemicals, 2nd ed.; Springer: Dordrecht, The Netherlands, 2017; 600p. [Google Scholar] [CrossRef]
- Ciarkowska, K.; Gambus, F.; Antonkiewicz, J.; Koliopoulos, T. Polycyclic aromatic hydrocarbon and heavy metal contents in the urban soils in southern Poland. Chemosphere 2019, 229, 214–226. [Google Scholar] [CrossRef] [PubMed]
- Peng, C.; Wang, M.; Chen, W. Spatial Analysis of PAHs in Soils along an Urban–Suburban–Rural Gradient: Scale effect, distribution patterns, diffusion and influencing factors. Sci. Rep. 2016, 6, 37185. [Google Scholar] [CrossRef]
- Qiao, P.; Dong, N.; Yang, S.; Gou, Y. Quantitative analysis of the main sources of pollutants in the soils around key areas based on the positive matrix factorization method. Environ. Pollut. 2021, 273, 116518. [Google Scholar] [CrossRef] [PubMed]
- Bandowe, B.; Shukurov, N.; Kersten, M.; Wilcke, W. Polycyclic aromatic hydrocarbons (PAHs) and their oxygen-containing derivatives (OPAHs) in soils from the Angren industrial area, Uzbekistan. Environ. Pollut. 2010, 158, 2888–2899. [Google Scholar] [CrossRef]
- Bandowe, B.A.M.; Shukurov, N.; Leimer, S.; Kersten, M.; Steinberger, Y.; Wilcke, W. Polycyclic aromatic hydrocarbons (PAHs) in soils of an industrial area in semi-arid Uzbekistan: Spatial distribution, relationship with trace metals and risk assessment. Environ. Geochem. Health 2021, 43, 4847–4861. [Google Scholar] [CrossRef]
- Peng, C.; Ouyang, Z.; Wang, M.; Chen, W.; Li, X.; Crittenden, J.C. Assessing the combined risks of PAHs and metals in urban soils by urbanization indicators. Environ. Pollut. 2013, 178, 426–432. [Google Scholar] [CrossRef]
- Mandigo, A.C.; DiScenza, D.J.; Keimowitz, A.R.; Fitzgerald, N. Chemical contamination of soils in the New York City area following Hurricane Sandy. Environ. Geochem. Health 2016, 38, 1115–1124. [Google Scholar] [CrossRef]
- Reis, A.P.; Shepherd, T.; Nowell, G.; Cachada, A.; Duarte, A.C.; Cave, M.; Wragg, J.; Patinha, C.; Dias, A.; Rocha, F.; et al. Source and pathway analysis of lead and polycyclic aromatic hydrocarbons in Lisbon urban soils. Sci. Total Environ. 2016, 573, 324–336. [Google Scholar] [CrossRef] [PubMed]
- Sapcanin, A.; Cakal, M.; Jacimovic, Z.; Pehlic, E.; Jancan, G. Soil pollution fingerprints of children playgrounds in Sarajevo city, Bosnia and Herzegovina. Environ. Sci. Pollut. Res. 2017, 24, 10949–10954. [Google Scholar] [CrossRef] [PubMed]
- Bourotte, C.L.M.; Sugauara, L.E.; De Marchi, M.R.R.; Souto-Oliveira, C.E. Trace metals and PAHs in topsoils of the university campus in the megacity of São Paulo, Brazil. An. Acad. Bras. Cienc. 2019, 91, 1–23. [Google Scholar] [CrossRef] [PubMed]
- Wu, S.; Zhou, B.H.; Chen, D.; Wang, C.; Li, B.; Tong, G.; Yuan, Y.; Xu, B. Improving risk management by using the spatial interaction relationship of heavy metals and PAHs in urban soil. J. Hazard. Mater. 2019, 364, 108–116. [Google Scholar] [CrossRef] [PubMed]
- Fazeli, G.; Karbassi, A.; Khoramnejadian, S.; Nasrabadi, T. Evaluation of Urban Soil Pollution: A Combined Approach of Toxic Metals and Polycyclic Aromatic Hydrocarbons (PAHs). Int. J. Environ. Res. 2019, 13, 801–811. [Google Scholar] [CrossRef]
- Islam, M.S.; Ahmed, M.K.; Al-Mamun, M.H.; Eaton, D.W. Human and ecological risks of metals in soils under different land-use types in an urban environment of Bangladesh. Pedosphere 2020, 30, 201–213. [Google Scholar] [CrossRef]
- Wang, C.H.; Wang, J.X.; Zhou, S.L.; Tang, J.H.; Jia, Z.Y.; Ge, L.; Li, Y.; Wu, S.H. Polycyclic aromatic hydrocarbons and heavy metals in urban environments: Concentrations and joint risks in surface soils with diverse land uses. Land. Degrad. Dev. 2020, 31, 383–391. [Google Scholar] [CrossRef]
- Sun, L.; Liao, X.; Yan, X.; Zhu, G.; Ma, D. Evaluation of heavy metal and polycyclic aromatic hydrocarbons accumulation in plants from typical industrial sites: Potential candidate in phytoremediation for co-contamination. Environ. Sci. Pollut. Res. 2014, 21, 12494–12504. [Google Scholar] [CrossRef]
- Wang, C.; Yang, Z.; Zhang, Y.; Zhang, Z.; Cai, Z. PAHs and heavy metals in the surrounding soil of a cement plant Co-Processing hazardous waste. Chemosphere 2018, 210, 247–256. [Google Scholar] [CrossRef]
- Milenkovic, B.; Stajic, J.M.; Zeremski, T.; Strbac, S.; Stojic, N.; Nikezic, D. Is Kragujevac city still a “hot spot” area, twenty years after the bombing? Chemosphere 2020, 245, 125610. [Google Scholar] [CrossRef]
- Lu, Y.; Zhang, Y.; Xiang, X.; Zhang, S.; Yao, H. Combined pollution of heavy metals and polycyclic aromatic hydrocarbons in the soil in Shenfu Region, China: A case of three different cities. Environ. Monit. Assess. 2023, 195, 167. [Google Scholar] [CrossRef] [PubMed]
- Dymov, A.A.; Kaverin, D.A.; Gabov, D.N. Properties of soils and soil-like bodies in the Vorkuta area. Eur. Soil Sci. 2013, 46, 217–224. [Google Scholar] [CrossRef]
- Kasimov, N.S.; Vlasov, D.V.; Kosheleva, N.E.; Nikiforova, E.M. Landscape Geochemistry of Eastern Moscow; APR: Moscow, Russia, 2016; 276p. (In Russian) [Google Scholar]
- Kasimov, N.S.; Bezberdaya, L.A.; Vlasov, D.V.; Lychagin, M.Y. Metals, Metalloids, and Benzo[a]pyrene in PM10 Particles of Soils and Road Dust of Alushta City. Eur. Soil Sci. 2019, 52, 1608–1621. [Google Scholar] [CrossRef]
- Polyakov, V.; Kozlov, A.; Suleymanov, A.; Abakumov, E. Soil pollution status of urban soils in St. Petersburg city, North-west of Russia. Soil Water Res. 2021, 16, 164–173. [Google Scholar] [CrossRef]
- Bezberdaya, L.; Kosheleva, N.; Chernitsova, O.; Lychagin, M.; Kasimov, N. Pollution Level, Partition and Spatial Distribution of Benzo(a)pyrene in Urban Soils, Road Dust and Their PM10 Fraction of Health-Resorts (Alushta, Yalta) and Industrial (Sebastopol) Cities of Crimea. Water 2022, 14, 561. [Google Scholar] [CrossRef]
- SanPiN 1.2.3685–21; Hygienic Standards and Requirements for Ensuring the Safety and (or) Harmlessness of Environmental Factors for Humans. 2021. Available online: https://docs.cntd.ru/document/573500115 (accessed on 12 March 2023). (In Russian)
- Konstantinova, E.; Minkina, T.; Sushkova, S.; Konstantinov, A.; Rajput, V.D.; Sherstnev, A. Urban soil geochemistry of an intensively developing Siberian city: A case study of Tyumen, Russia. J. Environ. Manag. 2019, 239, 366–375. [Google Scholar] [CrossRef] [PubMed]
- Konstantinova, E.; Minkina, T.; Sushkova, S.; Antonenko, E.; Konstantinov, A. Levels, sources, and toxicity assessment of polycyclic aromatic hydrocarbons in urban topsoils of an intensively developing Western Siberian city. Environ. Geochem. Health 2020, 42, 325–341. [Google Scholar] [CrossRef]
- Federal State Statistics Service (Rosstat). Database of Indicators of Municipalities. Tyumen Oblast. Available online: https://gks.ru/dbscripts/munst/munst71/DBInet.cgi (accessed on 12 April 2023). (In Russian).
- Climate Data. Tyumen Climate (Russian Federation). Available online: https://en.climate-data.org/asia/russian-federation/tyumen-oblast/tyumen-478/#climate-graph (accessed on 12 April 2023).
- Konstantinova, E.; Novoselov, A.; Konstantinov, A.; Minkina, T.; Sushkova, S.; Loiko, S. Evaluating the effect of historical development on urban soils using microartifacts and geochemical indices. Environ. Geochem. Health 2023, 45, 121–136. [Google Scholar] [CrossRef]
- Master Plan of the Tyumen City. Available online: https://www.tyumen-city.ru/vlast/administration/struktura-administracii-goroda-tumeni/departaments/dzr/napravlenie-deitelynosti/departamentgradostroitelynoipolitiki/genplan/generalynii-plan-v-redakcii-2008-goda/ (accessed on 10 April 2023). (In Russian).
- Vorobyova, L.A. Theory and Practice of Chemical Analysis of Soils; GEOS: Moscow, Russia, 2006; 400p. (In Russian) [Google Scholar]
- Kachinskiy, N.A. Die mechanische Bodenanalyse und die Klassifikation der Boden nach ihrer mechanischen Zusammansetzung. In Rapports au Sixieme Congres de la Science du Sol. Part B; Laboureur & Cie: Paris, France, 1956; pp. 321–327. [Google Scholar]
- Konstantinov, A.; Konstantinova, E.; Smirnov, P.; Minkina, T.; Batalin, G.; Gareev, B.; Mingazov, G.; Loiko, S. Assessment of soil development during rapid urbanization using the carbon and nitrogen stable isotope composition. Environ. Geochem. Health 2023, 1–12. [Google Scholar] [CrossRef]
- PND F 16.1.42-04; Method of Measuring the Mass Fraction of Metals and Metal Oxides in Powder Soil Samples by the X-ray Fluorescence Analysis. NPO Spectron: St. Petersburg, Russia, 2016; 50p. (In Russian)
- Sushkova, S.N.; Minkina, T.; Deryabkina, I.; Mandzhieva, S.; Zamulina, I.; Bauer, T.; Vasilyeva, G.; Antonenko, E.; Rajput, V. Influence of PAH contamination on soil ecological status. J. Soil Sediments 2018, 18, 2368–2378. [Google Scholar] [CrossRef]
- ISO 13859:2014; Soil Quality: Determination of Polycyclic Aromatic Hydrocarbons (PAH) by Gas Chromatography (GC) and High-Performance Liquid Chromatography (HPLC). ISO/TC 190, Soil Quality; International Organization for Standardization: Geneva, Switzerland, 2014; 24p.
- Volk, S.; Gratzfeld-Huesgen, A. Agilent Application Solution: Analysis of PAHs in Soil According to EPA 8310 Method with UV and Fluorescence Detection; Agilent Technologies Inc.: Santa Clara, CA, USA, 2011. [Google Scholar]
- Reimann, C.; Garret, R.G. Geochemical background: Concept and reality. Sci. Total Environ. 2005, 350, 12–27. [Google Scholar] [CrossRef] [PubMed]
- Reimann, C.; Garrett, R.G.; Filzmoser, P. Background and threshold–critical comparison of methods of determination. Sci. Total Environ. 2005, 346, 1–16. [Google Scholar] [CrossRef]
- Reimann, C.; de Caritat, P. Establishing geochemical background variation and threshold values for 59 elements in Australian surface soil. Sci. Total Environ. 2017, 578, 633–648. [Google Scholar] [CrossRef] [PubMed]
- Kowalska, J.B.; Mazurek, R.; Gasiorek, M.; Zaleski, T. Pollution indices as useful tools for the comprehensive evaluation of the degree of soil contamination—A review. Environ. Geochem. Health 2018, 40, 2395–2420. [Google Scholar] [CrossRef] [PubMed]
- Konstantinova, E.; Minkina, T.; Mandzhieva, S.; Nevidomskaya, D.; Bauer, T.; Zamulina, I.; Sushkova, S.; Lychagin, M.; Rajput, V.D.; Wong, M.H. Ecological and Human Health Risks of Metal–PAH Combined Pollution in Riverine and Coastal Soils of Southern Russia. Water 2023, 15, 234. [Google Scholar] [CrossRef]
- Bezberdaya, L.A.; Kasimov, N.S.; Chernitsova, O.V.; Tkachenko, A.N.; Lychagin, M.Y. Heavy Metals and Metalloids in Soils, Road Dust, and Their PM10 Fractions in Sebastopol: Levels, Sources, and Pollution Risk. Eur. Soil Sci. 2022, 55, 1871–1890. [Google Scholar] [CrossRef]
- Novikov, S.G. Assessment of heavy metal contamination in soils of different land use type in Petrozavodsk. Proc. Karelian Res. Cent. Russ. Acad. Sci. 2015, 1, 78–85. [Google Scholar] [CrossRef]
- Bogdanov, N.A. Analysis of the in formative value of integral indicators of chemical soil contamination in the evaluation of the status of areas. Gig. Sanit. 2012, 91, 10–13. (In Russian) [Google Scholar]
- Lemly, A.D. Evaluation of the hazard quotient method for risk assessment of selenium. Ecotoxicol. Environ. Saf. 1996, 35, 156–162. [Google Scholar] [CrossRef]
- U.S. Environmental Protection Agency (EPA). Risk Assessment Guidance for Superfund. Volume I: Human Health Evaluation Manual (Part A); Interim Final (EPA/540/1-89/002); Office of Emergency and Remedial Response: Washington, DC, USA, 1989.
- Guney, M.; Zagury, G.J.; Dogan, N.; Onay, T.T. Exposure assessment and risk characterization from trace elements following soil ingestion by children exposed to playgrounds, parks and picnic areas. J. Hazard. Mater. 2010, 182, 656–664. [Google Scholar] [CrossRef]
- Vu Duc, T.; Thi Lan, C.D.; Ngo Tra, M. Residue of selected persistent organic pollutants (POPs) in soil of some areas in Vietnam. In Biochemical Toxicology—Heavy Metals and Nanomaterials; Ince, M., Ince, O.K., Ondrasek, G., Eds.; IntechOpen: London, UK, 2020; pp. 1–14. [Google Scholar] [CrossRef]
- Kovalsky, V.V.; Andrianova, G.A. Trace Elements in the Soils of the USSR; Publishing House “Nauka”: Moscow, Russia, 1970; 180p. (In Russian) [Google Scholar]
- Canadian Council of Ministers of the Environment (CCME). Soil Quality Guidelines for the Protection of Environmental and Human Health. Available online: https://ccme.ca/en/current-activities/canadian-environmental-quality-guidelines (accessed on 27 March 2023).
- U.S. Environmental Protection Agency (EPA). Exposure Factors Handbook: 2011 Edition; EPA/600/R-090/052F; National Center for Environmental Assessment: Washington, DC, USA, 2011.
- U.S. Environmental Protection Agency (EPA). Human Health Evaluation Manual, Supplemental Guidance: Update to Standard Default Exposure Factors; OSWER 9200.1-120; National Center for Environmental Assessment: Washington, DC, USA, 2014.
- U.S. Environmental Protection Agency (EPA). Supplemental Guidance for Developing Soil Screening Levels for Superfund Sites; OSWER 9355.4-24; Office of Emergency and Remedial Response: Washington, DC, USA, 2002.
- Kabata-Pendias, A. Trace Elements in Soils and Plants, 4th ed.; CRC Press: Boca Raton, FL, USA, 2011; 505p. [Google Scholar] [CrossRef]
- Wilcke, W. SYNOPSIS Polycyclic Aromatic Hydrocarbons (PAHs) in Soil—A Review. J. Plant Nutr. Soil. Sci. 2000, 163, 229–248. [Google Scholar] [CrossRef]
- Office of Environmental Health Hazard Assessment (OEHHA). Air Toxics Hot Spots Program Risk Assessment Guidelines. In Technical Support Document for Exposure Assessment and Stochastic Analysis; Office of Environmental Health Hazard Assessment California Environmental Protection Agency: Oakland, CA, USA, 2012. [Google Scholar]
- U.S. Environmental Protection Agency (EPA). Update for Chapter 5 of the Exposure Factors Handbook. Soil and Dust Ingestion; EPA/600/R-17/384F; National Center for Environmental Assessment: Washington, DC, USA, 2017.
- U.S. Environmental Protection Agency (EPA). Health Effects Assessment Summary Tables. FY 1997 Update; EPA 540/R-97-036; Office of Research and Development: Washington, DC, USA, 1997.
- Agency for Toxic Substances and Disease Registry (ATSDR). Minimal Risk Levels (MRLs) List. January 2023. Available online: https://www.atsdr.cdc.gov/mrls/pdfs/ATSDR%20MRLs%20-%20January%202023%20-%20H.pdf (accessed on 25 February 2023).
- U.S. Environmental Protection Agency (EPA). Integrated Risk Information System (IRIS). Available online: https://cfpub.epa.gov/ncea/iris_drafts/AtoZ.cfm (accessed on 10 February 2023).
- Environmental Protection Agency (EPA). Provisional Peer-Reviewed Toxicity Values (PPRTVs). Available online: https://www.epa.gov/pprtv/provisional-peer-reviewed-toxicity-values-pprtvs-assessments (accessed on 8 February 2023).
- California Office of Environmental Health Hazard Assessment (OEHHA). Chemical Database. Available online: https://oehha.ca.gov/chemicals (accessed on 12 February 2023).
- Baars, A.J.; Theelen, R.M.C.; Janssen, P.J.C.M.; Hesse, J.M.; van Apeldoorn, M.E.; Meijerink, M.C.M.; Verdam, L.; Zeilmaker, M.J. Re-Evaluation of Human-Toxicological Maximum Permissible Risk Levels; RIVM Report 711701 025; Rijksinstituut voor Volksgezondheid en Milieu: Bilthoven, The Netherlands, 2001; 297p.
- U.S. Environmental Protection Agency (EPA). Regional Screening Level (RSL) Summary Table (TR = 1E−06, HQ = 1) May 2022. Available online: https://semspub.epa.gov/work/HQ/402369.pdf (accessed on 20 June 2022).
- U.S. Environmental Protection Agency (EPA). Risk Assessment Guidance for Superfund Volume I: Human Health Evaluation Manual (Part E, Supplemental Guidance for Dermal Risk Assessment); Final (EPA/540/R/99/005, OSWER 9285.7-02EP); Office of Superfund Remediation and Technology Innovation: Washington, DC, USA, 2004.


Disclaimer/Publisher’s Note: The statements, opinions and data contained in all publications are solely those of the individual author(s) and contributor(s) and not of MDPI and/or the editor(s). MDPI and/or the editor(s) disclaim responsibility for any injury to people or property resulting from any ideas, methods, instructions or products referred to in the content. |
© 2023 by the authors. Licensee MDPI, Basel, Switzerland. This article is an open access article distributed under the terms and conditions of the Creative Commons Attribution (CC BY) license (https://creativecommons.org/licenses/by/4.0/).