Abstract
Wastewater treatment plants represent relevant point sources of environmental-adverse pharmaceuticals in river systems. Extensive monitoring and substance-routing models are crucial for environmental risk assessment and river planning. However, most current models assume long-term and large spatial averaged values of pharmaceutical consumption and river discharge flows. This study describes a detailed tracking of pharmaceutical occurrence across river networks with high spatiotemporal resolution to assist better environmental risk assessments. Using high spatiotemporal prescription data of four (pseudo-) persistent pharmaceuticals and river discharge characterization, an adjusted graph-theory-based model was implemented to efficiently evaluate the impact of the effluents of 626 wastewater treatment plants across nine river networks located in Saxony, Germany. Multisite calibration results demonstrated the model capability to satisfactorily predict daily pharmaceutical loads and concentrations with high spatial discretization. Based on minimal river dilution and mean predicted concentrations, the risk exposure revealed carbamazepine and ciprofloxacin as the most critical pharmaceuticals and Vereinigte Mulde as the most risk-exposed river network with up to 34.0% and 23.7% of its river length exceeding half and the total of ecotoxicological criteria, respectively. In comparison, other river networks showed less than 23.5% and 15.0% of their river lengths exceeding half and the total of ecotoxicological criteria of all four selected pharmaceuticals, respectively.
1. Introduction
The release of anthropogenic pollutants into the environment through wastewater systems is generally considered one of the major menaces impairing the aquatic environment significantly [1,2]. In particular, the presence of wastewater-derived micropollutants such as pharmaceuticals (PhC) has gained high levels of public and scientific awareness in the last years due to their detrimental impact on aquatic systems at very low concentrations (ranges of µg L−1 and ng L−1) [3]. Additionally, PhC also belong to the new generation of contaminants of emerging concern because of their widespread human consumption; some of them exhibit persistent bioaccumulation and toxicity characteristics [4]. Nevertheless, there are still partial or no applicable regulatory standards from multiple environmental agencies worldwide (e.g., European Water Framework Directive, US Environmental Protection Agency) concerning maximum limits of all these emerging contaminants and their control in the environment, as described in detail in [5].
Regarding human PhC consumption, around 3000 PhC are available in the European Union Market [6]. This number is expected to increase as long as the elderly population grows [7] and the pharmaceuticalization trend in society establishes an evident phenomenon [8]. Furthermore, PhC consumption can also vary at different locations based on the existing epidemiological situation, socioeconomic conditions, and seasonal climate variation [5,9,10]. However, once PhC are ingested, they are metabolized by the human body to some degree and then excreted as unaltered parent compounds or metabolites. These later can still be active for further physical, biological, and chemical transformation processes in both wastewater systems and receiving waters [10].
It is well-known that effluents of wastewater treatment plants (WWTP) are the main entry points of PhC into the aquatic environment [11]. However, WWTP are mainly designed with conventional physical, chemical, and biological processes to remove especially biodegradable carbon and different nutrient forms, which arrive at WWTP influents in concentrations order of mg L−1. Hence, the removal efficiency of PhC is often limited and could vary according to substance type and available treatment configuration [10,11,12]. Although the remaining fraction of PhC released into the aquatic environment could have very low concentrations, new advanced analytical techniques enabled their detection and demonstrated simultaneously their adverse effects on numerous organisms in the aquatic environment [13]. Some examples include: daphnia, algae, and cyanobacteria can be affected by the acute toxic effects of antimicrobials oxytetracycline and trimethoprim [14], the growth of green algae and cyanobacteria can also be inhibited by ciprofloxacin [15], fishes can have functional complications in their kidney and gill due to diclofenac and triclosan [16,17], sexual development disruptions due to estrogens [18], or oxidative stress due to carbamazepine [5]. Furthermore, human health can be highly vulnerable to antibiotic resistance promoted by long-term exposure of bacteria to low doses of antibiotics in aquatic environments [19].
As a response to the concerns mentioned above, the European Water Framework Directive (WFD) established watch lists of priority substances and defined environmental quality standards (EQS) [20,21] with the primary objective of achieving good ecological and chemical status in all surface water bodies [22,23]. The EQS are mainly represented by threshold concentrations (PNEC|EQS) of listed substances, including PhC, which might pose a potential ecological risk. PNEC is the predicted no-effect concentration based on toxicity data and refers to the maximum concentration at which no adverse effects on (aquatic) ecosystems are expected [24]. In this context, the spatial exposure of PhC concentrations in aquatic environments is one of the main prerequisites for environmental risk assessment (ERA) as well as for the definition and implementation of mitigation measures [25]. However, consistent monitoring programs of measured environmental concentrations (MEC) of contaminants of emergency concern require Sisyphean effort by governments and environmental agencies, and it can turn out to be intractable, especially at large catchment scales [26]. At this point, substance-routing models can be employed for river networks to understand the behavior of waterborne substances and track their spatiotemporal dynamics, especially when MEC data is scarce [27]. The predicted environmental concentrations (PEC) derived from modeling approaches can serve to fill the spatiotemporal gaps of monitoring programs and support to conduct ERA by screening of exposure risks with the comparison of PEC with the ecotoxicological thresholds PNEC|EQS [28,29,30].
For ERA of wastewater-derived PhC across river networks, two model categories emerge: multi-media and single-media models [2]. Multi-media models, such as EUSES [31], aim to determine broad risk assessments by simulating pollutant sources and fates among different environmental compartments (air, water, soil), but they tend to fail to determine local or site-specific PEC [2,32]. On the other hand, single-media models can enable obtaining georeferenced propagation of PEC across river systems to identify spatial risk exposure. Well-known in-stream single-media models such as GREAT-ER [33], GIS-ROUT [34], PhaTE [35], GWAVA [36], iSTREEM [29], and HEC-RAS-NSM-I [37] consider, at different complexity levels, in-stream attenuation processes for water quality modeling. Nonetheless, initial model setups can demand extensive site-specific data and experienced model practitioners [37,38,39]. Moreover, the flexibility for effective and fast model customization of tailored scenario analysis at different catchment scales can still be limited [37,40]. Given these circumstances, parsimonious single-media models were developed using the graph theory approach [41,42]. Their prediction performance was found to be similar to in-stream models and also suitable for ERA purposes. Renowned graph-theory-based applications include the routing of persistent PhC loads across Swiss river networks [39,43], steady sediment–nutrient fluxes across delta channel networks in the United States [44] and the routing of microplastic across German river networks [45].
In the case of PhC routing across river networks, most of the current single-media models of both types (in-stream and graph-theory-based) share common assumptions and transformation mechanisms for estimating PhC loads at WWTP effluents into the river system. For instance, average PhC consumption per capita is often calculated using yearly prescriptions or sales quantities retrieved from national or continental databases. Subsequently, consumed PhC loads are usually adjusted due to human metabolism/excretion and WWTP removal efficiency according to fixed literature values [36,39,43,46]. Furthermore, the hydrological river characterization is conveniently parametrized with defined dilution factors or with long-term representative values such as mean annual flow (MQ) or mean annual low-flow (MLQ) [30,36,39,40,43,46]. However, the even distribution and consumption of PhC over space and time along with long-term average flow conditions may not be suitable to illustrate the spatiotemporal variability of PEC across regional river networks since population densities and river hydrodynamic conditions can change significantly at small spatiotemporal scales.
Consequently, the present study aims to improve the tracking of PhC occurrence across river networks by obtaining PEC with a high spatiotemporal resolution for detailed exposure-risk screening concerning ERA. For this purpose, an adjusted graph-theory-based model was applied for substance-flow routing of four PhC across river networks located in eastern Germany. By using weekly/monthly prescription quantities distributed over postal-code areas, accurate information about the connection degree of the population to WWTP and the consistent river discharge characterization obtained through spatial autocorrelations methods, the proposed graph-theory-based model can provide daily PEC of the selected PhC at 1 km river spatial resolution. Additionally, it considers conservatively the degree of compliance of patients to follow prescribed medication and the improper disposal of non-consumed PhC. The applicability of the proposed model is based on multisite calibrations of PhC loads across different river networks and uncertainty assessment of the model fitting parameters. With 626 WWTP, 233 flow gauges, and 857 water quality monitoring stations (WQMST) for model setup, this is the most extensive regional study of PhC emission and transport known to the authors.
2. Materials and Methods
2.1. Study Area
With an approximate total area of 18,450 km2 and a population of 4.06 million inhabitants (in 2014) [47], the German Free State of Saxony (Saxony) is divided into nine large river catchments: Elbe, Freiberger Mulde, Zwickauer Mulde, Vereinigte Mulde, Lower Weiße Elster, Upper Weiße Elster, Schwarze Elster, Spree, and Lausitzer Neiße. They cover around 98% of the total area. The overall land use is dominated by cultivated land (39%), followed by forests (27%), grasslands (16%), urban settlements (12%), water bodies (2%), and other land uses (4%) [48]. The headwater sources of the main rivers are mostly located in the Czech Republic and enter the German border from the southeast side. From there, the flow direction of their river networks is predominantly northwest across Saxony with an approximate total river length of 29,400 km [49].
Although the purpose is to investigate all identified rivers and streams, the effort to include many tiny streams in the monitoring, modeling, and assessment according to environmental objectives can be enormous. Consequently, the WFD provided the criteria to delineate rivers based on a minimal catchment area (>5 km2 for this study) to have simplified river networks and keep track of their current and/or projected status [50]. Furthermore, Saxony maintains a particularly dense water quality monitoring network suited for this analysis [51]. This study focused on river networks following the main rivers, which implied having one main river outlet per catchment leaving the Saxony border. Since some tributaries of Schwarze Elster disembogue into their main river outside the border, they will not be considered. Hence, applying these criteria, the total length of all simplified river networks accounts for 11,720 km (~40% of total river length), which covers a reduced area of 16,820 km2 (~91% of total area) populated with around 3.88 million inhabitants (~96% of the total population). The nine catchment areas and river networks within the final delimitation are illustrated in Figure 1, and a detailed catchment-specific description of their main characteristics is summarized in Table S1.
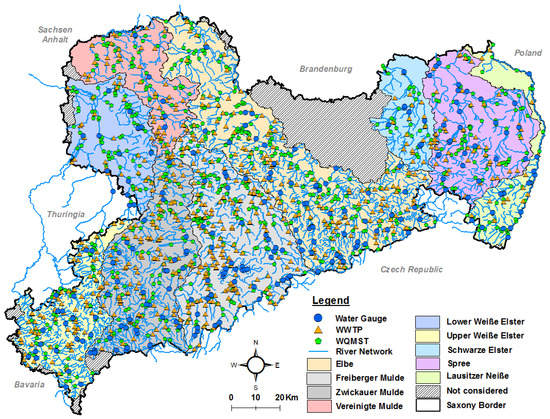
Figure 1.
Delimitation of the study area within the borders of the German Free State of Saxony with the location of flow gauges, wastewater treatment plants (WWTP), and water quality monitoring stations (WQMST) where measured environmental concentrations (MEC) of selected pharmaceuticals (PhC) are available. Flow direction is mainly from south to north or northwest.
2.2. Selected Pharmaceuticals (PhC)
From a list of 156 priority substances given by EU Directives 2008/105/EC [20], 2013/39/EU [21], and International Commission for Protection of Elbe River (IKSE) [52], 59 substances were identified as target compounds in Saxon rivers based on their environmental toxicity relevance, high input loads from WWTP, and data availability with high spatiotemporal resolution in order to account regional characteristics and seasonal trends [53]. The latter aspect was evidenced for PhC once spatiotemporal prescription quantities, hospital dispensation quantities, and dissolved MEC were obtained. In this context, two antiepileptics—carbamazepine (CBZ) and gabapentin (GBP)—along with two antibiotics—sulfamethoxazole (SFX) and ciprofloxacin (CIP)—with moderate/high solubility were selected for modeling purposes and ERA in this study. A detailed description of their physicochemical properties is summarized in Table S2 [5,53,54,55,56,57,58,59,60,61,62,63,64,65,66,67,68,69,70,71,72,73,74,75,76,77,78,79,80,81,82]. Except for CIP, the other PhC exhibit persistent characteristics in aqueous systems with poor biodegradability (first-order decay, kbio <0.1 d−1), high hydrophilicity (n-octanol-water partition coefficient, log Kow < 2.5), and low adsorption potential on sediments (soil adsorption coefficient, log Kd < 2.7) [83,84]. CIP can still be rated as pseudo-persistent by assuming continuous release to the environment from WWTP, as discussed in general for PhC in [5]. Consequently, the selected PhC were conservatively considered suitable for modeling purposes and ERA within the delimited study area.
2.3. Data Collection and Preparation
Georeferenced locations and general technical information of demographic, hydrologic, and environmental data for the time period 2008–2014 were retrieved from official databases. For modeling and calibration purposes, the collected data were subdivided and rearranged into time periods according to the available MEC of each selected PhC, which led to specific time periods of 2008–2014 for CBZ, 2010–2014 for GBP and SFX, and 2011–2014 for CIP. The sources of all collected data are summarized in Table S3 [49,56,85,86,87,88]. Within the delimited study area, they included a digital elevation model with a 25 m grid size, geometries of simplified river networks, daily flow (Q) values at 233 flow gauges, statistically regionalized MLQ values at outlet points of 3620 sub-catchments, grab-sampled MEC of the selected PhC with irregular time intervals at 857 WQMST, and connection degree of 626 WWTP for each Saxon municipality [87,88]. From the latter, it was revealed that around 25,100 hospital beds and 3.37 million inhabitants were served by WWTP in 2014 (~87% of the connection rate). Additionally, the geometries of simplified river networks were discretized using ArcGIS by generating points with a 1 km span along all river lengths to obtain finer spatial resolution towards graph-based modeling and ERA.
AOK Plus (Dresden, Germany), the biggest health insurance in Saxony, provided weekly prescription databases for the selected PhC in the time periods mentioned above. Temporal trends and patterns described in [53] evidenced that prescriptions of CBZ and GBP were not subject to significant seasonal fluctuation since antiepileptics are usually established with weekly dosage regimens. Surprisingly, the antibiotics SFX and CIP showed similar trends with even fluctuation over the years, although they are usually administered for shorter periods. Subsequently, the prescription quantities and the number of insured persons were spatially aggregated by postal code areas. The mean annual specific prescription per capita for the selected PhC can be found in Figure S1a–d. Compared to the total population living in each postal code area, the proportion of the population insured with AOK Plus revealed a considerable variation between 37% and 95% Figure S1e. Total prescribed quantities, including the population insured with other health insurance companies, were back-estimated from the prescription quantities of AOK Plus insured population and their proportion within the total population of each postal code. Additionally, dispensed quantities of the selected PhC from eight hospitals at different locations (Dresden, Chemnitz, and Plauen) were obtained. It was possible to determine linear relationships between the monthly dispensation and the number of hospital beds (Figure S2) to estimate dispensed quantities of the selected PhC for the rest of the hospitals within the delimited study area.
2.3.1. River Discharge Interpolation
Determination of daily PEC from loads of the selected PhC along the flow path required an adequate spatiotemporal characterization of discharge. For this purpose, daily Q and MLQ values for the time period 2008–2014 were interpolated. A combination of the ArcGIS toolset STARS (Spatial Tools for the Analysis of River Systems) [89] and the R-package SSN (Spatial Stream Network) [90] provided estimated Q and MLQ values at non-measured sites (WQMST, WWTP, and 1 km points). Using the digital elevation raster and vector data of river networks with connected sites, STARS calculated topological relationships, and spatial information (e.g., hydrologic distances, flow directions, contributing areas for each interpolated point location). Afterward, STARS stored all calculated information in databases within a generated SSN object to be efficiently accessed with the R-package SSN. With this latter, multiple combinations of spatial autocorrelation models were fitted using moving average functions by following the flow path only downstream (tail-down models), only upstream (tail-up models), and by applying Euclidean distance. The best model combination (Epanech.tailup and LinearSill.taildown) was identified based on internal calculations of fitting performance such as Akaike Information Criterion (AIC) and root mean square prediction error (RMSPE) values, where the lowest values mean best fit [90]. Then, predicted discharge data were exported for further application.
Using the best spatial autocorrelation model combination, mean percent bias (PBIAS) values between measured and predicted discharge data (MQ and MLQ) were additionally calculated at location sites of flow gauges and sub-catchment outlets (Figure S3). High mean PBIAS was mainly evidenced at upstream small tributary rivers in Elbe and Freiberger Mulde river catchments (Ore Mountain region near the border with Czech Republic) and at mining-influenced rivers located in Spree catchment. A total number of 215 (~92%) flow gauges and 3051 (~84%) of sub-catchment outlets showed a mean PBIAS < ±70% for MQ and MLQ values, respectively. These PBIAS ranges were in accordance with uncertainty estimates of modeled discharge data obtained from some regional hydrological models in Saxony reported in [91] and for Swiss rivers in [39].
2.3.2. Daily PhC Input Loads at WWTP
Main entry of PhC into river networks is through WWTP connected to population and hospital beds. Since the collected data of PhC prescription and hospital dispensation quantities is spatiotemporal enriched, a proportional daily assignation of input loads for each selected PhC to each WWTP for the corresponding time periods (2008–2014 for CBZ, 2010–2014 for GBP and SFX, and 2011–2014 for CIP) was possible to obtain by using Equation (1).
where: = daily input load of PhC i to each WWTP j, = weekly prescription quantity from AOK Plus of PhC i spatially resolved by postal code pc, = resident population by postal code, resident population connected to WWTP j, = fraction of resident population insured with AOK Plus (the inverse is used for extrapolation), = monthly dispensed quantity per hospital bed for PhC i (based on relationships shown in Figure S1), = number of hospital beds connected to WWTP j.
2.3.3. Daily PhC Input Loads at Upstream WQMST
From the MEC dataset of the official WQMST network [56], non-negligible MEC levels of the selected PhC occurred at river sections located upstream from WWTP sites. In our delimited study area, these additional PhC input loads are significant for transboundary rivers (e.g., Elbe River at the inflow from Czech Republic). Furthermore, the occurrence of micropollutants from unknown upstream sources can be relevant to the overall load balance in river catchments. Consequently, the substance-routing model was extended with source points at the most upstream WQMST, where MEC of the selected PhC were detected. At these WQMST points, median annual MEC values were calculated and converted into PhC loads using interpolated discharges described in Section 2.3.1.
2.4. Graph-Theory-Based Model Setup
The information layers of flow gauges, WWTP and WQMST point sites along river flow paths were assembled in topology matrices for each of the nine Saxon River networks according to Equation (2). At each corresponding point site, cumulative loads of the selected PhC from all upstream WWTP and boundary WQMST (if available) connected can be calculated by column-wise summing their contributions.
where: = topology matrix, = identity matrix, = adjacency matrix.
The cumulative calculation of effective daily loads of selected PhC also requires reflecting the transformation processes that unfold from human consumption to WWTP effluents. Consequently, typical substance-specific ranges related to human excretion, human compliance, and conventional WWTP removal for each selected PhC were extracted from the literature (Table S2). The term human compliance refers to the fraction of prescribed PhC that the patient indeed consumes, while the non-compliance fraction of prescribed PhC was conservatively assumed to be improperly disposed to the wastewater system. Then, cumulative effective loads of the selected PhC at the corresponding point sites across each river network were calculated according to Equation (3).
where: = effective cumulative daily load of PhC i at site k, = sum of upstream boundary PhC loads connected to site k, = daily input load of PhC i to each upstream WWTP j connected to site k, = variability factor of PhC i, = human excretion rate of PhC i, = WWTP removal rate of PhC i, = human compliance rate of PhC i, = topology matrix of corresponding river network.
The variability factor was implemented to cover the introduced variability due to the spatial extrapolation of prescription quantities from population non-insured with AOK Plus and for calibration purposes when loads or concentrations are derived from estimated discharges at ungauged locations (e.g., WQMST and WWTP).
2.5. Model Multisite Calibration
The model multisite calibration was performed for each river network separately by comparing modeled daily cumulative loads of the selected PhC at WQMST sites located downstream from WWTP with their corresponding “measured” loads derived from interpolated daily Q and available MEC during the time periods 2008–2014 for CBZ, 2010–2014 for GBP and SFX, and 2011–2014 for CIP. The aforementioned substance-specific transformation rates: , , , and served as model-fitting parameters. The underlying ranges of the first three parameters for calibration purposes can be found in Table S2, while a variability factor range of = ±50% = 0.5–1.5 was assumed. The model multisite calibration performance was qualitatively evaluated according to the recommended goodness-of-fit (GOF) values provided in Table 1.

Table 1.
Performance levels of model multisite calibration adopted for each river network.
2.6. Uncertainty Analysis
The model fitting parameters for the multisite calibration are subject to spatiotemporal variation. The interaction of assumed transformation processes within a PhC routing from human consumption to the river system, the spatiotemporal estimation of river discharge at ungauged sites, and the spatial density of MEC values at WQMST available in each river network for comparison can significantly influence the model parameter output. It becomes a more complex issue in this study since some model parameters are related to human physical characteristics and behavior concerning the PhC consumption. When the model error becomes difficult to disaggregate into each source component, the assessment of total output uncertainty emerges as the most practical approach [95,96].
In this study, the model parameter space was assessed within the generalized likelihood uncertainty estimation (GLUE) framework. The well-known statistical GLUE method was developed by [97] for hydrological modeling, and it identifies the equifinality of different parameter sets for an acceptable model response. Within this context, a Latin Hypercube Sampling (LHS) scheme from the lhs r-package was used with n = 1000 parameter sets assuming uniform distributions within the ranges described in Section 2.5 and Table S2. With the aim to spread out the sampling parameter space to its furthest extent, the LHS sampling divides m equally intervals of each parameter range (here, m = 10), and random values were sampled within each interval [98]. The GOF values with their corresponding performance levels provided in Table 1 were adopted as likelihood functions and threshold values within the GLUE framework. For each river network and selected PhC, model parameter sets that achieved the highest performance level of multisite calibration were defined as behavioral. They were further considered for uncertainty output estimation of spatiotemporal loads of the selected PhC across each river network within the delimited study area.
2.7. Ecotoxicity and Environmental Risk Assessment (ERA)
With the purpose to assess the environmental toxicity risk for each selected PhC with high spatial resolution, all river networks were additionally discretized by 1 km point sites and integrated with WQMST and WWTP point sites to obtain similar graph-theory-based model setups as described in Section 2.5. From the behavioral parameter sets obtained during model multisite calibrations, calculated PhC loads of the selected PhC at each point site were converted into PEC using average flow conditions for the most recent year of simulations (MQ 2014) and MLQ to assess the worst-case condition of minimum river dilution, which are usually manifested during dry summer months. Within this context, the risk-exposure of each river network is performed by comparing PEC of the selected PhC at each point site with their toxicity thresholds (PNEC|EQS) given in Table S2. Each river point site was classified by risk-exposure levels as follows:
- PEC ≥ 1.0∙(PNEC|EQS): critical pollution at MQ 2014|MLQ conditions;
- 0.5∙(PNEC|EQS) ≤ PEC < 1.0∙(PNEC|EQS): moderate pollution at MQ 2014|MLQ;
- PEC < 0.5∙(PNEC|EQS): low pollution at MQ 2014|MLQ conditions;
- PEC ~ 0 ng L−1: river point sites located upstream from both WWTP and identified WQMST with background PhC input are considered as not risk-exposed to pollution.
2.8. Software Used
All data preparation and data operation required for model setup, calibration, and results analysis were performed using ArcGIS-toolboxes (v.10.3) and R-scripts (v. 4.1.1).
3. Results and Discussion
3.1. Model Multisite Calibration of PhC Loads
The optimized LHS provided the parameter space for uncertainty estimation within the GLUE framework. Daily cumulative loads of the selected PhC across each river network were simulated and calibrated against measured loads at WQMST sites downstream from WWTP sites. The number of behavioral simulation runs together with their overall multisite calibration performance and model fitting parameters are summarized in Table S4. Except for Lower Weiße Elster and Schwarze Elster river networks for CIP-loads, the multisite calibration of PhC loads achieved at least fair performance levels (KGE > 0.4 or bR2 > 0.4). In particular, river networks with a larger number of WQMST sites and higher measurement frequency (e.g., Elbe, Freiberger Mulde, and Zwickauer Mulde) achieved from satisfactory to very good overall performance levels (in terms of NSE > 0.5, RSR < 0.7 and PBIAS < ±70%). This latter suggests that the spatiotemporal density of calibration sites and the measuring frequency could significantly influence the overall multisite calibration performance across river networks.
Significant correlations between measured and simulated loads, as shown in Figures S4–S7, corroborated WWTP as dominant entry sources of the modeled PhC into river networks and, in some cases, unknown sources in headwater river sections contributed non-negligible background loads of the selected PhC. For each WQMST site, the comparison graphs show the median (blue circle) and the 90% prediction uncertainty range (vertical whiskers) of simulated loads from behavioral parameter sets according to the GLUE method. As also reported in [39,43,99], the prediction ranges at upstream WQMST sites (low PhC loads) were found to be generally wider than at downstream WQMST sites (large PhC loads). This higher uncertainty of simulated PhC loads was markedly observed at WQMST sites where measured PhC loads prevailed lower than 10.0 g d−1 for CBZ, 20.0 g d−1 for GBP, 2.0 g d−1 for SFX, and 1.0 g d−1 for CIP (Figures S4–S7). Additionally, cumulative ratios of calibrated WQMST sites (R%) where median model predictions exceeded a specific % PBIAS from median measured values for each selected PhC along all river networks are shown in Figure 2.
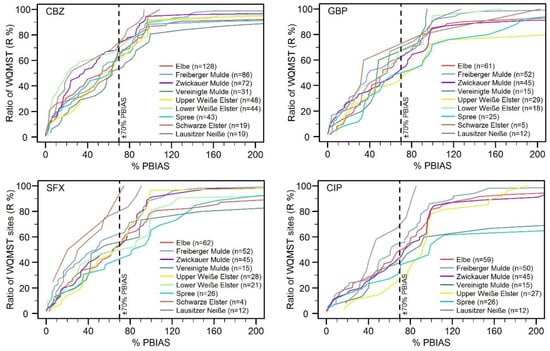
Figure 2.
Exceedance ratio curves of calibration WQMST sites in function of absolute %PBIAS of modeled median values from median measured values for each selected pharmaceutical. WQMST = water quality monitoring station; n = number of calibration WQMST sites.
Except for Spree and Vereinigte Mulde for CIP and SFX, around three-quarters of all modeled median values at calibrated WQMST sites along all other river catchments exhibited a PBIAS ≤ ±100%. Concerning the fair ±70% PBIAS limit (vertical dashed line in Figure 2), the most spatiotemporal densely sampled PhC (CBZ) showed a range of R = 60.4–73.7% (excluding Vereinigte Mulde). In contrast, less spatiotemporal densely sampled PhC showed lower ranges of R = 44.8–66.7% for GBP, R = 42.3–61.5% for SFX (excluding Schwarze Elster and Lausitzer Neiße), and R = 26.0–54.0% for CIP (excluding Lausitzer Neiße). From the excluded river networks, the influence of the number of upstream WQMST sites at river tributaries on diminishing multisite calibration performance was corroborated. Although Vereinigte Mulde, Schwarze Elster, and Lausitzer Neiße river networks have a similar number of calibration WQMST sites, the former had more WQMST sites at river tributaries with poorer calibration performance in comparison to the other two, where most WQMST sites are located at the main rivers.
Based on the comparison of calibrated model fitting parameters (Table S4) with their corresponding ranges reported in the literature (Table S2), it was possible to regionally characterize the transformation processes for each PhC along all river networks in Saxony. In general, mean human excretion rates for CBZ ( = 4.5–8.8%) and CIP ( = 52.0–64.0%) lied mainly in the lower half of the literature ranges, while mean human excretion rates for GBP ( = 89.9–94.2%) and SFX ( = 13.2–28.2%) were found mainly in the upper half and around the middle value of the literature ranges, respectively. In Elbe, Vereinigte Mulde, and Lausitzer Neiße river networks were specifically found higher human excretion rates of the selected PhC by a factor range of 1.2–1.7 to their neighboring river networks. Concerning the elimination performance of WWTP, mean removal rates for CBZ ( = 4.8–6.4%) and CIP ( = 67.9–77.9%) lied mainly in the upper half of the literature ranges, while mean removal rates for GBP ( = 7.7–18.9%) and SFX ( = 33.0–51.9%) were found mainly in the lower half and around the middle value of the literature ranges, respectively. Except for Vereinigte Mulde and Lausitzer Neiße river networks, the WWTP removal rates are similar, with an oscillating difference of only ±10% to the overall mean of calculated WWTP removal rates for each selected PhC. With regard to mean human compliance, higher spatial variation among river networks, except for GBP, was evidenced ( = 60.7–96.6%, = 72.5–76.1%, = 55.3–96.6%, = 76.2–92.6%). This latter emphasizes the difficulty in tracking the irregularity of patient commitment to follow medication prescriptions and its influence on estimating PhC loads disposed down-the-drain. On the other hand, wider ranges of calibrated variability factor compensated some overestimation (with < 1.0) or underestimation (with > 1.0) of previously back-estimated loads of the selected PhC due to spatial extrapolation of prescription quantities of the non-insured population with AOK Plus and river discharge interpolation. For instance, predominant overestimated CBZ-loads required a reduction with mean = 0.74–0.88, SFX-loads with mean = 0.66–0.84, and CIP-loads with mean = 0.54–0.88, except for Elbe, Vereinigte Mulde, and Lausitzer Neiße river networks. Meanwhile, predominant underestimated GBP-loads required an increase with mean = 1.17–1.43 excluding Spree and Lower Weiße Elster river networks.
3.2. Model-Based Time Series of PhC Concentrations at Specific Point Sites
Behavioral parameter sets derived by the multisite calibration of PhC loads provide time series of daily PEC (after conversion using Q) at any discretized point site along each river network (e.g., WQMST, WWTP, and 1 km point sites). Within this context, outlet point sites of river networks within the Saxony border were exemplarily evaluated by comparing modeled and measured concentrations profiles at most downstream WQMST sites, as illustrated in Figure 3 (for CBZ) and Figures S8–S10 (for GBP, SFX, and CIP). Modeled concentration profiles are expressed as the best simulation from the behavioral runs (solid line) and the local 90 PPU range (blue area) calculated by measured concentrations at each corresponding WQMST.
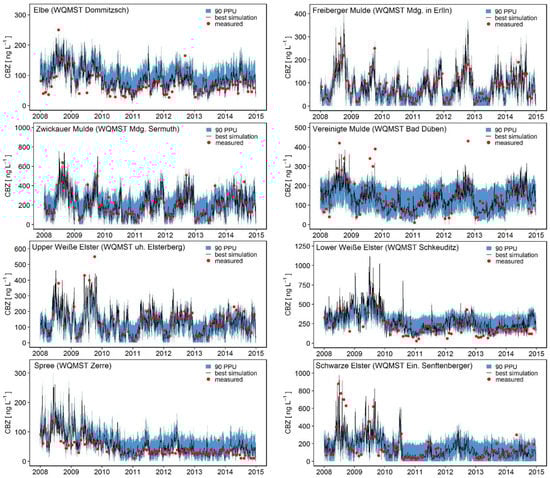
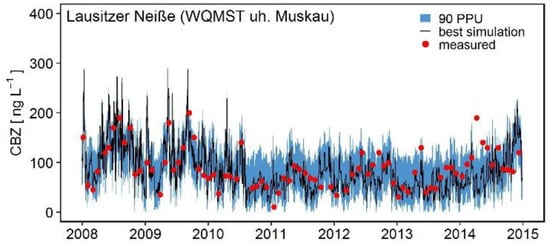
Figure 3.
Comparison of measured and simulated CBZ-concentrations at river outlets (most downstream WQMST located at main rivers). Modeled concentration profiles expressed as best simulation from behavioral runs after GLUE method and local 90% prediction uncertainty range (90 PPU) calculated by measured concentrations at each point site. WQMST = water quality monitoring station; CBZ = carbamazepine; GLUE = generalized likelihood uncertainty estimation.
With the exception of CIP, the modeled concentration profiles could capture the seasonal trends of other selected PhC at outlet sites of most river networks satisfactorily, although a one-to-one agreement with measured concentration peaks was only sometimes possible. A systematic overestimation of modeled GPB and SFX concentration profiles was observed at the outlet of Lower Weiße Elster (WQMST Schkeuditz). The reason could be attributed to the inaccurate estimation of upstream input loads (from Thuringia region, Figure 1) of these PhC and the lowest fair multisite calibration performance achieved together with other WQMST sites (KGE = 0.40–0.41, Table S4). Furthermore, river discharge in this region is strongly affected by lignite mining sites [100]. Potential discrepancies in discharge interpolation might propagate into the concentration conversion.
On the other hand, most MEC of SFX at the outlet of Spree (WQMST Zerre, Figure S9) and MEC of CIP at outlet sites of all river networks (downstream WQMST sites, Figure S10) lied below the limit of detection (LOD). Nevertheless, the fluctuation of PEC time series and mean values can still agree with LOD(SFX) = 10 ng L−1 and LOD(CIP) = 20 ng L−1. For instance, most of the PEC fluctuation of CIP at the outlet of Elbe (WQMST Dommitzsch), at the outlet of Vereinigte Mulde (WQMST Bad Düben), and at the outlet of Lausitzer Neiße (WQMST uh. Muskau) lied below the LOD(CIP). Moreover, the mean PEC values of SFX at the outlet of Spree (WQMST Zerre) and mean PEC values of CIP at the outlet of Freiberger Mulde (WQMST Mgd. in Erlln) and at the outlet of Spree (WQMST Zerre) reflected the LOD(SFX) and LOD(CIP), respectively. However, the PEC fluctuation of CIP at the outlet of Zwickauer Mulde (WQMST Mdg. Sermuth) and at the outlet of Upper Weiße Elster (WQMST uh. Elsterberg) was found mostly above the LOD(CIP).
Additionally, PEC datasets were seasonally partitioned for evaluation. As expected, higher PEC and lower modeled loads were found during summer seasons with low-flows than during winter seasons with high-flows for all selected PhC. Using outlet sites of each river network (most downstream WQMST sites) again, Table 2 shows an exemplary summary of seasonal mean PEC and modeled loads (normalized per capita) derived from the best behavioral simulation after multisite calibration using the GLUE method.
Table 2.
Mean PEC and modeled loads (normalized per capita) derived from best simulations after GLUE method at river networks outlets (most downstream WQMST) during summer (s) and winter (w) seasons. Minimum and maximum relative change (RC%) are bolded.
Among the river networks, the mean PEC of the selected PhC during summer seasons with low-flows exceeded those during winter seasons with high-flows by relative changes (RC) from 4.6% (Lower Weiße Elster) to 53.5% (Schwarze Elster) for CBZ, from 1.4% (Lausitzer Neiße) to 69.4% (Schwarze Elster) for GBP, from 1.9% (Lower Weiße Elster) to 56.8% (Schwarze Elster) for SFX and from 1.5% (Lausitzer Neiße) to 33.0% (Upper Weiße Elster) for CIP. Contrarily, mean modeled loads of selected PhC during winter with high-flow periods exceeded those during summer with low-flow periods by 4.2% (Upper Weiße Elster) to 32.0% (Vereinigte Mulde) for CBZ, by 0.5% (Freiberger Mulde) to 31.6% (Vereinigte Mulde) for GBP, by 3.7% (Spree) to 35.3% (Vereinigte Mulde) for SFX and by 3.0% (Spree) to 47.2% (Vereinigte Mulde) for CIP. Furthermore, higher normalized PhC loads per capita were found again in Elbe, Vereinigte Mulde, and Lausitzer Neiße, which also followed the calibrated factor >1.0 (Table S4). This can be attributed to multiple reasons: the ratio of the insured population by other health insurance companies apart from AOK Plus (40–63%, reverse values in Figure S1e) might obtain more prescribed PhC amount per capita than the population insured by AOK Plus; the non-prescribed consumption of the selected PhC might provide noticeable extra loads in the river networks; and the required compensation of unknown PhC loads, which come from international borders (e.g., Lausitzer Neiße is mostly shared between Germany and Poland).
3.3. Environmental Risk Assessment (ERA)
Based on the cumulative PhC loads simulated with the proposed graph-theory-based model using behavioral parameter sets and the longitudinal discretization of 1 km, ERA with high spatial resolution was carried out along the length of each river network. Average flow conditions for the most recent year of simulations (MQ 2014) and low-flow conditions (MLQ) as worst-case scenario were employed to obtain mean PEC. Subsequently, they were compared with the corresponding half and total threshold values (PNEC|EQS) of each selected PhC to determine ecotoxicological pollution levels. The complete range of mean PEC across all river networks are illustrated using exceedance frequency curves (Figure 4). The Y-axis indicates the percentage of 1 km point sites exceeding a specific concentration level indicated on X-axis. The vertical dashed and solid lines represent the half and total ecotoxicological limit values for each PhC, respectively. It should be pointed out that the exceedance curves do not begin from 100% because between 50% (Vereinigte Mulde) and 75% (Upper Weiße Elster) of the complete lengths of all river networks were found to have neither WWTP inputs nor detected upstream background inputs of the selected PhC.
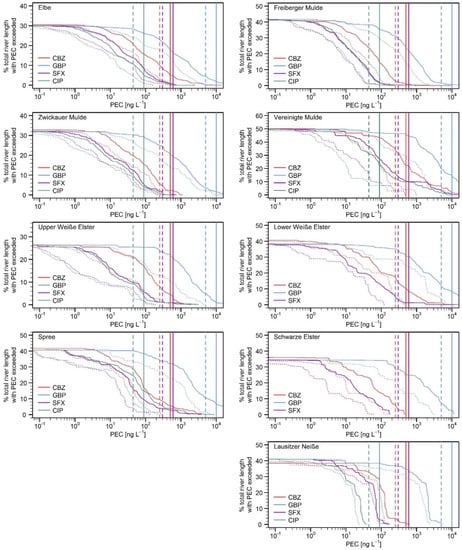
Figure 4.
Exceedance frequency curves of mean PEC under average-flow conditions for year 2014 (MQ 2014, dotted lines) and under low-flow conditions (MLQ, solid lines) for selected pharmaceuticals across total lengths of river networks. Vertical lines indicate 0.5 PNEC/EQS (dashed) and 1.0 PNEC/EQS (solid). EQS = environmental quality standard; PNEC = predicted non-effect concentration. CIP-curves at Lower Weiße Elster and Schwarze Elster not shown due to insufficient multisite calibration performance obtained. PEC = predicted environmental concentration; CBZ = carbamazepine; GBP = gabapentin; SFX = sulfamethoxazole; CIP = ciprofloxacin; MLQ = mean low-flow.
Under average-flow conditions for the year 2014 (MQ 2014), minimal ecotoxicological risk-exposure related to each selected PhC was evidenced for all river networks. Vereinigte Mulde was relatively the most affected river network with around 8.6% (4.1%) and 7.2% (7.0%) of its river length risk-exposed to moderate (critical) pollution due to CBZ and CIP concentrations, respectively. The second most affected river networks identified were Lower Weiße Elster with 5.4% of its river length risk-exposed to moderate pollution due to CBZ concentrations and Spree with 6.9% (4.2%) of its river length risk-exposed to moderate (critical) pollution due to CIP concentrations. Conversely, very low risk-exposure of any selected PhC was observed for Schwarze Elster and Lausitzer Neisse. In between, risk-exposure of moderate (critical) pollution only reached up to 3.8% (2.5%) of river lengths of all other river networks considering the concentrations of all the selected PhC.
On the other hand, the extension of river lengths exceeding half and total ecotoxicological limits increased markedly under the worst-case condition of minimum river dilution (MLQ). Vereinigte Mulde emerged again as the river network with the highest risk-exposure expected of moderate (critical) pollution at river length proportions of 34.0% (23.7%) due to CBZ, 19.8% (14.6%) due to GBP, 13.5% (10.1%) due to SFX, and 31.1% (23.2%) due to CIP. In a similar manner, the next most risk-exposed river networks with moderate (critical) pollution are Lower Weiße Elster at river length proportions of 17.3% (10.2%) due to CBZ and 11.0% (8.3%) due to GBP as well as Spree at river length proportions of 10.5% (6.8%) due to GBP and 23.5% (15.0%) due to CIP. For the remaining river networks, less than 9.9% (5.5%) of their river lengths are prone to be risk-exposed to moderate (critical) pollution considering all the selected PhC, respectively.
Furthermore, extensively detailed spatial screening of potential pollution hotspots across river networks was carried out by mapping simulated mean PEC of the selected PhC. Based on the worst-case scenario of low-flow conditions (MLQ), exemplary ERA maps with the spatial distribution of mean PEC at WWTP sites and 1 km point sites according to ecotoxicological pollution levels are shown in Figure 5 (for CBZ) and Figure S11 (for GBP, SFX, and CIP). The spatial interaction of population density and available river dilution for the cumulative PhC loads can be indicated. For instance, in upstream regions such as Ore Mountains and Saxon Switzerland (near the border with Czech Republic) with low population densities connected to WWTP and sufficient river dilution, the river sections mostly revealed low pollution levels for all selected PhC. In contrast, moderate and critical concentrations were encountered along river sections around the most densely populated areas, such as at some tributaries of Elbe near Dresden due to CBZ and CIP, at some tributaries of Zwickauer Mulde downstream of Chemnitz due to CBZ, GBP, and CIP and at Lower Weiße Elster and some tributaries around Leipzig due to CBZ and GBP. Moreover, isolated WWTP sites with moderate and critical concentrations followed by sudden low concentrations at immediate downstream river sections were also spotted at different locations within each river network. This could mainly be attributed to the location of WWTP outlet sites, which were identified to be located at small stream order with low MLQ shortly before it disembogues into larger stream order with high MLQ.
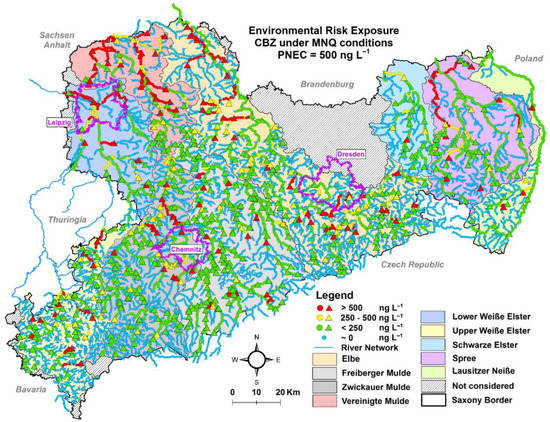
Figure 5.
Environmental risk assessment map based on mean PEC of CBZ under MLQ conditions calculated at WWTP point sites (triangles) and 1 km point sites (circles) across each river network within Saxony borders. Risk classification: critical pollution (in red), moderate pollution (in yellow), low pollution (in green), and not exposed with PEC ~ 0 ng L−1 (in blue). PEC = predicted environmental concentration; CBZ = carbamazepine; PNEC = predicted non-effect concentration; MLQ = mean low-flow; WWTP = wastewater treatment plant; WQMST = water quality monitoring stations. Flow direction is mainly from south to north or northwest.
On the other hand, as the PhC loads are accumulated along the flow paths across the river networks, the adverse effect of their interplay with possible insufficient river dilution was mainly recognized in the downstream regions. Especially in the Vereinigte Mulde and its tributaries (e.g., Lober and Lossa rivers), in the Lower Weiße Elster and its tributaries (e.g., Parther river), in the tributaries of Spree (e.g., Kleine Spree and Struga rivers), and in the tributaries of Elbe (e.g., Weinske and Koßdorfer Landgraben rivers). They showed the vulnerability to be potentially risk-exposed to moderate or critical pollution due to CBZ (Figure 5), GBP, and CIP (Figure S11).
3.4. Methodological Limitations and Future Research
Predictive models at large river catchments contain unavoidable inherent uncertainties in their calibrated parameters and output estimates, which depend on the accuracy of available input data, as also described in [84]. For the proposed graph-theory-based model in this study, the substance-specific transformation processes for routing cumulative loads of the selected PhC required the adoption of widespread literature values, whose ranges could be better refined for the uncertainty assessment under GLUE framework by pondering more detailed input data characteristics. Human-related transformation rates of the selected PhC (i.e., compliance and excretion ) could be strongly linked to the age, gender, and current health condition (e.g., renal function) as discussed in [101,102,103]. Furthermore, the range removal rate of conventional WWTP () normally refers to the well-known mechanical, chemical, and biological treatment. However, the ranges of WWTP removal efficiencies could be narrowed by considering their strong association with specific treatment configurations (e.g., N and/or P removal) and operating conditions (e.g., redox), as suggested in [10].
As spatiotemporal patterns of PEC of the selected PhC across river networks are mainly estimated via cumulative loads from WWTP effluents and river discharge, the inaccuracies as mentioned earlier of spatiotemporal river discharge characterization together with the spatial extrapolation of prescription quantities for populations non-insured with AOK Plus could still induce a high level of uncertainty. In this study, the implemented variability factor () under the GLUE framework intended to compensate the estimated PhC loads, but without providing a detailed disaggregation of uncertainty sources. Additionally, the PEC of the selected PhC derived by cumulative loads using average values from weekly prescription quantities and monthly hospital dispensation quantities could still be biased when compared, especially with daily MEC peaks at specific WQMST sites.
The proposed graph-theory-based model relies on the central assumption of persistent (or pseudo-persistent) behavior of the selected PhC once they enter the river system. It tends to yield overestimated PEC towards a conservative ERA and mitigation measures. However, a further extension of the current model structure is required to simulate non-persistent substances by considering in-stream attenuation mechanisms (e.g., biodegradation, sorption, photolysis, and volatilization) throughout the implementation of decay coefficients in function of travel times across the river network, as proposed in [58,104].
Although the multisite calibrated models could significantly capture the spatial heterogeneity of observed loads (or MEC) of the selected PhC across river networks, such compromise may also dampen the model capability to reproduce the full extent of daily loads (or MEC) peaks detected at single WQMST sites within a specific river sub-network. Consequently, the calibration strategy could also be adjusted with reference to the required spatial scale and specific river management decision. For instance, the conventional single-site calibration could be suitable for assessing the main outlet of a river network [105]. A sequential calibration from upstream to downstream could perform better within small river sub-networks assuming homogeneous conditions and determination of local parameter values [106]. Furthermore, using coupled multisite and multivariable calibration with the assignation of weights to model fitting parameters based on their sensitivity [105,106] and weights to model calibration sites based on the stream order could further reduce the spatial uncertainty in large-scale river networks.
4. Conclusions
In the present study, an adjusted graph-theory-based model was proposed for substance-flow tracking (pseudo-) persistent PhC across river networks with high spatiotemporal resolution. The model applicability was verified using four selected PhC (CBZ, GBP, SFX, and CIP) across nine large river networks located in Saxony within the time period 2008–2014. Using spatiotemporal enriched data (weekly/monthly resolved by postal-code areas) of prescription quantities and hospital dispensation quantities along with detailed river discharge characterization, the proposed model was able to compute daily loads and PEC of the selected PhC across all investigated river networks with a longitudinal discretization of 1 km. This overcame the main limitation of considering long-term averaged WWTP flux emissions and hydrological flows. Additionally, the spatial coverage of each river network included headwater river sections located upstream from WWTP, where unknown-sourced MEC of the selected PhC were also detected.
With the computation of simulated loads and PEC of selected PhC with high spatiotemporal resolution, the proposed model demonstrated its potential capabilities to locate pollution hotspots accurately and exhibited its flexibility to develop customized ERA across local sub-networks or complete river networks assuming different temporal scale (e.g., monthly, annually) intending to support better short-term or long-term river management plans. However, the selection of the ecotoxicological risk-exposure criteria and temporal scale must be clearly defined by the decision-makers since ERA can be formulated by the interplay of different substance concentration levels (e.g., mean, q-th quantile, maximum) and different river flow conditions (e.g., MQ, MLQ). By comparing with ecotoxicological limit concentrations (e.g., PNEC, EQS), the adopted definition of risk-exposure criteria of pollution will be determinant for implementing and investing in future mitigation measures. Consequently, a refined ERA of selected PhC is possible with the availability of such prescription databases with high spatiotemporal resolution. Considering this significant benefit, closer and long-term cooperation between environmental offices, health insurance companies, and healthcare institutions is essential for starting to publicly provide more georeferenced prescription quantities of PhC, especially for those listed as priority substances.
The multisite calibration within the GLUE framework across each river network also demonstrated the proficiency of the model to estimate the spatial spreading of the selected PhC satisfactorily and to capture their temporal patterns at any specific point site location. It also supported the identification of regional ranges of substance-specific transformation rates among investigated river catchments concerning human metabolism, human consumption behavior, and conventional WWTP removal efficiency of the selected PhC. Furthermore, the wide ranges of the calibrated variability factor () confirmed that the spatiotemporal estimation of PhC prescription data and river discharge characterization are still the major uncertainty contributors to the routing of PhC loads along river systems.
With the selection of the conservative and worst-case scenario of minimal river dilution (MLQ), ERA mapping of mean PEC of the selected PhC with the 1 km spatial resolution was obtained across the nine river networks investigated in Saxony. The outcome revealed that moderate pollution (0.5 PNEC/EQS < PEC < 1.0 PNEC/EQS) and critical pollution (PEC > 1.0 PNEC/EQS) are mostly expected at downstream regions with high accumulated PhC loads and insufficient river dilution. Among the selected PhC, CBZ, and CIP were found as the most critical in terms of river length exposure to pollution, and Vereinigte Mulde emerged as the most vulnerable river network with up to 34.0% and up to 23.7% of its river length expected to show moderate and critical pollution, respectively. In comparison, other river networks evidenced less than 23.5% and 15.0% of their river lengths with risk-exposure of moderate and critical pollution due to all selected PhC, respectively. Accurately identifying risk-exposed river sections could guide river management and monitoring measures more efficiently.
From the modeling framework, the proposed model can be readily adjusted for simulations of tailored planning and evaluation of different mitigation measures to improve the ecological and chemical status in the river networks. Accordingly, the planned goals for decision-making may demand, on the one side, the reduction of the total PhC-load at the outlet of a river network or specific sub-network to impair targeted downstream river sections to the least extent possible and, on the other side, the conversion of longest possible river length (by cumulative river km) from the critical/moderate risk-exposure pollution levels to the low risk-exposure pollution level across the river networks. The mitigation measures may include the upgrading of strategically selected WWTP to advanced removal treatments such as ozonation or application of activated carbon, with which high removal efficiency (>80%) of PhC can be expected [107], and it can be assigned as a target WWTP removal rate within the proposed model setup. Furthermore, multiple source control strategies of PhC for the study area can be evaluated, such as the proportional reduction of site-specific prescription quantities of critical environmental PhC (e.g., CBZ and CIP) and substitution with equivalent but less environmentally harmful PhC (e.g., GBP and SFX). Similarly, possible adjustments within the down-the-drain disposal from hospitals can be diagnosed by assuming on-site decentralized wastewater and sludge treatments without effluents into the river networks.
Finally, the proposed model is versatile for the extension to assess risk-exposure of non-persistent PhC or other emerging contaminants by including site-specific in-stream attenuation rates from biodegradation, photolysis, sediment sorption processes [58,104], as well as potential sorption capacity ratios from the interaction between microplastics and PhC [108]. Additionally, diffuse input pathways of micropollutants derived from agriculture or other adjacent areas along river networks can be included by exploiting the available spatial model discretization. However, robust spatiotemporal information of substance-specific input loads and river discharge characterization are prerequisites for optimal ERA and river management planning.
Supplementary Materials
The following supporting information can be downloaded at: https://www.mdpi.com/article/10.3390/w15112001/s1, Figure S1: Mean annual specific AOK Plus prescription per capita divided by postal code areas (a–d) and population share % insured by AOK Plus (e); Figure S2: Linear relationships between monthly hospital dispensation of selected pharmaceuticals and number of hospital beds; Figure S3: Comparison of measured mean flow and mean low-flow with predicted values from spatial autocorrelation models; Figure S4: Measured vs. simulated CBZ-loads at WQMST across each river network; Figure S5: Measured vs. simulated GBP-loads at WQMST across each river network; Figure S6: Measured vs. simulated SFX-loads at WQMST across each river network; Figure S7: Measured vs. simulated CIP-loads at WQMST across each river network; Figure S8: Comparison of measured and simulated GBP-concentrations at river network outlets; Figure S9: Comparison of measured and simulated SFX-concentrations at river network outlets; Figure S10: Comparison of measured and simulated CIP-concentrations at river network outlets; Figure S11: Environmental assessment risk maps based on mean PEC of (a) GBP, (b) SFX, and (c) CIP under MLQ conditions; Table S1: Main characteristics of investigated river catchments; Table S2: Characterization of selected pharmaceuticals; Table S3: Sources of data collection from official databases; Table S4: Summary of model multisite calibration performance of selected pharmaceuticals across each river network.
Author Contributions
Conceptualization, G.T.-V. and B.H.; methodology, G.T.-V.; data curation, G.T.-V.; software, G.T.-V.; validation, G.T.-V.; formal analysis, G.T.-V.; visualization, G.T.-V.; funding acquisition, B.H. and P.K.; project administration, B.H. and P.K.; writing—original draft preparation, G.T.-V.; writing—review and editing, B.H. and P.K.; supervision, B.H. and P.K. All authors have read and agreed to the published version of the manuscript.
Funding
This research was funded as part of the project Mikromodel by the German Federal Environmental Foundation (DBU), Saxon State Ministry for Energy, Climate Protection, Environment, and Agriculture (SMEKUL) and Gelsenwasser AG. The Article Processing Charges (APC) were funded by the joint publication funds of the TU Dresden, including Carl Gustav Carus Faculty of Medicine, and the SLUB Dresden as well as the Open Access Publication Funding of the DFG.
Data Availability Statement
The data is available on request from the corresponding author.
Acknowledgments
We thank the Saxon State Office for Environment, Agriculture, and Geology (LfULG) for the open data policy, the health insurance AOK Plus for the prescription data and hospitals located in Dresden, Chemnitz, and Plauen for dispensation data of selected pharmaceuticals.
Conflicts of Interest
The authors declare no conflict of interest.
References
- Häder, D.P.; Banaszak, A.T.; Villafañe, V.E.; Narvarte, M.A.; González, R.A.; Helbling, E.W. Anthropogenic pollution of aquatic ecosystems: Emerging problems with global implications. Sci. Total Environ. 2020, 713, 136586. [Google Scholar] [CrossRef]
- Grill, G.; Khan, U.; Lehner, B.; Nicell, J.; Ariwi, J. Risk assessment of down-the-drain chemicals at large spatial scales: Model development and application to contaminants originating from urban areas in the Saint Lawrence River Basin. Sci. Total Environ. 2016, 541, 825–838. [Google Scholar] [CrossRef]
- Schwarzenbach, R.P.; Escher, B.I.; Fenner, K.; Hofstetter, T.B.; Johnson, C.A.; von Gunten, U.; Wehrli, B. The Challenge of Micropollutants in Aquatic Systems. Science 2006, 313, 1072–1077. [Google Scholar] [CrossRef] [PubMed]
- Sangion, A.; Gramatica, P. PBT assessment and prioritization of contaminants of emerging concern: Pharmaceuticals. Environ. Res. 2016, 147, 297–306. [Google Scholar] [CrossRef]
- Patel, M.; Kumar, R.; Kishor, K.; Mlsna, T.; Pittman, C.U.; Mohan, D. Pharmaceuticals of Emerging Concern in Aquatic Systems: Chemistry, Occurrence, Effects, and Removal Methods. Chem. Rev. 2019, 119, 3510–3673. [Google Scholar] [CrossRef] [PubMed]
- Taylor, D.; Senac, T. Human pharmaceutical products in the environment–the “problem” in perspective. Chemosphere 2014, 115, 95–99. [Google Scholar] [CrossRef] [PubMed]
- Grundy, E.M.; Murphy, M. Population ageing in Europe. In Oxford Textbook of Geriatric Medicine, 1st ed.; Michel, J.P., Beattie, B.L., Eds.; Oxford University Press: Oxford, UK, 2017; pp. 11–17. [Google Scholar]
- Abraham, J. Pharmaceuticalization of society in context: Theoretical, empirical and health dimensions. Sociology 2010, 44, 603–622. [Google Scholar] [CrossRef]
- Thomaidis, N.S.; Gago-Ferrero, P.; Ort, C.; Maragou, N.C.; Alygizakis, N.A.; Borova, V.L.; Dasenaki, M.E. Reflection of Socioeconomic Changes in Wastewater: Licit and Illicit Drug Patterns. Environ. Sci. Technol. 2016, 50, 10065–10072. [Google Scholar] [CrossRef]
- Verlicchi, P.; Al Aukidy, M.; Zambello, E. Occurrence of pharmaceutical compounds in urban wastewater: Removal, mass load and environmental risk after a secondary treatment—A review. Sci. Total Environ. 2012, 429, 123–155. [Google Scholar] [CrossRef]
- Jelić, A.; Gros, M.; Petrović, M.; Ginebreda, A.; Barceló, D. Occurrence and elimination of pharmaceuticals during conventional wastewater treatment. In Emerging and Priority Pollutants in Rivers: Bringing Science into River Management Plans, 1st ed.; Guasch, H., Ginebreda, A., Eds.; Springer: Berlin/Heidelberg, Germany, 2012; pp. 1–23. [Google Scholar]
- Diamantini, E.; Mallucci, S.; Bellin, A. A parsimonious transport model of emerging contaminants at the river network scale. Hydrol. Earth Syst. Sci. 2019, 23, 573–593. [Google Scholar] [CrossRef]
- aus der Beek, T.; Weber, F.-A.; Bergmann, A.; Hickmann, S.; Ebert, I.; Hein, A.; Küster, A. Pharmaceuticals in the environment-Global occurrences and perspectives. Environ. Toxicol. Chem. 2016, 35, 823–835. [Google Scholar] [CrossRef]
- Kolar, B.; Arnuš, L.; Jeretin, B.; Gutmaher, A.; Drobne, D.; Durjava, M.K. The toxic effect of oxytetracycline and trimethoprim in the aquatic environment. Chemosphere 2014, 115, 75–80. [Google Scholar] [CrossRef]
- Ebert, I.; Bachmann, J.; Kühnen, U.; Küster, A.; Kussatz, C.; Maletzki, D.; Schlüter, C. Toxicity of the fluoroquinolone antibiotics enrofloxacin and ciprofloxacin to photoautotrophic aquatic organisms. Environ. Toxicol. Chem. 2011, 30, 86–92. [Google Scholar] [CrossRef] [PubMed]
- Hoeger, B.; Köllner, B.; Dietrich, D.R.; Hitzfeld, B. Water-borne diclofenac affects kidney and gill integrity and selected immune parameters in brown trout (Salmo trutta f. fario). Aquat. Toxicol. 2005, 75, 53–64. [Google Scholar] [CrossRef]
- Rostkowski, P.; Horwood, J.; Shears, J.A.; Lange, A.; Oladapo, F.O.; Besselink, H.T.; Tyler, C.R.; Hill, E.M. Bioassay-directed identification of novel antiandrogenic compounds in bile of fish exposed to wastewater effluents. Environ. Sci. Technol. 2011, 45, 10660–10667. [Google Scholar] [CrossRef]
- Gross-Sorokin, M.Y.; Roast, S.D.; Brighty, G.C. Assessment of feminization of male fish in English rivers by the Environment Agency of England and Wales. Environ. Health Perspect. 2006, 114 (Suppl. 1), 147–151. [Google Scholar] [CrossRef]
- Berendonk, T.U.; Manaia, C.M.; Merlin, C.; Fatta-Kassinos, D.; Cytryn, E.; Walsh, F.; Bürgmann, H.; Sorum, H.; Norström, M.; Pons, M.N.; et al. Tackling antibiotic resistance: The environmental framework. Nat. Rev. Microbiol. 2015, 13, 310–317. [Google Scholar] [CrossRef]
- European Union, Directive 2008/105/EC. Environmental Quality Standards in the Field of Water Policy, Amending and Subsequently Repealing Council Directives 82/176/EEC, 83/513/EEC, 84/156/EEC, 84/491/EEC, 86/280/EEC and Amending Directive 2000/60/EC of the European Parliament and the Council of the European Union. Off. J. Eur. Union 2008, L 348/84. Available online: https://eur-lex.europa.eu/eli/dir/2008/105/oj (accessed on 30 January 2023).
- European Union, Directive 2013/39/EU. Amending Directives 2000/60/EC and 2008/105/EC as Regards Priority Substances in the Field of Water Policy. Off. J. Eur. Union 2008, L 226/1. Available online: https://eur-lex.europa.eu/legal-content/EN/ALL/?uri=CELEX%3A32013L0039 (accessed on 30 January 2023).
- European Union, European Commision. Directive 2000/60/EC of the European Parliament and of the Council of 23 October 2000 Establishing a Framework for Community Action in the Field of Water Policy. Off. J. Eur. Union 2000, L 327. Available online: https://eur-lex.europa.eu/legal-content/EN/TXT/?uri=celex%3A32000L0060 (accessed on 30 January 2023).
- Carvalho, L.; Mackay, E.B.; Cardoso, A.C.; Baattrup-Pedersen, A.; Birk, S.; Blackstock, K.L.; Borics, G.; Borja, A.; Feld, C.K.; Ferreira, M.T.; et al. Protecting and restoring Europe’s waters: An analysis of the future development needs of the Water Framework Directive. Sci. Total Environ. 2019, 658, 1228–1238. [Google Scholar] [CrossRef]
- European Union, European Commission. Technical Guidance Document on Risk Assessment in Support of Commission Directive 93/67/EEC on Risk Assessment for New Notified Substances, Commission Regulation (EC) No 1488/94 on Risk Assessment for Existing Substances, and Directive 98/8/EC of the European Parliament and of the Council Concerning the Placing of Biocidal Products on the Market (20418 EN); European Commision (ECB): Luxembourg, 2003; Available online: https://publications.jrc.ec.europa.eu/repository/handle/JRC23785 (accessed on 30 January 2023).
- European Medicines Agency (EMA). Guideline on the Environmental Risk Assessment of Medicinal Products for Human Use. Doc. Ref. EMEA/CHMP/SWP/4447/00 corr 2*; EMA: London, UK, 2006; Available online: https://www.ema.europa.eu/en/documents/scientific-guideline/guideline-environmental-risk-assessment-medicinal-products-human-use-first-version_en.pdf (accessed on 30 January 2023).
- Gogoi, A.; Mazumder, P.; Tyagi, V.K.; Chaminda, G.T.; An, A.K.; Kumar, M. Occurrence and fate of emerging contaminants in water environment: A review. Groundw. Sustain. Dev. 2018, 6, 169–180. [Google Scholar] [CrossRef]
- Arlos, M.J.; Bragg, L.M.; Servos, M.R.; Parker, W.J. Simulation of the fate of selected pharmaceuticals and personal care products in a highly impacted reach of a Canadian watershed. Sci. Total Environ. 2014, 485, 193–204. [Google Scholar] [CrossRef]
- Boxall, A.B.A.; Keller, V.D.J.; Straub, J.O.; Monteiro, S.C.; Fussell, R.; Williams, R.J. Exploiting monitoring data in environmental exposure modelling and risk assessment of pharmaceuticals. Environ. Int. 2014, 73, 176–185. [Google Scholar] [CrossRef]
- Kapo, K.E.; DeLeo, P.C.; Vamshi, R.; Holmes, C.M.; Ferrer, D.; Dyer, S.D.; Wang, X.; White-Hull, C. iSTREEM ®: An approach for broad-scale in-stream exposure assessment of “down-the-drain” chemicals. Integr. Environ. Assess. Manag. 2016, 12, 782–792. [Google Scholar] [CrossRef]
- Lämmchen, V.; Klasmeier, J.; Hernandez-Leal, L.; Berlekamp, J. Spatial Modelling of Micro-pollutants in a Strongly Regulated Cross-border Lowland Catchment. Environ. Process. 2021, 8, 973–992. [Google Scholar] [CrossRef]
- Vermeire, T.G.; Jager, D.T.; Bussian, B.; Devillers, J.; Den Haan, K.; Hansen, B.; Lundberg, I.; Niessen, H.; Robertson, S.; Tyle, H.; et al. European union system for the evaluation of substances (EUSES). Principles and structure. Chemosphere 1997, 34, 1823–1836. [Google Scholar] [CrossRef]
- Keller, V. Risk assessment of “down-the-drain” chemicals: Search for a suitable model. Sci. Total Environ. 2006, 360, 305–318. [Google Scholar] [CrossRef]
- Feijtel, T.; Boeije, G.; Matthies, M.; Young, A.; Morris, G.; Gandolfi, C.; Hansen, B.; Fox, K.; Holt, M.; Koch, V.; et al. Development of a geography-referenced regional exposure assessment tool for European rivers-GREAT-ER contribution to GREAT-ER# 1. Chemosphere 1997, 34, 2351–2373. [Google Scholar]
- Wang, X.; White-Hull, C.; Dyer, S.; Yang, Y. GIS-ROUT: A river model for watershed planning. Environ. Plan. B Plan. Des. 2000, 27, 231–246. [Google Scholar] [CrossRef]
- Anderson, P.D.; D’Aco, V.J.; Shanahan, P.; Chapra, S.C.; Buzby, M.E.; Cunningham, V.L.; DuPlessie, B.M.; Hayes, E.P.; Mastrocco, F.J.; Parke, N.J.; et al. Screening analysis of human pharmaceutical compounds in US surface waters. Environ. Sci. Technol. 2004, 38, 838–849. [Google Scholar] [CrossRef]
- Johnson, A.C.; Dumont, E.; Williams, R.J.; Oldenkamp, R.; Cisowska, I.; Sumpter, J.P. Do Concentrations of Ethinylestradiol, Estradiol, and Diclofenac in European Rivers Exceed Proposed EU Environmental Quality Standards? Environ. Sci. Technol. 2013, 47, 12297–12304. [Google Scholar] [CrossRef] [PubMed]
- Teran-Velasquez, G.; Helm, B.; Krebs, P. Longitudinal River Monitoring and Modelling Substantiate the Impact of Weirs on Nitrogen Dynamics. Water 2022, 14, 189. [Google Scholar] [CrossRef]
- Johnson, A.C.; Ternes, T.; Williams, R.J.; Sumpter, J.P. Assessing the Concentrations of Polar Organic Microcontaminants from Point Sources in the Aquatic Environment: Measure or Model? Environ. Sci. Technol. 2008, 42, 5390–5399. [Google Scholar] [CrossRef] [PubMed]
- Ort, C.; Hollender, J.; Schaerer, M.; Siegrist, H. Model-Based Evaluation of Reduction Strategies for Micropollutants from Wastewater Treatment Plants in Complex River Networks. Environ. Sci. Technol. 2009, 43, 3214–3220. [Google Scholar] [CrossRef]
- Keller, V.D.J.; Williams, R.J.; Lofthouse, C.; Johnson, A.C. Worldwide estimation of river concentrations of any chemical originating from sewage-treatment plants using dilution factors. Environ. Toxicol. Chem. 2014, 33, 447–452. [Google Scholar] [CrossRef] [PubMed]
- Rodriguez-Iturbe, I.; Rinaldo, A. Fractal River Basins: Chance and Self-Organization; Cambridge University Press: Cambridge, UK, 2001. [Google Scholar]
- Cormen, T.H.; Leiserson, C.E.; Rivest, R.L.; Stein, C. Introduction to Algorithms; MIT Press: Cambridge, MA, USA, 2001. [Google Scholar]
- Kuroda, K.; Itten, R.; Kovalova, L.; Ort, C.; Weissbrodt, D.G.; McArdell, C.S. Hospital-Use Pharmaceuticals in Swiss Waters Modeled at High Spatial Resolution. Environ. Sci. Technol. 2016, 50, 4742–4751. [Google Scholar] [CrossRef]
- Tejedor, A.; Longjas, A.; Zaliapin, I.; Foufoula-Georgiou, E. Delta channel networks: Metrics of topologic and dynamic complexity for delta comparison, physical inference, and vulnerability assessment. Water Resour. Res. 2015, 51, 4019–4045. [Google Scholar] [CrossRef]
- Schmidt, C.; Kumar, R.; Yang, S.; Büttner, O. Microplastic particle emission from wastewater treatment plant effluents into river networks in Germany: Loads, spatial patterns of concentrations and potential toxicity. Sci. Total Environ. 2020, 737, 139544. [Google Scholar] [CrossRef]
- Gómez-Canela, C.; Pueyo, V.; Barata, C.; Lacorte, S.; Marcé, R.M. Development of predicted environmental concentrations to prioritize the occurrence of pharmaceuticals in rivers from Catalonia. Sci. Total Environ. 2019, 666, 57–67. [Google Scholar] [CrossRef]
- Statistisches Landesamt des Freistaates Sachsen. Bevölkerungsstand, Einwohnerzahlen, Eckdaten für Sachsen. Available online: https://www.statistik.sachsen.de/html/bevoelkerungsstand-einwohner.html (accessed on 30 January 2023).
- Spänhoff, B.; Dimmer, R.; Friese, H.; Harnapp, S.; Herbst, F.; Jenemann, K.; Mickel, A.; Rohde, S.; Schönherr, M.; Ziegler, K.; et al. Ecological status of rivers and streams in Saxony (Germany) according to the water framework directive and prospects of improvement. Water 2012, 4, 887–904. [Google Scholar] [CrossRef]
- Statistisches Landesamt des Freistaates Sachsen. Geodatendownload des Fachbereichs Wasser. Available online: https://www.wasser.sachsen.de/geodatendownload-12834.html (accessed on 30 January 2023).
- European Union, European Commision. Common Implementation Strategy for the Water Framework Directive (2000/60/EC), Guidance Document No. 2, Identification of Water Bodies; Office for Official Publications of the European Communities: Kirchberg, Luxembourg, 2003; Available online: https://ec.europa.eu/environment/water/water-framework/facts_figures/guidance_docs_en.htm (accessed on 30 January 2023).
- Nguyen, T.H.; Helm, B.; Hettiarachchi, H.; Caucci, S.; Krebs, P. Quantifying the information content of a water quality monitoring network using principal component analysis: A case study of the freiberger mulde river basin, Germany. Water 2020, 12, 420. [Google Scholar] [CrossRef]
- Internationale Kommission zum Schutz der Elbe (IKSE). Internationales Messprogramm Elbe 2015. Available online: https://www.ikse-mkol.org/fileadmin/media/user_upload/D/04_Themen/02_Gewasserguete/Dokumente_IMPE/IMPE/IKSE-Messprogramm_2015.pdf (accessed on 30 January 2023).
- Ahnert, M.; Arndt, M.; Barth, M.; Beil, S.; Braeckevelt, M.; Fauler, J.; Fritsche, G.; Günther, E.; Helm, B.; Jaeckel, L.; et al. MikroModell: Entwicklung eines Stoffflussmodells und Leitfadens zur Emissionsminderung von Mikroschadstoffen im Hinblick auf die Wasserqualität Schlußbericht. Available online: https://doi.org/10.25368/2021.68 (accessed on 30 January 2023).
- National Library of Medicine. LiveTox Database. Available online: https://www.ncbi.nlm.nih.gov/books/NBK547852/ (accessed on 30 January 2023).
- National Center for Biotechnology Information. Hazardous Substances Data Bank (HSDB). Available online: https://pubchem.ncbi.nlm.nih.gov/source/hsdb (accessed on 30 January 2023).
- Sächsisches Landesamt für Umwelt, Landwirtschaft und Geologie. iDA—Interdisziplinäre Daten und Auswertungen. Available online: https://www.umwelt.sachsen.de/umwelt/infosysteme/ida/index.xhtml (accessed on 30 January 2023).
- Goswami, A.; Jiang, J.Q. Simultaneous quantification of gabapentin, sulfamethoxazole, terbutryn, terbuthylazine and diuron by uv-vis spectrophotometer. Biointerface Res. Appl. Chem. 2018, 8, 3111–3117. [Google Scholar]
- Acuña, V.; von Schiller, D.; García-Galán, M.J.; Rodríguez-Mozaz, S.; Corominas, L.; Petrovic, M.; Poch, M.; Barcelo, D.; Sabater, S. Occurrence and in-stream attenuation of wastewater-derived pharmaceuticals in Iberian rivers. Sci. Total Environ. 2015, 503, 133–141. [Google Scholar] [CrossRef]
- Suárez, S.; Carballa, M.; Omil, F.; Lema, J.M. How are pharmaceutical and personal care products (PPCPs) removed from urban wastewaters? Rev. Environ. Sci. Biotechnol. 2008, 7, 125–138. [Google Scholar] [CrossRef]
- Le-Minh, N.; Khan, S.J.; Drewes, J.E.; Stuetz, R.M. Fate of antibiotics during municipal water recycling treatment processes. Water Res. 2010, 44, 4295–4323. [Google Scholar] [CrossRef]
- Sallwey, J.; Jurado, A.; Barquero, F.; Fahl, J. Enhanced Removal of Contaminants of Emerging Concern through Hydraulic Adjustments in Soil Aquifer Treatment. Water 2020, 12, 2627. [Google Scholar] [CrossRef]
- Zour, E.; Lodhi, S.A.; Nesbitt, R.U. Stability Studies of Gabapentin in Aqueous Solutions. Pharm. Res. 1992, 9, 595–600. [Google Scholar] [CrossRef]
- Strenn, B.; Clara, M.; Gans, O.; Kreuzinger, N. Carbamazepine, diclofenac, ibuprofen and bezafibrate-investigations on the behaviour of selected pharmaceuticals during wastewater treatment. Water Sci. Technol. 2004, 50, 269–276. [Google Scholar] [CrossRef]
- Bahlmann, A.; Brack, W.; Schneider, R.J.; Krauss, M. Carbamazepine and its metabolites in wastewater: Analytical pitfalls and occurrence in Germany and Portugal. Water Res. 2014, 57, 104–114. [Google Scholar] [CrossRef]
- Vollmer, K.O.; Von Hodenberg, A.; Kölle, E.U. Pharmacokinetics and metabolism of gabapentin in rat, dog and man. Arzneim.-Forschung. 1986, 36, 830–839. [Google Scholar]
- Johnson, A.C.; Keller, V.; Dumont, E.; Sumpter, J.P. Assessing concentrations and risks of toxicity from the antibiotics ciprofloxacin, sulfamethoxazole, trimethoprim and erythromycin in European rivers. Sci. Total Environ. 2015, 511, 747–755. [Google Scholar] [CrossRef]
- Kasprzyk-Hordern, B.; Dinsdale, R.M.; Guwy, A.J. The removal of pharmaceuticals, personal care products, endocrine disruptors and illicit drugs during wastewater treatment and its impact on the quality of receiving waters. Water Res. 2009, 43, 363–380. [Google Scholar] [CrossRef] [PubMed]
- Githinji, L.J.; Musey, M.K.; Ankumah, R.O. Evaluation of the fate of ciprofloxacin and amoxicillin in domestic wastewater. Water Air Soil Poll. 2011, 219, 191–201. [Google Scholar] [CrossRef]
- Kruopienė, J.; Dvarionienė, J. Management of environmental risks in the life cycle of human pharmaceuticals in Lithuania. Environ. Res. Eng. Manag. 2010, 52, 41–47. [Google Scholar]
- Landesamt für Natur, Umwelt und Verbraucherschutz Nordhein-Westfalen. Eintrag von Arzneinmittel und deren Verhalten und Verbleib in der Umwelt—Literaturstudie. Ministerium für Umwelt und Naturschutz; Landwirtschaft und Verbraucherschutz des Landes Nordrhein-Westfalen: Düsseldorf, Germany, 2007; Available online: https://www.lanuv.nrw.de/fileadmin/lanuvpubl/3_fachberichte/30002.pdf (accessed on 30 January 2023).
- Kümmerer, K.; Schuster, A.; Längin, A.; Happel, O.; Thoma, A.; Schneider, K.; Hassauer, M.; Gartiser, S.; Hafner, C. Identifizierung und Bewertung ausgewählter Arzneimittel und ihrer Metaboliten (Ab-und Umbauprodukte) im Wasserkreislauf; Umweltbundesamt: Dessau-Roßlau, Germany, 2011; Available online: https://www.umweltbundesamt.de/sites/default/files/medien/461/publikationen/4149.pdf (accessed on 30 January 2023).
- Zhang, Y.; Geißen, S.-U. Prediction of carbamazepine in sewage treatment plant effluents and its implications for control strategies of pharmaceutical aquatic contamination. Chemosphere 2010, 80, 1345–1352. [Google Scholar] [CrossRef]
- Margot, J.; Kienle, C.; Magnet, A.; Weil, M.; Rossi, L.; de Alencastro, L.F.; Abegglen, C.; Thonney, D.; Chèvre, N.; Schärer, M.; et al. Treatment of micropollutants in municipal wastewater: Ozone or powdered activated carbon? Sci. Total Environ. 2013, 461–462, 480–498. [Google Scholar] [CrossRef]
- Gurke, R.; Rößler, M.; Marx, C.; Diamond, S.; Schubert, S.; Oertel, R.; Fauler, J. Occurrence and removal of frequently prescribed pharmaceuticals and corresponding metabolites in wastewater of a sewage treatment plant. Sci. Total Environ. 2015, 532, 762–770. [Google Scholar] [CrossRef]
- Landesanstalt für Umwelt, Messungen und Naturschutz Baden-Württemberg. Spurenstoffinventar der Fließgewässer in Baden-Württemberg. Available online: https://pudi.lubw.de/detailseite/-/publication/29560 (accessed on 30 January 2023).
- Hendricks, R.; Pool, E.J. The effectiveness of sewage treatment processes to remove faecal pathogens and antibiotic residues. J. Environ. Sci. Health A 2012, 47, 289–297. [Google Scholar] [CrossRef]
- Castiglioni, S.; Bagnati, R.; Fanelli, R.; Pomati, F.; Calamari, D.; Zuccato, E. Removal of Pharmaceuticals in Sewage Treatment Plants in Italy. Environ. Sci. Technol. 2006, 40, 357–363. [Google Scholar] [CrossRef]
- Gollwitzer, S.; Kostev, K.; Hagge, M.; Lang, J.; Graf, W.; Hamer, H.M. Nonadherence to antiepileptic drugs in Germany: A retrospective, population-based study. Neurology 2016, 87, 466–472. [Google Scholar] [CrossRef] [PubMed]
- Bautista, R.E.D.; Rundle-Gonzalez, V. Effects of antiepileptic drug characteristics on medication adherence. Epilepsy Behav. 2012, 23, 437–441. [Google Scholar] [CrossRef]
- Sabaté, E. Adherence to Long-Term Therapies: Evidence for Action; World Health Organization: Geneva, Switzerland, 2003. [Google Scholar]
- Llor, C.; Hernández, S.; Bayona, C.; Moragas, A.; Sierra, N.; Hernández, M.; Miravitlles, M. A study of adherence to antibiotic treatment in ambulatory respiratory infections. Int. J. Infect. Dis. 2013, 17, e168–e172. [Google Scholar] [CrossRef] [PubMed]
- Umweltbundesamt, Fachgebiet IV 2.4. ETOX-Datenbank: Informationssystem Ökotoxikologie und Umweltqualitätsziele. Available online: https://webetox.uba.de/webETOX/index.do (accessed on 30 January 2023).
- Cunningham, V.L. Special characteristics of pharmaceuticals related to environmental fate. In Pharmaceuticals in the Environment, 3rd ed.; Kümmerer, K., Ed.; Springer: Berlin/Heidelberg, Germany, 2008; pp. 13–24. [Google Scholar]
- Verlicchi, P.; Al Aukidy, M.; Jelic, A.; Petrović, M.; Barceló, D. Comparison of measured and predicted concentrations of selected pharmaceuticals in wastewater and surface water: A case study of a catchment area in the Po Valley (Italy). Sci. Total Environ. 2014, 470–471, 844–854. [Google Scholar] [CrossRef]
- Staatsbetrieb Geobasisinformation und Vermessung Sachsen. Digitales Geländemodell. Available online: https://www.landesvermessung.sachsen.de/digitales-gelaendemodell-4082.html (accessed on 30 January 2023).
- Statistische Ämter des Bundes und der Länder & OpenStreetMap. Downloadbereich. Available online: https://www.suche-postleitzahl.org/downloads (accessed on 30 January 2023).
- Bundesamt für Kartographie und Geodäsie. Verwaltungsgebiete und Verwaltungsgrenzen. Available online: http://www.bkg.bund.de (accessed on 30 January 2023).
- Sächsisches Staatsministerium für Energie, Klimaschutz, Umwelt und Landwirtschaft (SMEKUL). Lagebericht 2016 zur Beseitigung von Kommunalem Abwasser und Klärschlamm im Freistaat Sachsen; SMEKUL: Dresden, Germany, 2017; Available online: https://publikationen.sachsen.de/bdb/artikel/28493 (accessed on 30 January 2023).
- Peterson, E.; Ver Hoef, J. STARS: An ArcGIS toolset used to calculate the spatial information needed to fit spatial statistical models to stream network data. J. Stat. Softw. 2014, 56, 1–17. [Google Scholar] [CrossRef]
- Ver Hoef, J.; Peterson, E.; Clifford, D.; Shah, R. SSN: An R package for spatial statistical modeling on stream networks. J. Stat. Softw. 2014, 56, 1–45. [Google Scholar]
- Becker, A.; Ehrcke, R.; Fischer, B.; Horn, S.; Köpp-Klausch, K.; Kübler, S.; Bohn, E.; Büttner, U.; Friese, H.; Wolf, E.; et al. Durchflusskennwerte und Querbauwerke, Schriftenreihe, Heft 5/2019. Available online: https://www.wasser.sachsen.de/durchflusskennwerte-und-querbauwerke-11180.html (accessed on 30 January 2023).
- Moriasi, D.N.; Arnold, J.G.; Van Liew, M.W.; Bingner, R.L.; Harmel, R.D.; Veith, T.L. Model Evaluation Guidelines for Systematic Quantification of Accuracy in Watershed Simulations. Trans. ASABE 2007, 50, 885–900. [Google Scholar] [CrossRef]
- Kouchi, D.H.; Esmaili, K.; Faridhosseini, A.; Sanaeinejad, S.H.; Khalili, D.; Abbaspour, K.C. Sensitivity of Calibrated Parameters and Water Resource Estimates on Different Objective Functions and Optimization Algorithms. Water 2017, 9, 384. [Google Scholar] [CrossRef]
- Irving, K.; Kuemmerlen, M.; Kiesel, J.; Kakouei, K.; Domisch, S.; Jähnig, S.C. A high-resolution streamflow and hydrological metrics dataset for ecological modeling using a regression model. Sci. Data 2018, 5, 1–14. [Google Scholar] [CrossRef]
- Gupta, H.V.; Beven, K.J.; Wagener, T. 131: Model calibration and uncertainty estimation. In Encyclopedia of Hydrological Sciences, 1st ed.; Anderson, M.G., McDonnell, J.J., Eds.; John Wiley & Sons, Ltd.: Hoboken, NJ, USA, 2005. [Google Scholar]
- Sun, W.; Ishidaira, H.; Bastola, S. Calibration of hydrological models in ungauged basins based on satellite radar altimetry observations of river water level. Hydrol. Process. 2012, 26, 3524–3537. [Google Scholar] [CrossRef]
- Beven, K.; Binley, A. The future of distributed models: Model calibration and uncertainty prediction. Hydrol. Process. 1992, 6, 279–298. [Google Scholar] [CrossRef]
- Stocki, R. A method to improve design reliability using optimal Latin hypercube sampling. Comput. Assist. Mech. Eng. Sci. 2005, 12, 393. [Google Scholar]
- Gimeno, P.; Marcé, R.; Bosch, Ll.; Comas, J.; Corominas, Ll. Incorporating model uncertainty into the evaluation of interventions to reduce microcontaminant loads in rivers. Water Res. 2017, 124, 415–424. [Google Scholar] [CrossRef] [PubMed]
- Conradt, T.; Wechsung, F.; Bronstert, A. Three perceptions of the evapotranspiration landscape: Comparing spatial patterns from a distributed hydrological model, remotely sensed surface temperatures, and sub-basin water balances. Hydrol Earth Syst. Sci. 2013, 17, 2947–2966. [Google Scholar] [CrossRef]
- Boyd, R.A.; Turck, D.; Abel, R.B.; Sedman, A.J.; Bockbrader, H.N. Effects of Age and Gender on Single-Dose Pharmacokinetics of Gabapentin. Epilepsia 1999, 40, 474–479. [Google Scholar] [CrossRef]
- Soldin, O.P.; Mattison, D.R. Sex Differences in Pharmacokinetics and Pharmacodynamics. Clin. Pharmacokinet. 2009, 48, 143–157. [Google Scholar] [CrossRef]
- Buck, D.; Jacoby, A.; Baker, G.A.; Chadwick, D.W. Factors influencing compliance with antiepileptic drug regimes. Seizure 1997, 6, 87–93. [Google Scholar] [CrossRef]
- Writer, J.H.; Keefe, S.K.; Ryan, J.N.; Ferrer, I.; Thurman, M.E.; Barber, L.B. Methods for evaluating in-stream attenuation of trace organic compounds. Appl. Geochem. 2011, 26, S344–S345. [Google Scholar] [CrossRef]
- Franco, A.C.L.; de Oliveira, D.Y.; Bonumá, N.B. Comparison of single-site, multi-site and multi-variable SWAT calibration strategies. Hydrol. Sci. J. 2020, 65, 2376–2389. [Google Scholar] [CrossRef]
- Wu, L.; Liu, X.; Yang, Z.; Yu, Y.; Ma, X. Effects of single-and multi-site calibration strategies on hydrological model performance and parameter sensitivity of large-scale semi-arid and semi-humid watersheds. Hydrol. Process. 2022, 36, e14616. [Google Scholar] [CrossRef]
- Altmann, J.; Ruhl, A.S.; Zietzschmann, F.; Jekel, M. Direct comparison of ozonation and adsorption onto powdered activated carbon for micropollutant removal in advanced wastewater treatment. Water Res. 2014, 55, 185–193. [Google Scholar] [CrossRef] [PubMed]
- Klavins, M.; Klavins, L.; Stabnikova, O.; Stabnikov, V.; Marynin, A.; Ansone-Bertina, L.; Mezulis, M.; Vaseashta, A. Interaction between Microplastics and Pharmaceuticals Depending on the Composition of Aquatic Environment. Microplastics 2022, 1, 520–535. [Google Scholar] [CrossRef]


Disclaimer/Publisher’s Note: The statements, opinions and data contained in all publications are solely those of the individual author(s) and contributor(s) and not of MDPI and/or the editor(s). MDPI and/or the editor(s) disclaim responsibility for any injury to people or property resulting from any ideas, methods, instructions or products referred to in the content. |
© 2023 by the authors. Licensee MDPI, Basel, Switzerland. This article is an open access article distributed under the terms and conditions of the Creative Commons Attribution (CC BY) license (https://creativecommons.org/licenses/by/4.0/).