
Kinetic Models of Disinfection with Sodium Hypochlorite and Peracetic Acid of Bacteria Isolated from the Effluent of a WWTP


 ,
,  , and
, and
Abstract
:
1. Introduction
2. Materials and Methods
2.1. Sampling and Characterization of the Effluent
2.2. Isolation, Characterization, and Identification of Strains
2.3. Vegetative Cell Preparation
2.4. Endospore Preparation
2.5. Inactivation Kinetics
2.5.1. Vegetative Cells
2.5.2. Endospores
2.6. Kinetic Models
2.7. Statistical Analysis
3. Results and Discussion
3.1. Characterization of the Effluent
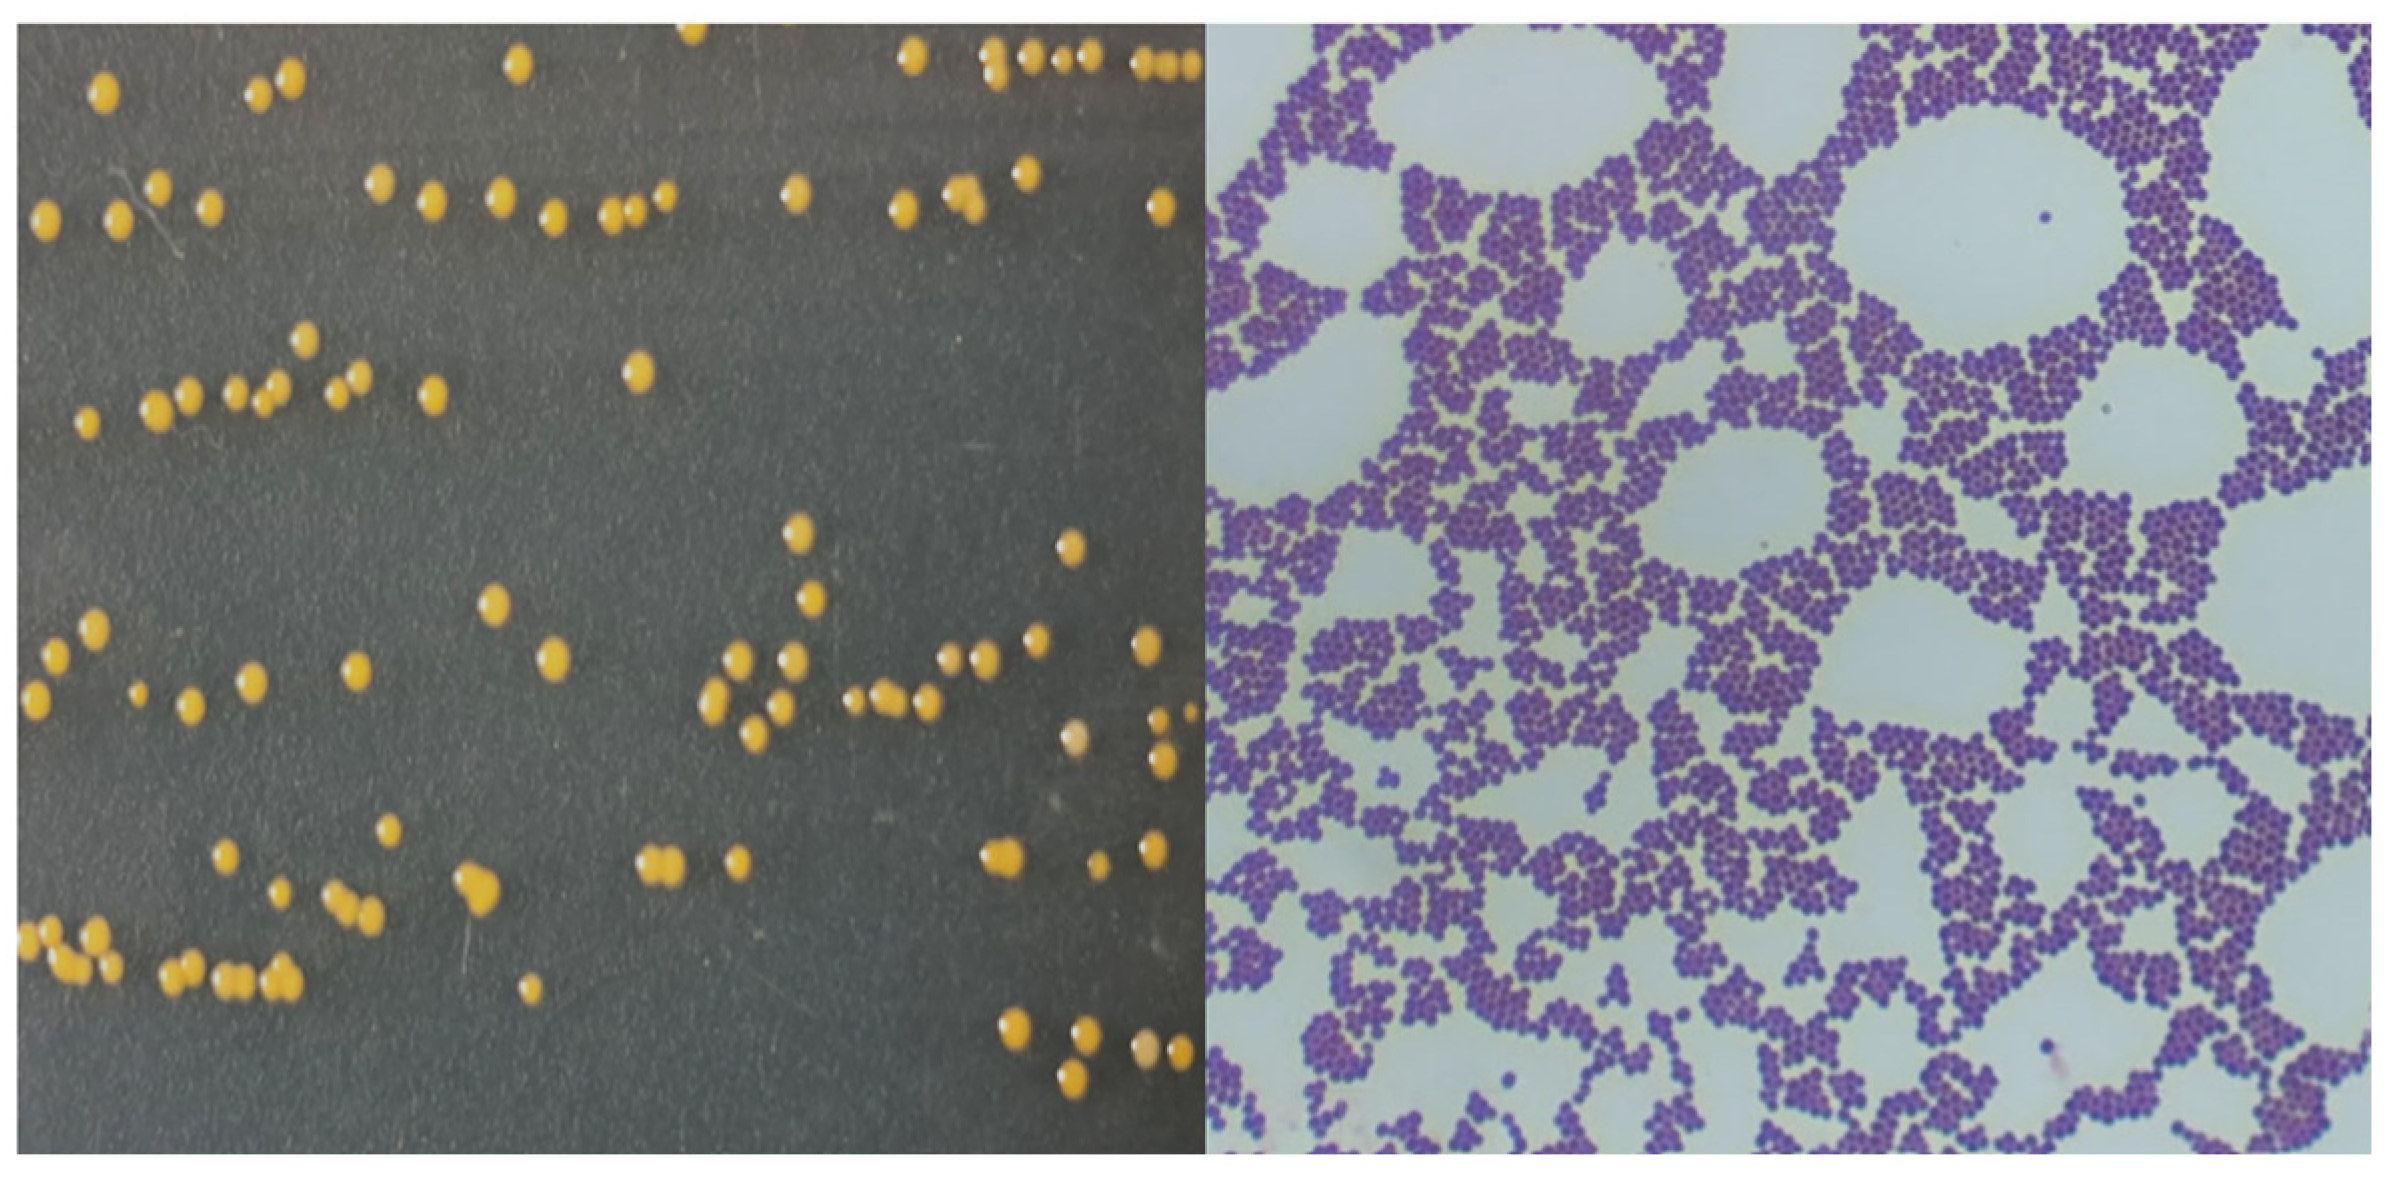
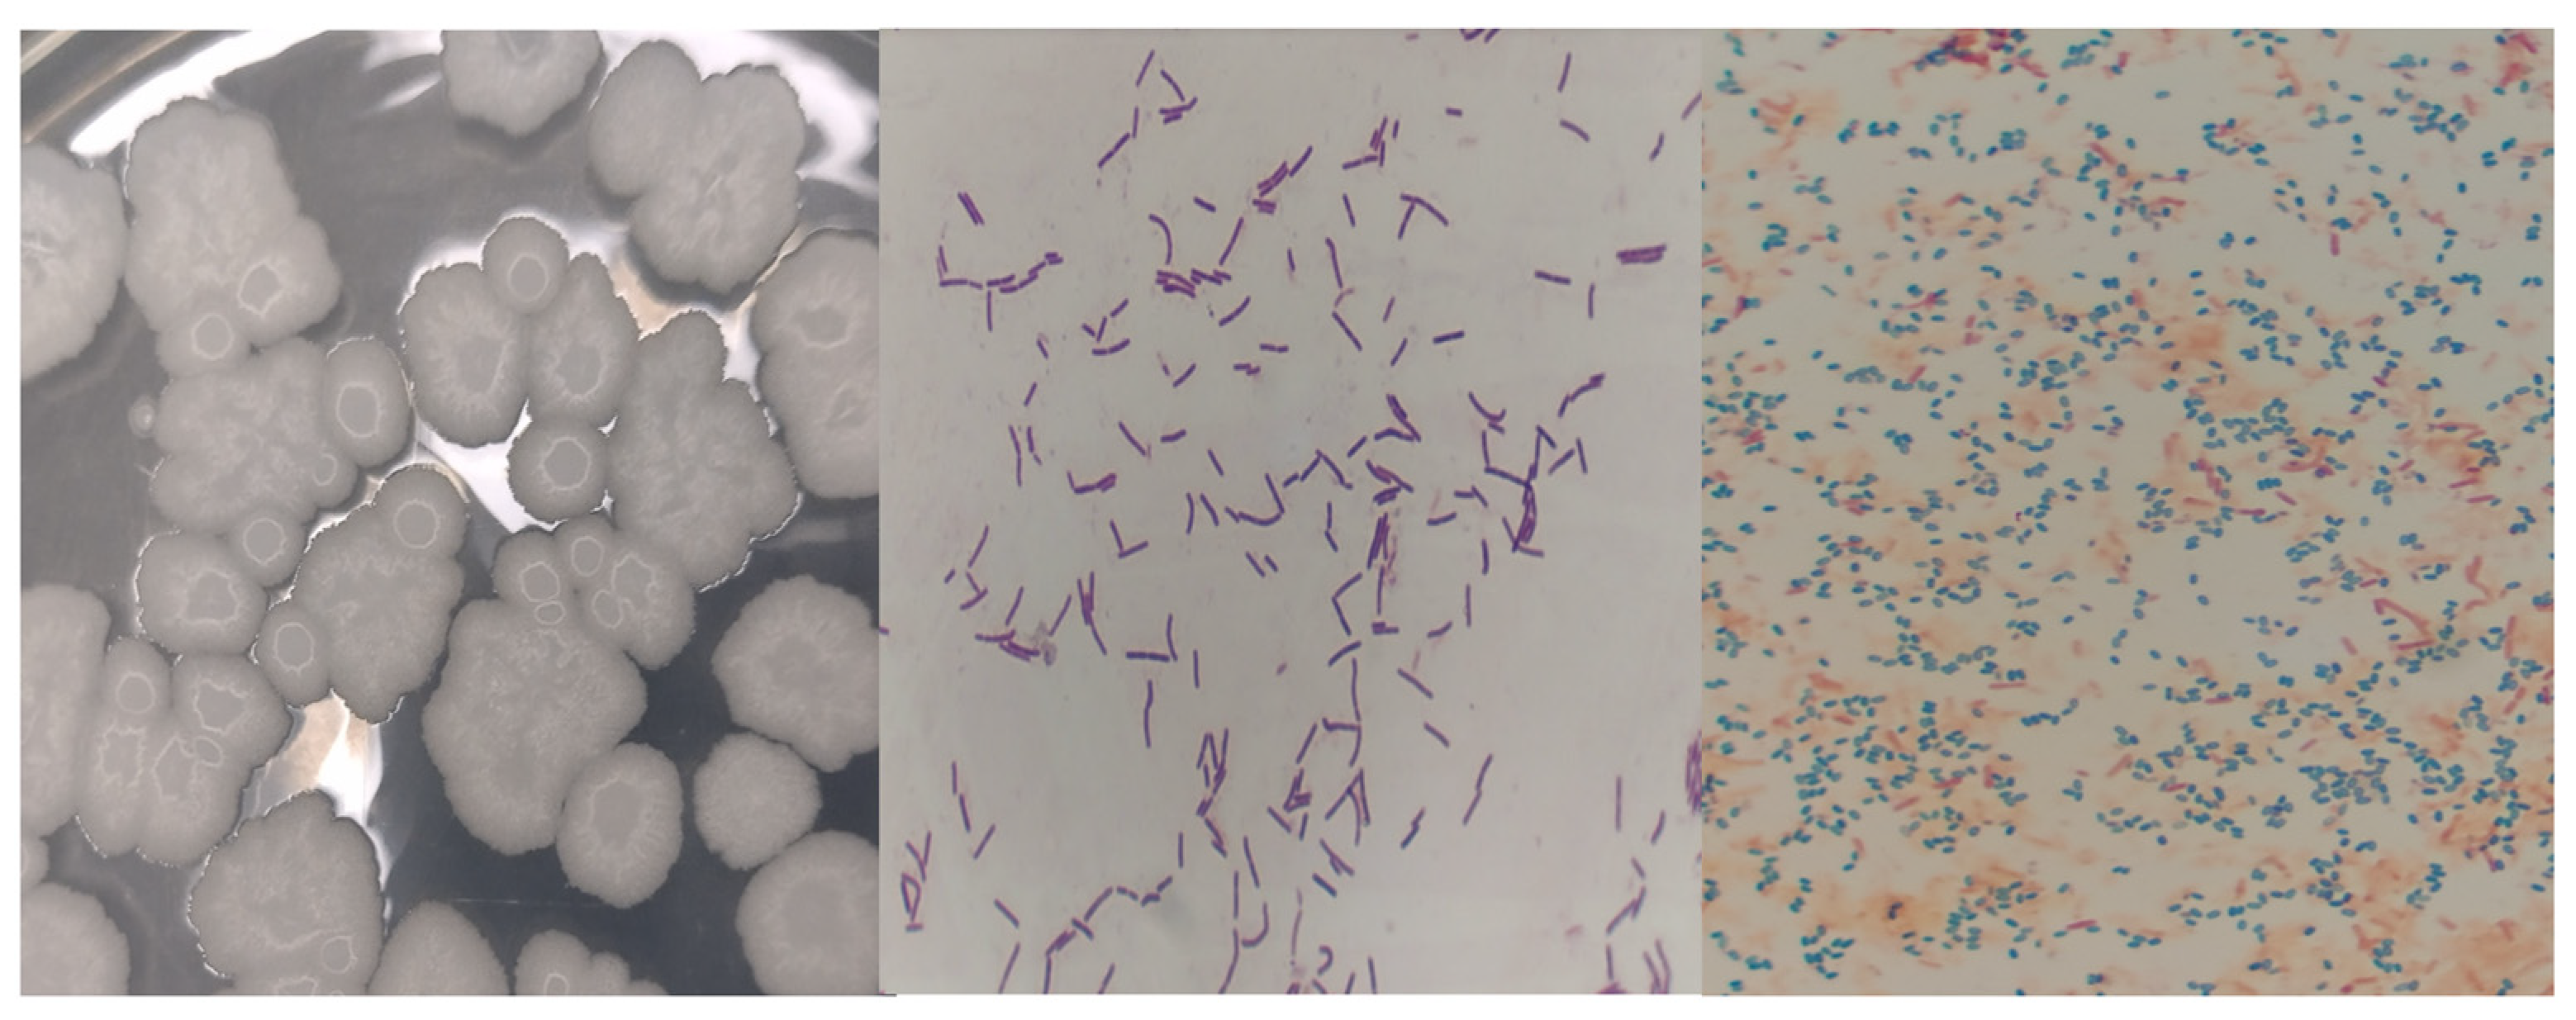
3.2. Isolation, Characterization, and Identification of Strains
3.3. Inactivation Kinetics
3.4. Kinetic Models
3.5. Statistical Analysis
4. Conclusions
Author Contributions
Funding
Data Availability Statement
Acknowledgments
Conflicts of Interest
References
- Collivignarelli, M.C.; Abbá, A.; Benigna, I.; Sorlini, S.; Torretta, V. Overview of the main Disinfection Processes for Wastewater and Drinking water Treatment Plants. Sustainability 2018, 10, 86. [Google Scholar] [CrossRef]
- Collivignarelli, M.C.; Abbá, A.; Miino, M.C.; Caccamo, F.F.; Torretta, V.; Rada, E.C.; Sorlini, S. Disinfection of wastewater by UV-Based Treatment for Reuse in a Circular Economy Perspective. Where are we at? Int. J. Environ. Res. Public Health 2021, 18, 77. [Google Scholar] [CrossRef] [PubMed]
- DOF-Diario Oficial de la Federación. Norma Oficial Mexicana NOM-001-SEMARNAT-2021, Que Establece Los Límites Permisibles de Contaminantes en Las Descargas de Aguas Residuales en Cuerpos Receptores Propiedad de la Nación. 11 de Marzo de 2022. Available online: https://www.dof.gob.mx/nota_detalle.php?codigo=5645374&fecha=11/03/2022#gsc.tab=0 (accessed on 11 May 2023).
- Umar, M. From Conventional Disinfection to Antibiotic Resistance Control-Status of the Use of Chlorine and UV Irradiation during Wastewater Treatment. Int. J. Environ. Res. Public Health. 2022, 19, 1636. [Google Scholar] [CrossRef] [PubMed]
- Luongo, G.; Previtera, L.; Ladhari, A.; Di Fabio, G.; Zarrelli, A. Peracetic acid vs. Sodium Hypochlorite: Degradation and Transformation of Drugs in Wastewater. Molecules. 2020, 25, 2294. [Google Scholar] [CrossRef] [PubMed]
- Köhler, A.T.; Rodloff, A.C.; Labahn, M.; Reinhardt, M.; Truyen, U.; Speck, S. Efficacy of sodium hypochlorite against multidrug-resistant gram-negative bacteria. J. Hosp. Infect. 2018, 100, e40–e46. [Google Scholar] [CrossRef] [PubMed]
- Ersoy, Z.G.; Dinc, O.; Cinar, B.; Gedik, S.T.; Dimoglo, A. Comparative evaluation of disinfection mechanism of sodium hypochlorite, chlorine dioxide, and electroactivated water on Enterococcus faecalis. LWT-Food Sci. Technol. 2019, 102, 205–213. [Google Scholar] [CrossRef]
- Ziemba, C.; Larivé, O.; Deck, S.; Huisman, T.; Morgenroth, E. Comparing the anti-bacterial performance of chlorination and electrolysis post-treatments in a hand washing water recycling system. Water Res. X 2019, 2, 100020. [Google Scholar] [CrossRef] [PubMed]
- Luo, L.W.; Wu, Y.H.; Yu, T.; Wang, Y.H.; Chen, G.Q.; Tong, X.; Bai, Y.; Xu, C.; Wang, H.B.; Ikuno, N.; et al. Evaluating method and potential risks of chlorine-resistant bacteria (CRB): A review. Water Res. 2021, 188, 116474. [Google Scholar] [CrossRef]
- Ocampo-Rodríguez, D.B.; Vázquez-Rodríguez, G.A.; Martínez-Hernández, S.; Iturbe-Acosta, U.; Coronel-Olivares, C. Desinfección del agua: Una revisión a los tratamientos convencionales y avanzados con cloro y ácido peracético. Ing. Agua. 2022, 26, 185–204. [Google Scholar] [CrossRef]
- Kampf, G. Sodium Hypochlorite. In Antiseptic Stewardship Biocide Resistance and Clinical Implications; Springer: Cham, Switzerland, 2018; pp. 161–210. [Google Scholar]
- Destiani, R.; Templeton, M.R. Chlorination and ultraviolet disinfection of antibiotic-resistant bacteria and antibiotic resistance genes in drinking water. AIMS Environ. Sci. 2019, 6, 222–241. [Google Scholar] [CrossRef]
- Gilca, A.F.; Teodosiu, C.; Fiore, S.; Musteret, C.P. Emerging disinfection by-products: A review on their occurrence and control in drinking water treatment processes. Chemosphere 2020, 259, 127476. [Google Scholar] [CrossRef]
- Kitis, M. Disinfection of wastewater with peracetic acid: A review. Environ. Int. 2004, 30, 47–55. [Google Scholar] [CrossRef] [PubMed]
- Kampf, G. Peracetic Acid. In Antiseptic Stewardship Biocide Resistance and Clinical Implications; Springer: Cham, Switzerland, 2018; pp. 63–98. [Google Scholar]
- Henao, L.D.; Turolla, A.; Antonelli, M. Disinfection by-products formation and ecotoxicological effects of effluents treated with peracetic acid: A review. Chemosphere 2018, 213, 25–40. [Google Scholar] [CrossRef] [PubMed]
- Sun, P.; Zhang, T.; Mejia-Tickner, B.; Zhang, R.; Cai, M.; Huang, C. Rapid disinfection by peracetic acid combined with UV irradiation. Environ. Sci. Technol. Lett. 2018, 5, 400–404. [Google Scholar] [CrossRef]
- Hassaballah, A.H.; Bhatt, T.; Nyitrai, J.; Dai, N.; Sassoubre, L. Inactivation of E. coli, Enterococcus spp., somatic coliphage, and Cryptosporidium parvum in wastewater by peracetic acid (PAA), sodium hypochlorite, and combined PAA-ultraviolet disinfection. Environ. Sci. Water Res. Technol. 2020, 6, 197–209. [Google Scholar] [CrossRef]
- Campo, N.; De Flora, C.; Maffettone, R.; Manoli, K.; Sarathy, S.; Santoro, D.; Gonzalez-Olmos, R.; Auset, M. Inactivation kinetics of antibiotic-resistant Escherichia coli in secondary wastewater effluents by peracetic and performic acids. Water Res. 2019, 169, 115227. [Google Scholar] [CrossRef] [PubMed]
- Luukkonen, T.; Pehkonen, S.O. Peracids in water treatment: A critical review. Crit. Rev. Environ. Sci. Technol. 2017, 47, 1–39. [Google Scholar] [CrossRef]
- Gyürék, L.L.; Finch, G.R. Modeling Water Treatment Chemical Disinfection Kinetics. J. Environ. Eng. 1998, 124, 783–793. [Google Scholar] [CrossRef]
- Chick, H. An investigation of the laws of disinfection. Epidemiol. Infect. 1908, 8, 92–158. [Google Scholar] [CrossRef]
- Watson, H.E. A note on the variation of the rate of disinfection with change in the concentration of the disinfectant. Epidemiol. Infect. 1908, 8, 536–542. [Google Scholar] [CrossRef]
- Rennecker, J.L.; Mariñas, B.J.; Owens, J.H.; Rice, E.W. Inactivation of Cryptosporidium parvum oocysts with ozone. Water Res. 1999, 33, 2481–2488. [Google Scholar] [CrossRef]
- Hom, L.W. Kinetics of chlorine disinfection in an ecosystem. J. Sanit. Eng. Div. 1972, 98, 183–194. [Google Scholar] [CrossRef]
- Selleck, R.E.; Saunier, B.M.; Collins, H.F. Kinetics of bacterial deactivation with chlorine. J. Environ. Eng. Div. 1978, 104, 1197–1212. [Google Scholar] [CrossRef]
- Geeraerd, A.H.; Herremans, C.H.; Van Impe, J.F. Structural model requirements to describe microbial inactivation during a mild heat treatment. Int. J. Food Microbiol. 2000, 59, 185–209. [Google Scholar] [CrossRef] [PubMed]
- Mafart, P.; Couvert, O.; Gaillard, S.; Leguérinel, I. On calculating sterility in thermal preservation methods: Weibull frequency distribution model application. Int. J. Food Microbiol. 2002, 72, 107–113. [Google Scholar] [CrossRef]
- Peleg, M. Microbial Dose-Response Curves and Disinfection Efficacy Models Revisited. Food Eng. Rev. 2021, 13, 305–321. [Google Scholar] [CrossRef]
- Li, G.Q.; Huo, Z.Y.; Wu, Q.Y.; Lu, Y.; Hu, H.Y. Synergistic effect of combined UV-LED and chlorine treatment on Bacillus subtilis spore inactivation. Sci. Total Environ. 2018, 639, 1233–1240. [Google Scholar] [CrossRef]
- Manoli, K.; Sarathy, S.; Maffettone, R.; Santoro, D. Detailed modeling and advanced control for chemical disinfection of secondary effluent wastewater by peracetic acid. Water Res. 2019, 153, 251–262. [Google Scholar] [CrossRef]
- Kong, J.; Lu, Y.; Ren, Y.; Chen, Z.; Chen, M. The virus removal in UV irradiation, ozonation, and Chlorination. Water Cycle 2021, 2, 23–31. [Google Scholar] [CrossRef]
- Tong, C.; Hu, H.; Chen, G.; Li, Z.; Li, A.; Zhang, J. Disinfectant resistance in bacteria: Mechanisms, spread, and resolution strategies. Environ. Res. 2021, 195, 110897. [Google Scholar] [CrossRef]
- Wang, J.; Sui, M.; Yuan, B.; Li, H.; Lu, H. Inactivation of two Mycobacteria by free chlorine: Effectiveness, influencing factors, and mechanisms. Sci. Total Environ. 2019, 648, 271–284. [Google Scholar] [CrossRef] [PubMed]
- Garg, A.; Narasimman, L.M.; Hogg, J.; Nutter, A.; Mahoney, G. Wastewater Disinfection with peracetic acid. Proc. Water Environ. Fed. 2016, 13, 1798–1808. [Google Scholar] [CrossRef]
- Collivignarelli, M.C.; Abbá, A.; Alloisio, G.; Gozio, E.; Benigna, I. Disinfection in wastewater treatment plants: Evaluation of effectiveness and Acute toxicity effects. Sustainability 2017, 9, 1704. [Google Scholar] [CrossRef]
- McFadden, M.; Loconsole, J.; Schockling, A.J.; Nerenberg, R.; Pavissich, J.P. Comparing peracetic acid and hypochlorite for disinfection of combined sewer overflows Effects of suspended-solids and pH. Sci. Total Environ. 2017, 599, 533–539. [Google Scholar] [CrossRef]
- Ragazzo, P.; Chiucchini, N.; Piccolo, V.; Spadolini, M.; Carrer, S.; Zanon, F.; Ronald, G. Wastewater disinfection: Long-term laboratory and full-scale studies on performic acid in comparison with peracetic acid and chlorine. Water Res. 2020, 184, 116169. [Google Scholar] [CrossRef]
- Freitas, B.O.; Leite, L.S.; Daniel, L.A. Chlorine and peracetic acid in decentralizes wastewater treatment: Disinfection, oxidation and odor control. Process Saf. Environ. Protect. 2021, 146, 620–628. [Google Scholar] [CrossRef]
- Koivunen, J.; Heinonen-Tanski, H. Inactivation of enteric microorganisms with chemical disinfectants, UV irradiation, and combined chemical/Uv treatments. Water Res. 2005, 39, 1519–1526. [Google Scholar] [CrossRef]
- Dang, T.T.; Imai, T.; Le, T.V.; Nguyem, D.K.; Higuchi, T.; Kanno, A.; Yamamoto, K.; Sekine, M. Synergistic effect of pressurized carbon dioxide and sodium hypochlorite on the inactivation of Enterococcus sp. in seawater. Water Res. 2016, 106, 204–213. [Google Scholar] [CrossRef]
- Bonetta, S.; Pignata, C.; Bonetta, S.; Amagliani, G.; Brandi, G.; Gilli, G.; Carraro, E. Comparison of UV, Peracetic Acid and Sodium Hypochlorite Treatment in the Disinfection of Urban Wastewater. Pathogens 2021, 10, 182. [Google Scholar] [CrossRef]
- Dunkin, N.; Weng, S.C.; Schwab, K.J.; McQuarrie, J.; Bell, K.Y.; Jacangelo, J.G. Comparative Inactivation of Murine Norovirus and MS2 Bacteriophage by Peracetic Acid and Monochloramina in Municipal Secondary Wastewater Effluent. Environ. Sci. Technol. 2017, 51, 2972–2981. [Google Scholar] [CrossRef]
- Eramo, A.; Medina, W.R.M.; Fahrenfeld, N.L. Peracetic acid disinfection kinetics for combined sewer overflows: Indicator organisms, antibiotic resistance genes, and microbial community. Environ. Sci. Water Res. Technol. 2017, 3, 1061–1072. [Google Scholar] [CrossRef] [PubMed]
- Atlas, R.M. Handbook of Microbiological Media, 4th ed.; Taylor & Francis Group: Washington, DC, USA, 2010; p. 428. [Google Scholar]
- Vos, P.; Garrity, G.; Jones, D.; Krieg, N.; Ludwig, W.; Rainey, F.; Whitman, W. Bergey’s Manual of Systematic Bacteriology, 2nd ed.; Springer: Dordrecht, The Netherlands; Berlin/Heidelberg, Germany; New York, NY, USA, 2009; pp. 21–127, 392–420. [Google Scholar]
- Oviaño, G.M.; Rodríguez, S.B.; Caballero, P.J.D.; Muñoz, B.J.L. Aplicaciones de la Espectrometría de Masas MALDI-TOF en Microbiología Clínica; Sociedad Española de Enfermedades Infecciosas y Microbiología Clínica: Madrid, Spain, 2019; pp. 9–11. [Google Scholar]
- Schoch, C.L.; Ciufo, S.; Domrachev, M.; Hotton, C.L.; Kannan, S.; Khovanskaya, R.; Leipe, D.; Mcveigh, R.; O'Neill, K.; Robbertse, B.; et al. NCBI Taxonomy: A comprehensive updateoncuration, resources and tools. Database: J. Biol. Databases Curation 2020, 2020, baaa062. [Google Scholar] [CrossRef] [PubMed]
- Miles, A.A.; Misra, S.S.; Irwin, J.O. The estimation of the bactericidal power of the blood. Epidemiol. Infect. 1938, 38, 732–749. [Google Scholar] [CrossRef] [PubMed]
- Rochelle, P.A.; Blatchley, E.R., III; Chan, P.S.; Scheible, O.K.; Shen, C. Challenge Organisms for Inactivation of Viruses by Ultraviolet Treatment; Water Research Foundation: Denver, CO, USA, 2010; pp. 16–18. [Google Scholar]
- Adeyemo, F.E.; Singh, G.; Reddy, P.; Bux, F.; Stenström, T.A. The efficiency of chlorine and UV in the inactivation of Cryptosporidium and Giardia in wastewater. PLoS ONE. 2019, 14, e0216040. [Google Scholar] [CrossRef]
- APHA. American Public Health Association. Method 4500-CL: Standard Methods for the Examination of Water and Wastewater, 22nd ed.; American Public Health Association: Washington, DC, USA, 2012; pp. 4–67. [Google Scholar]
- Geeraerd, A.H.; Valdramidis, V.P.; Impe, J.F. GInaFiT, a freeware tool to assess non-log-linear microbial survivor curves. Int. J. Food Microbiol. 2005, 102, 95–105. [Google Scholar] [CrossRef]
- Geldreich, E.E.; Rice, E.W. Occurrence, Significance, and Detection of Klebsiella in Water Systems. J. Am. Water Work. Assoc. 1987, 79, 74–80. [Google Scholar] [CrossRef]
- Vargas, J.A.L.; Toro, L.M.E. K. pneumoniae: ¿la nueva “superbacteria”? Patogenicidad, epidemiología y mecanismos de resistencia. Iatreia 2010, 23, 157–165. [Google Scholar]
- Serna-Galvis, E.A.; Vélez-Peña, E.; Osorio-Vargas, P.; Jiménez, A.N.; Salazar-Ospina, L.; Guaca-González, Y.M.; Torres-Palma, R.A. Inactivation of carbapenem-resistant Klebsiella pneumoniae by photo-Fenton: Residual effect, gene evolution and modifications with citric acid and persulfate. Water Res. 2019, 161, 354–363. [Google Scholar] [CrossRef]
- Popa, L.I.; Gheorghe, I.; Barbu, I.C.; Surleac, M.; Paraschiv, S.; Marutescu, L.; Popa, M.; Piracalabioru, G.G.; Talapan, D.; Nita, M.; et al. Multidrug Resistant Klebsiella pneumoniae ST101 Clone Survival Chain From Inpatients to Hospital Effluent After Chlorine Treatment. Front. Microbiol. 2021, 11, 610296. [Google Scholar] [CrossRef]
- Paes, F.A.; Hissa, D.C.; Angelim, A.L.; Pinto, A.W.; Grangeiro, T.B.; Melo, V.M.M. Diversity of a Chlorine-Resistant Bacillus Population Isolated from a Wastewater Treatment Station. Water Environ. Res. 2012, 84, 274–281. [Google Scholar] [CrossRef]
- Sagripanti, J.L.; Bonifacino, A. Comparative Sporicidal Effects of Liquid Chemical Agents. Appl. Environ. Microbiol. 1996, 62, 545–551. [Google Scholar] [CrossRef] [PubMed]
- Bridier, A.; Briandet, R.; Thomas, V.; Dubois-Brissonnet, F. Comparative biocidal activity of peracetic acid, benzalkonium chloride, and ortho-phthalaldehyde on 77 bacterial strains. J. Hosp. Infect. 2011, 78, 208–213. [Google Scholar] [CrossRef] [PubMed]
- Mir, J.; Morató, J.; Ribas, F. Resistance to chlorine of freshwater bacterial strains. J. Appl. Microbiol. 1997, 87, 7–18. [Google Scholar] [CrossRef] [PubMed]
- Nizer, W.S.C.; Inkovskiy, V.; Overhage, J. Surviving Reactive chlorine Stress: Responses of Gram-Negative Bacteria to Hypochlorous Acid. Microorganisms 2020, 8, 1220. [Google Scholar] [CrossRef]
- Jiménez, L.C.; Rojas-Jiménez, K. Resistencia a desinfectantes y su relación con la resistencia a los antibióticos. Acta Médica Costarriencense 2020, 62, 7–12. [Google Scholar]
- Bock, L.J.; Wand, M.E.; Sutton, J.M. Varying activity of chlorhexidine-based disinfectants against Klebsiella pneumoniae clinical isolates and adapted strains. J. Hosp. Infect. 2016, 93, 42–48. [Google Scholar] [CrossRef]
- Cho, M.; Chung, H.; Yoon, J. Quantitative Evaluation of the synergistic Sequential Inactivation of Bacillus subtilis Spores with Ozone Followed by Chlorine. Environ. Sci. Technol. 2003, 37, 2134–2138. [Google Scholar] [CrossRef]
- Choi, Y.; Byun, S.H.; Jang, H.J.; Kim, S.E.; Choi, Y. Comparison of disinfectants for drinking water: Chlorine gas vs. On-site generated chlorine. Environ. Eng. Res. 2022, 27, 200543. [Google Scholar] [CrossRef]
- Cho, M.; Kim, J.H.; Yoon, J. Investigating synergism during sequential inactivation of Bacillus subtilis spores with several disinfectants. Water Res. 2006, 40, 2911–2920. [Google Scholar] [CrossRef]
- Drogui, P.; Daghrir, R. Chlorine for water disinfection: Properties, applications, and health effects. In CO2 Sequestration, Biofuels and Depollution; Lichtfouse, E., Schwarzbauer, J., Robert, D., Eds.; Springer International Publishing: Cham, Switzerland, 2015; pp. 1–32. [Google Scholar]
- Setlow, B.; Korza, G.; Blatt, K.M.S.; Fey, J.P.; Setlow, P. Mechanism of Bacillus subtilis spore inactivation by and resistance to supercritical CO2 plus peracetic acid. J. Appl. Microbiol. 2015, 120, 57–69. [Google Scholar] [CrossRef]
- Alasari, A.; Valverde, M.; Roques, C.; Michel, G.; Cabassud, C.; Aptel, P. Sporicidal properties of peracetic acid and hydrogen peroxide, alone and in combination, in comparison with chlorine and formaldehyde for ultrafiltration membrane disinfection. Can. J. Microbiol. 1993, 39, 52–60. [Google Scholar] [CrossRef] [PubMed]
- Martin, D.J.H.; Denyer, S.P.; McDonnell, G.; Maillard, J.Y. Resistance and cross-resistance to oxidizing agents of bacterial isolates from endoscope washer disinfectors. J. Hosp. Infect. 2008, 69, 377–383. [Google Scholar] [CrossRef] [PubMed]
- Larson, M.A.; Mariñas, B.J. Inactivation of Bacillus subtilis spores with ozone and monochloramine. Water Res. 2003, 37, 833–844. [Google Scholar] [CrossRef] [PubMed]
- Aronson, A.; Fitz-James, P. Structure and Morphogenesis of the Bacterial Spore Coat. Bacteriol. Rev. 1976, 40, 360–402. [Google Scholar] [CrossRef] [PubMed]
- Leaper, S. Synergistic killing of spores of Bacillus subtilis by peracetic acid and alcohol. J. Food Technol. 1984, 19, 355–360. [Google Scholar] [CrossRef]
- Aguilar, S.; Rosado, D.; Moreno-Andrés, J.; Cartuche, L.; Cruz, D.; Acevedo-Merino, A.; Nebot, E. Inactivation of a wild isolated Klebsiella pneumoniae by photo-chemical processes: UV-C, UV-C/H2O2, and UV-C/H2O2/Fe3+. Catal. Today 2017, 313, 94–99. [Google Scholar] [CrossRef]
- Leggett, M.J.; Schwarz, J.S.; Burke, P.A.; Mcdonnell, G.; Denyer, S.P.; Maillard, J.Y. Resistance to and killing by the sporicidal microbicide peracetic acid. J. Antimicrob. Chemother. 2015, 70, 773–779. [Google Scholar] [CrossRef]
- Artíguez, M.L.; Marañon, I.M. Inactivation of spores and vegetative cells of Bacillus subtilis and Geobacillus stearothermophilus by pulsed light. Innov. Food Sci. Emerg. Technol. 2015, 28, 52–58. [Google Scholar] [CrossRef]

 and
and  endospores of Bacillus subtilis).
and endospores of Bacillus subtilis).
endospores of Bacillus subtilis).
and endospores of Bacillus subtilis).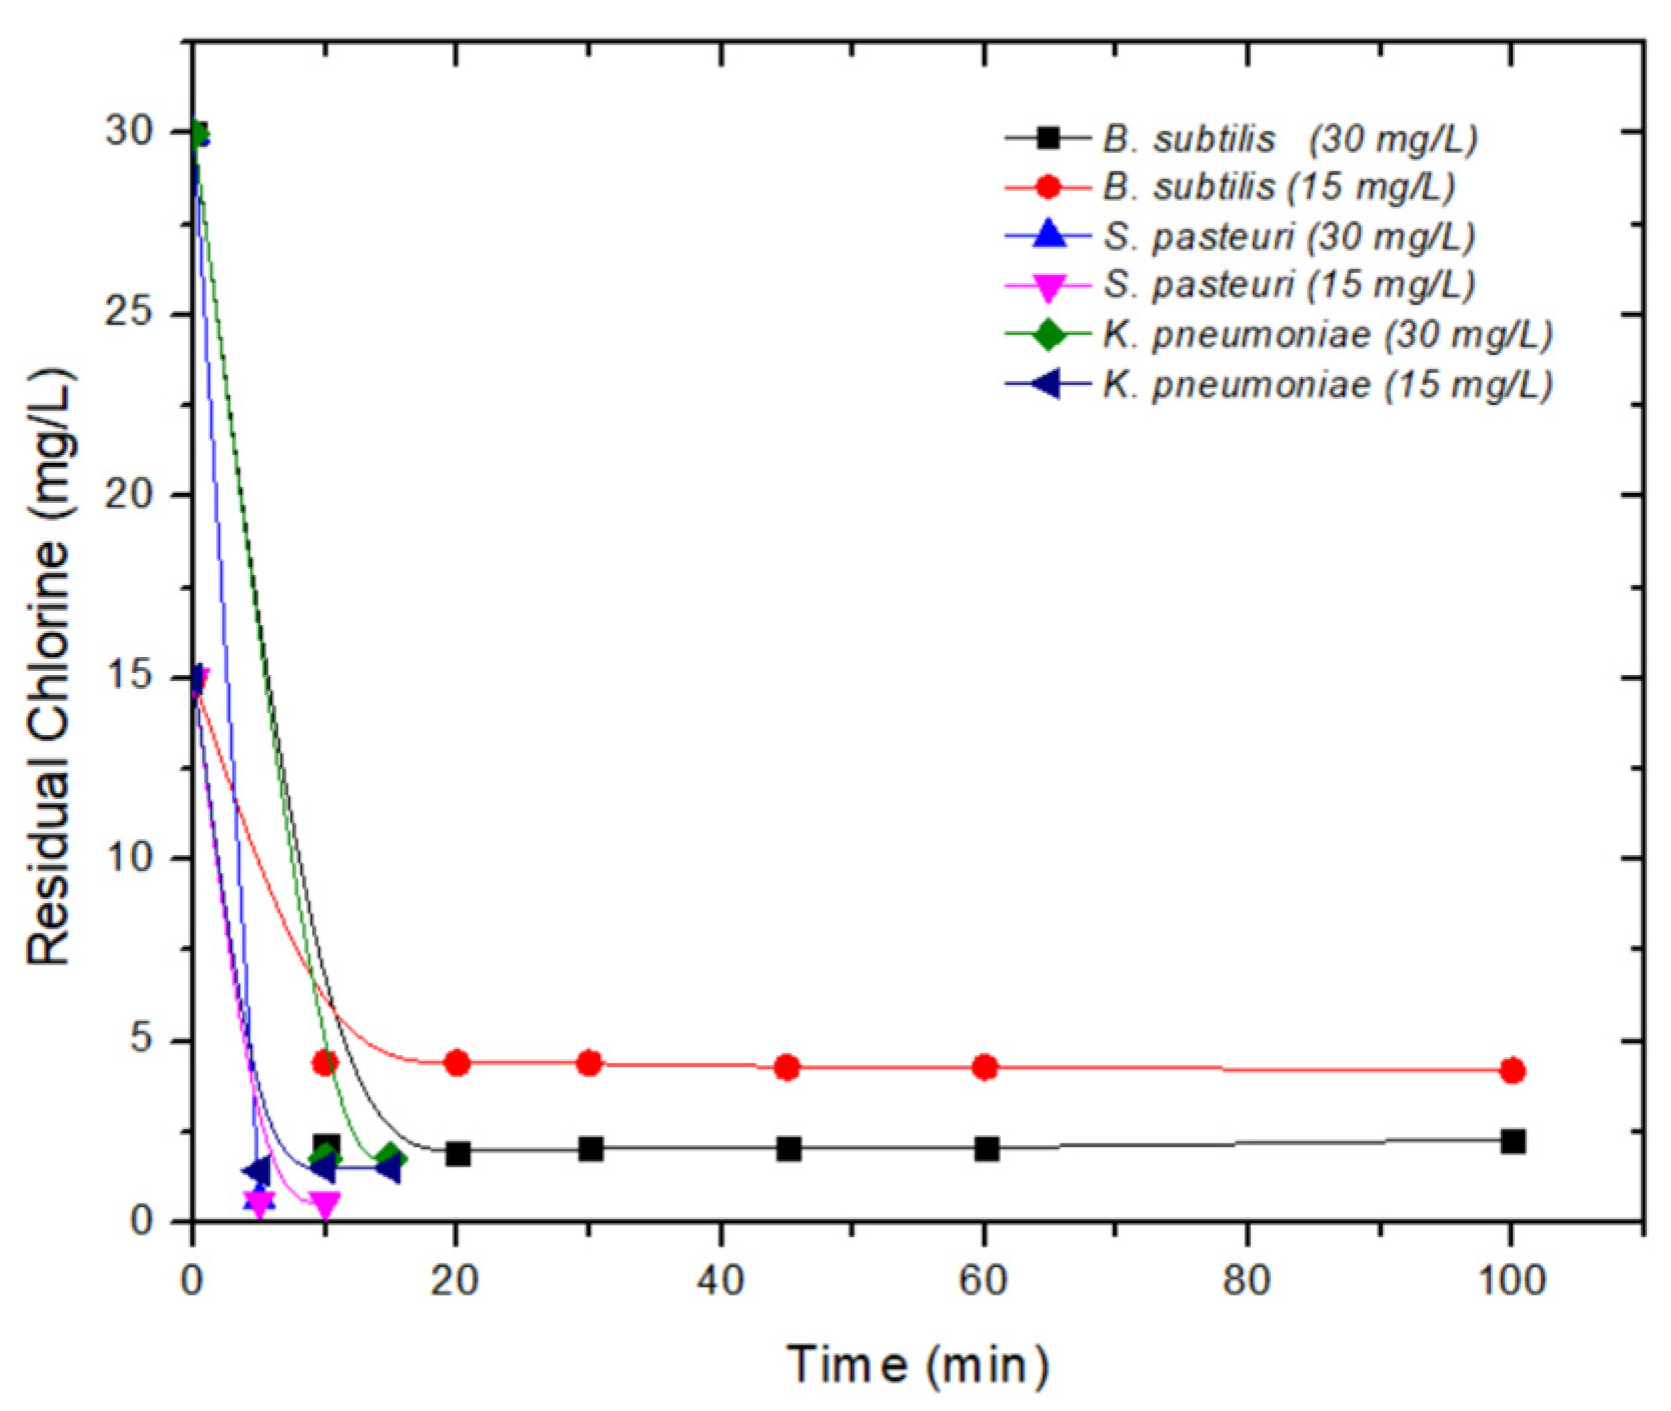
 and
and  endospores of Bacillus subtilis).
and endospores of Bacillus subtilis).
endospores of Bacillus subtilis).
and endospores of Bacillus subtilis).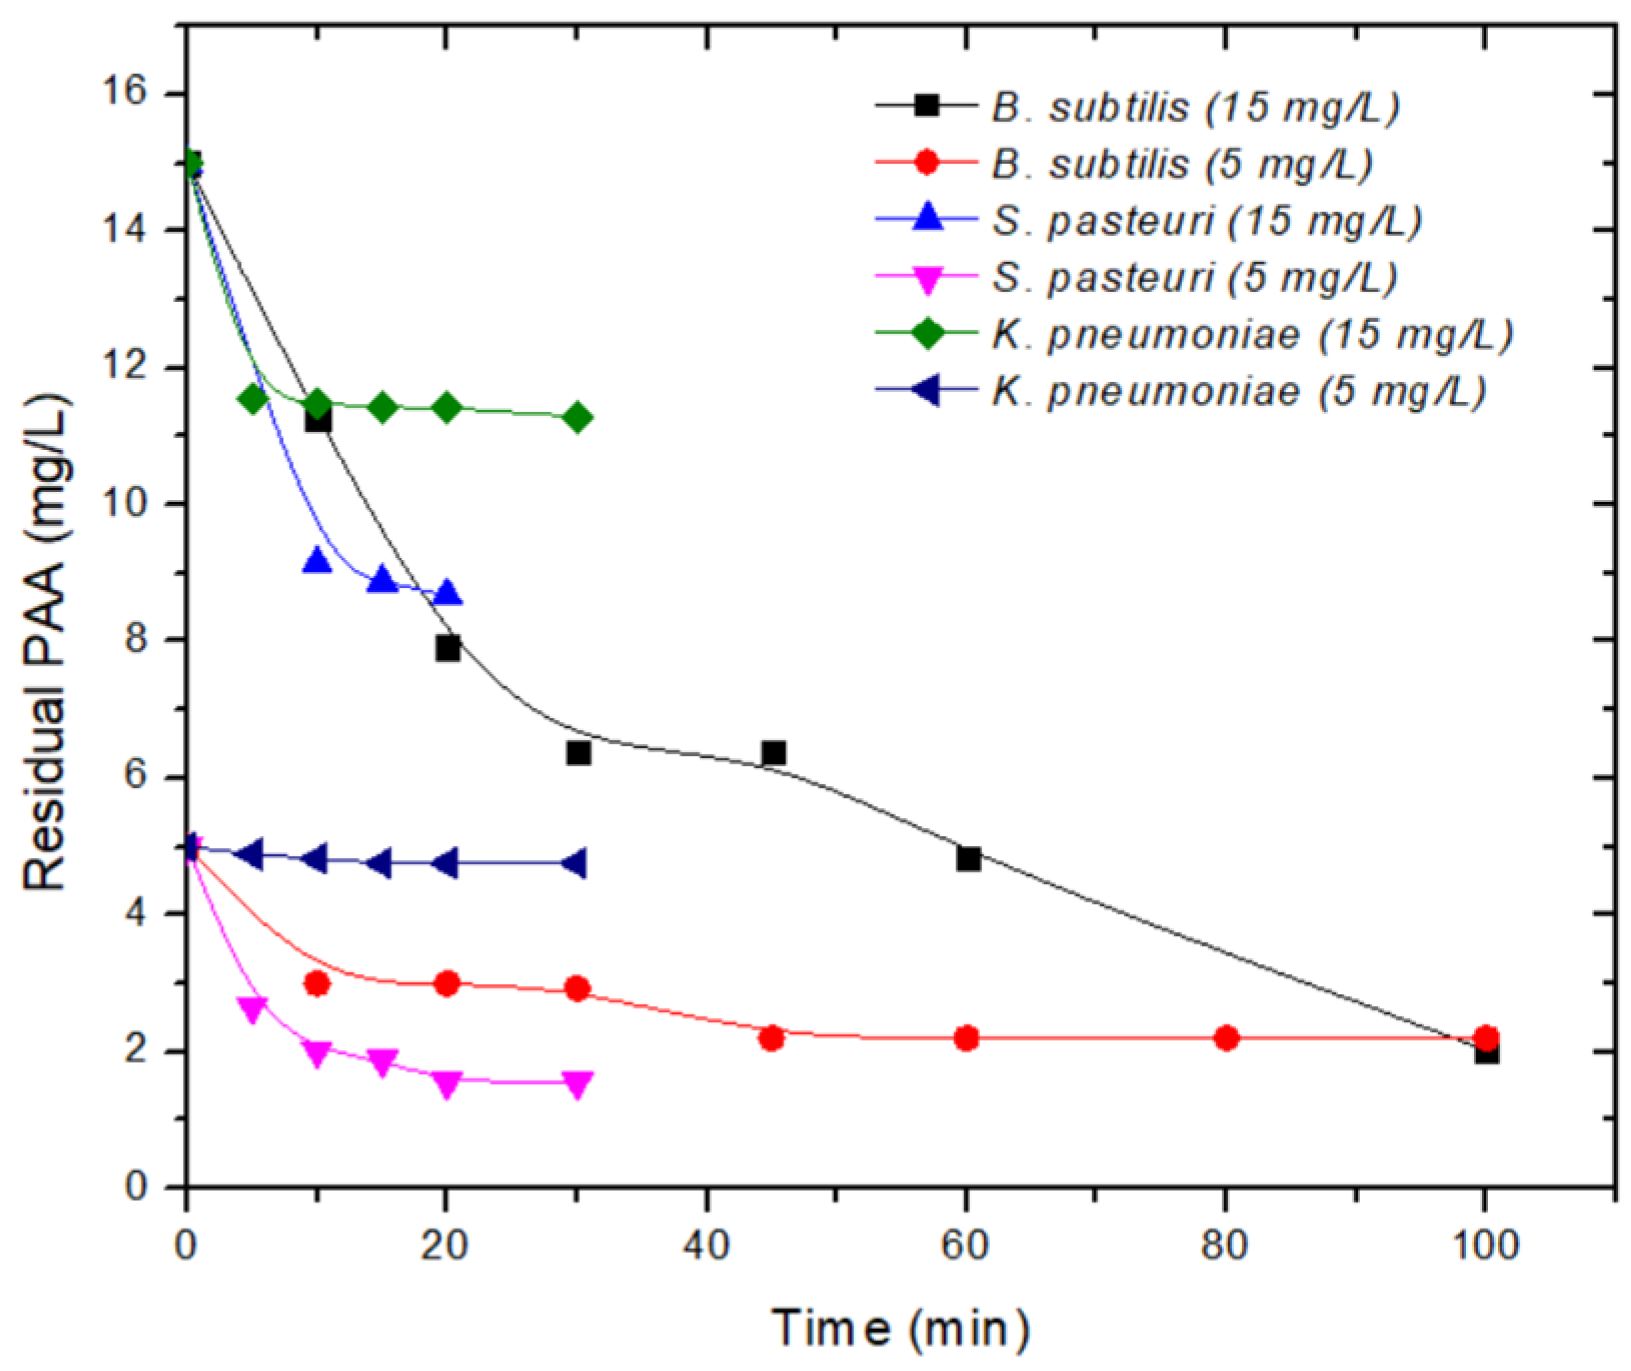
 and
and  endospores of Bacillus subtilis).
 and
and  endospores of Bacillus subtilis).
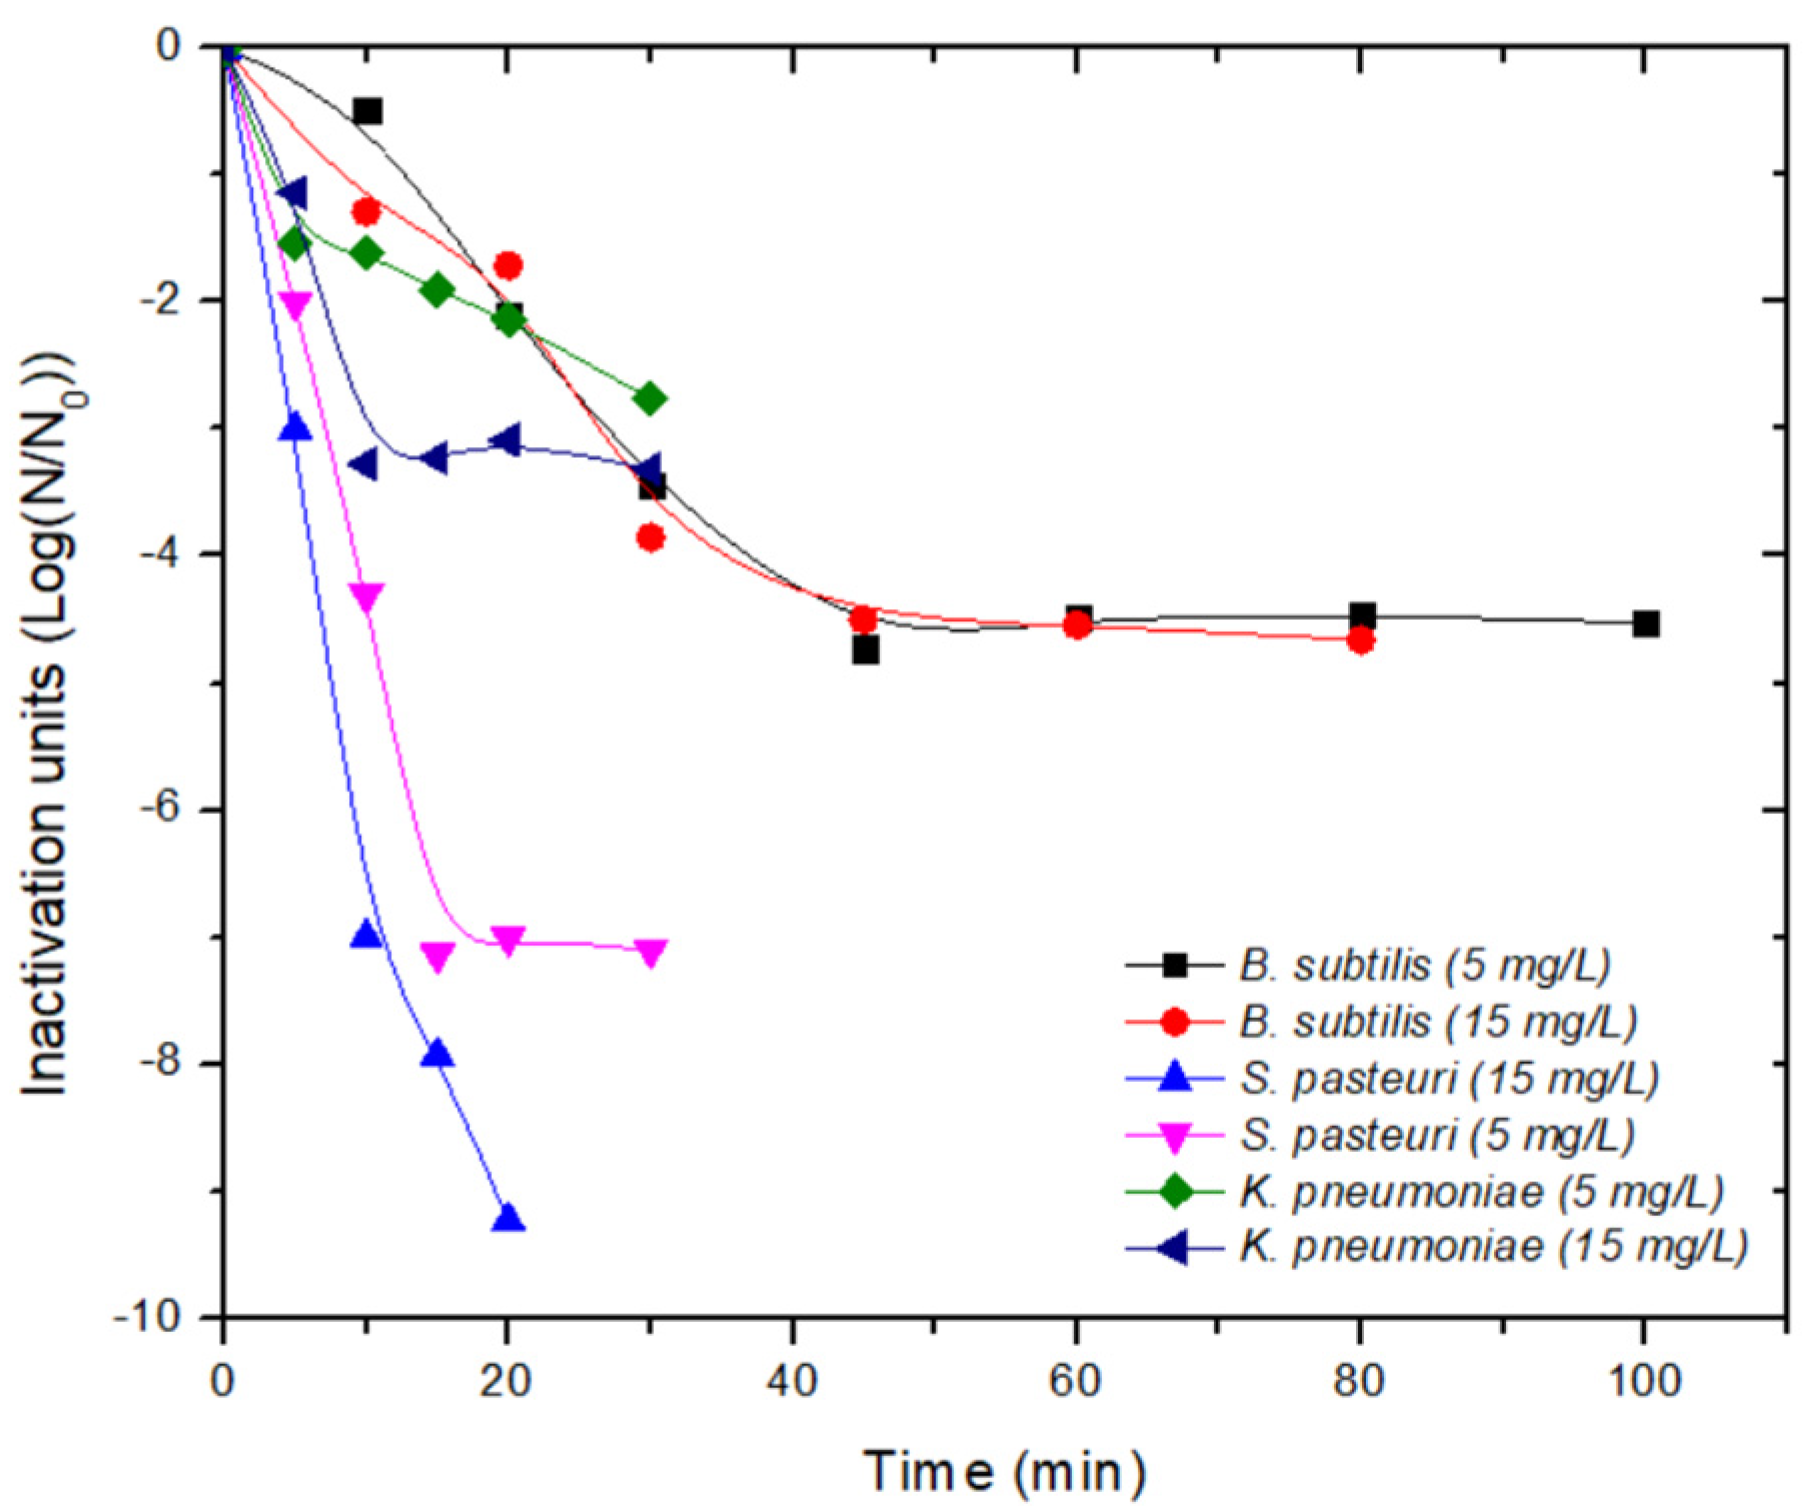


| Parameter | Mean Value | Standard Deviation (n = 5) |
|---|---|---|
| T (°C) | 20.7 | 1.71 |
| pH | 7.54 | 0.57 |
| ORP | 128 | 102 |
| DO (mg/L) | 15.7 | 26 |
| EC (µS/cm) | 1833.8 | 94.1 |
| TDS (mg/L) | 916.8 | 46.8 |
| Salinity (PSU) | 0.93 | 0.05 |
| TSS (mg/L) 1 | 13.6 | 6.07 |
| COD (mg/L) 1 | 31.6 | 9.96 |
| BOD5 (mg/L) 1 | 16.9 | 4.42 |
| Strain | Shape | Margin | Elevation | Color | Texture |
|---|---|---|---|---|---|
| 1EB9 | Circular | Entire | Flat | Yellow | Smooth |
| 1EB10 | Circular | Entire | Drop-like | White | Smooth |
| 5EE7 | Concentric | Undulate | Umbonate | White | Rough |
| Strain | Surface Growth | Opacity | Sediment | Amount Sediment |
|---|---|---|---|---|
| 1EB9 | Null | Translucent | Compact | Scarce |
| 1EB10 | Null | Opaque | Compact | Abundant |
| 5EE7 | Pellicle | Transparent | Granular | Abundant |
| Strain | F | Gram | ES | C | HC | ST (6.5%) (10%) | VP | MR | I | H2S | LD | LA | HS | GL | CT | |
|---|---|---|---|---|---|---|---|---|---|---|---|---|---|---|---|---|
| 1EB9 | Spheres | + | − | − | − | + | + | − | + | − | − | − | + | − | − | + |
| 1EB10 | Rod | − | − | + | + | + | − | + | + | − | − | − | − | − | − | +r |
| 5EE7 | Rod | + | + | + | + | + | + | + | − | − | − | − | − | + | + | + |
| Bacillus subtilis 1 | Rod | + | + | + | + | + | + | + | − | − | − | − | − | + | + | + |
| Strain | Name | Score | NCBI Code |
|---|---|---|---|
| 1EB9 | Staphylococcus pasteuri | 2.23 | 45972-Staphylococcus pasteuri DSM 10657 DSM |
| 1EB10 | Klebsiella pneumoniae | 2.38 | 72407-Klebsiella pneumoniae ssp. pneumoniae 9295_1 CHB |
| 5EE7 | Bacillus subtilis | 2.45 | 135461-Bacillus subtilis ssp. subtilis DSM 10T DSM |
| Strain | Staphylococcus pasteuri | Klebsiella pneumoniae | Bacillus subtilis1 | |||||||
|---|---|---|---|---|---|---|---|---|---|---|
| Disinfectant | C (mg/L) | T (min) | IU (log N/N0) | C·t (mg·min/L) | T (min) | IU (log N/N0) | C·t (mg·min/L) | T (min) | IU (log N/N0) | C·t (mg·min/L) |
| NaClO | 15 | 10 | −12.70 | 5.68 | 5 | −5.12 | 7.13 | 100 | −3.6 | 418.74 |
| 15 | −8.25 | 40.50 | ||||||||
| 30 | 5 | −13.51 | 3.32 | 10 | −4.65 | 17.61 | 45 | −4.19 | 91.87 | |
| 15 | −9.12 | 26.78 | 100 | −5.56 | 229.78 | |||||
| PAA | 5 | 10 | −4.3 | 20.13 | 30 | −2.76 | 142.75 | 60 | −4.48 | 132 |
| 30 | −7.10 | 46.67 | 100 | −4.53 | 220 | |||||
| 15 | 10 | −7.00 | 91.37 | 30 | −3.31 | 338.32 | 45 | −4.5 | 287.31 | |
| 20 | −9.23 | 173.59 | 100 | −4.66 | 202.56 | |||||
| Disinfection with NaClO | |||||||||||
| Model | Chick Log-Linear Regression | Weibull Concave | Geeraerd Log-Linear + Tail | ||||||||
| Strain | C | Kmax | R2 | Δ | p | log (N0) | R2 | Kmax | log (Nres) | log (N0) | R2 |
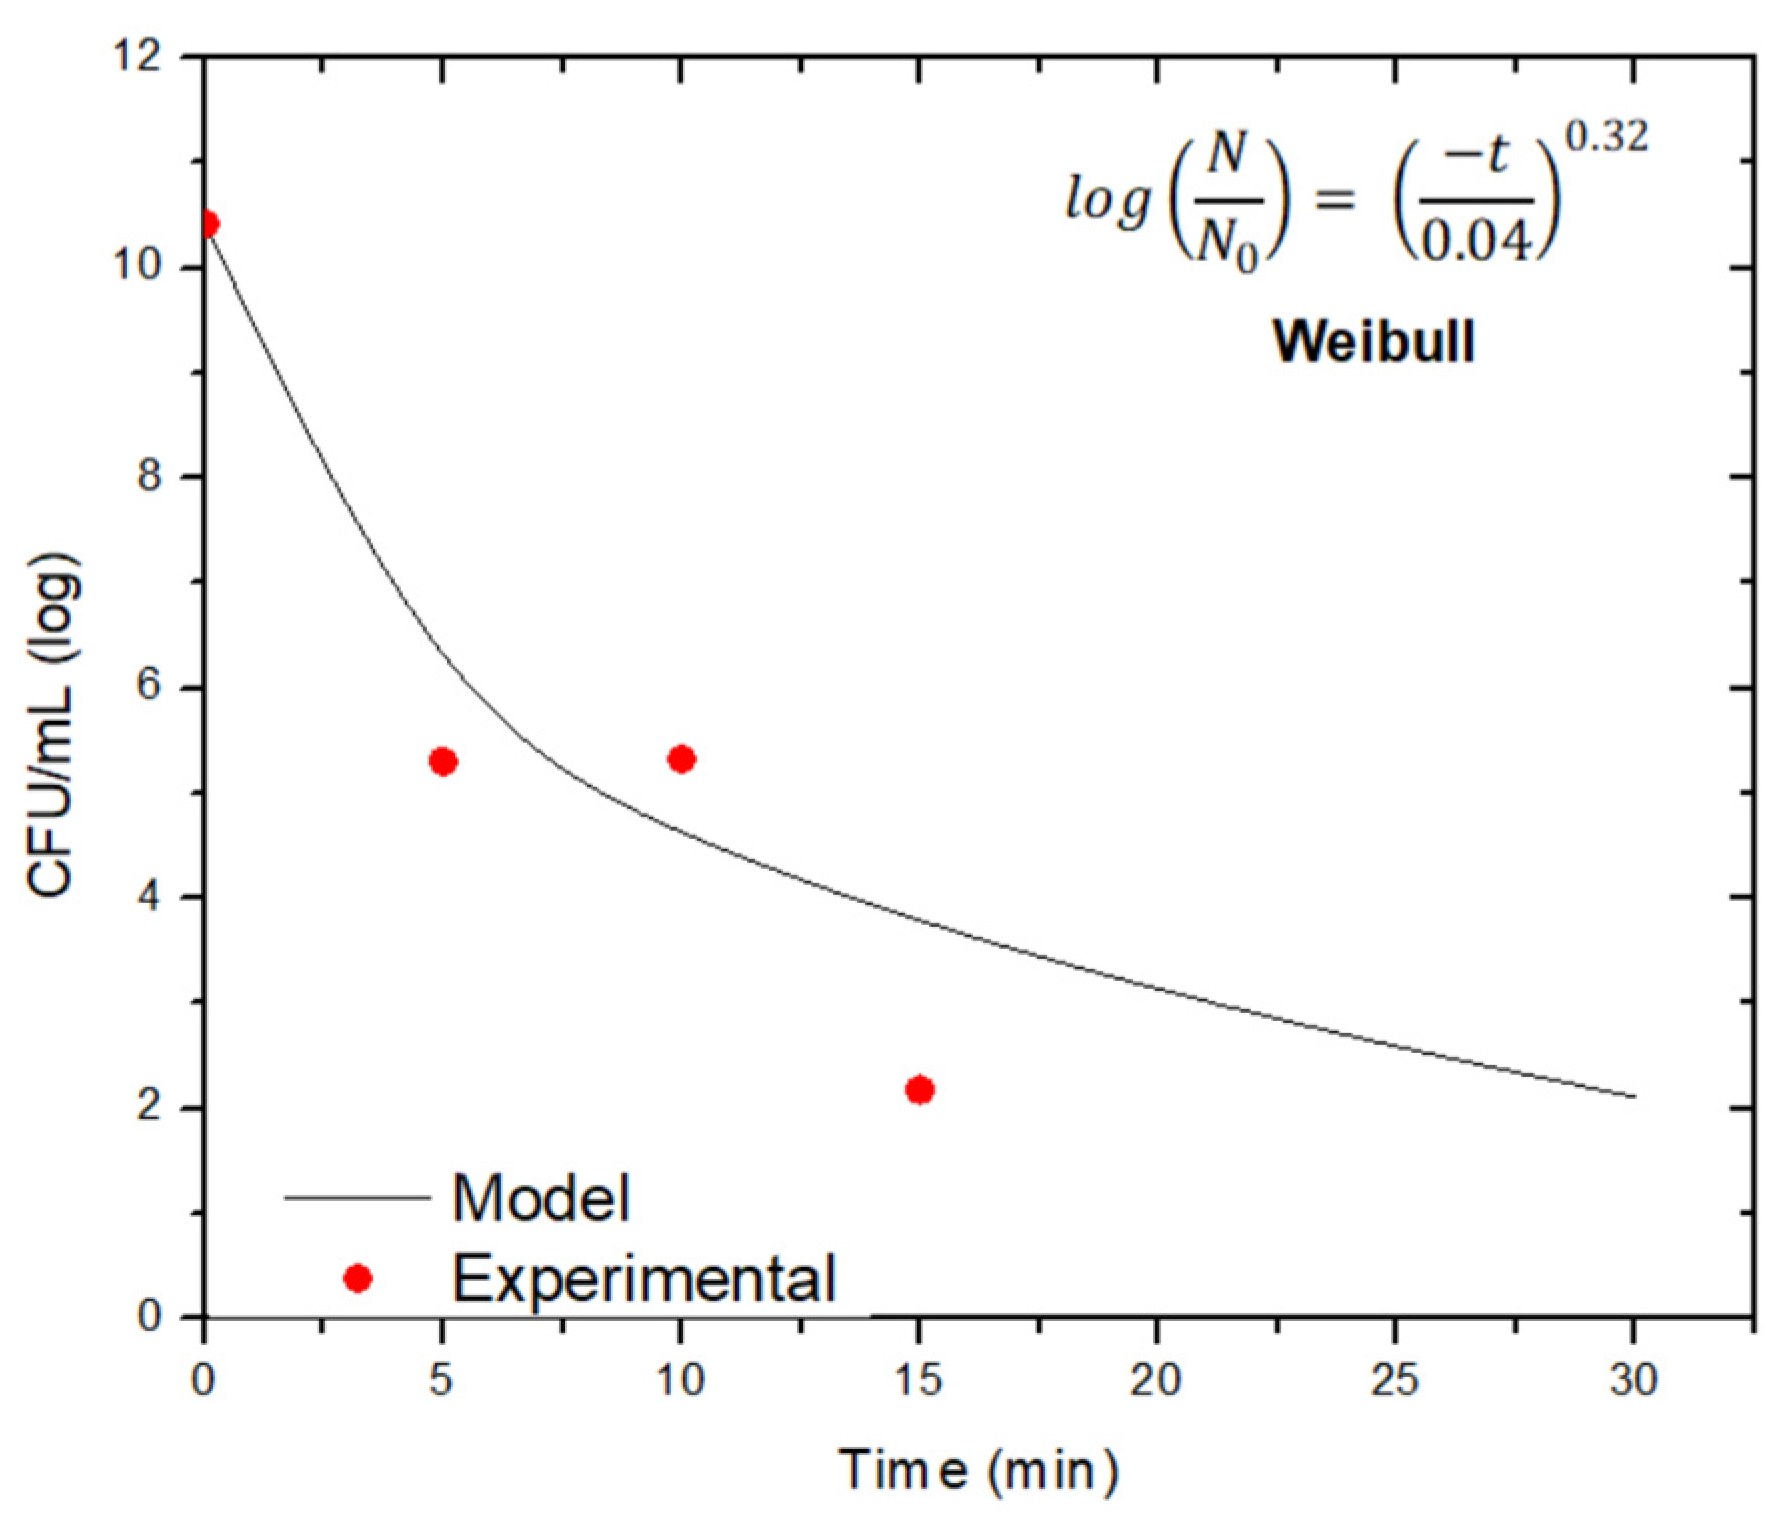
| Klebsiella pneumoniae | 15 | 0.49 | 0.5839 | 0.04 | 0.32 | 10.35 | 0.9062 | 2.36 | 3.48 | 10.42 | 0.8705 |
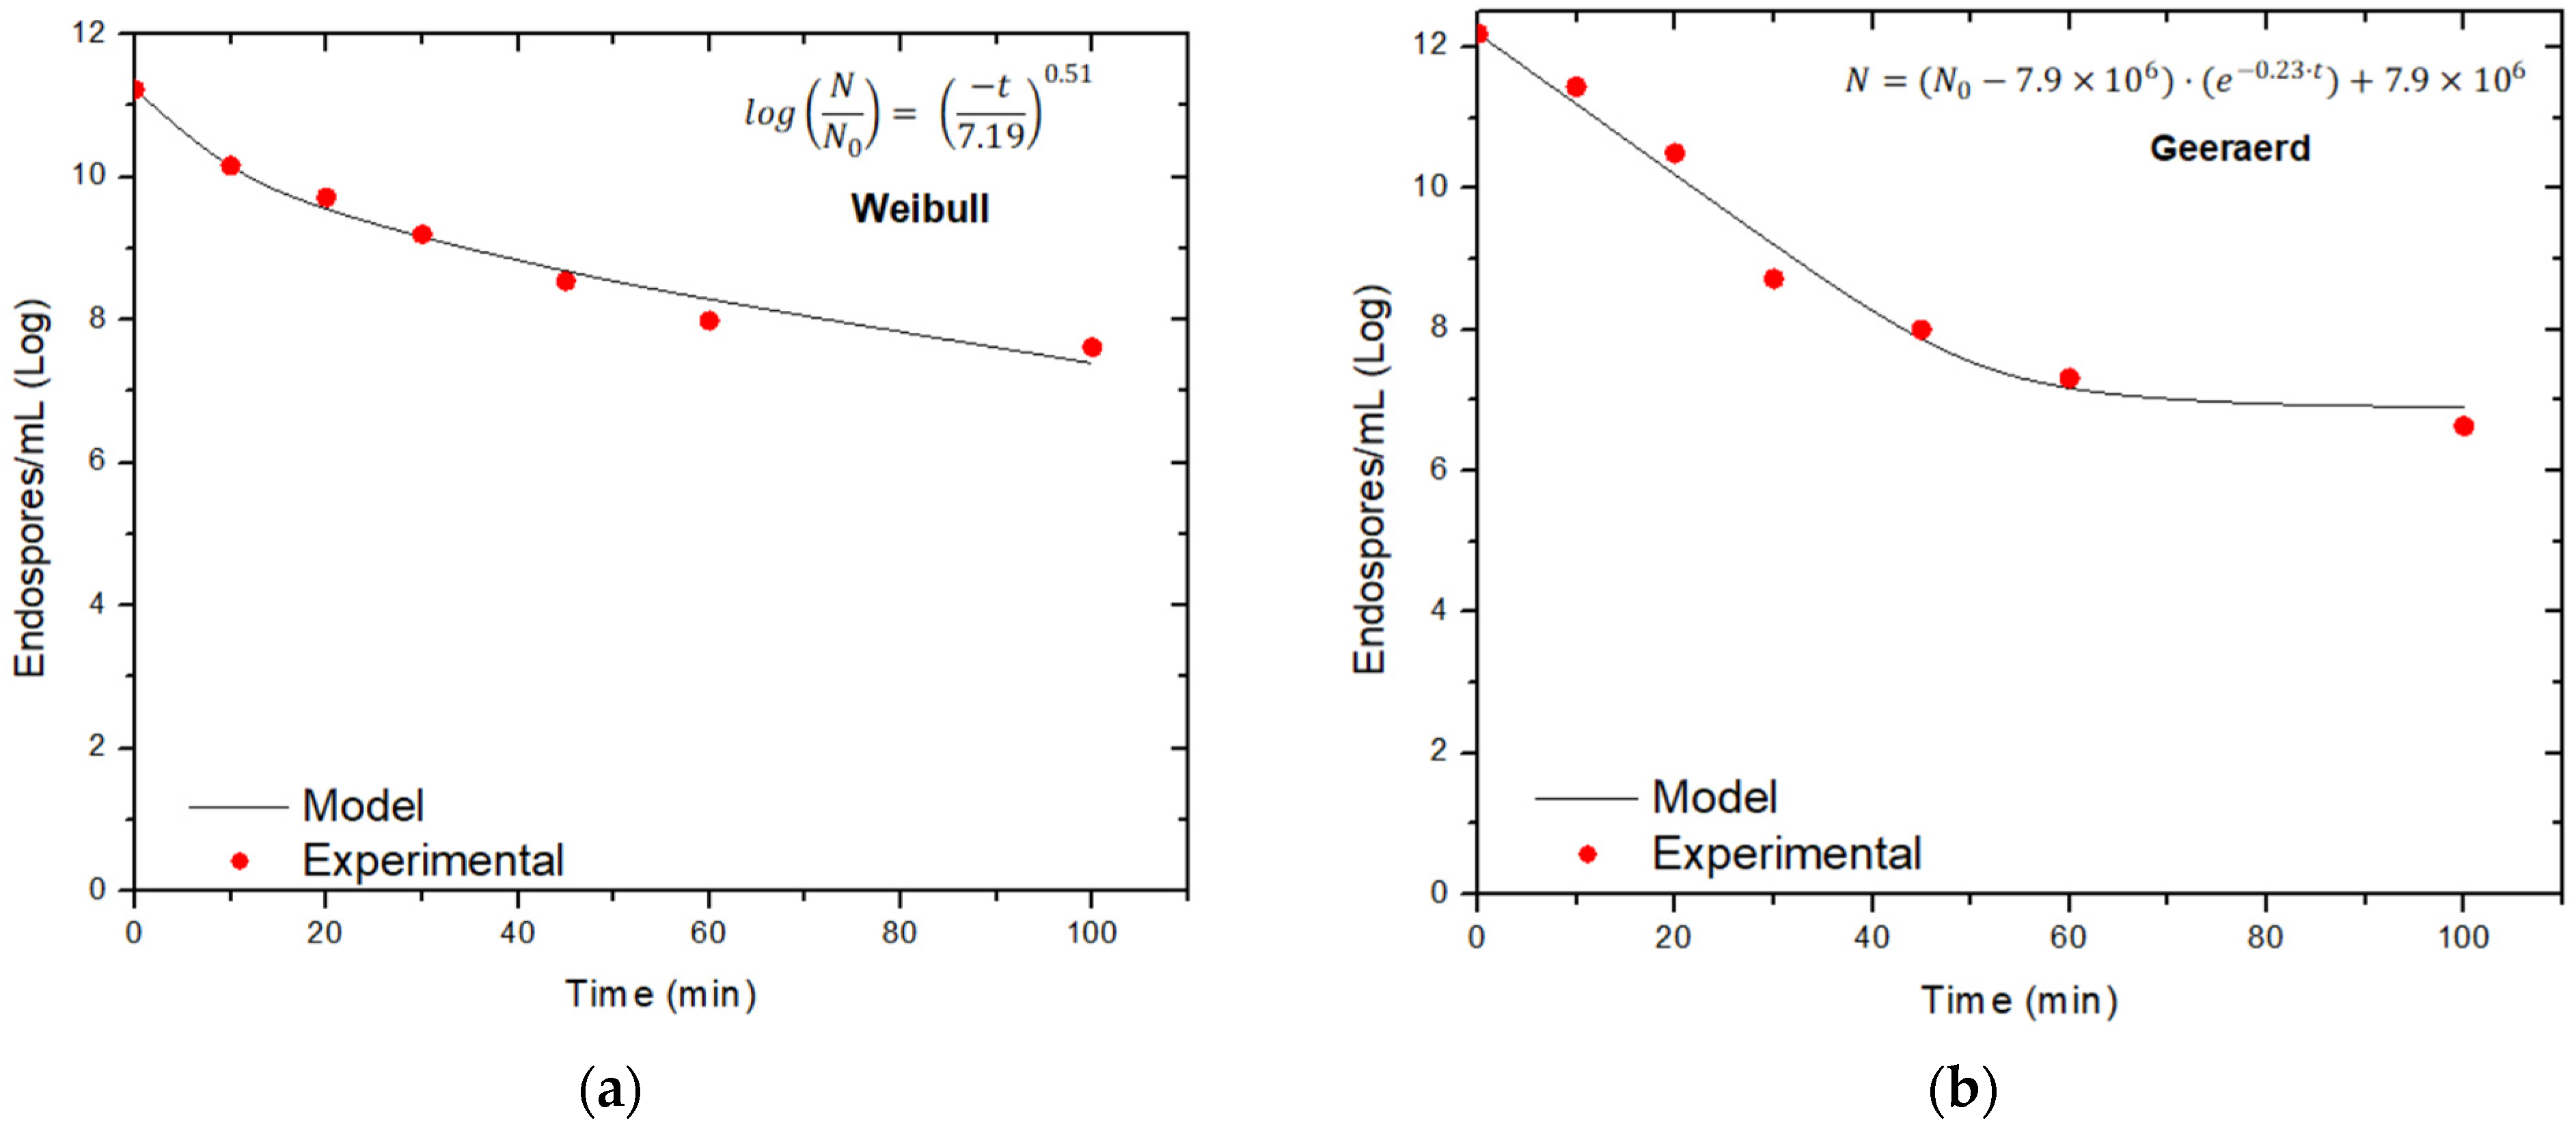
| Bacillus subtilis | 15 | 0.08 | 0.8812 | 7.19 | 0.51 | 11.26 | 0.9866 | 0.13 | 7.74 | 10.97 | 0.9822 |
| 30 | 0.13 | 0.8543 | 10.32 | 0.77 | 11.61 | 0.9015 | 0.23 | 6.90 | 12.26 | 0.9783 | |
| Disinfection with PAA | |||||||||||
| Model | Chick Log-Linear Regression | Weibull Concave | Geeraerd Log-Linear + Tail | ||||||||
| Strain | C | Kmax | R2 | Δ | p | log (N0) | R2 | Kmax | log (Nres) | log (N0) | R2 |
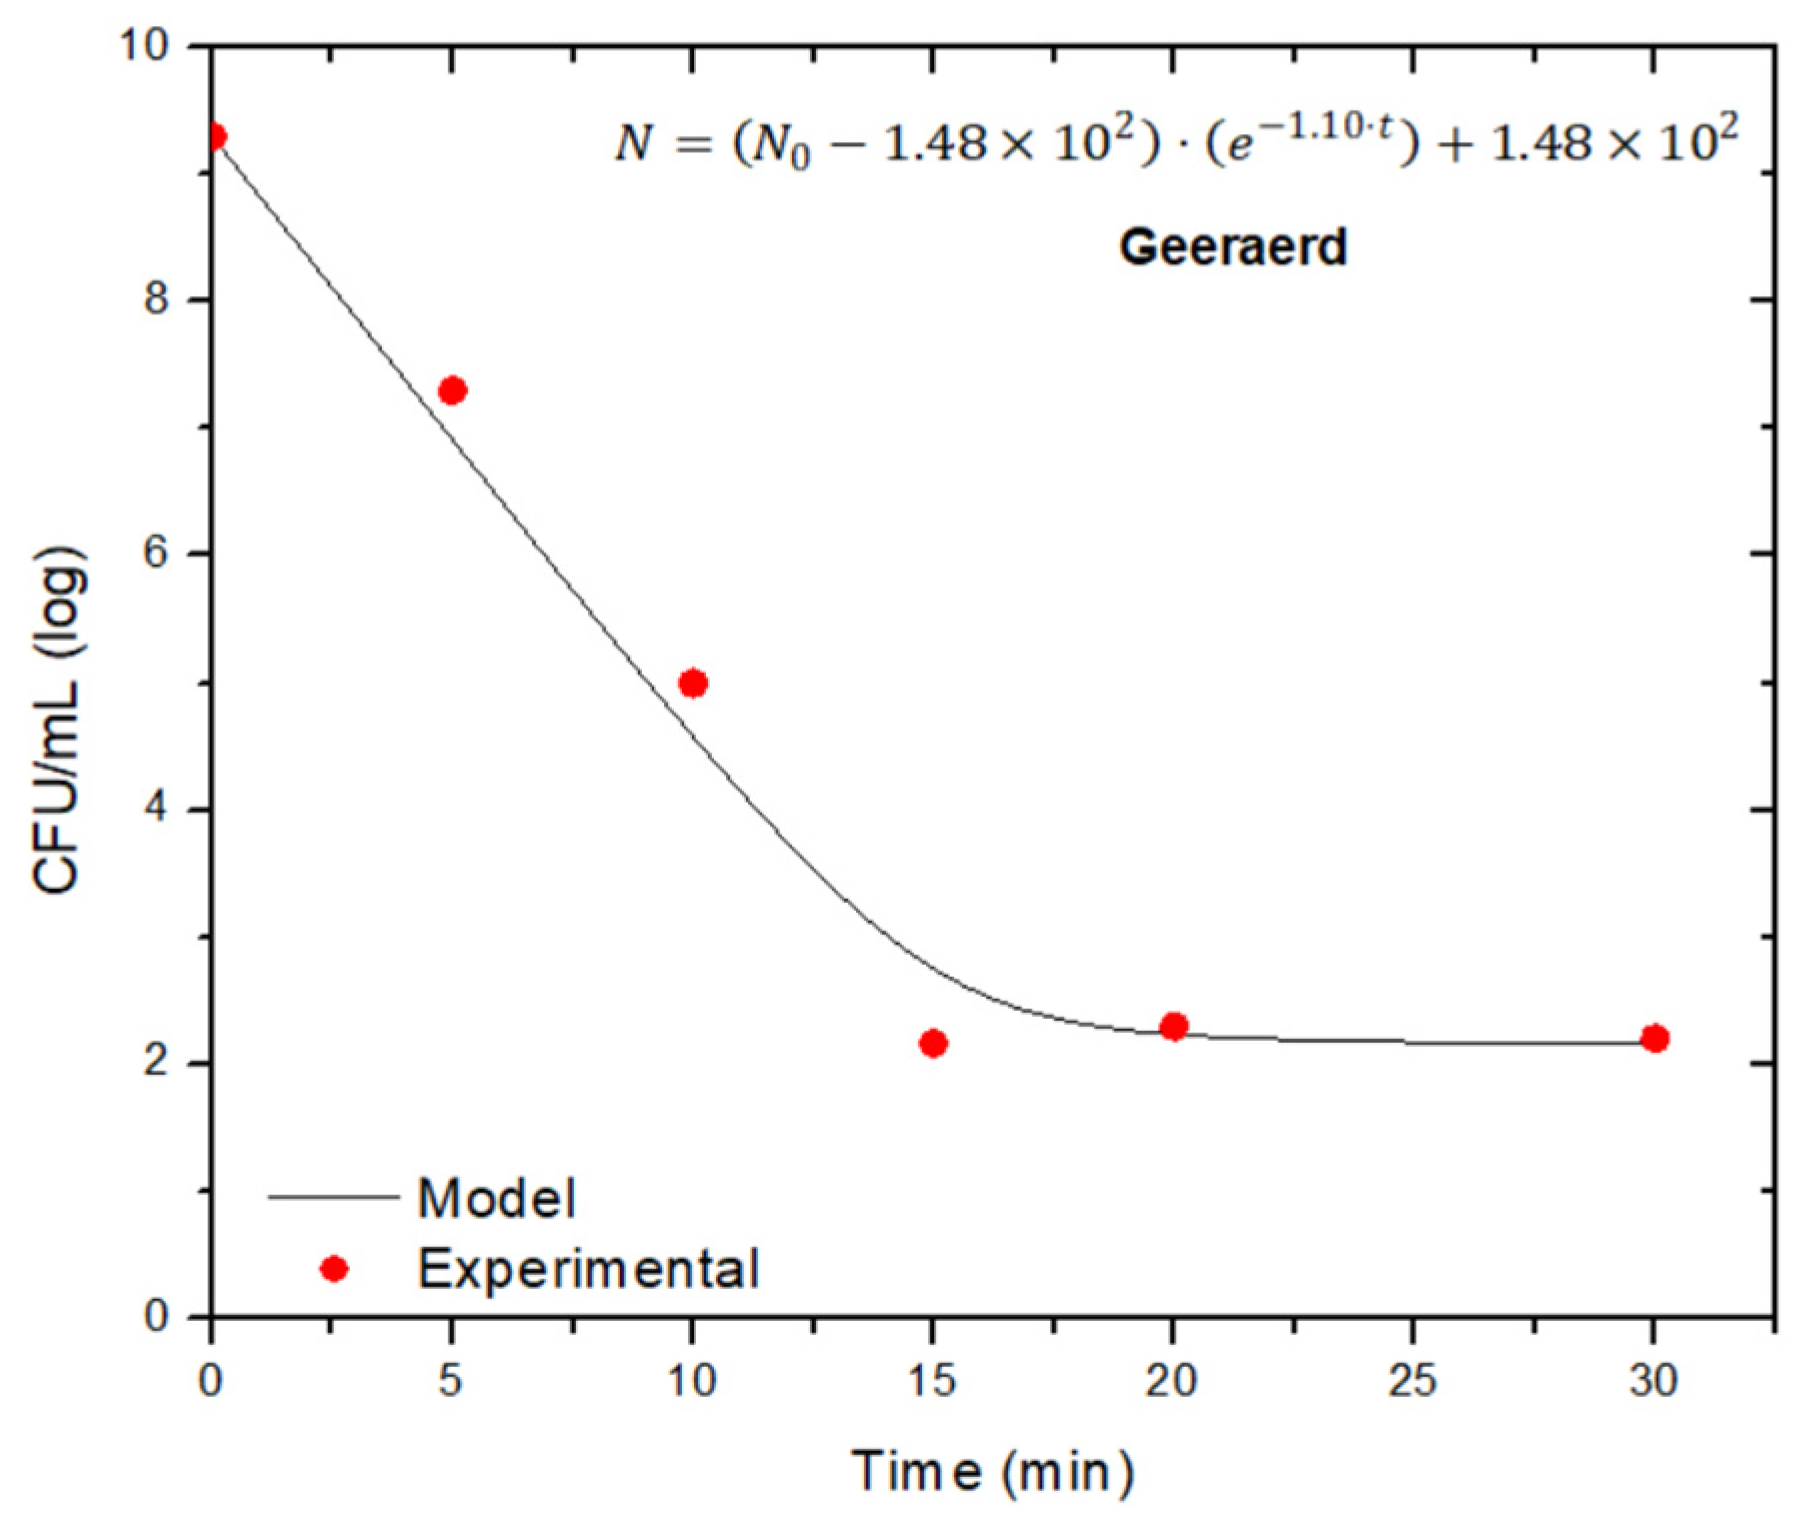
| Staphylococcus pasteuri | 5 | 0.58 | 0.7853 | 0.48 | 0.51 | 9.49 | 0.8958 | 1.10 | 2.17 | 9.51 | 0.9930 |
| Klebsiella pneumoniae | 5 | 0.18 | 0.8227 | 2.41 | 0.38 | 8.74 | 0.9767 | 0.27 | 6.15 | 8.36 | 0.8659 |
| 15 | 0.24 | 0.6282 | 1.08 | 0.37 | 10.38 | 0.8436 | 0.78 | 7.27 | 10.72 | 0.9683 | |
| Bacillus subtilis | 5 | 0.11 | 0.7090 | 2.45 | 0.46 | 0.25 | 0.8508 | 0.28 | 6.44 | 11.31 | 0.9858 |
| 15 | 0.11 | 0.6993 | 2.05 | 0.44 | 11.21 | 0.8705 | 0.28 | 6.45 | 11.14 | 0.9749 | |
Disclaimer/Publisher’s Note: The statements, opinions and data contained in all publications are solely those of the individual author(s) and contributor(s) and not of MDPI and/or the editor(s). MDPI and/or the editor(s) disclaim responsibility for any injury to people or property resulting from any ideas, methods, instructions or products referred to in the content. |
© 2023 by the authors. Licensee MDPI, Basel, Switzerland. This article is an open access article distributed under the terms and conditions of the Creative Commons Attribution (CC BY) license (https://creativecommons.org/licenses/by/4.0/).
Share and Cite
Ocampo-Rodríguez, D.B.; Vázquez-Rodríguez, G.A.; Rodríguez, J.A.; González Sandoval, M.d.R.; Iturbe-Acosta, U.; Martínez Hernández, S.; Coronel-Olivares, C. Kinetic Models of Disinfection with Sodium Hypochlorite and Peracetic Acid of Bacteria Isolated from the Effluent of a WWTP. Water 2023, 15, 2019. https://doi.org/10.3390/w15112019
Ocampo-Rodríguez DB, Vázquez-Rodríguez GA, Rodríguez JA, González Sandoval MdR, Iturbe-Acosta U, Martínez Hernández S, Coronel-Olivares C. Kinetic Models of Disinfection with Sodium Hypochlorite and Peracetic Acid of Bacteria Isolated from the Effluent of a WWTP. Water. 2023; 15(11):2019. https://doi.org/10.3390/w15112019
Chicago/Turabian StyleOcampo-Rodríguez, Dulce Brigite, Gabriela A. Vázquez-Rodríguez, José Antonio Rodríguez, María del Refugio González Sandoval, Ulises Iturbe-Acosta, Sylvia Martínez Hernández, and Claudia Coronel-Olivares. 2023. "Kinetic Models of Disinfection with Sodium Hypochlorite and Peracetic Acid of Bacteria Isolated from the Effluent of a WWTP" Water 15, no. 11: 2019. https://doi.org/10.3390/w15112019
APA StyleOcampo-Rodríguez, D. B., Vázquez-Rodríguez, G. A., Rodríguez, J. A., González Sandoval, M. d. R., Iturbe-Acosta, U., Martínez Hernández, S., & Coronel-Olivares, C. (2023). Kinetic Models of Disinfection with Sodium Hypochlorite and Peracetic Acid of Bacteria Isolated from the Effluent of a WWTP. Water, 15(11), 2019. https://doi.org/10.3390/w15112019