Article

Removal of NOMs by Carbon Nanotubes/Polysulfone Nanocomposite Hollow Fiber Membranes for the Control of Disinfection Byproducts (DBPs)

Department of Civil & Environmental Engineering, University of Missouri, Columbia, MO 65211, USA
*
Author to whom correspondence should be addressed.
Water 2023, 15(11), 2054; https://doi.org/10.3390/w15112054
Submission received: 30 January 2023 / Revised: 23 April 2023 / Accepted: 27 April 2023 / Published: 29 May 2023
(This article belongs to the Special Issue Membrane Technology for Water Treatment and Desalination)

Abstract

:
It has been well established that natural organic matters (NOMs) are precursors for the formation of disinfection by-products (DBPs) in drinking water supplies, thus the removal of NOMs is often used as an effective approach to limit DBPs production. In this study, we evaluated the application of oxidized multi-walled carbon nanotubes (OMWNTs)/polysulfone (PSU) nanocomposite hollow fiber membranes (HFM) for the removal of NOMs and its impact on the production of DBPs following water chlorination. Analysis of source water samples by fluorescence excitation/emission matrix (EEM) spectrometry indicated that the dominant dissolved organic matters were humic acid. Evaluation of the fabricated nanocomposite HFMs showed improved water fluxes (30~50%), better fouling resistance, and a comparable solute rejection rate when compared with the conventional PSU membranes. The flux increase was attributed to the increased surface hydrophilicity and porosity of the membrane after embedding the hydrophilic OMWNTs. The membrane filtration resulted in a reduction of UV254 by approximately 52%, 48%, and 38% for three water samples from Missouri River, Eagle Bluffs Conservation Area, and Columbia Water Treatment Plant, respectively. The corresponding reduction in trihalomethane formation potential (THMFP) reached 40%, 70%, and 27%, respectively. Overall, this study demonstrated that proper OMWNTs/PSU ultrafiltration membranes could remove a portion of NOMs from water at a relatively low cross-membrane pressure. It also illustrates the innovative concept that membrane design could be tailored for specific water quality conditions and regulatory requirements; in this particular case, to fabricate a membrane to reduce the THMFP to a level that meets the regulatory standards for trihalomethanes when the water was disinfected by chlorine.

1. Introduction

Water disinfection, primarily by chlorination in the United States, is considered one of the greatest engineering achievements that have greatly improved human health and life expectancy. However, it is also known that interactions of natural organic matters (NOMs) and chlorine could generate a number of harmful disinfection byproducts (DBPs) including trihalomethanes (THMs), haloacetic acids (HAAs), and N-nitrosodimethylamine (NDMA) [1,2]. For small water supply systems serving communities with populations of 10,000 or less, it is a significant challenge to maintain the delicate balance between maintaining a pathogen-free condition in potable water and controlling the production of various DBPs. Under the Disinfectants/Disinfection By-products (D/DBP) Rule, the U.S. Environmental Protection Agency (U.S. EPA) has set that in Stage I, the maximum contaminant levels (MCL) are at 100 to 80 μg/L for total trihalomethanes (TTHMs) and 60 μg/L for the total haloacetic acids (HAA5); in Stage II, the regulation requires water systems to meet DBP MCL at each monitoring site in the distribution system (EPA, 2010). N-nitrosodimethylamine (NDMA) is another disinfection by-product of potent carcinogenic nature, with an estimated lifetime cancer risk of 10−6 at a concentration of 0.7 ng/L [3]. A recent study found that NDMA concentrations in a drinking water system in China ranged from 2.5 to 67.4 ng/L, and also detected other nitrogenous DBPs such as N-nitrosodiethylamine (NDEA) and N-nitrosopiperidine (NPIP) [4]. Because of the known human health risks and regulatory requirements by the government, there is a critical need to develop cost-effective technologies for the control of DBPs.
NOMs in aquatic environments are the main precursors for the formation of THMs and other DBPs [5,6,7]; therefore, NOM removal is often adapted to control the formation of DBPs. NOMs mostly result from the decomposition of plant and animal residuals and can be in soluble and insoluble forms. Dissolved NOMs are operationally categorized as humic acid and fulvic acid: humic acid is the fraction with high molecular weight (2000–100,000), not soluble under acidic conditions with pH < 2 but soluble at higher pH values; while fulvic acid is the fraction with a molecular weight < 2000 and soluble at all pH conditions because of the presence of many carboxylic, hydroxyl, and phenolic function groups [8,9]. Common methods to remove NOM in drinking water treatment include coagulation [10], ion exchange [11], activated carbon adsorption [12], membrane filtration [13], and advanced oxidation processes (AOPs) [14].
Membrane filtration is one of the most promising technologies capable of removing NOMs efficiently. The rejection of molecules depends on membrane pore size, charge characteristics, and hydrophilicity [15]. In general, the majority of NOM has an apparent MW between a few hundred and 10,000 Da, with the mean value in the lower end of this range [16,17]. As a result, nanofiltration (NF) and reverse osmosis (RO) are required for the successful removal of NOMs. To illustrate, Taylor et al. (1989) tested the separation efficiency of THM precursors by seven different membranes with molecular weight cutoffs (MWCOs) ranging from 100 to 40,000, showing that the NF membrane with an MWC of 400 controlled the THM formation potential (THMFP) to less than 0.1 mg/L MCL [18]. A major disadvantage with RO and NF processes is the high transmembrane pressure (TMP) applied, which translates to high energy consumption. In addition, extensive pretreatments, such as conventional coagulation and flocculation treatment, MF, or UF, are often needed to reduce RO/NF membrane fouling [19,20,21].
Recently, nano-composite membranes have attracted much attention for water treatment as reviewed in the literature [22,23]. The incorporation of nanomaterials with conventional membrane polymers could not only tune membrane structure and physicochemical properties (e.g., hydrophilicity, porosity, charge density, and thermal and mechanical stability) but also introduce unique surface characteristics (e.g., antibacterial property and photo-catalytic capability) into the membranes. In a previous study [24], we fabricated oxidized multi-walled carbon nanotubes (OMWNTs)/polysulfone (PSU) nanocomposite hollow fiber membranes with various concentrations of PSU and OMWNTs. The mixed matrix membranes with OMWNTs showed a significant increase in pure water flux (60% to 100%) while maintaining rejection rates of humic acid and Procion Red at levels similar to the pure PSU membrane. In addition, the antifouling property of the mixed matrix membrane was significantly improved as tested by bovine serum albumin, a common protein used to test membrane fouling characteristics.
In this study, we explored the application of this novel OMWNTs/PSU nanocomposite hollow fiber membrane for the removal of NOMs, with the ultimate goal of controlling disinfection byproducts formation. The efficiency of the treatment was evaluated by monitoring changes in the water fluorescence excitation/emission matrix (EEM) spectra, ultraviolet absorbance at the wavelength of 254 nm (UV254), and THMFP. The results demonstrated that a portion of NOMs could be efficiently removed by the low-pressure ultrafiltration membrane (<1 bar TMP), and this fractional removal of NOM was sufficient to control DBPs to a level that could meet regulatory limits.

2. Materials and Methods

2.1. Materials

Polysulfone (PSU) with a molecular weight of 35,000 Da was obtained in the form of transparent pellets and dried for 3 h at 120 °C before usage. 1-Methyl-2-pyrrolidinone (NMP, 99.5%) was used as solvent for PSU dissolution. These two chemicals were obtained from Sigma-Aldrich and were of ACS reagent grade. Multi-walled carbon nanotubes (MWNTs, diameter 10–20 nm, length 5–15 μm, and purity of 95%) were manufactured by Shenzhen Nanotech Port Co., Ltd., Shenzhen, China. Deionized water (DI) produced by Millipore DI system (Synergy 185, 18.2 MΩ·cm) was used as bore solution for hollow fiber membrane fabrication in the study.

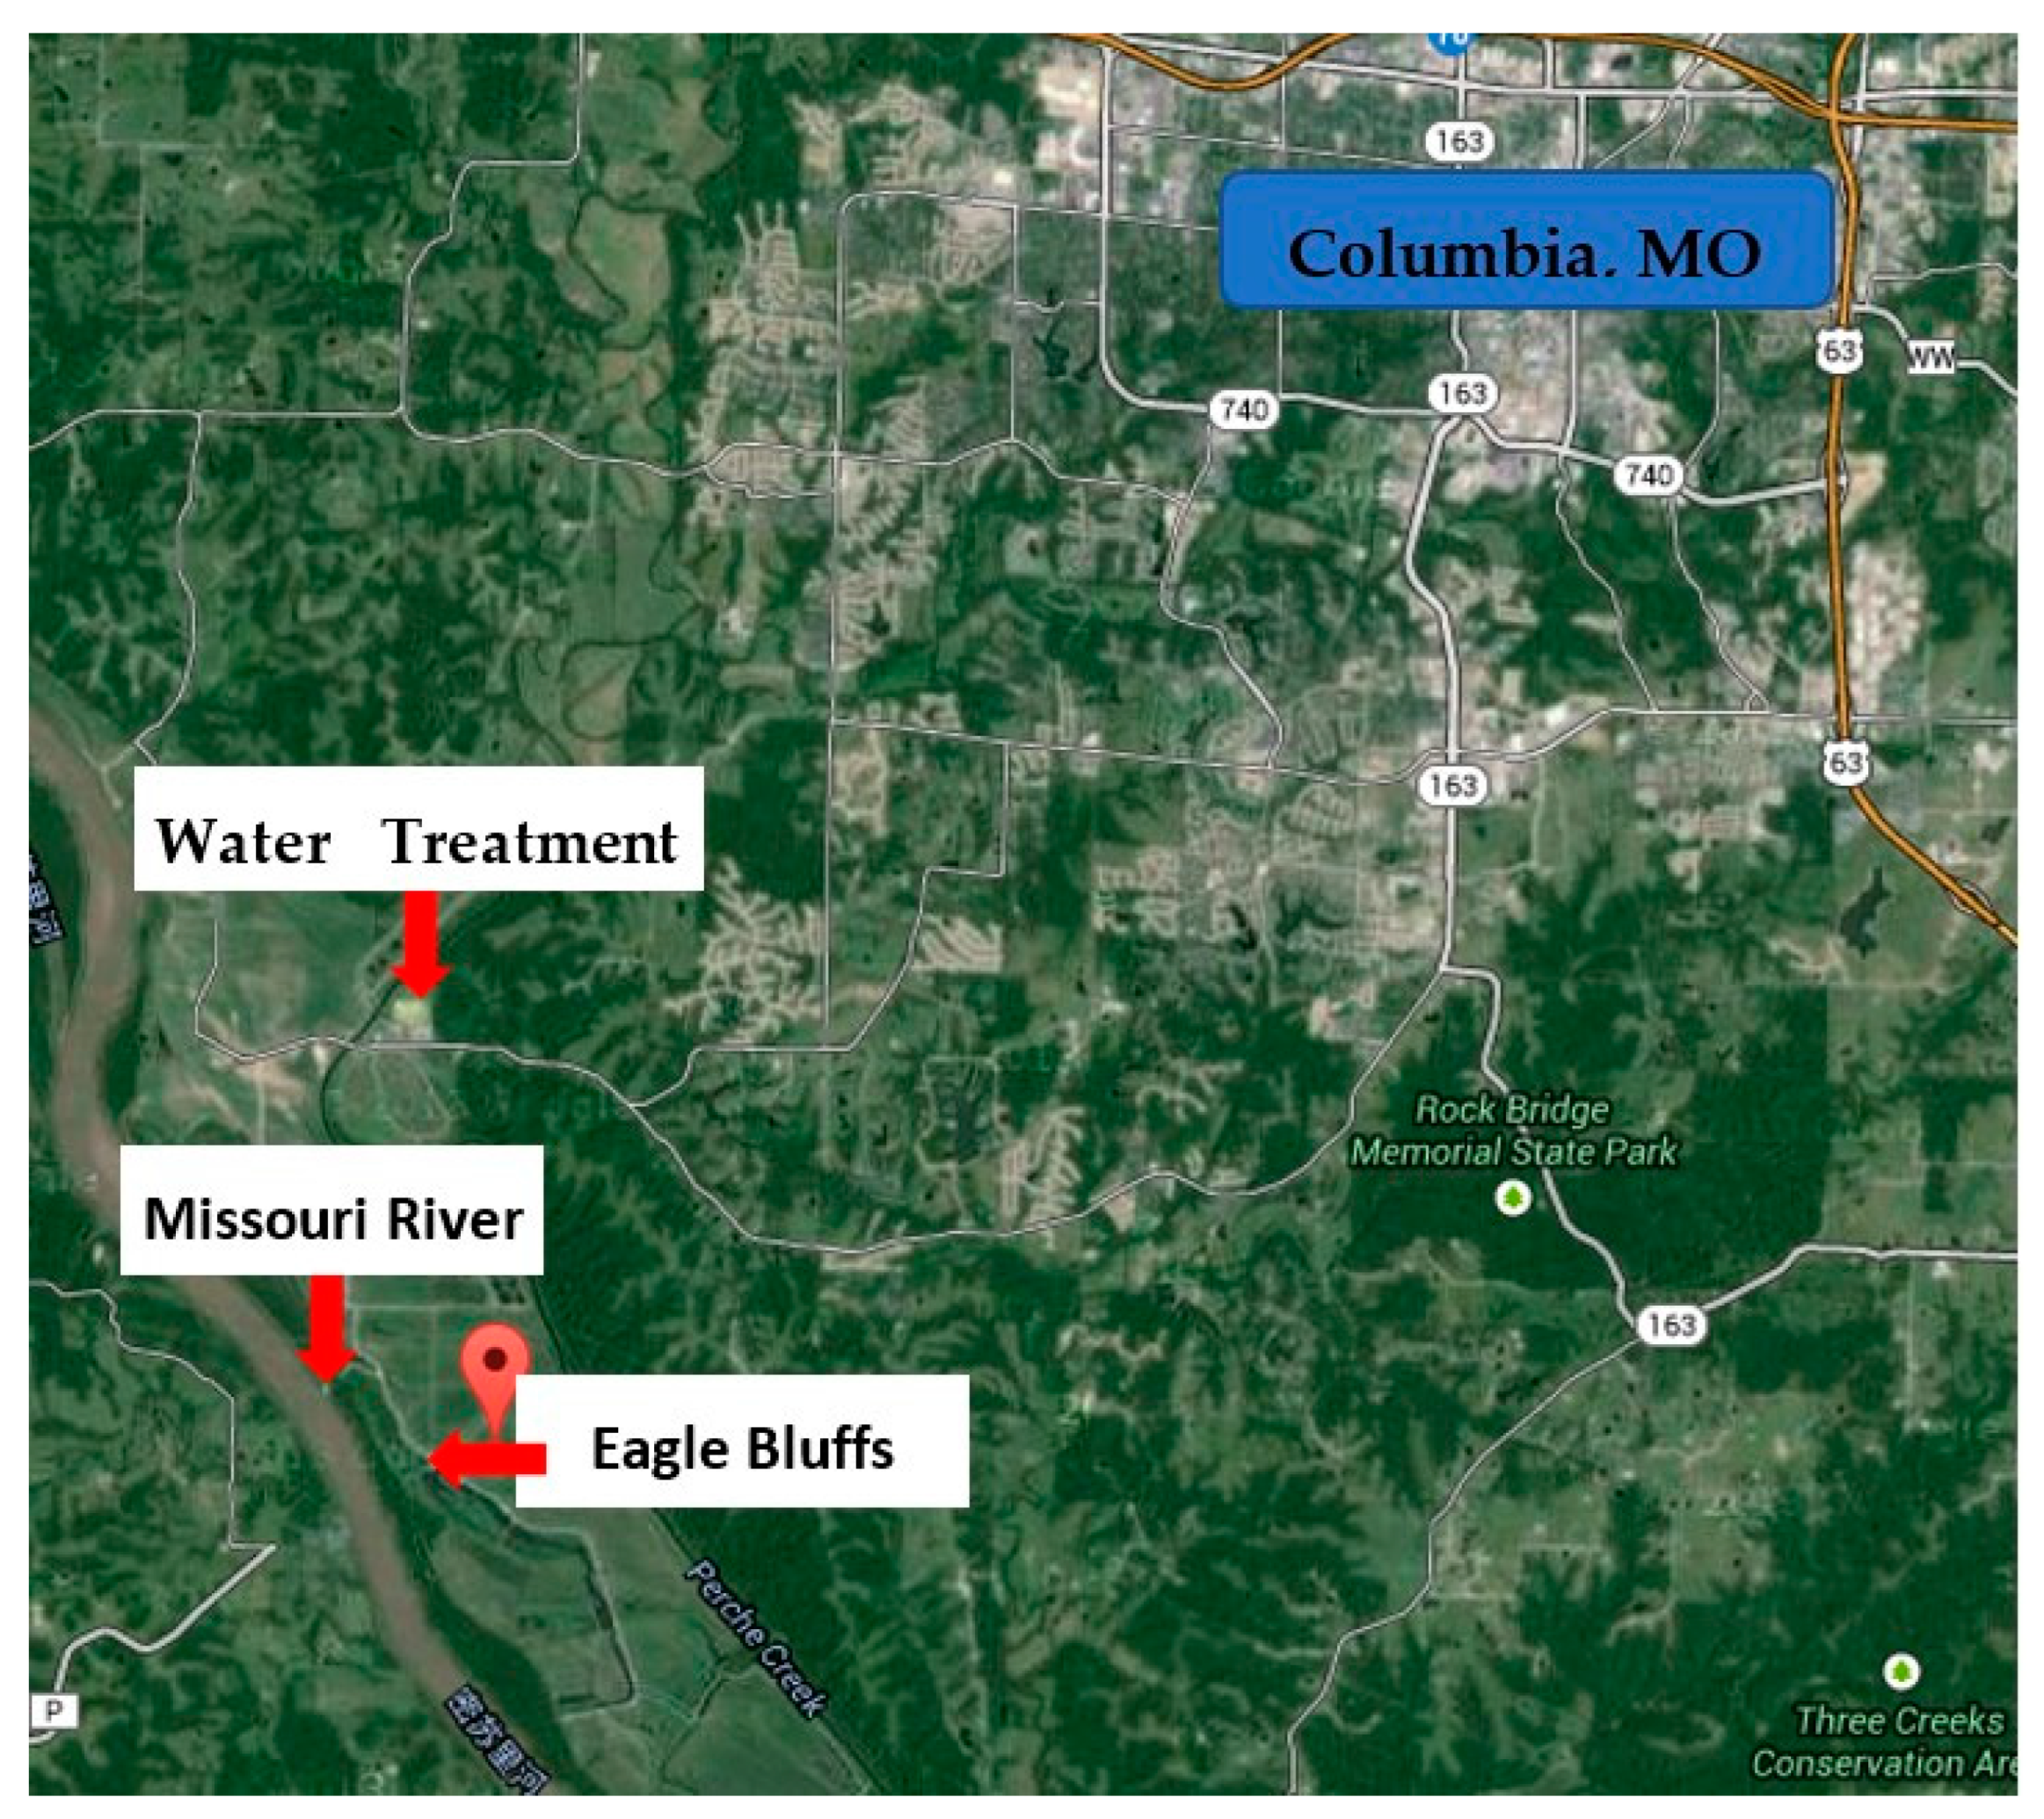
2.2. Natural Water Samples

Water samples from three locations in central Missouri in the United States, including Missouri River, Eagle Bluffs Conservation Area, and Columbia Water Treatment Plant, were collected at specific locations shown in Figure 1. Missouri River, the longest river in North America, is the largest source of drinking water for the communities in Missouri and several other states. The Eagle Bluffs Conservation Area is a managed nature preserve and wetland, which receives treated effluent from the Columbia Wastewater Treatment Plant and also Missouri River water in winter season to maintain partially flooded status. The Columbia Wastewater Treatment Plant uses the conventional activated sludge treatment for the removal of biological demand (BOD), followed by polishing in a multi-cell constructed wetland system totaling 140 acres. The Columbia Water Treatment Plant extracts groundwater from an alluvial aquifer approximately one mile away from the Missouri River riverbank. The water samples were collected in March 2015 and filtered through a 0.45 μm membrane (Whatman) prior to the filtration treatment and analyses.
Water samples were analyzed for their pH, total organic carbon (TOC) level, and ultraviolet absorbance at the wavelength of 254 nm (UV254) after filtration through a syringe filter of 0.45 microns. pH values were measured by a HACH model portable pH meter in situ. Total organic carbon was analyzed by TOC analyzer (TOC-5000, Shimadzu Corp., Kyoto, Japan). UV254 values in water were collected on a UV–visible spectrophotometer (Lambda 25, PerkinElmer, Waltham, MA, USA) set at this wavelength.

2.3. Fabrication of Hollow Fiber Nanocomposite Membranes

OMWNTs/PSU nanocomposite hollow fiber membranes were fabricated following a previously reported protocol [24]. Briefly, MWNTs were first purified and oxidized in concentrated mixed acids (H2SO4/HNO3 = 3/1 in volume). After thorough cleaning, the products were dried at 80 °C for 24 h under vacuum and were labeled as OMWNTs. Then, the OMWNTs/PSU membranes were fabricated by the phase inversion method on a custom-designed single-head spinning machine. The spinneret that largely controlled the hollow fiber membrane morphology had an outer diameter of 1.0 mm and inner diameter of 0.6 mm. To make a dope solution, a certain amount of OMWNTs was dispersed in NMP solvent and sonicated for 10 min to achieve dispersion. PSU and PVP were then added to the mixture and stirred for 6 h at 50 °C to form dope solution, which was kept overnight for degassing prior to use. The dope solution was fed into the annulus of the spinneret under certain pressure provided by a high-purity nitrogen gas cylinder. DI water was used as bore fluid and pumped into the inner tube of the spinneret. The dope and bore fluid met at the tip of the spinneret prior to being released into the coagulation bath. The precipitated PSU fiber was prewashed in washing bath and collected by a rotating collection drum. Finally, the collected fibers were rinsed in the tap water at room temperature for at least 24 h to remove any residual solvent. The membranes containing 18 or 20 wt% of PSU were labeled as HFM18-x or HFM20-x, respectively, where x stands for the concentration of nanotubes in the dope solution.

2.4. Filtration Test

A low-pressure crossflow filtration system (pressure range: 0–50 psi) was used to evaluate water permeability and NOM rejection. The membrane module was sealed by epoxy resin, with an effective membrane area of around 10 cm2. Prior to test, each membrane fiber was compressed by DI water at a constant trans-membrane pressure (TMP) of 15 psi for 3 h. Pure water flux was measured by weighing the permeate water as a function of time at 10 psi and recorded by a LabVIEW automated system (National Instruments LabVIEW 8.2 with Ohaus digital balance). After the flux test, feed solution was filtrated and solute concentrations of feed and permeate solutions were measured for UV254 and TOC values by the instruments described previously. The EEM fluorescence spectra of samples were collected by a fluorescence spectrophotometer (F-4500, Hitachi High Technologies, Tokyo, Japan) equipped with a 700-voltage xenon lamp. Samples were held in a standard 1 cm quartz cuvette. EEM was constructed with a scanning speed of 1200 nm/min at room temperature (22.0 ± 2 °C), varying the excitation wavelengths from 200 to 500 nm in 5 nm steps and the emission wavelengths from 250 to 550 nm in 5 nm steps.

2.5. THMs Analysis

THMs were measured with a gas chromatograph/mass spectrometer (GC/MS) following their formation by the Standard Methods for the Examination of Water and Wastewater 5710 B [25], in which samples were buffered at neutral pH and chlorinated with excess free chlorine for 7 d chlorination reaction to form DBPs at 25 ± 2 °C (Figure 2). Post-reaction, samples were neutralized with sodium thiosulfate and stored head-space-free in 40 mL glass vials with Teflon-lined septa caps. During the analysis, the samples were tested for free chlorine using a Hach DPD free chlorine kit and Hach DR/890 colorimeter for all samples.

3. Results

3.1. Basic Parameters of Water Samples

The basic water quality parameters are listed in Table 1.
All three water samples have a pH around 7.6. The water sample from Eagle Bluffs Conservation Areas has 9.78 mg/L DOC (as measured by TOC) and a UV254 value of 0.174, which are higher than the respective values for the Missouri River water and source water of the Columbia Water Treatment Plant. This is reasonable because the Eagle Bluffs Conservation Area is a highly regulated wetland system that is normally flooded in winter, so the DOC is expected to be high. Lower Missouri River has probably lost over 80% of its historical wetland resulting from draining, clearing, leveling, and diverting of water for agricultural uses [26]. The loss of wetland has been shown to decrease DOC concentrations in Missouri/Mississippi River system [27], so the river water sample has a lower DOC value than the wetland. The water treatment plant pumps its water from a groundwater aquifer; its DOC content is the lowest because of generally low microbial activities and the potential of sorption by soil matrices.
EEM spectra of these water samples are shown in Figure 3. Rayleigh scatters appearing in the EEM as diagonal lines should be ignored during the spectrum interpretation since they did not result from fluorophores in the water [2]. All water samples have an excitation peak around 245 nm and a broad emission band centered around 450 nm, which could be attributed to humic acids that consist of high molecular weight aromatic compounds [28]. For water samples from Eagle Bluffs with relatively high DOC, a secondary excitation peak around 330 nm was observed, which is consistent with the presence of fulvic acids [2]. Additionally, the water sample from Eagle Bluffs also had a peak in the region of excitation: 220–240 nm/emission: 300–400 nm, which could be attributed to typical protein-like substances such as tryptophan and tyrosine [29]. These observations are consistent with the water parameters listed in Table 1. All the information indicated that the water sample from Eagle Bluffs had a higher NOM concentration than the other two water samples. This is reasonable since Eagle Bluffs receives discharge from a wastewater treatment plant (WWTP).

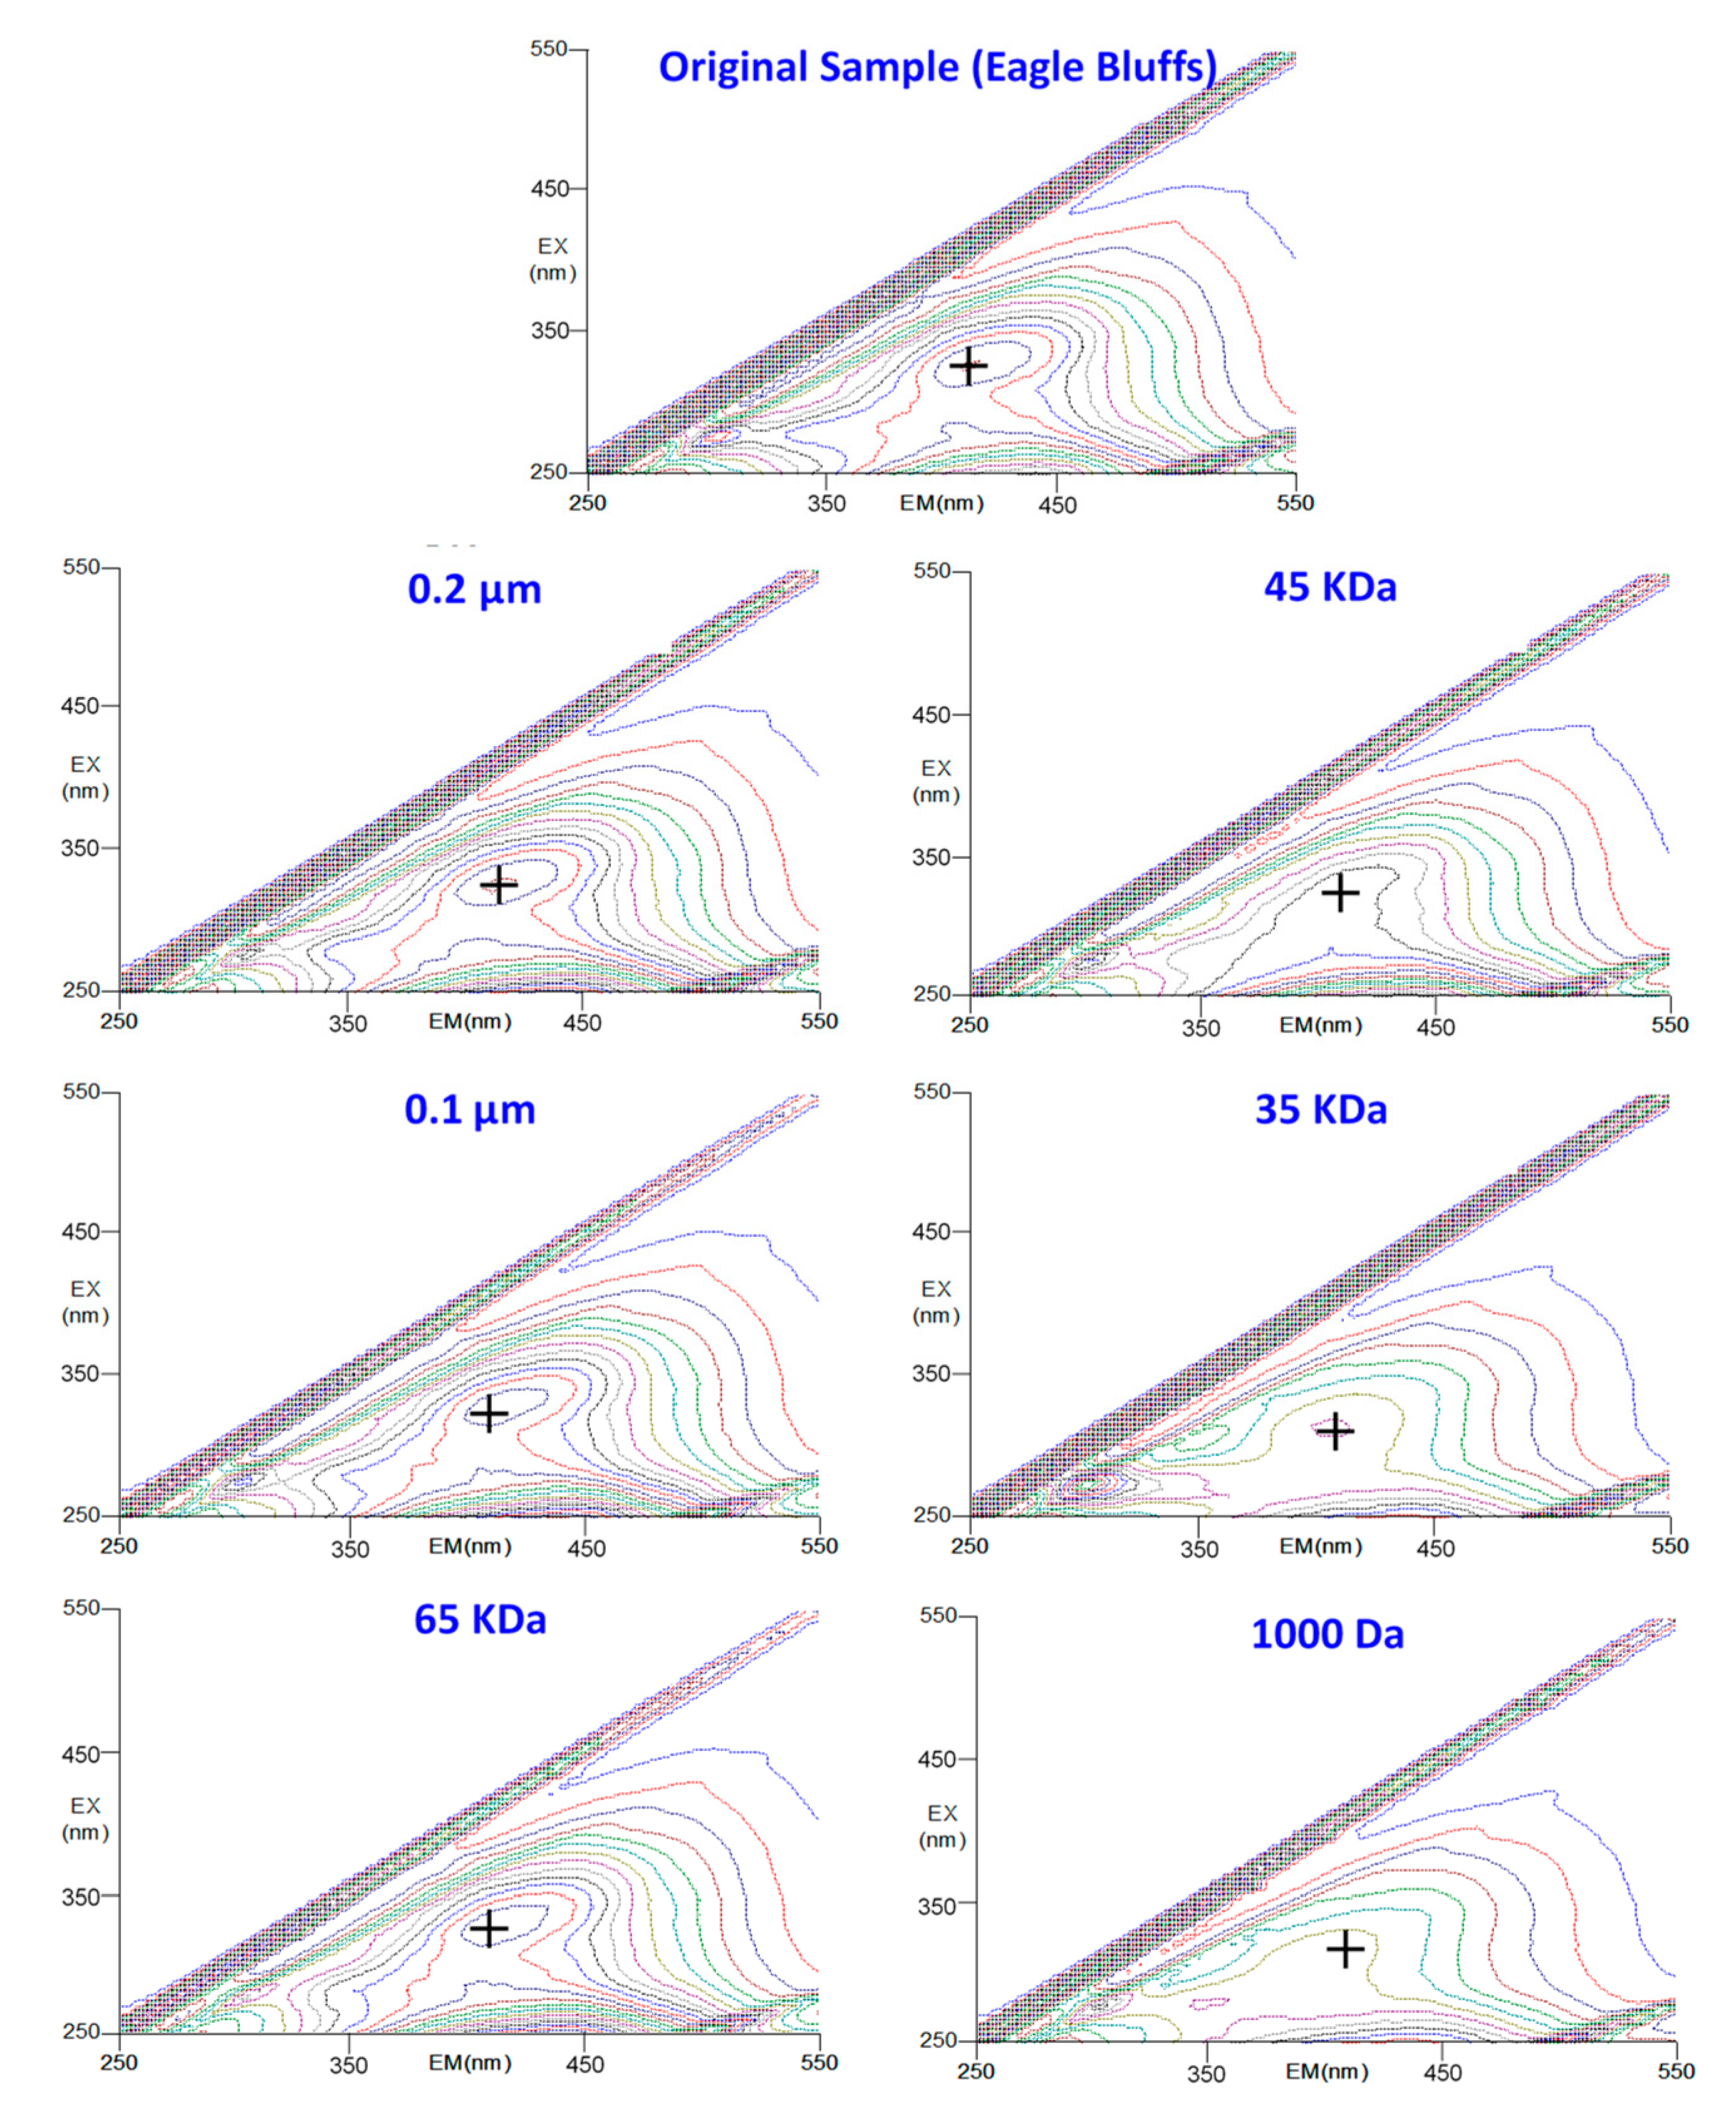
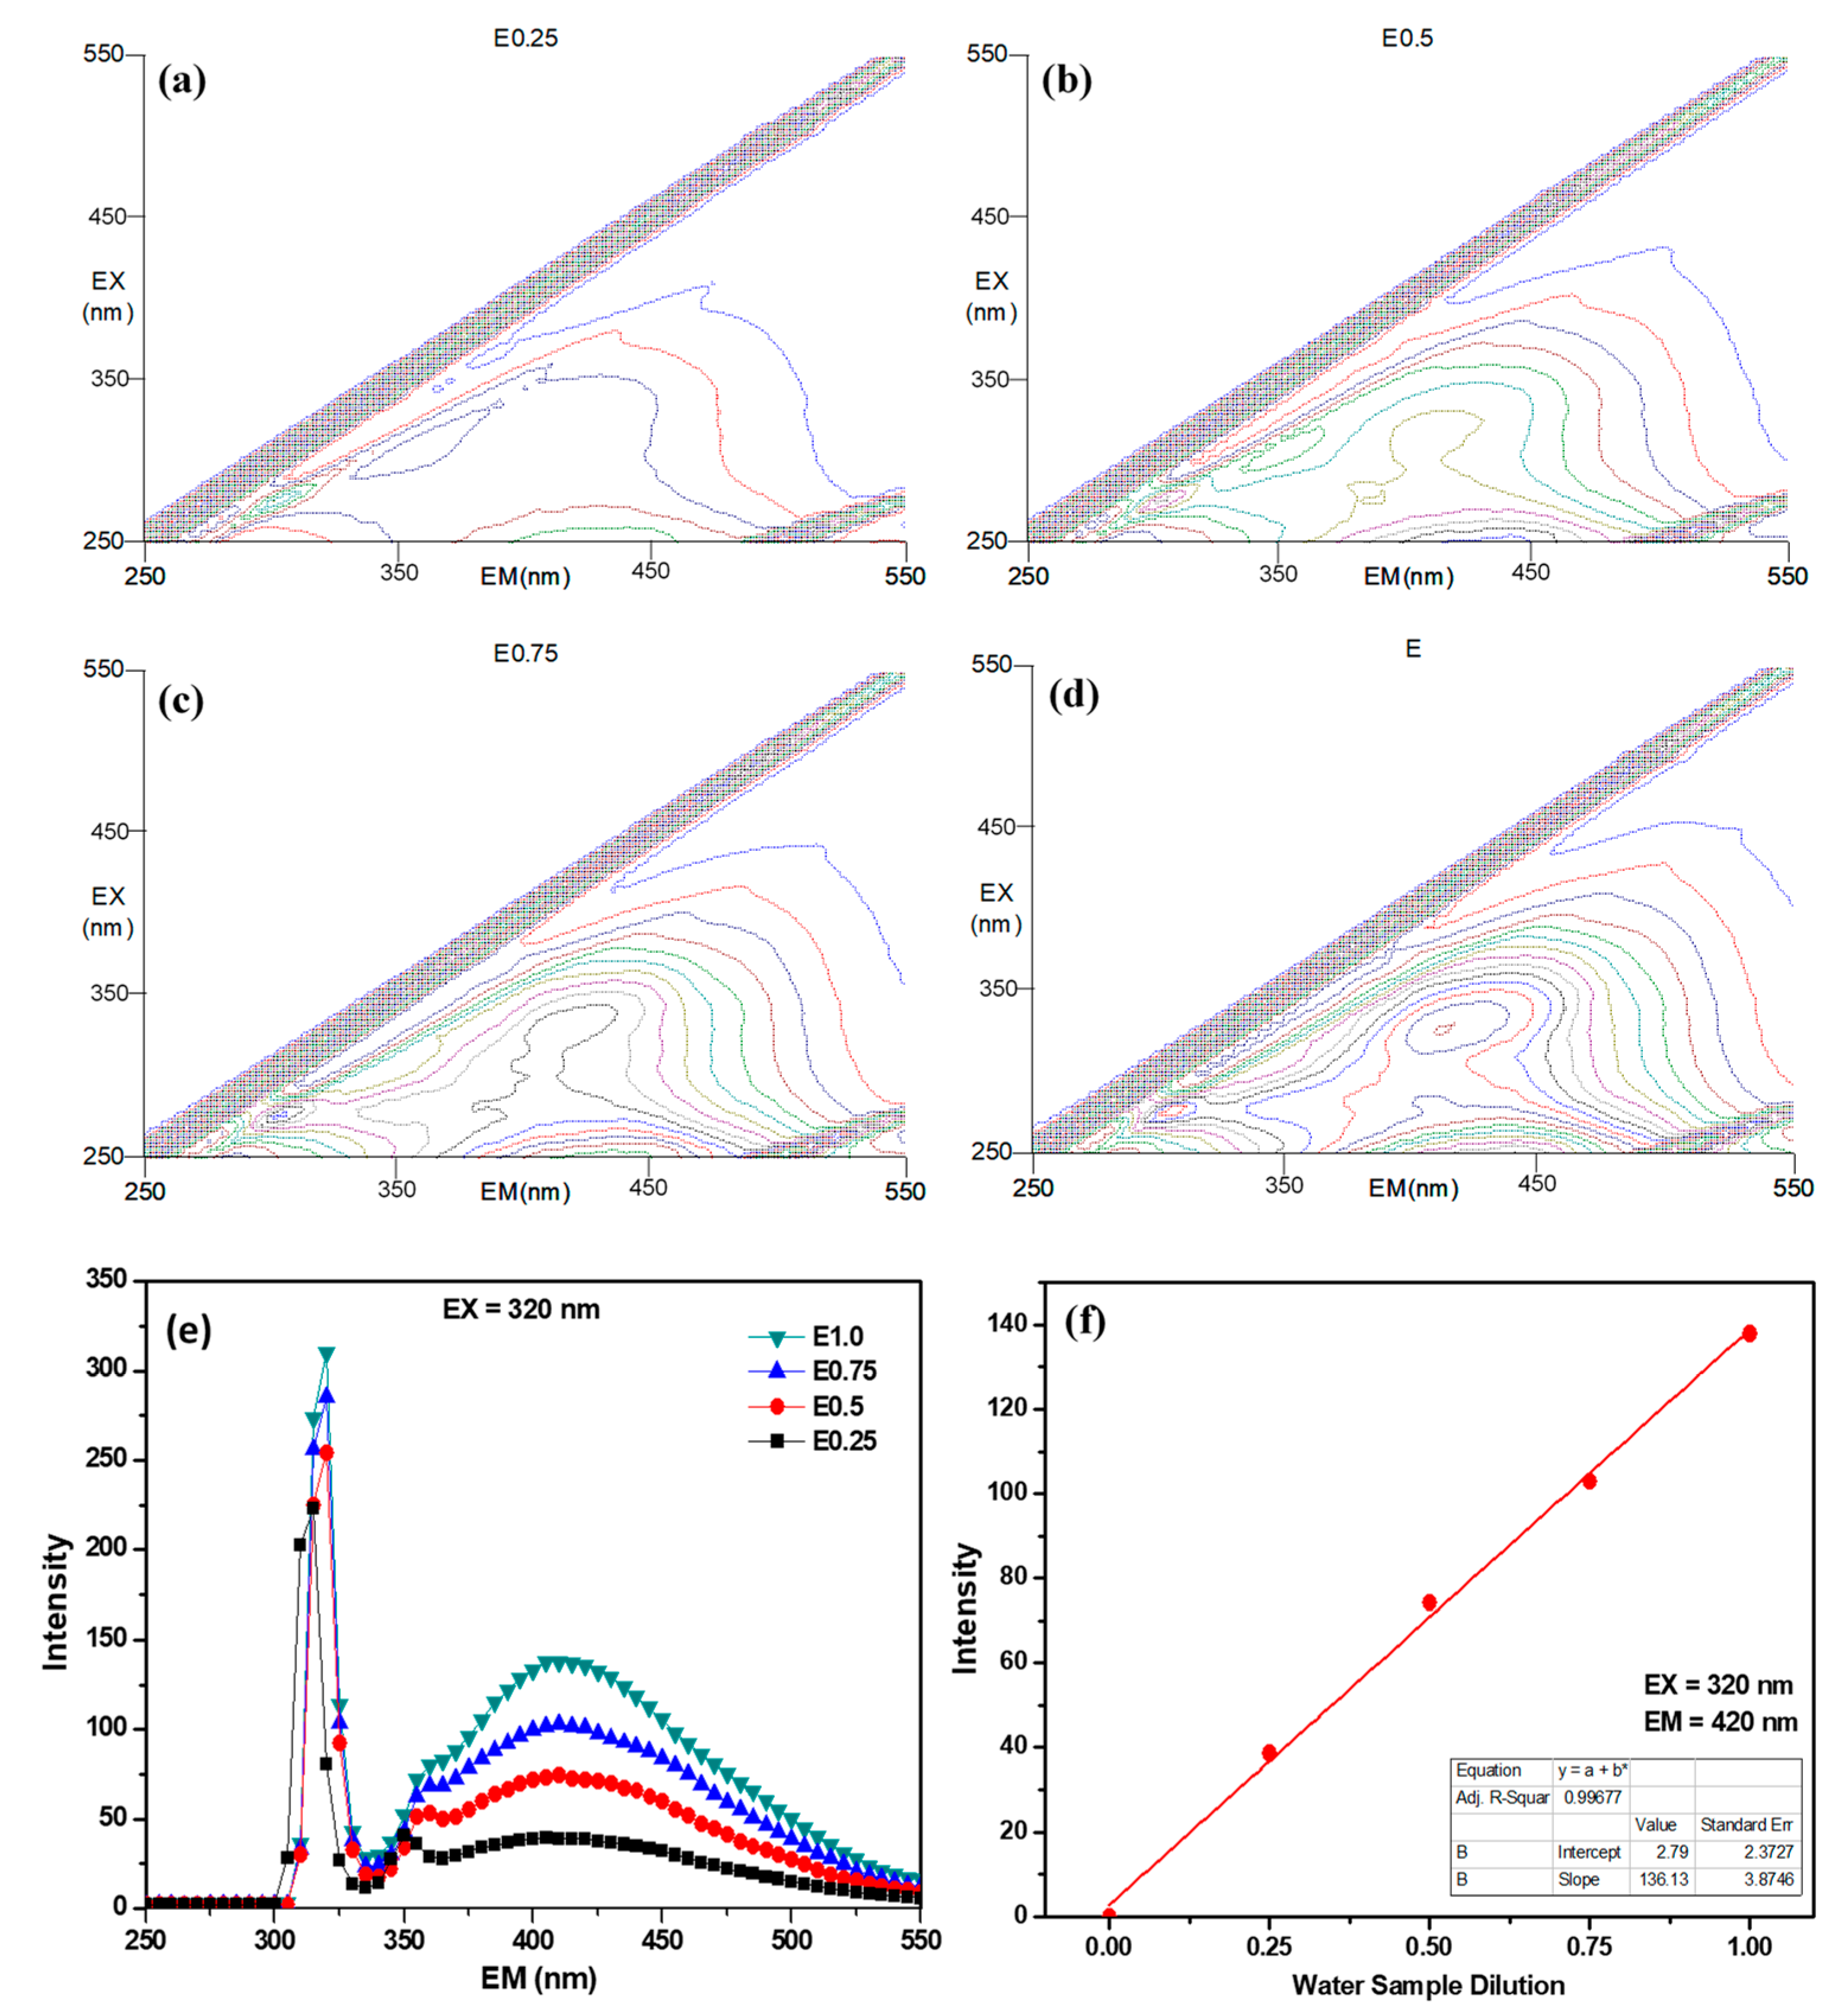
3.2. Effects of MWCO on the UV254 and EEM Removal Rates

In addition to variations of NOM concentrations due to different water sources, NOM concentration in water can be manipulated in the laboratory by selective filtration or by dilution. After filtration using commercial membranes with various MWCOs, the removal efficiencies of UV254 and EEM intensity (EX = 320 nm, EM = 420 nm) are presented in Figure 4.
The removal efficiencies for both UV254 and EEM intensity (e.g., EX320 nm/EM420 nm) increased with decreasing MWCO for membranes. When membranes with pore sizes of 0.20 μm, 0.10 μm, and 65 K Da MWCO, the reduction of UV254 and EEM intensity were mostly less than 10%, suggesting that membranes with pore size larger than 65 K Da would not be effective for NOM removal. Among denser membranes with 45 KDa or less, the reduction of UV254 and EEM intensity were all above 30%, indicating that partial NOM removal is feasible by membranes with 45 KDa or less in MWCO. The membrane with MWCO of 1000 Dalton removed over 70% of UV254 and around 50% of EEM intensity.
For further illustration, the detailed EEM spectra of water samples prior to and after filtration by membranes of deceasing pore sizes are presented in Figure 5. The results showed that there was a peak at EX320 nm/EM 420 nm (marked with black cross) in the spectra, and the peak decreased gradually as the membrane MWCO decreased. Clearly, more NOM was removed when using membranes with smaller surface pores, as expected due to the size sieving process.
The EEM spectral features also changed with changing NOM concentrations by dilution (Figure 6). The intensity at EX320 nm/EM 420 nm showed a good linear relationship with the organic matter concentration (Figure 6f, showed as dilution ratio). The results demonstrated that the EEM removal rates could be calculated based on this specific intensity. As a result, the intensity at EX320 nm/EM 420 nm would be calculated in the following sections to evaluate NOM removal efficiency.

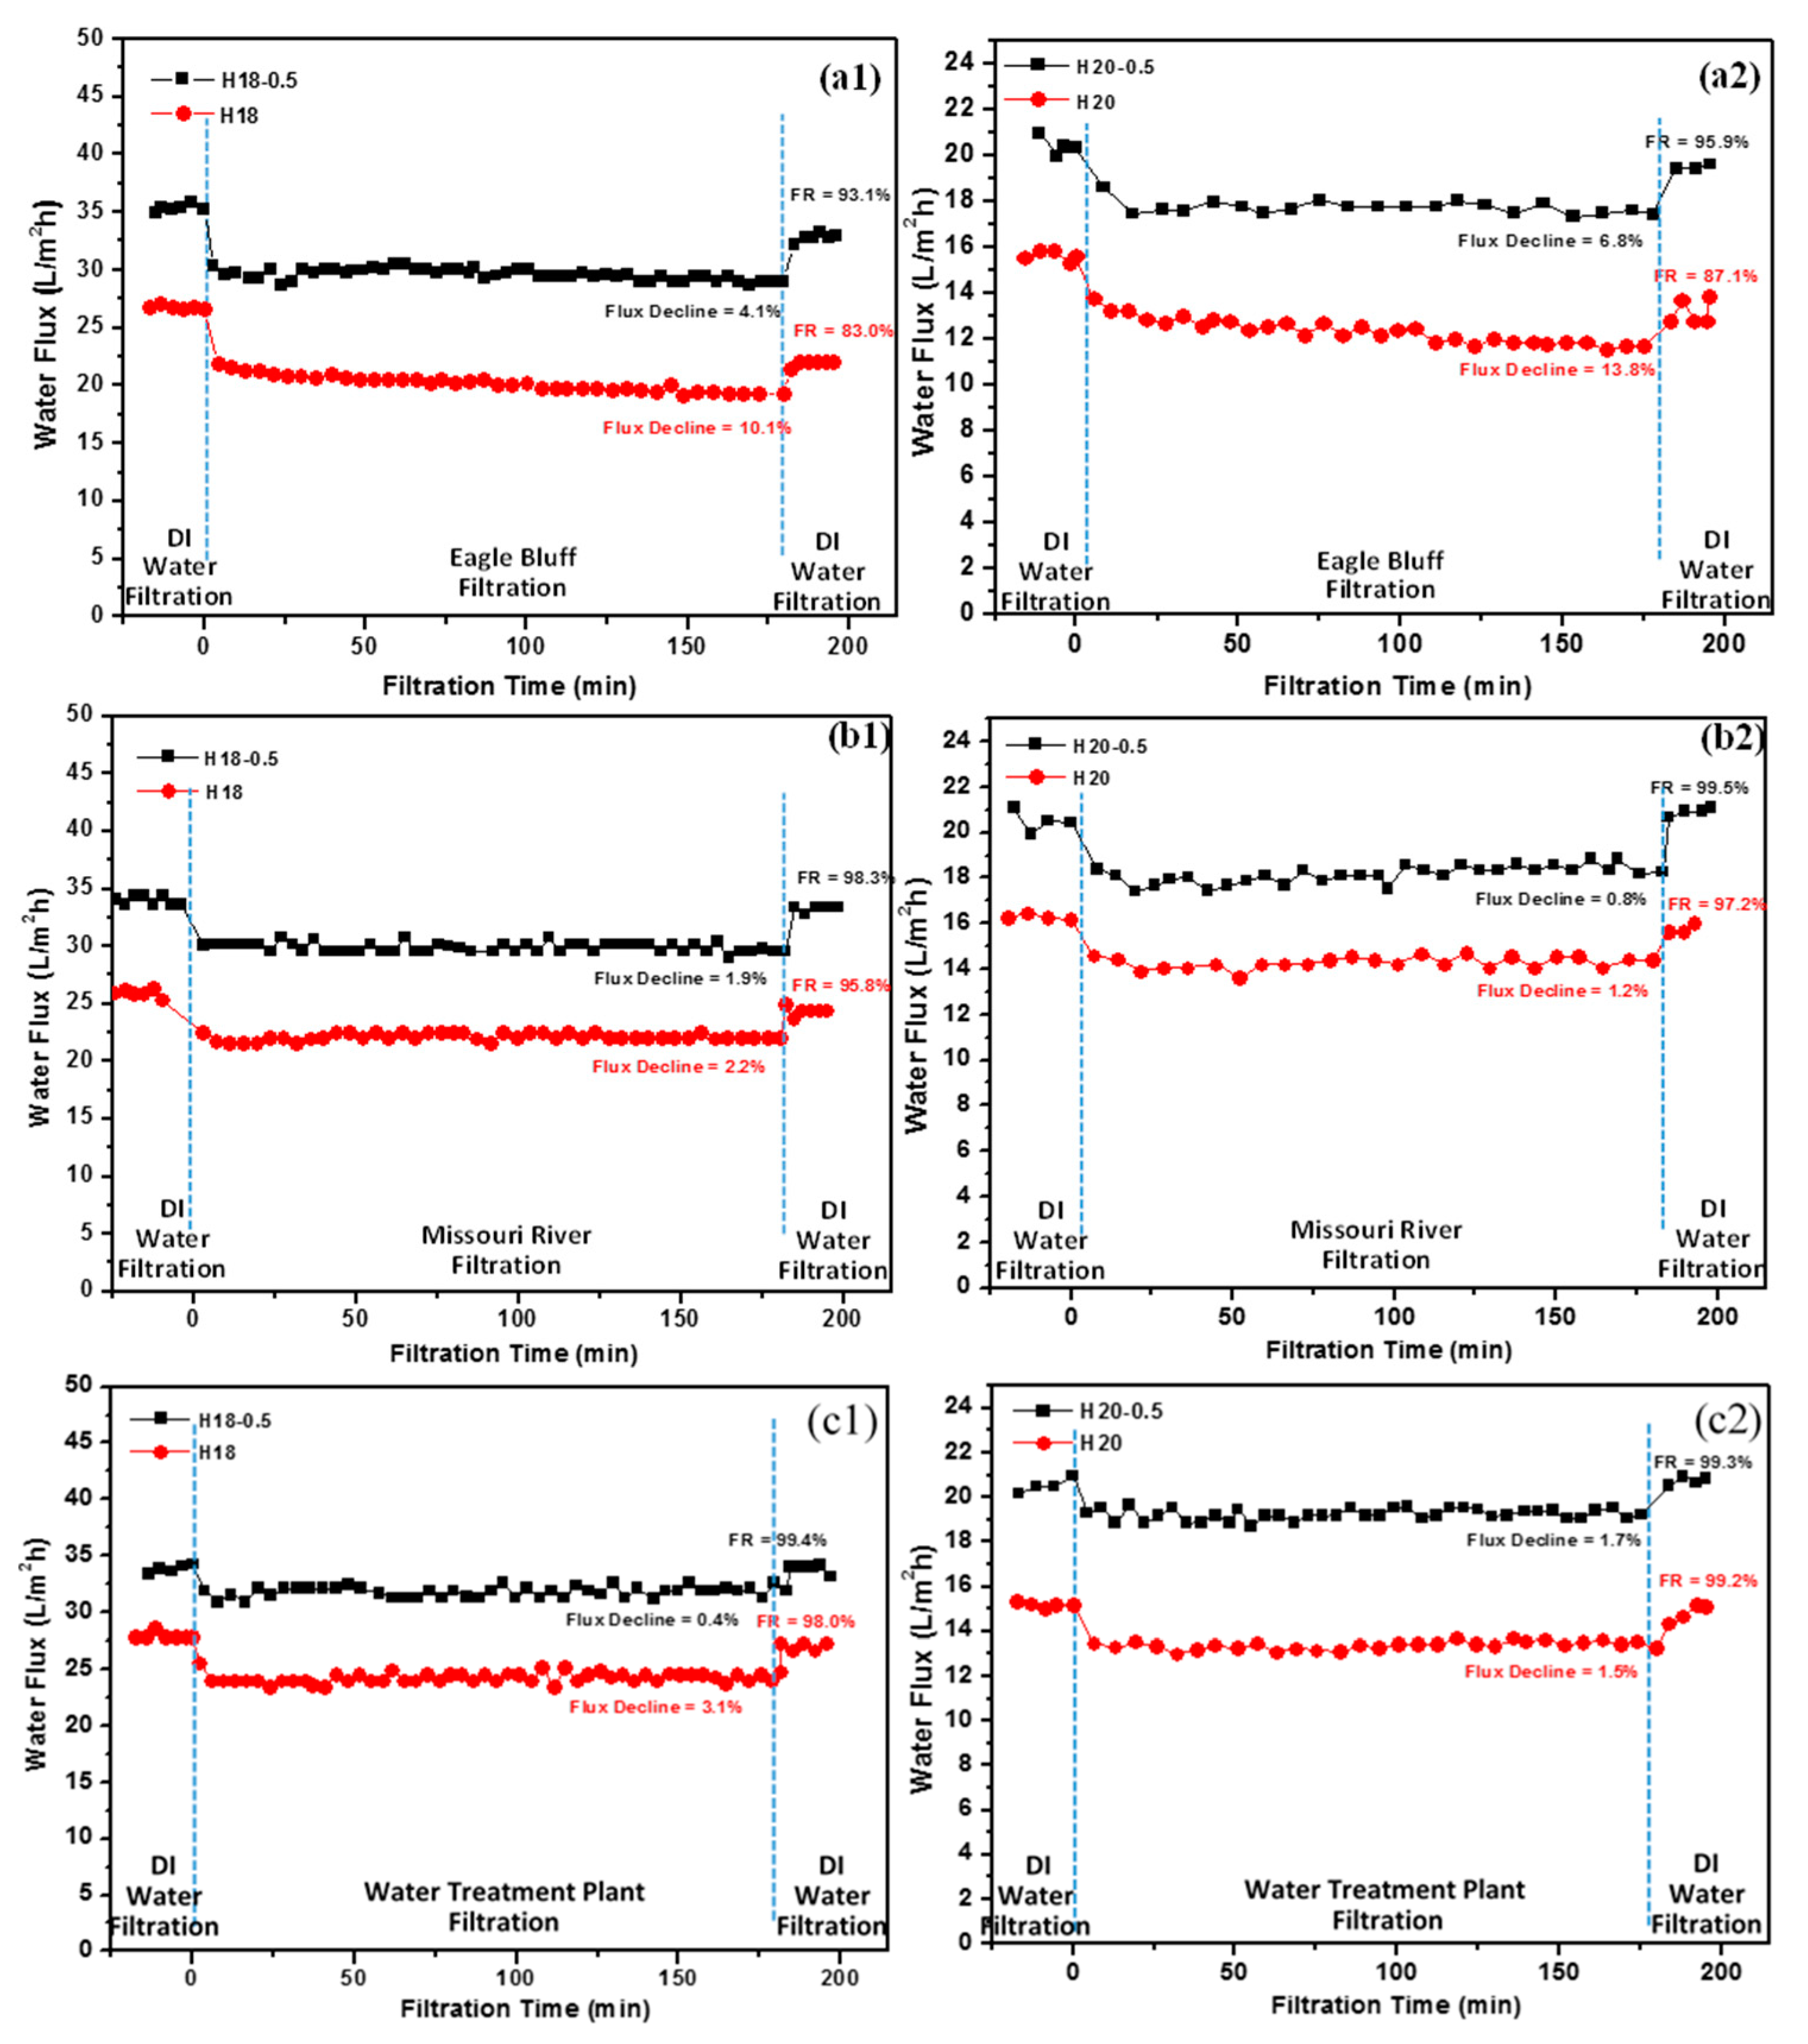
3.3. Performance of OMWNTs/PSU HFMs

Pure Water Fluxes: The pure water fluxes of membranes are shown in Figure 7. As expected, water fluxes gradually increased with increasing TMP for all membranes. Two nanocomposite membranes containing 0.5 wt% OMWNTs but different PSF concentrations had higher pure water fluxes than their corresponding control membranes. Under 10 psi, the original H18 and H20 membranes showed water fluxes at 24.8 L/m2h and 15.1 L/m2h, respectively, while at the same TMP, the water fluxes of nanocomposite membranes were at 36.4 L/m2h and 21.3 L/m2h, respectively. These changes are caused by the incorporation of hydrophilic OMWNTs in the PSF matrix, which increased the surface hydrophilicity and porosity of the membrane as previously discussed [24].
Membrane Fouling: Fouling behaviors of different membranes were illustrated in Figure 8, when applied to filter water from different courses. When using water samples from Eagle Bluffs as the feed, the nanocomposite membranes showed improved water flux and fouling resistance (Figure 8a). To illustrate, the H18-0.5 membrane had a water flux of 30 L/m2h and a flux decline of around 4.1% during the 180 min filtration, while the H18 membrane had a water flux of around 20 L/m2h and a flux decline of around 10.1%. The nanocomposite membranes also had a higher flux recovery (FR) compared to the control membranes. When membranes with higher density (H20 and H20-0.5) were applied, the fouling characteristics were essentially the same as those slightly looser membranes (H18 and H18-0.5), but the water fluxes were approximately 40% lower.
The improved fouling resistance of the nanocomposite membranes with OMWCTs could be attributed to the enhanced surface hydrophilicity provided by the incorporation of OMWNTs. This is similar to our previous findings [24] demonstrating that OMWNTs/PSU membranes had improved fouling resistance to protein (BSA). With enhanced surface hydrophilicity, the adsorption of NOMs on the membrane surface could be reduced, and those already deposited NOMs could be removed more easily by crossflow. This is consistent with the general strategy to mitigate UF membrane fouling by enhancing the membrane surface hydrophilicity [30,31,32].
Similar fouling behaviors were observed for the filtration of water samples from the Missouri River (Figure 8(b1,b2)) and Water Treatment Plant Figure 8(c1,c2). The nanocomposite membranes all showed improved water fluxes and fouling resistance. However, the flux declines for all membranes including control and nanocomposite membranes were much lower than those observed for the filtration of water samples from the Eagle Bluffs Conservation Areas. That means the fouling tendency for water samples from the Missouri River and Water Treatment Plant are much lower than that of water sample from Eagle Bluffs. This is reasonable because the NOMs concentrations in water samples from the Missouri River and Water Treatment Plant are lower than that of Eagle Bluffs. Generally, the NOMs especially the humic acid matters are dominant foulants during the filtration of surface water.
Reduction of DOM concentrations and THMFPs: Since NOMs are precursors for the formation of DBPs during chlorination, the removal of NOMs is expected to decrease the formation of DBPs. In this work, trihalomethane formation potential (THMFP) was used to evaluate the degree of DBPs reduction resulting from the removal of NOMs. The percentage removal rates of NOMs (as indicated by UV254, EEM intensity, or DOC) and THMFP are summarized in Figure 9. For Eagle Bluffs water (Figure 9a), H18 and H18-0.5 membranes had a UV254 removal rate of 38% and a DOC removal rate of 30%. When using the same feed solution, the H20 and H20-0.5 membranes had a UV254 removal rate above 45% and a DOC removal of 45%. The corresponding THMs removal rates were around 60% for H18 and H18-0.5 membranes and about 70% for H20 and H20-0.5 membranes. The removal rate of THMFP is higher than the rates for NOMs, suggesting that reactive NOMs responsible for the formation of DBPs are preferentially filtered out in this water.
For the Missouri River water (Figure 9b), the general trend was similar, i.e., denser membranes (H20 and H20-0.5) resulted in a higher reduction of NOMs (as indicated by UV254, EEM intensity, and DOC) and THMFP. Additionally, the nanocomposite membranes appeared to have slightly improved removal efficiencies compared to the control membranes. For instance, the H20-0.5 membrane had a removal rate of 52.5 ± 4.1% for UV254 and a removal rate of 38.7% for THMs. While the removal efficiencies of the H20 membrane for UV254 and THMs were 46.2 ± 0.9% and 32.1%, respectively. The improved removal efficiencies could be attributed to the modified membrane structure and enhanced water permeability of the nanocomposite membranes. These removal rates are comparable with or even better than the removal efficiencies we achieved in our previous study where polymeric aluminum ferric sulfate (PAFS) was applied as the coagulant for the treatment of Missouri River [33].
The removal rates of UV254, EEM, DOC, and THMs in water samples from the Water Treatment Plant are not as high as those in the other two water samples (Figure 9c). The plant uses groundwater as supplies, pumped from wells at or less than half a mile from the Missouri River. Its DOC value, 5.72 mg/L, is high in general for groundwater but lower than the other two water samples examined in this study. This is consistent with the observed NOM and THMPF values. The original THMs concentration of this water source is around 100 μg/L. Upon the treatment with H20-0.5 membrane, the permeate had a THMs concentration lower than the regulated value of 80 μg/L, indicating that partial removal of NOMs under a cross-membrane pressure at or lower than 14.5 psi could decrease the THMFP to below the regulatory level.

4. Conclusions

In this study, OMWNTs/PSU nanocomposite hollow fiber membranes were prepared and applied for NOMs removal to control the disinfection byproducts. The EEM fluorescence spectra of water samples indicated that the dominant NOMs in these samples could be humic substances. The nanocomposite membranes showed improved water fluxes (30~50%) and fouling resistance during the filtration process. These improvements are attributed to the increased surface hydrophilicity and porosity of the membrane after embedding hydrophilic OMWNTs. The H20-0.5 membrane has UV254 removal rates around 52%, 48%, and 38% for water samples from Missouri River, Eagle Bluffs Conservation Areas, and Columbia Water Treatment Plant, respectively. Meanwhile, for the same membrane, the THMs removal rates are around 40%, 70%, and 27%, respectively. Overall, the OMWNTs/PSU nanocomposite membrane is an excellent candidate for surface water treatment to remove NOMs and THMs formation potential. Further studies will be carried out to optimize the filtration performance and correlate the NOMs removal rates with THMs removal efficiencies.

Author Contributions

J.Y. was involved in the conceptualization and implementation of laboratory study, and wrote the original draft. M.F. was involved in analyzing the results and editing the manuscript. B.D. conceptualized and supervised research, analyzed the data, and edited the manuscript to its final form. All authors have read and agreed to the published version of the manuscript.

Funding

Financial support of this research was partially provided by the United States Geological Survey (Award # 0030505) through the Missouri Water Resources Research Center; however, there is no review or endorsement by the funding agency for the work.

Data Availability Statement

The data are all included here. No separate data file is prepared.

Conflicts of Interest

The authors declare no conflict of interest.

References

  1. Singer, P.C. Control of Disinfection By-Products in Drinking Water. J. Environ. Eng. 1994, 120, 727–744. [Google Scholar] [CrossRef]
  2. Hua, B.; Veum, K.; Koirala, A.; Jones, J.; Clevenger, T.; Deng, B. Fluorescence fingerprints to monitor total trihalomethanes and N-nitrosodimethylamine formation potentials in water. Environ. Chem. Lett. 2006, 5, 73–77. [Google Scholar] [CrossRef]
  3. Kim, J.; Clevenger, T.E. Prediction of N-nitrosodimethylamine (NDMA) formation as a disinfection by-product. J. Hazard. Mater. 2007, 145, 270–276. [Google Scholar] [CrossRef] [PubMed]
  4. Luo, Q.; Bei, E.; Liu, C.; Deng, Y.-L.; Miao, Y.; Qiu, Y.; Lu, W.-Q.; Chen, C.; Zeng, Q. Spatial, temporal variability and carcinogenic health risk assessment of nitrosamines in a drinking water system in China. Sci. Total Environ. 2020, 736, 139695. [Google Scholar] [CrossRef] [PubMed]
  5. Trussell, R.R.; Umphres, M. The Formation of Trihalomethanes. J. Am. Water Work. Assoc. 1978, 70, 604–612. [Google Scholar] [CrossRef]
  6. Xie, Y. Disinfection Byproducts in Drinking Water: Formation, Analysis, and Control; CRC Press: Boca Raton, FL, USA, 2003. [Google Scholar]
  7. Hua, B.; Veum, K.; Yang, J.; Jones, J.; Deng, B. Parallel factor analysis of fluorescence EEM spectra to identify THM precursors in lake waters. Environ. Monit. Assess. 2009, 161, 71–81. [Google Scholar] [CrossRef]
  8. MacCarthy, P.; Suffet, I.H. Introduction: Aquatic Humic Substances and Their Influence on the Fate and Treatment of Pollutants. In Aquatic Humic Substances; Suffet, I.H., MacCarthy, P., Eds.; American Chemical Society: Washington, DC, USA, 1989. [Google Scholar]
  9. Stumm, W.; Morgan, J.J. Aquatic Chemistry; Wiley-Interscience: New York, NY, USA, 1996. [Google Scholar]
  10. Uyak, V.; Toroz, I. Disinfection by-product precursors reduction by various coagulation techniques in Istanbul water supplies. J. Hazard. Mater. 2007, 141, 320–328. [Google Scholar] [CrossRef]
  11. Bolto, B.; Dixon, D.; Eldridge, R. Ion exchange for the removal of natural organic matter. React. Funct. Polym. 2004, 60, 171–182. [Google Scholar] [CrossRef]
  12. Matilainen, A.; Vieno, N.; Tuhkanen, T. Efficiency of the activated carbon filtration in the natural organic matter removal. Environ. Int. 2006, 32, 324–331. [Google Scholar] [CrossRef]
  13. Siddiqui, M.; Amy, G.; Ryan, J.; Odem, W. Membranes for the control of natural organic matter from surface waters. Water Res. 2000, 34, 3355–3370. [Google Scholar] [CrossRef]
  14. Matilainen, A.; Sillanpää, M. Removal of natural organic matter from drinking water by advanced oxidation processes. Chemosphere 2010, 80, 351–365. [Google Scholar] [CrossRef]
  15. Judd, S. The MBR Book: Principles and Applications of Membrane Bioreactors for Water and Wastewater Treatment; Elsevier: Amsterdam, The Netherlands, 2010. [Google Scholar]
  16. Pelekani, C.; Newcombe, G.; Snoeyink, V.L.; Hepplewhite, C.; Assemi, S.; Beckett, R. Characterization of Natural Organic Matter Using High Performance Size Exclusion Chromatography. Environ. Sci. Technol. 1999, 33, 2807–2813. [Google Scholar] [CrossRef]
  17. Tadanier, C.J.; Berry, D.F.; Knocke, W.R. Dissolved Organic Matter Apparent Molecular Weight Distribution and Number-Average Apparent Molecular Weight by Batch Ultrafiltration. Environ. Sci. Technol. 2000, 34, 2348–2353. [Google Scholar] [CrossRef]
  18. Taylor, J.S.; Mulford, L.; Duranceau, S.; Barrett, W. Cost and Performance of a Membrane Pilot Plant. J. AWWA 1989, 81, 52–60. [Google Scholar] [CrossRef]
  19. Chellam, S.; Jacangelo, J.G.; Bonacquisti, T.P.; Schauer, B.A. Effect of pretreatment on surface water nanofiltration. J. AWWA 1997, 89, 77–89. [Google Scholar] [CrossRef]
  20. Koyuncu, I.; Wiesner, M.R.; Bele, C.; Coriton, G.; Djafer, M.; Cavard, J. Bench-scale assessment of pretreatment to reduce fouling of salt-rejecting membranes. Desalination 2006, 197, 94–105. [Google Scholar] [CrossRef]
  21. Wang, S.; Li, L.; Yu, S.; Dong, B.; Gao, N.; Wang, X. A review of advances in EDCs and PhACs removal by nanofiltration: Mechanisms, impact factors and the influence of organic matter. Chem. Eng. J. 2021, 406, 126722. [Google Scholar] [CrossRef]
  22. Yin, J.; Deng, B. Polymer-matrix nanocomposite membranes for water treatment. J. Membr. Sci. 2015, 479, 256–275. [Google Scholar] [CrossRef]
  23. Yang, Z.; Sun, P.-F.; Li, X.; Gan, B.; Wang, L.; Song, X.; Park, H.-D.; Tang, C.Y. A Critical Review on Thin-Film Nanocomposite Membranes with Interlayered Structure: Mechanisms, Recent Developments, and Environmental Applications. Environ. Sci. Technol. 2020, 54, 15563–15583. [Google Scholar] [CrossRef]
  24. Yin, J.; Zhu, G.; Deng, B. Multi-walled carbon nanotubes (MWNTs)/polysulfone (PSU) mixed matrix hollow fiber membranes for enhanced water treatment. J. Membr. Sci. 2013, 437, 237–248. [Google Scholar] [CrossRef]
  25. APHA; AWWA; WPCF. Standard Methods for the Examination of Water and Wastewater, 21st ed.; American Public Health Association: Washington, DC, USA, 2005. [Google Scholar]
  26. Epperson, J.E. Missouri Wetlands: A Vanishing Resource; (No. 39); Citeseer: State College, PA, USA, 1992. [Google Scholar]
  27. Duan, S.; He, Y.; Kaushal, S.S.; Bianchi, T.S.; Ward, N.D.; Guo, L. Impact of Wetland Decline on Decreasing Dissolved Organic Carbon Concentrations along the Mississippi River Continuum. Front. Mar. Sci. 2017, 3, 280. [Google Scholar] [CrossRef]
  28. Guo, W.; Xu, J.; Wang, J.; Wen, Y.; Zhuo, J.; Yan, Y. Characterization of dissolved organic matter in urban sewage using excitation emission matrix fluorescence spectroscopy and parallel factor analysis. J. Environ. Sci. 2010, 22, 1728–1734. [Google Scholar] [CrossRef] [PubMed]
  29. Mayer, L.M.; Schick, L.L.; Loder, T.C., III. Dissolved protein fluorescence in two Maine estuaries. Mar. Chem. 1999, 64, 171–179. [Google Scholar] [CrossRef]
  30. Jönsson, C.; Jönsson, A.-S. Influence of the membrane material on the adsorptive fouling of ultrafiltration membranes. J. Membr. Sci. 1995, 108, 79–87. [Google Scholar] [CrossRef]
  31. Cornelissen, E.; Boomgaard, T.V.D.; Strathmann, H. Physicochemical aspects of polymer selection for ultrafiltration and microfiltration membranes. Colloids Surfaces A Physicochem. Eng. Asp. 1998, 138, 283–289. [Google Scholar] [CrossRef]
  32. Liu, F.; Xu, Y.-Y.; Zhu, B.-K.; Zhang, F.; Zhu, L.-P. Preparation of hydrophilic and fouling resistant poly(vinylidene fluoride) hollow fiber membranes. J. Membr. Sci. 2009, 345, 331–339. [Google Scholar] [CrossRef]
  33. Zhu, G.; Yin, J.; Zhang, P.; Wang, X.; Fan, G.; Hua, B.; Ren, B.; Zheng, H.; Deng, B. DOM removal by flocculation process: Fluorescence excitation–emission matrix spectroscopy (EEMs) characterization. Desalination 2014, 346, 38–45. [Google Scholar] [CrossRef]
Figure 1. Locations of water sampling.
Water 15 02054 g001
Figure 2. A schematic illustrating the DBPs formation and analysis protocols.
Water 15 02054 g002
Figure 3. EEM fluorescence spectra of water samples from different locations: (a) Missouri River, (b) Eagle Bluffs, and (c) Water Treatment Plant. Colored lines are used to aid visualization of fluorescence contours.
Water 15 02054 g003
Figure 4. Removal rates of UV254 and EEM intensity (EX = 320 nm, EM = 420 nm) by using membranes with various MWCO.
Water 15 02054 g004
Figure 5. EEMs of water samples (Eagle Bluffs) after filtration by membranes with various molecular weight cut-off (MWCO), showing an increasing degree of NOM removal with a decreasing MWCO. Colored lines are used to aid visualization of fluorescence contours.
Water 15 02054 g005
Figure 6. EEM spectra of water samples with dilution ratio of (a) 0.25, (b) 0.50, (c) 0.75, (d) 1.00. Colored lines are used to aid visualization of fluorescence contours. The fluorescence emission intensities at EX = 320 nm (e) and the relationship between the fluorescence intensity and dilution ratio (f) are also illustrated.
Water 15 02054 g006
Figure 7. Pure water fluxes of membranes.
Water 15 02054 g007
Figure 8. Fouling behaviors of membranes containing 18% PSU (a1,b1,c1) and membranes containing 20% PSU (a2,b2,c2) when applied for filtrating water sample from Eagle Bluffs (a), Missouri River (b), and Columbia Drinking Water Treatment Plant (c). The TMP is 10 psi.
Water 15 02054 g008
Figure 9. Removal rates of NOMs and THMFP by different types of membranes (18% or 20% PSU and with or without OMWNTs) for water samples from Eagle Bluffs (a), Missouri River (b), and Columbia Drinking Water Treatment Plant (c). The TMP is 10 psi.
Water 15 02054 g009
Table 1. Basic parameters of water samples.
SamplespHDOCUV254
AMissouri River7.567.44 mg/L0.104
BEagle Bluffs7.659.78 mg/L0.174
CWater Treatment Plant7.685.72 mg/L0.054
Disclaimer/Publisher’s Note: The statements, opinions and data contained in all publications are solely those of the individual author(s) and contributor(s) and not of MDPI and/or the editor(s). MDPI and/or the editor(s) disclaim responsibility for any injury to people or property resulting from any ideas, methods, instructions or products referred to in the content.

